eprint Nisho-2-2024
Axion Dark Matter and Plateau-Plateau Transition in Quantum Hall Effect
Abstract
Axion dark matter inevitably generates electromagnetic radiation in quantum Hall effect experiments that use strong magnetic fields. Although these emissions are very weak, we have shown using a QCD axion model that they influence the plateau-plateau transition at low temperatures (below mK) in a system with a large surface area (greater than ) of two-dimensional electrons. By analyzing previous experiments that show saturation of the transition width as temperature and microwave frequency change, we provide evidence for the presence of axions. Notably, in most experiments without axion effects, the saturation frequency is less than GHz at temperatures of mK or lower and for system sizes of or smaller. Additionally, the frequency decreases with decreasing temperature or increasing system size. However, there are experiments that show a saturation frequency GHz at a low temperature of 35 mK and with a large surface area of for the Hall bar. This identical frequency of approximately GHz has also been observed in different plateau transitions and in Hall bars of varying sizes, indicating the presence of axion microwaves. The saturation frequency of GHz implies an axion mass of eV. We also propose additional experiments that support the existence of axions. The appearance of the axion effect in the quantum Hall effect is attributed to significant absorption of axion energy, which is proportional to the square of the number of electrons involved.
I introduction
Axions are currently considered one of the most promising candidates for dark matter in the Universe, and their discovery could provide key insights into new physics beyond the Standard Model of particle physics. Although several axion models, including axion-like particles (ALPs), exist with masses spanning tens of orders of magnitude, this paper focuses specifically on the QCD axion. The QCD axion model not only addresses the strong CP problem in QCD, but it also remains the most realistic among the various axion models under consideration. As a pseudo-Goldstone boson arising from the Peccei-Quinn symmetry, the QCD axion naturally resolves the strong CP problem axion1 ; axion2 ; axion3 . The mass of the QCD axion is constrained within the range eV Wil ; Wil1 ; Wil2 , corresponding to electromagnetic radiation in the microwave band with frequencies from GHz, produced through axion-photon conversion.
Despite numerous experimental effortsadmx ; carrack ; haystac ; abracadabra ; organ ; madmax ; brass ; cast ; sumico ; iwazaki01 , many approaches either lack the sensitivity required for axion detection or are restricted to a narrow mass range, even when high sensitivity is achieved. Most experiments rely on a strong magnetic field to stimulate electromagnetic radiationsikivie from axions. Notably, strong magnetic fields are also employed in quantum Hall effect (QHE) experimentsvon ; girvin .
In previous researchiwa ; iwa2 , we proposed detecting axions through the integer quantum Hall effect. In QHE, two-dimensional electrons absorb microwaves emitted by axions. This absorption causes electrons in localized states to transition to extended states, thereby enhancing the Hall conductivity. As a result, the axion’s presence can be inferred from an increase in Hall conductivity.
By closely examining plateau-to-plateau transitions observed in past experiments, we can identify possible axion signatures in these transitions. In fact, our analysis suggests that existing experimental results may already indicate the presence of axion dark matter.
The quantum Hall effect (QHE) von ; girvin is observed in two-dimensional electron systems at low temperatures and under a strong magnetic field perpendicular to the two-dimensional surface. These systems are typically realized in semiconductor quantum wells, with the semiconductor sample known as a Hall bar.
In general, Hall conductivity varies with the magnetic field . However, when is measured in a system at low temperatures (K) and under a strong magnetic field (T), the Hall conductivity is quantized as , where is a positive integer. This quantization results in plateaus: regions of the magnetic field where remains constant despite changes in .
The formation of these plateaus relates to the Fermi energy. While varying typically changes the electric current by altering the number of electrons contributing to it, the current remains constant on these quantized plateaus. When is further decreased (or increased) beyond a critical value, begins to increase (or decrease), leading to a transition to the next plateau, (). This transition, called a plateau-to-plateau transition, occurs over a specific range of , known as the transition width .
In this paper, we aim to analyze these plateau transitions in detail, incorporating the potential effects of axions. Additionally, we use Hall resistance , which is equal to on the plateaus. On these plateaus, the diagonal resistances vanish (), while they do not vanish in the transition regions, where both and are nonzero.
The presence of the plateau can be understood by noting that, in general, two-dimensional electrons become localized due to a disorder potential , which represents the effects of impurities, defects, and similar factors (hereafter referred to as disorder potential). However, under a strong magnetic field, some electrons remain delocalized.
In the absence of the disorder potential, electrons in a strong magnetic field form Landau levels with energies given by , where represents the cyclotron energy and denotes the effective electron mass in the semiconductor. Each Landau level is highly degenerate, with the number of degenerate states per unit area equal to .
However, when a potential is introduced, this degeneracy is lifted. Most electrons become localized, while some remain delocalized with energies close to . Specifically, there exists an energy region around in which states are not localized; we refer to this region as the mobility gap. Understanding the presence of the mobility gap is crucial for analyzing the plateau-to-plateau transitions.
In this paper, we discuss the mechanisms underlying plateau-to-plateau transitions and present compelling evidence for the presence of the axion by analyzing these transitions in previous experiments.
As the magnetic field is varied, the Hall conductivity remains constant as long as the Fermi energy lies within localized states, which do not contribute to electric current. This constancy in conductivity produces a plateau. A transition occurs only when the Fermi energy enters the extended states within the mobility gap, as these extended states can carry current. The transition ends once the Fermi energy exits the mobility gap.
The size of the mobility gap depends on factors such as temperature, the frequency of any external microwaves, and the dimensions of the Hall bar. The width of the plateau transition is directly determined by the mobility gap. Therefore, to observe the axion effect in , it is essential to examine how these factors influence the mobility gap.
We examine in detail several experiments that demonstrate how the width behaves under different conditions: it decreases as the temperature (or the frequency of externally applied microwaves) decreases, or as the size of the Hall bar increases. Thus, depends on temperature, microwave frequency, and Hall bar size. We discuss these behaviors of by analyzing how the mobility gap varies with these factors.
Theoretically, the width is expected to vanish for an infinitely large Hall bar at zero temperature with no external radiation. However, in actual experiments using finite-sized samples, a non-vanishing width saturates at low temperatures or low frequencies, indicating a threshold below which does not decrease further even as temperature or frequency decreases. Most of this saturation is due to finite-size effects, while a portion may result from the axion effect.
The key point in our discussion is that, even with an infinitely large Hall bar, the width remains non-zero at zero temperature due to the presence of axion-generated microwaves, albeit weak. Therefore, by carefully examining the behavior of at low temperatures while varying the frequency of external microwaves and the size of the Hall bar, we can potentially detect a signature indicating the presence of the axion.
(It is well known sikivie ; iwazaki01 that under a magnetic field , axion dark matter generates an oscillating electric field . This field induces oscillating electric currents in nearby metals, producing axion microwaves. In quantum Hall effect experiments, metals exposed to the magnetic field are always present around the Hall bar and are not necessarily oriented perpendicular to . In this paper, we assume the presence of such axion-generated microwaves in quantum Hall effect experiments.)
In previous experiments engel ; exp5 ; hohls ; hohls2 ; balaban ; exp6 , the observed saturation frequency is generally below GHz at temperatures under mK, largely because the Hall bar sizes were not sufficient to observe the axion effect. However, in other experiments exp8 ; exp9 , a saturation frequency of approximately GHz was observed at a low temperature of mK with a Hall bar large enough to potentially detect axion effects. This result is unexpected, as saturation frequency typically decreases with lower temperatures and larger Hall bar sizes. We would thus anticipate a much lower saturation frequency, below GHz, yet the observed frequency remains high at around GHz.
We suggest that this anomalously high saturation frequency GHz is due to the axion, with being theoretically given by . The axion effect is thus expected to manifest as a high saturation frequency GHz at low temperature such as mK when the Hall bar size is large.
Further evidence supporting the presence of the axion is provided by the experiments exp8 ; exp9 , which demonstrate that GHz is independent of the Hall bar size and that an almost identical frequency is observed in a different plateau transition. This transition differs from the one associated with the plateau transition width that also saturates at GHz, as noted above.
Additionally, an experiment exp4 shows that the saturation temperature does not decrease as the size of the Hall bar increases. Generally, saturation temperature decreases with increasing Hall bar size due to finite-size effects. We propose that this size-independent saturation temperature suggests an axion effect, rather than a finite-size effect. Specifically, the saturation temperature is determined by the axion mass, making it independent of the Hall bar size or specific sample properties.
Interestingly, another experiment exp44 shows a similar axion effect, with the observed saturation temperature nearly identical to that in the previous experiment, despite using a different sample.
It is important to emphasize that the absorbed power of axion microwaves in the quantum Hall state is significantly enhanced. We have demonstrated iwa ; iwa2 that this power scales with the square of the number of electrons in the state, where the electron number density is typically on the order of . This is in contrast to resonant cavity experiments sikivie , where the absorbed power is only proportional to the number of electrons on the cavity surface.
This enhancement effect in the quantum Hall state makes the axion signal potentially observable at temperatures below mK when the Hall bar size exceeds . The experiments that show signs of the axion effect meet these conditions.
To confirm the presence of the axion effect (i.e., axion-induced microwaves), we suggest shielding the Hall bar from axion microwaves and observing whether the high saturation frequency (approximately GHz) disappears or decreases. In this paper, we propose an improved shielding method, which is more practical than the approach in our previous work.
We also outline additional confirmation methods. After detecting a saturation frequency of approximately GHz at low temperatures, we can examine whether this frequency changes with temperature or Hall bar size. Furthermore, it would be informative to test whether the same saturation frequency GHz appears across different Hall bar samples.
In this paper, we use physical units, , and . Our idea is also applicable to dark photon with frequencies of microwaves discussed below.
II localized states and extended states
We explain the integer quantum Hall effect as follows. Using semiconductors like GaAs or Si, a two-dimensional electron gas is formed, where electrons are confined in a quantum well that is broad in the horizontal direction (tens of micrometers or more) but narrow in the vertical direction (less than ten nanometers). As a result, electrons can move freely in the horizontal direction but are restricted in the vertical direction at low temperatures, where the energy spacing in this direction greatly exceeds both thermal energy (on the order of several tens of Kelvin) and any externally applied microwave energy.
When a perpendicular magnetic field is applied to the plane of the two-dimensional electron gas, electrons form quantized Landau levels. These levels are labeled by an integer , with energies given by , where the cyclotron energy , and is the effective electron mass (e.g., in GaAs, where is the actual electron mass). The cyclotron energy is on the order of eV, and each Landau level has a degeneracy of states per unit area.
When including the Zeeman energy, each Landau level splits into two states with energies , where and the Bohr magneton . The Zeeman energy, of the order of eV, is smaller than the cyclotron energy . Thus, each spin-split Landau level retains the same degeneracy of .
In general, impurities and defects are present on the two-dimensional surface of the Hall bar, creating a disorder potential that affects the electrons. This potential is assumed to be much smaller than the cyclotron energy , partially lifting the degeneracy of Landau levels. It is well known that most electrons become localized in these disordered regions and are unable to carry electric current. Only the states with energy remain extended in an infinitely large Hall bar, allowing electrons in these states to conduct current.
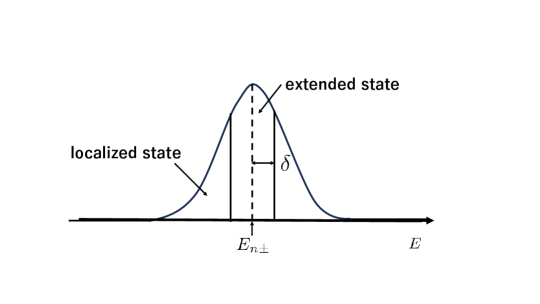
The coherence length , representing the spatial extent of a localized state with energy , scales as with as aoki1 ; aoki2 . In a finite Hall bar, there exists an energy range within which the size of the state exceeds the Hall bar dimensions, implying the presence of effectively extended states that can carry current. This energy range , known as the mobility gap, is shown in Fig. (1). It vanishes in the limit of an infinitely large Hall bar, i.e., as . When states within this gap are occupied, they contribute to electric current; otherwise, they do not. The mobility gap is crucial in plateau-to-plateau transitions.
Since the disorder potential is much weaker than the cyclotron and Zeeman energies, there is no mixing between Landau levels. Fig. 1 depicts a typical density of states, assuming that contains roughly equal regions of positive and negative local potential energies.
It is worth noting that the width of the density of states is determined by the strength of the disorder potential . For example, if we assume a density of states within the range , the width is set by , with a weaker leading to a narrower . As shown in previous work iwa ; iwa2 , axion-generated microwaves are absorbed more effectively in Hall bar samples with a weaker potential . Thus, the axion effect may be more pronounced in samples with a smaller .
The range of the disorder potential plays a crucial role in determining its strength. Generally, samples with a significant short-range potential exhibit a large , while those dominated by a long-range potential tend to have a smaller . Consequently, the axion effect is more likely to be observable in samples primarily influenced by long-range disorder potential.
Short-range disorder potential causes large-angle scattering of electrons, resulting in a shorter electron relaxation time, which in turn leads to a larger .
As long as the Fermi energy remains below , the Hall conductivity takes the quantized value . As exceeds , gradually increases toward . Eventually, once surpasses , the Hall conductivity reaches and stabilizes at this value, marking the beginning of the next plateau.
This change in conductivity is the plateau-to-plateau transition. Electrons in localized states with energies do not contribute to electric current, so the Hall conductivity remains unchanged. However, as extended states with energies within the range become occupied, current flows, leading to an increase in . Once exceeds , electrons begin occupying localized states again, causing the Hall conductivity to stabilize.
Additionally, it is important to note that the Fermi energy shifts with the magnetic field . As increases, the degeneracy of each Landau level also increases, causing a decrease in , since the electron density remains constant while the degeneracy changes. When transitions from to , the plateau-to-plateau transition completes.
We define the width of the magnetic field as the range corresponding to the Fermi energy width , spanning from to .
III electron distribution
At zero temperature, the electron distribution has a sharp boundary: all states with energies below the Fermi energy are occupied, while all higher-energy states are empty. At finite temperatures (), however, this distribution becomes smeared around the chemical potential . (At low temperatures, typically below 1 K, the chemical potential closely approximates the Fermi energy, so we refer to it as the Fermi energy even for .)
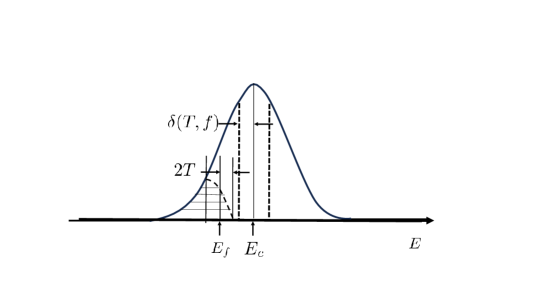
While the electron distribution does not have a sharp boundary at finite temperatures, it can be approximated as having one, where states with energies above are effectively empty. In other words, the distribution is spread over a range of approximately around the Fermi energy (see Fig. 2). With this simplified view, the plateau-to-plateau transition at becomes easier to understand.
When the Fermi energy is below , the Hall conductivity remains on a plateau. As rises and crosses , the transition begins, causing an increase in Hall conductivity. When reaches , the conductivity stabilizes at the next plateau, completing the transition. Therefore, at finite temperatures, the Fermi energy range associated with this transition is given by .
Experimentally, we have observed that the transition width also depends on the frequency of external microwaves, showing a similar pattern to its temperature dependence: exp10 and deltaB , with as long as or remains above a critical value. Below this critical threshold, the width saturates. In this context, frequency is analogous to temperature .
This similarity can be explained as follows. Electrons with energy that absorb microwave radiation of frequency transition to states at energy , and subsequently lose energy through collisions with phonons. Thus, the external microwave causes the electron distribution to spread in a manner similar to that induced by temperature, where . Although the smearing due to microwaves differs from that due to thermal effects, it is reasonable to approximate the electron distribution as having a sharp boundary at at , where states with energy greater than are empty.
This form of the distribution does not necessarily match the thermal distribution at , but we assume the presence of a sharp cutoff at . Thus, at but in the presence of an external microwave of frequency , the plateau transition width can be approximated as . It is important to note that the frequency associated with the distribution cutoff is not necessarily the actual microwave frequency, although it is close to this value.
We note that the microwave power used in experiments must be kept sufficiently low to avoid changing the sample temperature. In practice, microwaves with such low power are employed to ensure that the width or can saturate. Generally, this width depends on the microwave power, decreasing with reduced power until it reaches saturation below a specific threshold value exp9 . Consequently, when two microwaves of different frequencies but both with low power are present, the higher-frequency microwave dominates in determining the cutoff for the electron distribution.
At finite temperature with an imposed microwave of frequency , a question arises: which temperature or microwave plays a dominant role in defining the electron distribution? Both can smear out the distribution, but this effect differs. At zero frequency (), the distribution extends sharply to , while at zero temperature (), it extends to . Generally, when , temperature is dominant, whereas the microwave dominates when . For cases with , temperature clearly dominates; similarly, the microwave dominates when . However, when , determining the dominant effect is more ambiguous, as we lack precise knowledge about the extent to which microwaves smear out the electron distribution. In such cases, when observing transitions, we typically assume they occur at . However, it’s important to note that this equality is not exact.
For example, in experiments where the width or decreases with frequency at fixed but saturates below a certain frequency , we conclude that temperature is dominant for , while microwaves dominate when . Here, serves as an approximate threshold rather than an exact frequency.
In the discussion below, we explore which of two microwaves with different frequencies, and , takes precedence when both are present. In this case, when , the microwave with frequency is dominant, while for , is dominant. The transition between dominance by and occurs precisely at , as both microwaves affect the electron distribution in a comparable manner. This differs from the previously mentioned ambiguity regarding the dominance between microwave and temperature effects.
IV mobility gap
The mobility gap represents the energy range over which states are effectively extended, with energy satisfying , where . States within this gap contribute to electric conduction, causing the Hall conductivity to increase as the occupation number in these states grows. The mobility gap also depends on the spatial extent of the two-dimensional electron system, specifically the Hall bar size . As discussed earlier, the coherence length , or the spatial extent of a state with energy , behaves as with as . At zero temperature (), the mobility gap is defined such that states with energies satisfying extend beyond the size , enabling them to carry electric current. Importantly, this gap vanishes as .
The mobility gap is influenced by the disorder potential. When the disorder potential is stronger, a greater proportion of electrons become localized, resulting in a shorter localization length. Consequently, the mobility gap generally decreases as the disorder potential strengthens. Simultaneously, the density of states broadens with a stronger disorder potential. For example, if , the width increases with disorder strength. A useful measure of disorder strength is the mobility , commonly used in semiconductor physics, and defined by , where is the electrical conductivity and is the electron density. High mobility implies a weaker disorder potential, which corresponds to a larger and a smaller , while low mobility indicates a stronger potential, yielding a smaller and a larger . (Note that always holds.)
Now let us consider the thermal effect on the mobility gap. The phase coherence length represents the spatial region over which quantum coherence is maintained. At , this length is infinite, but it decreases with increasing temperature due to thermal fluctuations. As long as the phase coherence length exceeds the size of the Hall bar, electric current flows in a manner similar to that in metals, with electrons in extended states contributing to current according to the standard conduction mechanism. However, when the phase coherence length becomes shorter than , current is instead carried through thermally assisted hopping conduction. In this mechanism, a localized electron with energy can thermally hop to a neighboring localized state with energy within an energy range . As a result, the effective mobility gap increases with temperature, especially beyond a critical temperature , where the phase coherence length equals the Hall bar size . For , we have .
Thus, the mobility gap depends on both temperature and the Hall bar size . Since vanishes as , the critical temperature also vanishes in this limit.
That is, we have
| (1) |
Similarly, the mobility gap depends on the microwave frequency . Beyond a critical frequency , the gap increases with frequency for . Conversely, for frequencies , we have . This critical frequency is dependent on the system size and approaches zero as . Thus, we have
| (2) |
In general, mobility gap depends on both temperature and frequency of microwave. It is reasonable to suppose that
| (3) | |||||
| (4) |
V plateau-plateau transition
Using these results, we discuss how plateau-plateau transitions occur under finite temperature and external microwaves. We examine the transition width , determined by the width of the Fermi energy over which the transition happens.
The key question is how the width is influenced by temperature and microwave effects. This width is defined as the energy difference between points and , where the transition begins at and ends at , passing through the center energy as the magnetic field decreases. From Fig. (2), we find and , leading to . This corresponds to the case where temperature primarily determines the electron distribution cutoff. Conversely, in the case where the microwave dominates, we have , where is the external microwave frequency.
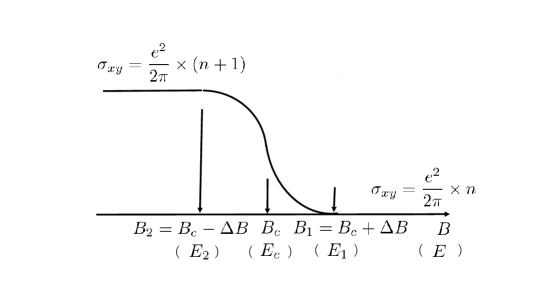
As the magnetic field decreases, the Fermi energy increases. The transition initiates at and concludes at , with the transition width defined as (see Fig. (3)). The observed is thus set by or . Here, the first term represents the mobility gap, while the second term reflects the energy cutoff in the electron distribution: for temperature dominance, and for microwave dominance. When , the microwave cutoff energy is dominant; when , the temperature cutoff energy prevails. In the case where , the dominant factor shifts between temperature and microwave effects. It should be noted that the condition serves as an approximate threshold for the transition, which can occur, for example, at frequencies close to .
In some cases, the transition is characterized by the derivative . As the transition progresses from to , we can approximate with . Therefore, the behavior of as a function of temperature or frequency reflects the behavior of .
It is worth mentioning that even without an externally applied microwave, a microwave component due to axion dark matter may be present in experiments. This microwave frequency is given by the axion mass, . The axion-generated microwave is very weak, but as shown in previous studies (and also in the following section), the axion effect can become evident at low temperatures, mK, and for large Hall bars with surface area . Low temperatures help the axion effect dominate over thermal background radiation, while a large surface area enables sufficient absorption of radiation energy from the axion by two-dimensional electrons.
Thus, at higher temperatures ( mK) or for smaller Hall bars, the axion-generated microwave plays no significant role in the plateau-plateau transition. At sufficiently low temperatures, e.g., mK, applying a weak microwave can reveal a critical frequency , below which the transition width saturates with respect to . This critical frequency differentiates between dominance by the external microwave and the axion-induced microwave. When , the external microwave dominates the electron distribution; when , the axion microwave prevails. The critical frequency is given directly by the axion mass: .
VI axion contribution
Here, we present the absorption power of the axion microwave signal and the signal-to-noise (SN) ratio, where the noise originates from black-body radiation. We focus on how this ratio depends on temperature, the size of the Hall bar, and the density-of-states extension .
We assume an axion dark matter density of approximately and use the QCD axion parameter , defined as , where the fine-structure constant and the axion decay constant satisfies . The constant takes values for the DFSZ axion model and for the KSVZ axion model.
Our previous estimates of the absorption power iwa ; iwa2 represent the energy absorbed per unit time by electrons in localized states transitioning to extended states. At , the absorption power , under the condition , is given by
| (5) |
when ; otherwise, it includes an additional factor of .
Here, we assume the density of states to be , where . In practice, this density is approximately constant, , within the energy range , given our choice of . We set the Fermi energy to , so that electrons in localized states with energies above can transition to extended states.
Here, the overlap parameter represents the spatial overlap between a localized state and an extended state to which an electron in transitions upon absorbing the axion microwave. This overlap is given by , where is the magnetic length, with . The validity of choosing has been discussed in previous work, and even if is as small as , the power remains effectively unchanged with the choice of a large Hall bar area of . (In Section VIII, we will discuss an experiment involving a Hall bar sample with a sizable area of , which is expected to reveal the axion effect in the plateau transition at temperatures near .)
It is notable that this power is substantially higher than that generated in cavity experiments admx . In the quantum Hall effect, the power is proportional to the square of the number of electrons in the Hall bar, whereas in cavity experiments, it scales with the number of electrons on the cavity surface. This difference enables the observation of the axion effect in the integer quantum Hall effect.
Using the formula for , we can determine the signal-to-noise (SN) ratio,
| (6) | |||
| (7) |
when ; otherwise, it includes an additional factor of . Here mK (eV) and eV (mK) and we assume each Hall conductance measurement at a given magnetic field takes one second. The power from thermal noise is given by , with the Fermi energy set as .
This formula indicates that when the density of states’ width is large, the axion contribution diminishes. Consequently, in Hall bar samples where the short-range disorder potential significantly increases , the axion effect is minimal. Conversely, when long-range disorder potential dominates in the sample, resulting in a smaller , the axion effect is more likely to appear.
The parameters chosen in this formula reflect experimental conditions, as discussed below, where the axion effect is observed in a sample of size at a temperature of . In this experimental setup, the axion mass is determined to be . However, experiments using smaller samples () at temperatures show no observable axion effect.
Regarding the signal-to-noise (SN) ratio, using experimental parameters and produces a sufficiently high SN ratio for the axion effect to be observable, even with . While the parameter is somewhat uncertain, earlier work has argued as a reasonable value iwa2 . Notably, even with a smaller value, such as , the axion effect should still be observable if a larger sample of and a lower temperature are used. Thus, the axion effect can be, in principle, observed in the plateau-plateau transition with an adequately large Hall bar sample and sufficiently low temperatures.
VII examination of dependence of on temperature
VII.1 Experiments with no axion effect
Using the above results, we now examine several previous experiments, focusing on the temperature dependence of . Specifically, we analyze how varies with temperature .
First, we consider an experiment exp1 involving a small Hall bar with dimensions and mobility . As shown in Fig. (4), for several plateau-plateau transitions saturates at a critical temperature . Here, the filling factor shown as e.g. in the figure represents the ratio of the electron number density to the Landau level degeneracy : .
Although the width in the figure differs slightly from our definition, it is essentially equivalent to the width we define. The observed saturation of with temperature is due to the saturation of the width .
According to our analysis, saturation with temperature would not normally occur, as the width does not saturate at any temperature in the absence of an axion effect. However, the figure shows that saturates at a temperature K, particularly for the transitions , , and . This observed saturation can be explained under the condition .
| (8) |
We thus find that the width saturates at the temperature K because the mobility gap reaches a constant value at the critical temperature . This in turn leads to the saturation of the width . The critical temperature is defined such that . Without the assumption , the width would not saturate. Given the very small size of the Hall bar, it is plausible that the mobility gap is large enough for this assumption, , to hold, especially around K. In any case, the observed saturation of with temperature supports the validity of this assumption.
We also observe that the saturated value of decreases as the filling factor increases in the transition (). This suggests that the mobility gap decreases with increasing . Since the wave functions in higher Landau levels extend further than those in lower levels, they are more influenced by the disorder potential, resulting in a reduction in the spatial extent of their energy eigenstates. In other words, the localization length of wave functions in higher Landau levels is shorter than in lower levels. It leads to a smaller mobility gap in the density of states in higher Landau levels. This is a general feature of mobility gap .
We proceed to examine an experiment presented in Fig.(5) from exp2 , which used Hall bars larger than the previous case, with widths and , with a width to length ratio of 1:3. For example, the surface area of a sample is about , and the mobility is . The sample consists of with . The data reveal that saturates at temperatures below approximately mK and decreases with increasing width . Notably, for the largest sample (), does not saturate even at the lowest experimental temperature of mK. The saturation temperature mK also decreases as the sample size exceeds .
The sample sizes in this experiment are still too small for any axion contribution to appear. Thus, the saturation observed here suggests that the condition remains valid, leading to saturating at the critical temperature associated with the mobility gap, which is approximately mK for , mK for , and mK for .
In the largest sample (), it is likely that is small enough that the assumption does not hold.
Although at low temperatures ( mK), we observe that at higher temperatures ( mK), as all curves converge at mK. This convergence suggests that increases rapidly as decreases.
Furthermore, it is evident that the mobility gap decreases with increasing width . This trend aligns with the general properties of the mobility gap, as discussed in the previous section.
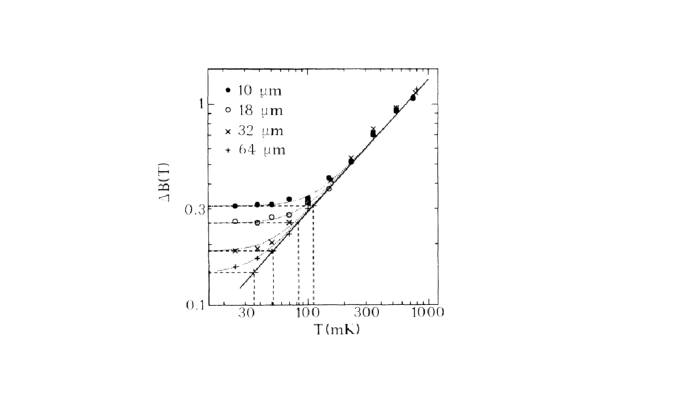
As the width of the Hall bar increases, the critical temperature decreases, since a lower temperature is sufficient for the phase coherence length to match the larger size of the Hall bar. In fact, it has been shown experimentally exp3 that for Hall bars with widths ranging from to and a width to length ratio of . This relationship seems to approximately hold in the experiment shown in Fig. (5).
It is worth noting that the observed relationship applies specifically to samples with short-range disorder potentials; for example, the sample is composed of with , similar to the sample used in Fig. (5). The sample’s high mobility, , results in a relatively large mobility gap , so that . The dependence of on is thus influenced by the nature of the disorder potential. Although the exact formula may not hold universally for all disorder potentials, the trend as generally persists.
It may appear that the axion effect could manifest in this experiment, given the sample’s large size (e.g., ). However, the applied magnetic field is relatively weak at , so the axion effect remains negligible in this context.
VII.2 Experiments with axion effect
Up to now, the axion contribution has been negligibly small, meaning the width is given by . As we have shown, the critical temperature matches the saturation temperature , where (or ) stabilizes, as for . Thus, the saturation temperature depends on the Hall bar’s size, a phenomenon referred to as the finite-size effect in prior research. This is the case when the axion contribution remains negligible.
On the other hand, when the axion contribution is significant, is not given by . Instead, for , while for . This axion contribution becomes comparable to the thermal component at very low temperatures and in large Hall bar sizes. In this regime, the saturation temperature is not necessarily dependent on the Hall bar’s size.
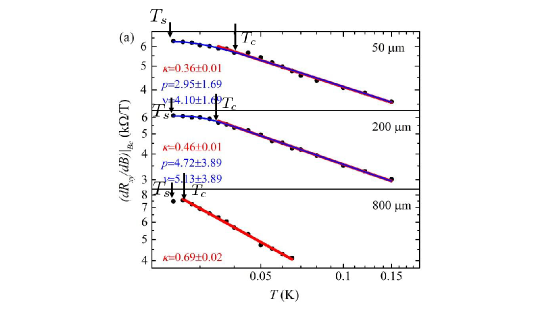
An intriguing experiment exp4 , shown in Fig. (6), reveals that the saturation temperature mK remains constant even as the Hall bar’s size changes substantially. In this experiment, the width varies from to with a width to length ratio of , leading to a surface area of, for example, . The sample’s high mobility, , and composition ( with no short-range disorder potential) imply a relatively narrow extension in the density of states compared to samples with short-range disorder. The sample size is large enough to allow the axion contribution to emerge, strongly suggesting its presence. (As discussed, the temperature dependence of effectively reflects the temperature dependence of the width .)
This behavior can be understood as follows: when , . As decreases, it eventually reaches the critical temperature , where . However, even at this point, continues to decrease with falling . Finally, when reaches , the width saturates, as electron distribution becomes dominantly influenced by microwave frequency associated with the axion. Consequently, the saturation temperature becomes independent of the Hall bar’s size, aligning well with experimental results in Fig. (6).
The experimental authors attribute this size independence to “intrinsic decoherence,” though its source is not clear. In contrast, we suggest that this decoherence is induced by axion dark matter, an extrinsic rather than intrinsic effect.
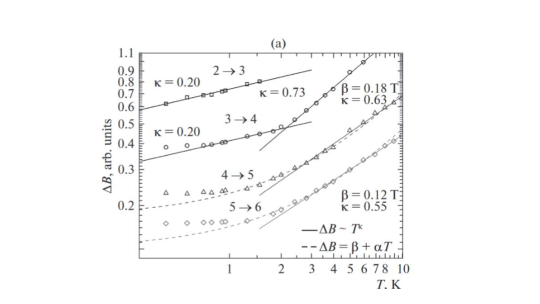
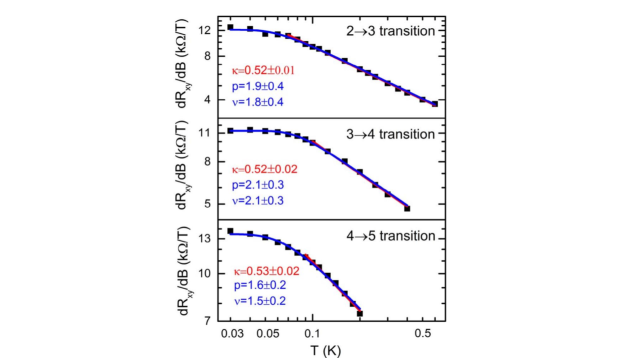
Additionally, an experiment exp44 using a large sample with dimensions has shown that the saturated values of are nearly independent across different plateau transitions (, , and ), as illustrated in Fig. (7). This observation suggests that the mobility gap remains constant across these transitions. Furthermore, the saturation temperatures for each transition are approximately mK.
Notably, this saturation temperature mK is very close to the mK observed in another experiment exp4 . Such a nearly identical saturation temperature across different samples strongly points to as a unique characteristic of the axion effect.
In Fig. (6), we illustrate the presence of critical temperatures , where the curves begin to show slight bending. The values of were selected visually and are indicated by arrows. The critical temperature decreases with increasing Hall bar size, as shown, but does not follow the relation. Instead, the dependence of on size is weaker here compared to the expected behavior. This discrepancy likely arises from differences in semiconductor composition between the samples. The first sample, which follows the relation, is based on with , whereas the second sample is a heterostructure. The high aluminum content () in the first sample introduces short-range disorder potential alongside the existing long-range potential . By contrast, in the sample, without such contamination (), only the long-range potential is present. The additional short-range potential in the contaminated sample likely results in the observed difference in dependence on . Generally, short-range disorder potential has a stronger effect than long-range potential, leading to a larger density-of-states extension in the presence of compared to , where only is present (). According to Eq. (VI), this can make the axion effect more readily detectable in samples with only long-range potential, even for smaller sample sizes.
We also observe that the values of (about ) in Fig. (6) are nearly independent of Hall bar size. Since , this suggests that the width is almost size-independent, implying that also remains constant with size. Typically, mobility gap would decrease with increasing sample size, yet here we note that the gap depends on the frequency of an external microwave, as explained earlier. In this case, the frequency of the microwave generated by the axion could affect the mobility gap, described by . In principle, the mobility gap induced by the axion microwave does not vanish, even as the sample size approaches infinity: . Thus, the weak dependence of on sample size could be attributed to the axion microwave.
Similarly, the plateau-independence of the saturated values shown in Fig. (7) suggests that the mobility gap is also unaffected by plateau transitions for . This behavior contrasts with the experimental results shown in Fig. (4), where the saturated decreases as the filling factor increases for transitions (). These phenomena may be driven by the axion effect: due to the influence of the axion microwave, the mobility gap does not decrease with higher Landau levels, unlike what would occur without the axion influence.
Thus, the experiments indicate that the axion effect appears because the saturation temperature is independent of the Hall bar size and sample composition. This strongly supports the existence of the axion. Additionally, the consistent values of (or equivalently, ) across varying Hall bar sizes and plateau transitions may also be a signature of the axion’s presence.
We would like to clarify a point. As previously mentioned, the microwave frequency does not correspond to an actual frequency in the electron distribution. It is the cut-off frequency assumed tentatively in the distribution. This frequency appears in the expression . Therefore, even if we observe the relation , this does not necessarily imply an axion mass of .
VIII examination of dependence of on frequency
Now, let us consider prior experiments involving the application of externally imposed microwaves. In these experiments, the width corresponds to the width of the peak in the longitudinal electric conductance, . Although the DC conductance vanishes within plateaus, it rises to a non-zero value during plateau-plateau transitions, forming a peak. This peak width is analogous to the defined earlier in this paper. By measuring the absorption power in two-dimensional electron systems, the real part of the electric conductivity, , can be obtained under microwave irradiation exp9 ; exp10 . In the measurements discussed below, denotes the peak width of . Since we are concerned only with the variation in width relative to microwave frequency, the precise definition of width is not critical in this context.
VIII.1 Experiments with no axion effect
First, we examine the experiment exp5 conducted with a relatively small sample of size . Given the small size of the sample, we expect the axion contribution to be negligible at higher temperatures, such as . The behavior of the width as a function of microwave frequency is shown in Fig. (8).
The mobility of the sample is relatively low, with . The sample, composed of , is smaller in size compared to others discussed later. The width follows the relation for higher frequencies (). As the frequency decreases, the mobility gap first saturates at , where for . Therefore, the width is given by . As the frequency decreases further, continues to decrease until it saturates at the frequency , where the width becomes . This represents a transition from frequency dominance to temperature dominance in the electron distribution at .
This interpretation aligns with the experimental observations, such as and , which suggests that . In this context, we assume a large critical frequency due to the small size of the Hall bar, which leads to a large mobility gap and a corresponding high critical frequency . For very large Hall bars, however, the critical frequency would satisfy , as discussed later. This framework allows us to understand the experiment conducted at temperatures , where the axion effect can be neglected.
It is important to note that in Fig. (8), the curves converge at a frequency of approximately 8 GHz. This indicates that for frequencies and temperatures , the condition holds. However, as the frequency decreases below 8 GHz, rapidly increases and becomes of the order of .
Next, we analyze the experiment exp6 conducted at temperatures below 50 mK, shown in Fig. (9). The sample, also made of , has a mobility of . The Hall bar in this experiment follows a Corbino geometry, where two-dimensional electrons are confined between an outer circle with a radius of 820 µm and an inner circle with a radius of 800 µm, giving a surface area of approximately .
At such low temperatures, the axion effect could potentially appear, but it seems not to manifest in this case. The surface area of the Hall bar is still not large enough for the axion-induced radiation to absorb a significant amount of energy. In the figure, the width of the filling factor is plotted. The behavior of as a function of frequency is identical to the behavior of with respect to .
The saturation frequency at is found to be . This result is consistent with expectations from earlier experiments, where the saturation frequency decreases as the temperature is lowered. However, given that a different Hall bar geometry is used here, a direct comparison requires careful consideration. To further illustrate this, we present an additional experiment hohls2 that uses the same geometrical configuration (Corbino geometry) and a sample of identical size, but at a higher temperature of 300 mK.
In Fig. (10), we present the results from the experiment at hohls2 . The curve () labeled ”coaxial” corresponds to the transition and matches the result shown in Fig. (9). We observe that the saturation frequency at is , which can be compared with the saturation frequency at , .
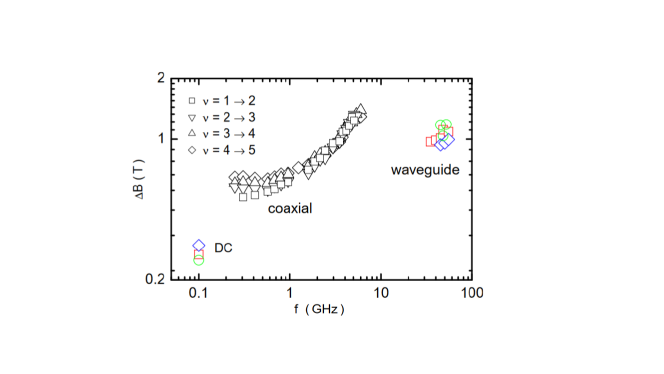
The results indicate that while the saturation frequency decreases with temperature , the relationship does not hold. This sample, being significantly larger than the one used in the experiment shown in Fig. (8), has a smaller critical frequency . It is likely that . Therefore, the behavior of the width follows the pattern: when the frequency is large (), . As the frequency decreases, it first reaches (assuming ). At this point, frequency dominance is replaced by temperature dominance, and the width becomes . Further decreases in frequency cause the width to decrease, but when , the width saturates at . Thus, the saturation frequency is , which is not necessarily proportional to temperature. This interpretation aligns with and is consistent with the previous experimental results, where the axion contribution remains negligible.
It is worth noting that even for small samples, such as , or at relatively high temperatures like , the saturation frequency is still below 1 GHz. In general, the saturation frequency tends to decrease as the sample size increases (or temperature decreases), a behavior observed in the absence of an axion effect. Consequently, we expect that in experiments involving larger samples and lower temperatures than those presented here, the saturation frequency would be much lower than 1 GHz if the axion effect is negligible. As shown in Fig. (14), for an example where the sample size is large () and the temperature is low (), but the low mobility , the saturation frequency is also less than 1 GHz. The authors in reference hohls2 report that saturation frequencies are below 1 GHz at around 100 mK in various experiments conducted up to the time of the paper’s publication.
VIII.2 Experiments with axion effect
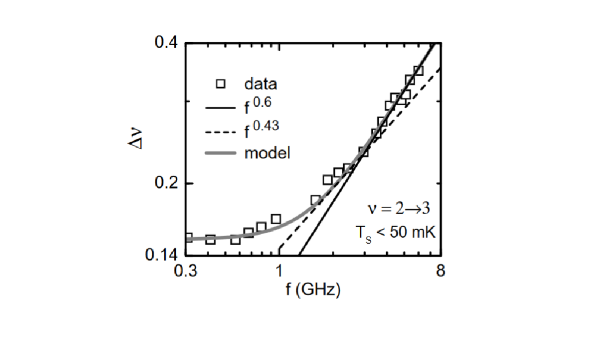
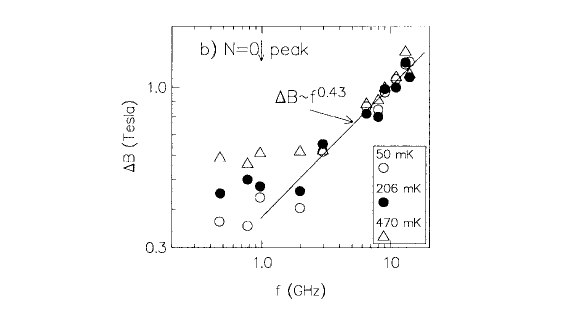
Up to this point, we have examined relatively small Hall bars that do not absorb a sufficiently large amount of microwave radiation generated by the axion to produce an observable effect. We now turn our attention to an experiment conducted using a larger Hall bar with dimensions , corresponding to a surface area of . The sample is composed of , with a mobility of . External microwaves are applied via a coplanar waveguide structure. The results of the experiment at a low temperature of are shown in Fig. (11). Unlike the previous results, the saturation frequency is much higher, with . It is noteworthy that this experiment achieves significantly higher frequency resolution than those conducted previously.
Based on the previous analysis, we would have expected the saturation frequency to be much lower than 1 GHz, given that the temperature is lower and the sample size is larger than in the earlier experiments. The larger size leads to a lower critical frequency compared to the smaller samples. However, the result here is quite unexpected.
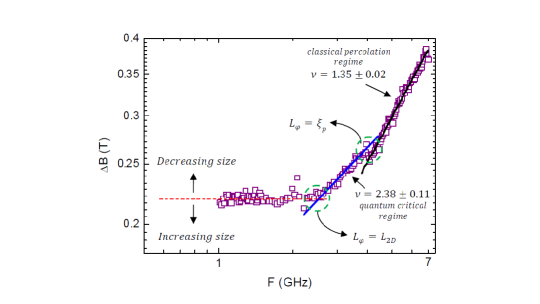
The observed result can only be understood by considering the axion contribution. In this case, the axion effect becomes observable in the large sample at a low temperature of . The axion dark matter generates microwaves with a frequency of , which is always present, even when external microwaves with various frequencies are applied.
At large frequencies, , the width is given by . As the frequency decreases, the width also decreases. However, when the frequency reaches , the dominance shifts from the external microwave to the axion-generated microwave. This means that for , the electron distribution is primarily influenced by the microwave generated by the axion, while for , it is determined by the external microwave.
The axion dominance also implies that the mobility gap is determined by the axion-generated microwave, i.e., . In other words, electrons in localized states can transition to extended states by absorbing the higher energy associated with the axion, but they cannot hop to extended states by absorbing an energy unless exceeds . Therefore, when .
Hence, the width is given by , when the frequency is below the saturation frequency , which is determined by the axion mass . The experimental results suggest the presence of an axion with a mass , as indicated by the saturation frequency of approximately .
Furthermore, it is clear that the saturation frequency does not depend on the size of the Hall bar. The experiment shown in Fig. (12) demonstrates that a similar saturation frequency of is observed in a smaller sample measuring , with a surface area of . The material () and experimental setup are identical to those used in the larger sample, although the frequency resolution is slightly lower. This independence of the saturation frequency from the size of the Hall bar is a crucial feature of the axion effect. (A similar discussion regarding the independence of saturation temperature on the size of the Hall bar when the axion effect is present can be found in Fig. (6).)
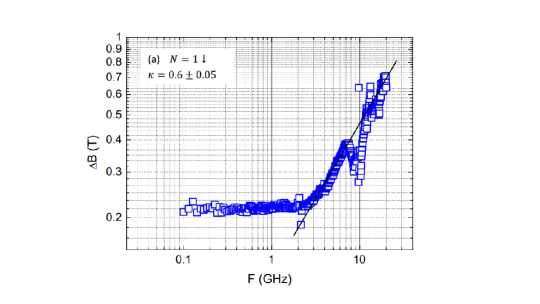
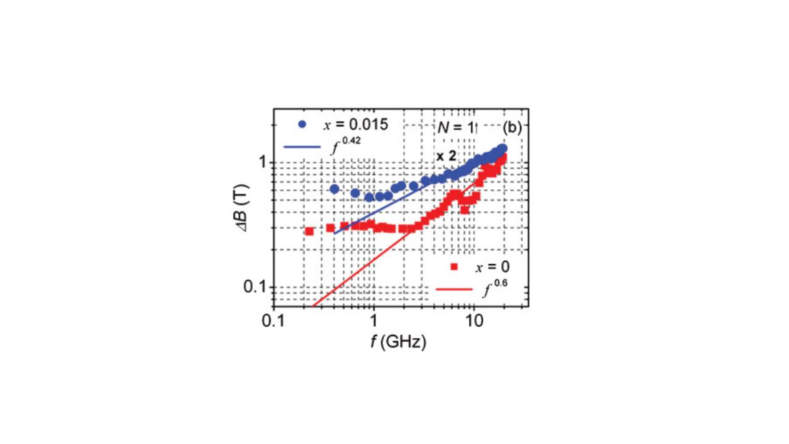
We present additional evidence supporting the presence of the axion. The experiment shown in Fig. (13) reveals that the saturation frequency is identical across different plateau-to-plateau transitions, as indicated by the transitions labeled in Fig. (11) and Fig. (12), and in Fig. (13). This holds true despite the lower frequency resolution in these measurements.
In the absence of the axion effect, different plateau-to-plateau transitions would result in distinct saturation frequencies, as demonstrated in Fig. (10). This occurs because the mobility gap varies with each plateau-to-plateau transition. The saturation of the mobility gap at leads to the saturation of , with because of . However, when the axion effect is present, we observe a uniform saturation frequency, , regardless of the plateau-to-plateau transition or the size of the Hall bar.
We have discussed how the saturation frequency remains independent of the size of the Hall bar and the specific plateau-to-plateau transition as long as the axion effect is significant. As we gradually increase the temperature in the above experiment, making the axion effect less pronounced, the saturation frequency begins to depend on temperature and decreases to a value below 1 GHz, as expected in the absence of the axion effect. However, beyond a certain point, further increases in temperature lead to a rise in the saturation frequency, as shown in Fig. (8). This indicates that the reduction of the axion effect results in a decrease in the saturation frequency from 2.4 GHz.
A similar effect occurs when we increase the impurity concentration of aluminum () in the sample . The sample in Fig. (11) has , and as increases, the axion effect gradually diminishes. This results in a gradual decrease in the saturation frequency from 2.4 GHz. However, once surpasses a critical value, the saturation frequency stops decreasing and starts to increase.
In fact, as seen in Fig. (13), a slightly lower saturation frequency of GHz was obtained using a sample of with small contamination () and a large size (). This sample includes both short-range disorder potential and long-range disorder potential , whereas the sample only includes . The small contamination of leads to a larger mobility gap , which reduces the axion effect and the signal-to-noise ratio, as described in equation (VI). The result is consistent with our expectations: the small contamination of causes the saturation frequency to decrease from GHz to GHz.
In contrast, the previous experiment shown in Fig. (5) used a sample with high aluminum contamination (), where the axion effect is negligible. As anticipated, the experiment demonstrates a formula for the saturation frequency , where the saturation frequency depends on the size of the Hall bar. This behavior further confirms the absence of the axion effect in this sample.
Although we previously mentioned that the frequency in the formula is not the real frequency, the saturation frequency represents the actual frequency of the axion microwave. This is because we are comparing the measured microwave frequency with the frequency of the axion microwave. Since both are microwaves, they smooth out the electron distribution in the same manner. Therefore, the relation directly corresponds to the real axion mass.
The experiments with large Hall bars, as mentioned above, use a coplanar waveguide to impose microwaves. This setup differs from those using smaller Hall bars. Hence, a straightforward comparison of the results should be made with caution. In the following, we present another experimentexp10 that also utilizes a coplanar waveguide.
The results are shown in Fig. (14) for a large Hall bar with dimensions , and temperatures of , , and , although the frequency resolution is quite low. The sample is composed of with a much larger Al concentration than . The mobility is relatively low, with .
The saturation frequencies observed are approximately, , and
These results are consistent with those where no axion effect is observed. Despite the low temperature () and large sample size, the axion effect does not appear, likely due to the large induced by the higher Al contamination or the reduced mobility. This contrasts with the experiment shown in Fig. (11), where the sample with no Al contamination () and larger mobility () shows observable axion effects.
The results also show that the width remains independent of temperature for , implying that for . However, for frequencies below , the mobility gap becomes comparable to the frequency . (In the smaller Hall bar experiment shown in Fig. (8), the width at different temperatures coincides for frequencies greater than 8 GHz, which is attributed to the larger mobility gap in the smaller Hall bar.)
We have explored the dependence of saturation frequency on temperature, sample size, and material. When the sample does not experience the axion effect, the saturation frequency generally decreases with decreasing temperature or increasing Hall bar size. For instance, at low temperatures (e.g., ) and in small samples (e.g., ), the saturation frequency is typically less than 1 GHz. However, experimentsexp9 ; exp8 with a large sample at a low temperature of show a saturation frequency of around . This frequency is independent of Hall bar size and plateau-plateau transitions, similar to the observation that saturation temperature is independent of Hall bar size. This result is unexpected and suggests that the saturation may be due to the axion effect.
We also demonstrate that by slightly increasing the Al contamination, the saturation frequency decreases from due to the diminishing axion effect. These experiments provide strong evidence for the presence of the axion, with its mass , yielding .
IX several ways of confirmation of axion contribution
In the experiment shown in Fig. (11) from exp9 , decreasing the external frequency reveals that the width saturates at a high frequency, around . This high saturation frequency has been discussed as an indication of the axion microwave effect. Without the axion contribution, the saturation frequency would be expected to occur at a much lower value, below .
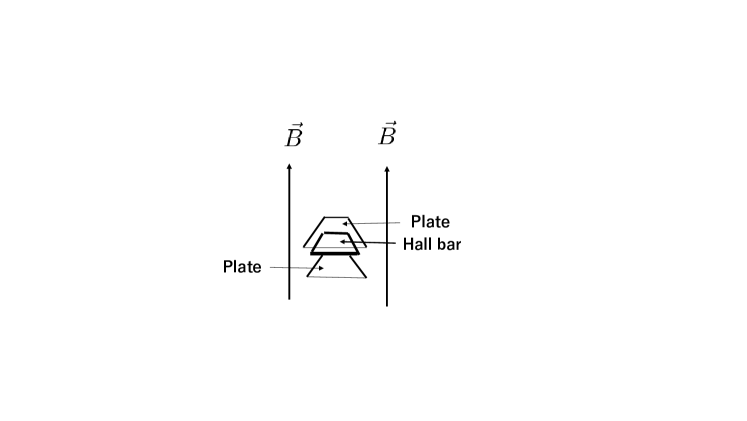
To test if the observed saturation is indeed due to the axion, we propose shielding the axion-generated radiation and observing whether the saturation frequency subsequently decreases below . In our previous work iwa , we suggested using two parallel conducting plates positioned parallel to the magnetic field, sandwiching the Hall bar to block axion-generated radiation from external sources. Although these plates generate microwaves, they are not absorbed by the Hall bar because their electric field component is oriented perpendicular to the Hall bar’s surface.
Additionally, conducting plates placed perpendicularly to the magnetic field do not generate additional microwaves in the presence of the axion-induced oscillating electric field . Instead, axion-generated microwaves originate from oscillating electric currents induced by in nearby metals that are not necessarily aligned perpendicular to . These metals are typically found surrounding the Hall bar in quantum Hall effect experiments.
In this paper, we propose an alternative setup: positioning the shielding plates parallel to the Hall bar, as shown in Fig. (15). These plates would be oriented perpendicularly to , ensuring they do not produce axion-induced radiation. To test this configuration, we suggest conducting measurements using two identical Hall bars, one with shielding plates and one without. Both Hall bars would have sufficiently large dimensions and be maintained at low temperatures to allow the axion effect to manifest.
Comparing the saturation frequencies in each setup, we would expect to observe a high frequency (around ) in the unshielded Hall bar and a lower frequency (below ) in the shielded Hall bar if the axion effect is present. Finding such a discrepancy in between the shielded and unshielded configurations would provide evidence for the presence of axion dark matter.
We would like to propose another ways of the confirmation of the axion effect in integer quantum Hall effect.
Firstly, we measure the dependence of saturation frequency on temperature. If we find that the saturation frequency is given by GHz at low temperature like mK, we check whether varies as decreasing temperature. When the axion effect causes GHz, the saturation frequency does not vary even if we decrease the temperature, i.e. GHz. After that, we increase temperature larger than mK and check whether decreases or not. We expect that begins to decrease when the temperature becomes sufficiently large for the axion effect to be negligible. There is a critical temperature above which the frequency begins to decrease. The axion effect gradually disappears as the temperature increases beyond the critical one. Then, the frequency reaches a low frequency GHz at a temperature . When the temperature goes beyond , the frequency begins to increases just as in the case without the axion effect. It is our expectation when the dark matter axion is present.
Secondly, we can check the saturation frequency GHz does not vary with increasing the size of Hall bar. When we observe the saturation frequency GHz with a large Hall bar at sufficiently low temperature, the frequency does not change even if the size of Hall bar is enlarged. The independence of GHz on the size of Hall bar is caused by the axion effect.
Finally, we propose an additional check of the confirmation. We examine whether or not the identical saturation frequency GHz is obtained even if we use Hall bars formed of various components of semiconductors. The examination should be performed in sufficiently large size and low temperature for the axion effect to be effective. The saturation frequency is determined by the frequency of the axion microwave, not depending on each samples.
Theses examinations using various ways of the confirmation will be able to prove the presence of the axion dark matter.
X conclusion
By analyzing previous experiments, we have shown how the axion effect manifests in plateau-plateau transitions. These transitions are characterized by the width , which depends on temperature, the frequency of the external microwave, and the size of the Hall bar. The transition width is related to the change in Fermi energy, , which increases as the magnetic field decreases. Specifically, the width is given by in the temperature-dominant case, where is the mobility gap, or in the frequency-dominant case, with being the microwave frequency.
In general, the width decreases with decreasing temperature, but it saturates at a critical temperature . In the case of a small Hall bar, the mobility gap is much larger than the thermal energy, satisfying . Thus, the width saturation occurs when , stabilizing at .
As the mobility gap decreases with the increasing size of the Hall bar, the critical temperature also decreases with larger Hall bar dimensions. This scenario corresponds to the axion effect being negligible. In contrast, at much lower temperatures and for larger Hall bar sizes, the axion effect becomes significant.
Specifically, in the case of a sufficiently large Hall bar, where the axion effect cannot be neglected, the width saturates at a temperature , with . An experiment exp4 that observed this saturation showed a temperature below mK and a two-dimensional electron surface area exceeding . In this setup, the mobility gap is comparable to or smaller than the thermal energy. Notably, the saturation temperature remains constant regardless of Hall bar size.
The size independence of the saturation temperature, demonstrated experimentally in exp4 , has been attributed to ”intrinsic decoherence,” although it is a prominent characteristic of the axion effect in the quantum Hall regime. The saturation of is illustrated in Fig. (6).
Evidently, the saturation temperature does not depend on individual samples. In fact, an experiment exp44 conducted with a different sample from that used in exp4 demonstrates that the width saturates at nearly the same temperature as observed in exp4 .
Similarly, the width decreases as the frequency of the external microwave decreases, eventually saturating at a frequency . This saturation frequency decreases with temperature, typically falling below GHz at around mK. For example, GHz when the temperature is mK and the Hall bar size is . As the Hall bar size increases (or temperature decreases) beyond this point, becomes significantly lower, as far as it is a regime where the axion effect is negligible.
Experiments exp5 ; exp6 ; hohls2 exhibiting these characteristics are shown in Fig. (8), Fig. (9), and Fig. (10). Additionally, the authors of hohls2 reported that in various experiments conducted up to the publication date, the saturation frequencies were consistently below GHz at approximately mK.
Conversely, when the axion effect is not negligible, the saturation frequency is given by . This condition is realized at low temperatures below mK and with a large Hall bar area exceeding . In the absence of the axion effect, the saturation frequency would be expected to be below GHz due to the low temperature and large Hall bar size. However, we observed GHz in experiments exp8 ; exp9 with a large Hall bar (m) at a low temperature of mK.
As expected, the saturation frequency remains unchanged exp9 even with variations in Hall bar size. Additionally, an identical saturation frequency exp8 was observed during a plateau-to-plateau transition with a different filling factor. Consequently, we conclude that the experiments exp8 ; exp9 , shown in Fig. (11), provide strong evidence for the presence of axion dark matter with a mass of approximately .
To confirm the presence of the axion effect, we propose experiments to test whether the saturation frequency GHz remains constant even when varying the temperature, Hall bar size, and filling factor in a plateau-to-plateau transition.
A more direct method for confirmation would involve shielding the axion-induced microwave signal as illustrated in Fig. (15) to determine if the phenomena associated with the axion effect disappear under these conditions.
The author expresses thanks to A. Sawada and Wen Yin for useful comments. This work is supported in part by Grant-in-Aid for Scientific Research ( KAKENHI ), No.19K03832.
References
- (1) R. D. Peccei and H. R. Quinn, Phys. Rev. Lett. 38 (1977) 1440.
- (2) S. Weinberg, Phys. Rev. Lett. 40 (1978) 223.
- (3) F. Wilczek, Phys. Rev. Lett. 40 (1978) 279.
- (4) J. Preskill, M. B. Wise and F. Wilczek, Phys. Lett. 120B (1983) 127.
- (5) L. F. Abbott and P. Sikivie, Phys. Lett. B120 (1983) 133.
- (6) M. Dine and W. Fischler, Phys. Lett. B120 (1983) 137.
- (7) T. Braine et al, Phys. Rev. Lett. 124, (2020) 101303.
- (8) K. Yamamoto, et al. hep-ph/0101200.
- (9) L. Zhong, et al. Phys. Rev. D97 (2018) 092001.
- (10) J. L. Ouellet, et al. Phys. Rev. Lett. 122 (2020) 12, 121802.
- (11) B. T. McAllister, et al. Phys. Dark Univ. 18 (2017) 67.
- (12) X. Li, et al. PoS ICHEP2020 (2021) 645.
- (13) D. Horns, J. Jaeckel, A. Lindner, A. Lobanov, J. Redondo, and A. Ringwald, JCAP 04 (2013) 016.
- (14) V. Anastassopoulos, et al. Nature Phys. 13 (2017) 584.
- (15) R. Ohta, et al. Nucl. Instr. Meth. A670 (2012) 73.
- (16) A. Iwazaki, PTEP 2022 (2022) 2, 021B01.
- (17) P. Sikivie, Phys. Rev. D32 (1985) 2988.
- (18) K. v. Klitzing, G. Gorda and M. Pepper. Phys. Rev. Lett. 45 (1980) 494.
- (19) R. E. Prange and S. M. Girvin, Springer Verlag, New York(1987).
- (20) A. Iwazaki, Phys. Lett. B 846 (2023) 138242.
- (21) A. Iwazaki, PTEP, 2024 (2024) 6, 063C01.
- (22) L. W. Engel, D. Sharhar, C. Kurdak and D. C. Tsui, Phys. Rev. Lett. 71 (1993) 2638.
- (23) N. Q. Balaban, U. Meirav, and I. Bar-Joseph, Phys. Rev. Lett. 81 (1998) 4967.
- (24) F. Hohls, U. Zeitler, and R. J. Haug, Phys. Rev. Lett. 86 (2001) 5124.
- (25) F Hohls, U Zeitler, R.J Haug, K Pierz, Physica B: Condensed Matter, 298 (2001) 88.
- (26) F. Hohls, U. Zeitler, R. J. Haug, R. Meisels, K. Dybko, and F. Kuchar, Phys. Rev. Lett. 89 (2002) 276801.
- (27) N. Q. Balaban, U. Meirav, and I. Bar-Joseph, Phys. Rev. Lett. 81 (1998) 4967.
- (28) K. Saeed, N. A. Dodoo-Amoo, L. H. Li, S. P. Khanna, E. H. Linfield, A. G. Davies, and J. E. Cunningham, Phys. Rev. B 84 (2001) 155324.
- (29) N. A. Dodoo-Amoo, The nature of critical phenomena of the scaling theory of quantum Hall transitions in two-dimensional electron systems. PhD thesis, University of Leeds, (2013).
- (30) Pujia Shan, Hailong Fu, Pengjie Wang, Jixiang Yang, L.N. Pfeiffer, K.W. West, Xi Lin, Physica E: Low-dimensional Systems and Nanostructures, 99, (2018) 118.
- (31) Xuebin Wang, Haiwen Liu, Junbo Zhu, Pujia Shan, Pengjie Wang, Hailong Fu, Lingjie Du, L. N. Pfeiffer, K. W. West, X. C. Xie, Rui-Rui Du, and Xi Lin, Phys. Rev. B 93 (2016) 075307.
- (32) H. Aoki and T. Ando, Phys. Rev. Lett. 54 (1985) 831.
- (33) H. Aoki and T. Ando, J. Phys. Soc. Jpn. 54 ( 1985) 2238.
- (34) L. W. Engel, D. Shahar, Ç. Kurdak, and D. C. Tsui, Phys. Rev. Lett. 71 (1993) 2638.
- (35) Wei, H. P., D. C. Tsui, M. A. Paalanen, and A. M. M. Pruisken, Phys. Rev. Lett. 61 (1988) 1294.
- (36) Gudina, S.V., Arapov, Y.G., Ilchenko, E.I. et al. Semiconductors 52, (2018) 1551.
- (37) S. Koch, R. J. Haug, K. v. Klitzing, and K. Ploog, Phys. Rev. B 46 (1992) 1596.
- (38) Wanli Li, C. L. Vicente, J. S. Xia, W. Pan, D. C. Tsui, L. N. Pfeiffer, and K. W. West, Phys. Rev. Lett. 102 (2009) 216801.