Abstract
Multifractality is a concept that helps compactly grasping the most essential features of the financial dynamics. In its fully developed form, this concept applies to essentially all mature financial markets and even to more liquid cryptocurrencies traded on the centralized exchanges. A new element that adds complexity to cryptocurrency markets is the possibility of decentralized trading. Based on the extracted tick-by-tick transaction data from the Universal Router contract of the Uniswap decentralized exchange, from June 6, 2023, to June 30, 2024, the present study using Multifractal Detrended Fluctuation Analysis (MFDFA) shows that even though liquidity on these new exchanges is still much lower compared to centralized exchanges convincing traces of multifractality are already emerging on this new trading as well. The resulting multifractal spectra are however strongly left-side asymmetric which indicates that this multifractality comes primarily from large fluctuations and small ones are more of the uncorrelated noise type. What is particularly interesting here is the fact that multifractality is more developed for time series representing transaction volumes than rates of return. On the level of these larger events a trace of multifractal cross-correlations between the two characteristics is also observed.
keywords:
Complex Systems; Multifractality; Fluctuations; Financial Markets; Blockchain Technology; Cryptocurrencies; Decentralized Trading1 \issuenum1 \articlenumber0 \datereceived \daterevised \dateaccepted \datepublished \hreflinkhttps://doi.org/ \TitleApproaching multifractal complexity in decentralized cryptocurrency trading \TitleCitationApproaching multifractal complexity in decentralized cryptocurrency trading \AuthorMarcin Wątorek 1,3\orcidA, Marcin Królczyk 1\orcidE, Jarosław Kwapień 2\orcidB, Tomasz Stanisz 2\orcidCand Stanisław Drożdż 1,2\orcidD \AuthorNamesMarcin Wątorek, Marcin Królczyk, Jarosław Kwapień, Tomasz Stanisz and Stanisław Drożdż \AuthorCitationWątorek, M.; Królczyk, M.; Kwapień, J.; Stanisz, T.; Drożdż, S. \corresCorrespondence: stanislaw.drozdz@ifj.edu.pl
1 Introduction
There are two basic types of exchanges on the cryptocurrency market: centralized (CEX) Bonneau et al. (2015) and decentralized (DEX) Mohan (2022); Xu et al. (2023). CEX exchanges operate very similarly to exchanges on traditional financial markets – their main task is to act as an intermediary between buyers and sellers. The entire exchange infrastructure is completely controlled by a single entity, being often a private company that decides, which elements of the system are publicly available and which should be hidden from ordinary users. The main source of earnings for such exchanges is transaction fees. They are efficient, easy to use, have high liquidity, allow one to exchange fiat money for cryptocurrencies and vice versa, and have well-developed customer service. However, their very nature carries a number of threats: a potential hacker attack on the exchange or dishonesty of its owners may result in a complete loss of funds by its customers Feder et al. (2018); Vidal-Tomas et al. (2023); Hägele (2024). For this reason, these exchanges often require their users to complete KYC/AML procedures Moreno et al. (2021). Currently, the most popular exchanges of this type are Binance, Coinbase Exchange, Kraken, Bybit, Kucoin, OKX, and Bitstamp CoinMarketCap .
In turn, DEX exchanges enable trading without the participation of intermediaries. Their architecture is significantly different from that of centralized exchanges, because the entire infrastructure is controlled by the community. A front-end server is usually open-source code that can be run by anyone. The contract code is fully available for viewing as well. The DEX trading is based on Decentralized Finance (DeFi) – smart contracts, which are computer programs that are executed without human supervision on a blockchain network like, e.g., Ethereum, which is the most popular one, by using cryptographically signed transactions Zheng et al. (2020). They are concluded only when both parties consent and meet the requirements specified in the contract. Thanks to smart contracts on DEX exchanges, users can trade cryptocurrencies, make loans, and multiply funds through crypto deposits, among others. The advantage of DEX-type exchanges is also the possibility to trade a larger number of tokens, including less popular ones, that are not available on CEX-type exchanges. The decentralized cryptocurrency exchanges are characterized by a high degree of anonymity, because implementing the KYC/AML verification is impossible due to the distributed architecture. Their biggest disadvantages include conscious or unconscious errors, exposure to attacks on smart contracts, the lack of customer support, difficult operation, and often low liquidity and low trading volume on trading pairs Aspris et al. (2021); Mohan (2022); Xu et al. (2023). The most popular DEX exchanges in 2024 include Uniswap, Radydium, Curve, PancakeSwap, SushiSwap dYdX, Balancer, Orca and Jupiter CoinGecko . In addition to Ethereum, currently popular platforms supporting the operation of smart contracts and DEX are Solana, Tron, BNB Chain, Arbitrum, Base, Avalanche, Sui, Polygon and Optimism DeFiLlama .
A key component of the architecture of decentralized cryptocurrency exchanges is the pricing mechanism, based on which three types of DEXs can be distinguished Shah et al. (2023):
(1) The Automated Market Makers (AMM), whose task is to determine the appropriate price of assets, are based on smart contracts and liquidity pools (see below) Bartoletti et al. (2022); Mohan (2022); Brönnimann et al. (2024). They are currently the most popular ones.
(2) The exchanges using order books do not have liquidity pools and, in order to determine the price of assets, the traders’ orders are matched directly like on the traditional exchanges Platt et al. (2020). There are two types of ledgers: the on-chain one that uses blockchain to process data and the off-chain one that uses solutions based on centralization to process transactions Warren and Bandeali (2017). However, both types use blockchain networks to store data.
(3) The DEX aggregators, in which the pricing mechanism involves aggregating asset liquidity from many different protocols Takemiya (2023). Data from many exchanges is concentrated in one place, which allows users to conduct much more profitable trading operations. These exchanges mainly focus on solving the biggest problems of DEXs, which include: low liquidity, inflated cryptocurrency trading prices, long waiting times for the execution of transactions at the price specified by a user, and high prices for service fees.
Liquidity pools are used only in the exchanges based on the AMM protocol Bartoletti et al. (2022); Brönnimann et al. (2024). They are a set of funds (DeFi tokens) locked in a smart contract. They are obtained from liquidity providers (i.e., people who deposit their own funds into a pool to enable others to trade) and used by the contract to support decentralized trading. The reward for providing liquidity is receiving remuneration, most often in the form of tokens of a given pool. The remuneration source is most often the transaction fees, which are collected from traders in a given pool.
There are numerous studies that analyzed CEX trading properties Corbet et al. (2019); Makarov and Schoar (2020); Fang et al. (2022). In particular, the microstructure of the market Aleti and Mizrach (2021), the use of machine learning in trading Koker and Koutmos (2020), the role of Binance exchange in volatility transmission Carol Alexander and Kaeck (2022) and the impact of BTC futures contracts on the market Fassas et al. (2020) were studied. Exchanges rates on CEX were analyzed from many perspectives Wątorek et al. (2021), including the noise occurrence Dimpfl and Peter (2021), optimal trading strategies James (2022), and portfolio construction James and Menzies (2023); Nguyen et al. (2023). Multifractal detrended fluctuation analysis (MFDFA) was also applied to study BTC Takaishi (2018); da Silva Filho et al. (2018); Stavroyiannis et al. (2019); Takaishi and Adachi (2020) and ETH Mensi et al. (2019); Han et al. (2020); Kakinaka and Umeno (2022); Ali et al. (2024) price changes on CEX exchanges. On the other hand, there is a limited amount of such studies for DEX exchanges Hägele (2024). There are articles that analyze trading properties from the technical point of view Capponi and Jia (2021); Lo and Medda (2021); Alexander et al. (2023), wash trading occurrence Victor and Weintraud (2021); Gan et al. (2022, 2024), arbitrage and maximal extractable value (MEV) possibilities Wang et al. (2022); Adams et al. (2023); Capponi et al. (2024); Hansson (2024), but there are almost none that analyze the price and volume fluctuations characteristics on DEX, probably due to decentralized character of the data Hägele (2024). This article covers this unexplored area by systematically analyzing price changes properties on DEX exchanges by advanced methods like MFDFA.
To achieve the research goal the study focuses on transaction data extracted from the Universal Router contract Uni (2024) of the Uniswap DEX Uniswap , which is currently the largest DEX exchange in terms of trading volume and number of available tokens CoinMarketCap . It is an automated liquidity protocol based on AMM. Originally, Uniswap operated only on the Ethereum network, but currently, it also operates on Arbitrum, Optimism, Polygon, Base, BNB Chain, Avalanche, Celo, Blast, ZKsync, and Zora Networks on Uniswap . Despite operating on many networks, the exchange is mainly associated with the Ethereum blockchain, and most of its community is concentrated there. Until April 2024, there were four versions of the exchange: Uniswap v1, Uniswap v2 Uniswapv (2), Uniswap v3 Uniswapv (3), and the developer version of Uniswap v4 (the full rollout of v4 has been scheduled to take place in the third quarter of 2024) Uniswapv (4).
There are two basic types of contracts on Uniswap: (1) Factory contracts – the so-called base contracts, on top of which other contracts that support the exchange of specific tokens are created. The contract task is also to manage the mapping between the contract address of a given token and the address of its exchange contract. (2) Exchange contracts executing the exchange of a token – these are contracts that exchange the token assigned to them UniversalRouterguide .
To enable transactions on a given token, it is necessary to perform the following steps: (1) the contract representing a given token must be implemented on the Ethereum network, (2) a trade contract for a given token on the Uniswap exchange has to be created through the Factory contract, and (3) this dedicated contract can be used to execute its exchange transactions. In the 1st version of the exchange, the possibility of creating the token pools was limited as it was possible to create exchange pairs only for the native cryptocurrency Ether (ETH). Currently, however, there are contracts that enable the creation of pools that carry out, for example, a direct exchange of two ERC-20 tokens Bauer (2022).
The Universal Router contract Uni (2024) is currently one of the most important contracts on Uniswap. Within a single transaction on the network, this contract can support multiple exchanges of ERC-20 tokens on Uniswap v2 and v3, as well as trading of NFT tokens on multiple markets. The mechanism of combining multiple operations into one transaction offers exchange users great flexibility. It allows, among others, to optimize token exchange costs – instead of exchanging funds using one low-liquidity pool, a user can, for example, exchange part of their funds on Uniswap v2 and part on Uniswap v3, thus avoiding an unfavorable exchange rate.
The main research question of this article is to investigate to what extent, despite the existing differences in trading methods, the fluctuation characteristics on the most liquid DEX exchange, Uniswap, are similar to those observed on Binance, which is currently the largest CEX exchange. In subsection 2.1, the characteristics of the log-returns and volume distributions will be compared. The next step will be to check the existence of long-range correlations in the time series of interest rates and volume, which will allow for a comparison of the characteristics of multifractal patterns in time series from both types of exchanges in subsection 3.1. Finally, the multifractal properties of correlation between volatility and volume will be investigated in subsection 3.2.
2 Data and methodology
2.1 Data specification
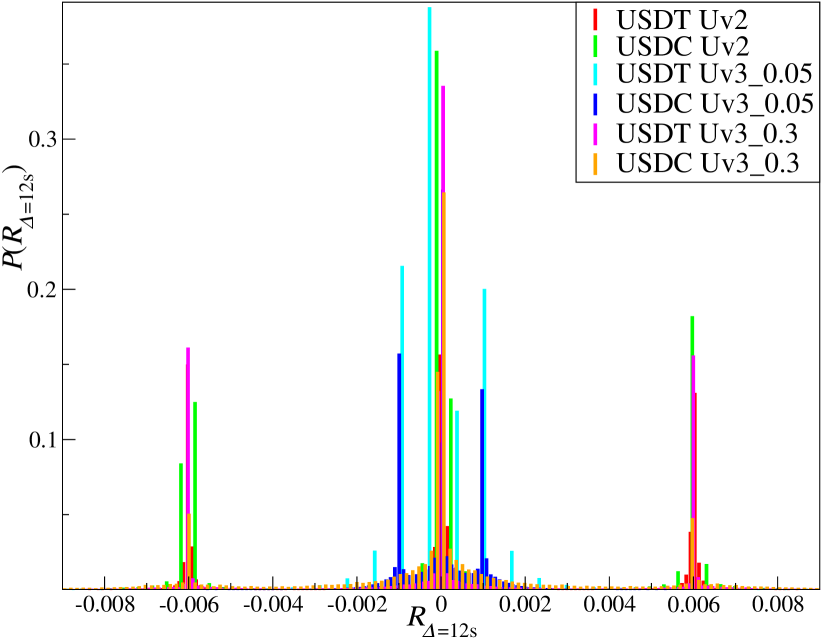
In this study, transactions executed via the Uniswap Universal Router in the most liquid pools are analyzed, specifically: ETH/USDT on Uniswap version 2 (USDT Uv2), ETH/USDT on Uniswap v3 with 0.3% commission (USDT Uv3_0.3), ETH/USDT on Uniswap v3 with 0.05% commission (USDT Uv3_0.05), ETH/USDC on Uniswap v2 (USDC Uv2), ETH/USDC on Uniswap v3 with 0.3% commission (USDC Uv3_0.3), and ETH/USDC on Uniswap v3 with 0.05% commission (USDC Uv3_0.05) Uniswapv (3). The tick-by-tick transaction data covers the period from June 6, 2023, to June 30, 2024. For Uniswap v3 pools, the percentage indicates the fee for the respective pool, whereas for Uniswap v2, the fee is consistently 0.3%. Uniswap versions 2 and 3 also differ in trading mechanisms. Uniswap v3 introduces concentrated liquidity, allowing liquidity providers to specify the price range within which they provide liquidity Uniswapv (3). As a result, each liquidity position may be different and is represented by an NFT token UniswapNFT . Version 3 also includes range orders, enabling orders to be placed within a custom price range above or below the current pool price Uniswapv (3). This mechanism can result in transactions with very low volumes and prices that deviate significantly from those on other exchanges. As such, transactions with volumes below 0.01 USD were excluded from the dataset.
The distinction between liquidity pools with varying commission rates is evident in the distribution of log-returns, measured at the highest sampling frequency, s, which corresponds to Ethereum’s block validation time Ethereum12s . Fig. 1 demonstrates that, in addition to the usual concentration of log-returns around zero, common in financial time series Mantegna and Stanley (1995); Gopikrishnan et al. (1999); Plerou et al. (1999); Ausloos (2000), notable values of and appear for pools with 0.3% (Uv2 and Uv3) and 0.05% (Uv3) commissions, respectively. This can be attributed to the smallest possible price change (twice the commission rate) at which arbitrage transactions (buying and selling) are profitable Wang et al. (2022).
To benchmark the time series characteristics from the decentralized exchange Uniswap, exchange rates for ETH/USDT and ETH/USDC from the most liquid centralized exchange, Binance Binance , were also included in the dataset.
The basic characteristics of the time series analyzed in this study are presented in Table 1. Notably, the average transaction volume is higher on Uniswap than on Binance. Additionally, the maximum observed transaction volume is comparable between the two exchanges. However, the average volume over 5min intervals is significantly higher for the ETH/USDT exchange rate on Binance. This difference can be attributed to the lower number of transactions on Uniswap compared to Binance. Another important observation is that Uniswap has a significantly lower trading frequency, with the lowest time between transactions s on USDT Uv2, compared to s for USDT on Binance.
| Name | [s] | [USD] | [USD] | [USD] | ||
| USDC Uv3_0.3 | 37,457 | 900.26 | 9,903 | 2,358,376 | 3,298 | 0.785 |
| USDC Uv3_0.05 | 765,399 | 47.01 | 11,227 | 7,751,943 | 76,419 | 0.006 |
| USDC Uv2 | 503,569 | 66.97 | 1,856 | 1,254,394 | 8,310 | 0.049 |
| USDT Uv3_0.3 | 151,003 | 223.33 | 3,390 | 3,878,300 | 4,553 | 0.388 |
| USDT Uv3_0.05 | 704,276 | 49.62 | 5,331 | 2,875,000 | 33,395 | 0.009 |
| USDT Uv2 | 748,919 | 45.14 | 1,843 | 1,084,474 | 11,378 | 0.028 |
| USDT Binance | 297,688,280 | 0.11 | 1,185 | 9,739,140 | 2,955,093 | 0 |
| USDC Binance | 10,343,176 | 3.31 | 73 | 4,265,360 | 72,643 | 0.003 |
To ensure the analysis remains comparable and to avoid an excessive number of zero returns that could distort more advanced multifractal analysis, the tick-by-tick data was aggregated into a 5-minute time series. Additionally, due to the significantly longer inter-transaction time for Uv3 with a 0.3% commission (), the time series from these liquidity pools were combined with those from Uv3 with a 0.05% commission. Following this procedure, 6 time series of log-returns and volume were obtained for ETH in USDT and USDC on Uniswap v2, Uniswap v3, and Binance: USDT Uv3, USDT Uv2, USDC Uv3, USDC Uv2, USDT Binance, and USDC Binance. Fig. 2 presents the complementary cumulative distribution functions (CCDFs) of these time series.
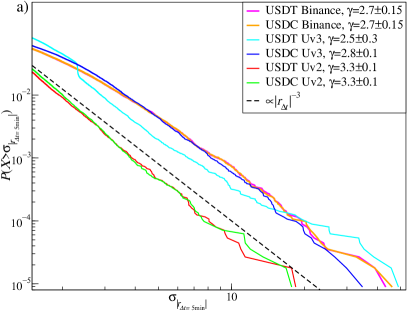
It is a well-established stylized fact that return distributions in financial time series exhibit fat tails Mandelbrot (1963); Cont (2001); Dhesi et al. (2021). This has been documented many times for stock markets Mantegna and Stanley (1995); Gopikrishnan et al. (1999); Drożdż et al. (2007), Forex Ausloos (2000); Gębarowski et al. (2019), cryptocurrencies Begušić et al. (2018); James et al. (2021) and even for the most liquid NFT collections Ghosh et al. (2023); Szydło et al. (2024); Wątorek et al. (2024). The heavy tails typically manifests as a power-law decay in the complementary cumulative distribution function (CCDF), expressed as , where represents the estimated standard deviation. For high-frequency data, the power-law exponent often approaches a value of 3, i.e., Wątorek et al. (2021). This so-called inverse cubic power law for return distributions has been observed not only in traditional financial markets Plerou et al. (1999); Gopikrishnan et al. (1999); Drożdż et al. (2010), but also in the cryptocurrency market Drożdż et al. (2018, 2019, 2020).
As it is shown in Fig. 2a, this pattern is also evident in the normalized absolute log-returns on the decentralized Uniswap exchange. Interestingly, the tails are fatter, and, thus, the value of is lower, for Uniswap v3 compared to Uniswap v2. This can be attributed to the more flexible trading mechanism in Uniswap v3, which allows users to set orders within a custom price range above or below the current price. Combined with the ability to provide concentrated liquidity, this results in trades occurring at prices significantly different from those on other exchanges, as observed on March 12, 2024, in the Uv3 ETH/USDT liquidity pool, where the exchange rate reached approximately 4,800 UniswapblockchianATH . The exponent values for Binance exchange rates fall between those observed for the two Uniswap versions.
Another well-known stylized fact that is observed in mature financial markets is that the volume distributions often exhibit fatter tails than the return distributions Rak et al. (2013); Yamani (2023). In the stock markets, a simple relationship has been proposed between the exponents for volume and log-returns, where Gabaix et al. (2003); Plerou et al. (2004). However, this relationship is more sophisticated for the cryptocurrencies Naeem et al. (2020); Drożdż et al. (2023), where CCDFs of the normalized volume for the most liquid cryptocurrencies like BTC and ETH are better described by a stretched exponential function Laherrère and Sornette (1998). This finding is supported by the more recent data analyzed in this study. For CCDF of the normalized volume of the most liquid pair on Binance, ETH/USDT, the best fit is (see Fig. 2b). A slightly fatter tail, and thus a lower , is observed for ETH/USDC on Binance.
The observed trend of thicker tails for Uniswap v3 compared to Uniswap v2, seen in the normalized absolute log-returns, also holds for CCDFs of the normalized volume, as shown in Fig. 2b. The heaviest tail, characterized by a power-law decay, is seen in the ETH/USDT pair traded on Uniswap v3, with . The second heaviest tail is also found for ETH/USDC on Uniswap v3, though its best fit is a stretched exponential function with . In contrast, CCDFs of the normalized volume for ETH/USDT and ETH/USDC traded on Uniswap v2 show thinner tails, with the best fit being .
A more detailed examination of the relationship between price and volume on decentralized exchanges, particularly the concept of price impact Bouchaud (2010); M. Wiliński and Hamill (2015), will be explored in a separate, more specialized article.
The measure used to identify linear correlations in a time series is the autocorrelation function (ACF), defined as:
| (1) |
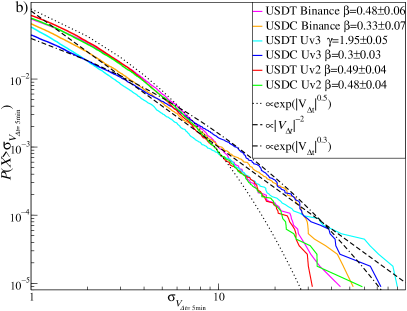
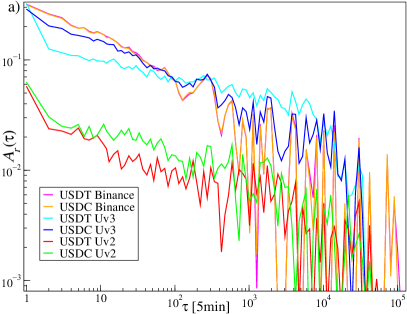
where is the estimated standard deviation of the time series , represents the estimated mean, and is the time lag in terms of data points, which can be related to the time as . For financial time series of log-returns, ACF shows a typical pattern: it quickly drops to zero when analyzing the sign of the returns Cont (2001); Ausloos (2000), but decays slowly, following a power law, when considering the absolute values Kutner and Świtała (2004); Rak et al. (2007); Klamut and Gubiec (2021). The same behavior is observed in the case of the normalized absolute log-returns on Uniswap, where ACF follows a power-law decay, as it is shown in Fig. 3a.
The strongest autocorrelation, similar to that seen on Binance, occurs in the exchange rates traded on Uniswap v3. In contrast, ACF of the normalized absolute log-returns for Uniswap v2 is significantly weaker, with compared to .
The behavior of ACF for the normalized volume differs from that of log-returns (Fig. 3b). While a power-law decay is also observed, the weakest autocorrelations are found in Uniswap v3, with . For Uniswap v2, the autocorrelations are slightly stronger, with for ETH/USDC and for ETH/USDT. Even for larger , ACF in Uniswap v2 remains higher than that observed on Binance, where the largest values of ACF occur for , with for ETH/USDC and for ETH/USDT.
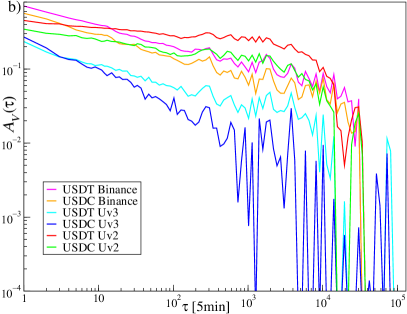
The strength and rate of decay of ACF discussed here influence the scaling of the fluctuation functions, as temporal correlations are a key source of multifractality Kwapień et al. (2023). This topic will be explored in detail in the following sections.
2.2 Multifractal formalism
Multifractality is a well-documented characteristic observed in financial time series Ausloos and Ivanova (2002); Jiang et al. (2019); Kutner et al. (2019). It has also been reported in cryptocurrencies traded on centralized exchanges (CEX) such as Binance Kwapień et al. (2022); Wątorek et al. (2022). The primary objective of this article is to investigate the presence of multifractal effects in the time series of log-returns and trading volume from a decentralized exchange like Uniswap and to examine whether correlations between volatility (expressed by absolute log-returns) and trading volume exist and exhibit multifractality. To test these hypotheses, the multifractal cross-correlation analysis methodology (MFCCA) is applied Oświęcimka et al. (2014). This approach is a consistent generalization of the detrended cross-correlation analysis (DCCA) introduced by Podobnik and Stanley (2008) and expanded by Zhou (2008). The methodology builds upon multifractal detrended fluctuation analysis Kantelhardt et al. (2002) (MFDFA), itself an extension of the widely used detrended fluctuation analysis Peng et al. (1994) (DFA).
The MFCCA methodology enables a quantitative assessment of both the scaling properties of individual time series and the degree of multifractal cross-correlation between any two time series. The procedure for multifractal cross-correlation analysis involves the following steps. Two time series, and , each of length , are divided into segments of length , starting from the opposite ends. The time series are then integrated and, within each segment , a least-square-fitted polynomial trend is removed by using the following equations:
| (2) | |||
| (3) |
where represents polynomials of order . The polynomial order of is chosen due to its proven efficacy in financial time series analysis Oświęcimka et al. (2013). Following this detrending process, a total of segments with detrended signals are obtained. Variance and covariance for each segment are then calculated as follows:
| (4) | |||
| (5) |
where represents either or . These quantities are used to compute a family of fluctuation functions:
| (6) | |||
| (7) |
where the sign function, , ensures consistency of the results across different values of .
Multifractal cross-correlation is expected to reveal itself through a power-law relationship in the scaling behavior of the th-order covariance function . If it is negative for all , the is taken. The following relationship is obtained:
| (8) |
where is an exponent that quantitatively describes the fractal characteristics of the cross-correlations. In the case of monofractal cross-correlation, is independent of , while a -dependence of indicates the presence of multifractal cross-correlations.
describes the scaling properties of a single time series through the following relationship:
| (9) |
where represents the generalized Hurst exponent Barabasi and Vicsek (1991). If remains constant, the time series is considered monofractal, with , where is the standard Hurst exponent, a measure of the persistence or memory of the time series Hurst (1951). When varies with , the series exhibits a multifractal structure. The corresponding singularity spectrum , which provides further insight into the multifractal nature Halsey et al. (1986), can be computed using the following relations Kantelhardt et al. (2002):
| (10) |
where is the singularity (or Hölder) exponent, and is the multifractal spectrum.
This methodology also enables the introduction of the -dependent detrended cross-correlation coefficient , as proposed by Kwapień et al. (2015), which filters out the strength of cross-correlations that vary with fluctuation size:
| (11) |
For , this definition can be interpreted as a detrended version of the Pearson cross-correlation coefficient Zebende (2011). In this context, the parameter acts as a filter: for , small fluctuations have more influence on , while for , large fluctuations dominate. This allows the method to selectively emphasize different ranges of fluctuation size contributing to the observed correlations. The filtering capability of offers an advantage over the conventional methods since cross-correlations in the real-world time series are typically not uniformly distributed across fluctuations of varying magnitude Kwapień et al. (2017). Moreover, can be applied to quantify cross-correlations even between the time series that do not exhibit multifractal properties.
3 Results
3.1 Multifractal properties of returns and volume time series
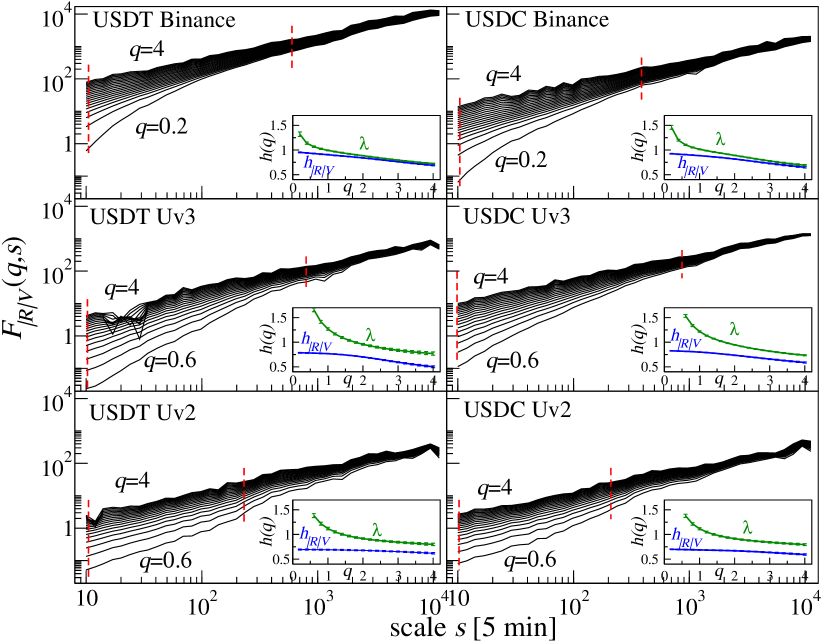
It was shown in Fig. 3 that the autocorrelation function for the absolute log-return and volume time series exhibit a power-law decay. The presence of long memory, indicated by this power-law decay, is associated with the occurrence of nonlinear correlations, which are the source of multifractality in time series Drożdż et al. (2010); Zhou (2009); Kwapień et al. (2023). Therefore, multifractal effects are expected to be present in the analyzed time series. However, the individual ones differ in the strength and persistence of the autocorrelation, which impacts the fluctuation functions calculated using Eq. (6) and presented in Fig. 4 for log-returns and Fig. 5 for volume.
For log-returns, the best scaling quality was observed for the exchange rates from Binance (upper panels in Fig. 4). This result is expected, given the behavior of ACF in Fig. 3 and the significantly higher liquidity on the Binance pairs compared to the Uniswap ones. Based on the scaling range shown in Fig. 4, the generalized Hurst exponent was estimated using Eq. (9), with the results displayed in the inset of Fig. 4 (upper panels). The clear dependence of across the full range of indicates that the log-return time series for ETH/USDT and ETH/USDC are multifractal. This finding aligns with previous studies on older data sets for the most liquid BTC and ETH exchange rates Takaishi (2018); da Silva Filho et al. (2018); Stavroyiannis et al. (2019); Mensi et al. (2019). The estimated Hurst exponent values, , are close to 0.5, which is typical for mature financial markets Carbone et al. (2004); Grech and Mazur (2004); Garcin (2017); Matos et al. (2008); Drożdż et al. (2018).
A slightly weaker scaling of is observed for log-returns from Uniswap v3 (middle panels in Fig. 4). In this case, is dependent on only for , which corresponds to medium and large fluctuations. Combined with , this behavior suggests the characteristics typical of immature markets Matteo et al. (2005); Cajueiro and Tabak (2006); James (2021); James and Menzies (2022); Ammy-Driss and Garcin (2023); Brouty and Garcin (2024), where multifractality is observed primarily for large fluctuations, while small, noisy fluctuations tend to be monofractal.
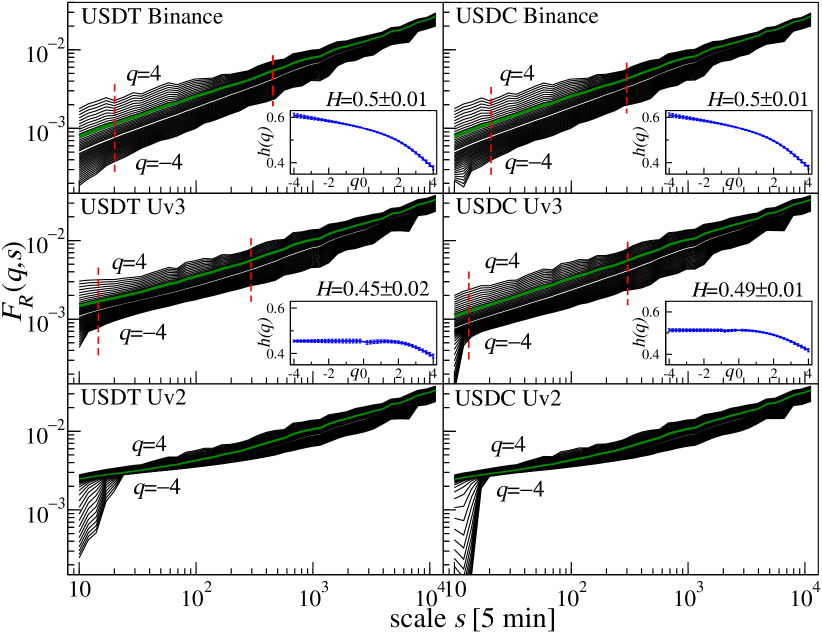
For the log-return time series from Uniswap v2 (middle panels in Fig. 4), the scaling quality is so poor that it is not possible to clearly determine the Hurst exponent due to the presence of two distinct scaling regimes in the fluctuation function. This behavior is directly linked to the very weak autocorrelations observed in Fig. 3. A potential reason for the weak autocorrelations and poor scaling of fluctuations in Uniswap v2 log-returns could be the trading mechanism, which does not allow setting orders at arbitrary prices in advance. Instead, trading is only possible by submitting a request to the pool at the current price Uniswapv (2).
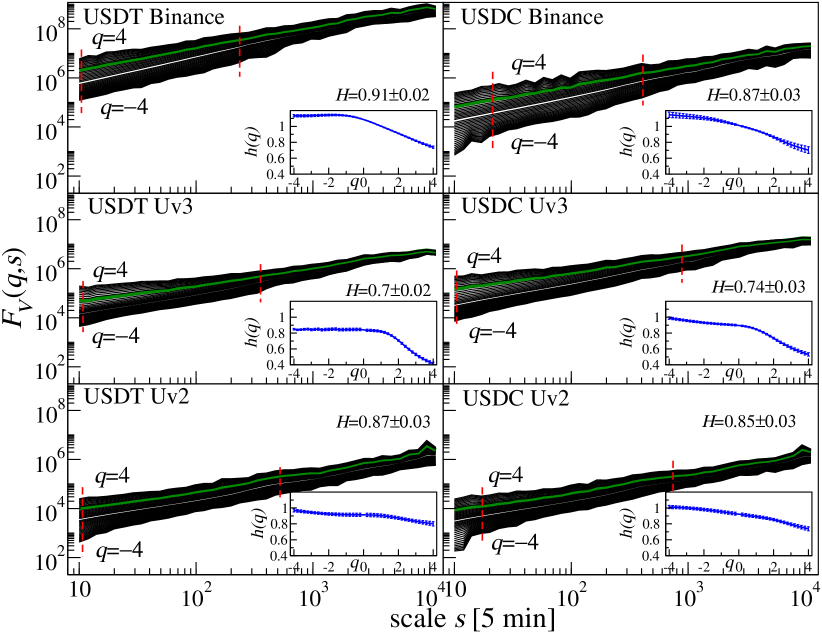
The scaling quality of the fluctuation functions is better in the case of the volume time series. As it is seen in Fig.5, the scaling of is sufficient to determine for all the time series analyzed. Unlike the log-returns, there is no significant difference between the scaling for volume from Binance and both versions of Uniswap. Interestingly, the Hurst exponent for volume is higher for Uniswap v2 () compared to Uniswap v3 (), which is consistent with the stronger autocorrelations observed for Uv2 in Fig.3.
A natural feature of the volume time series is the higher Hurst exponent compared to log-returns, because volume is unsigned. The insets of Fig. 5 show that the dependence of on is evident for all the volume time series, which indicates their multifractal nature. This dependence is particularly pronounced for , highlighting a more developed multifractality in large fluctuations of the volume time series.
This behavior of is directly reflected in the multifractal spectra shown in Fig.6, which are derived by using Eq. (10). In most cases, a left-sided asymmetry of is observed, with the left arm stretched relative to the right one. This suggests a richer multifractality in the large fluctuations. Such a left-sided asymmetry in the singularity spectrum is commonly seen in financial time series, where small fluctuations often represent noise, while medium and large ones convey meaningful information Drożdż and Oświęcimka (2015); Drożdż et al. (2018); Jiang et al. (2019).
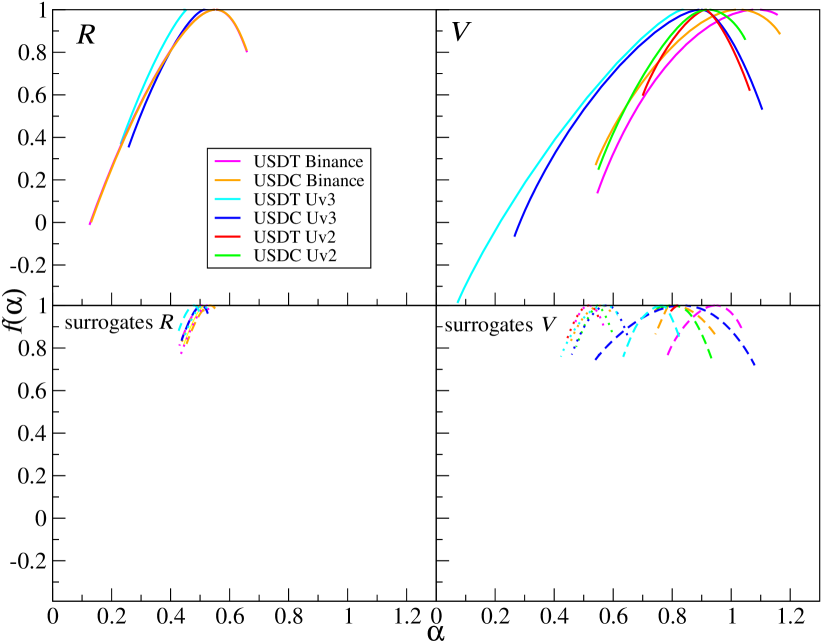
For log-returns (Fig. 6, left side), the most developed multifractal spectrum is observed for time series from Binance, which confirms previous findings Wątorek et al. (2021, 2022). In the case of Uniswap v3 log-returns, only the left arm of the spectrum is present and it is shorter than that of Binance, indicating that only large fluctuations exhibit multifractality. For Uniswap v2 log-returns, the multifractal spectrum could not be determined due to the poor scaling of the fluctuation function . This suggests that Uniswap, particularly in its version 2, was not yet a mature market from a multifractal perspective. However, in version 3, which was launched later, the appearance of the left arm of the multifractal spectrum may signal a more advanced stage of market development.
Interestingly, for the volume time series (Fig. 6, right panels), the longest left arm of is observed for ETH/USDT from Uniswap v3. In the case of ETH/USDC on Uniswap v3, both arms are well-developed. The significant stretching of the left arm for ETH/USDT on Uniswap v3 can be explained by (1) the heavy tails of the corresponding CCDF, where ETH/USDT Uv3 have the heaviest tails (Fig 2b) with , a value, which causes instability in the Lévy sense, and (2) a slow convergence to the normal distribution Drożdż et al. (2010). Additionally, Uniswap v2 also displays multifractality, though is narrower here than that of ETH/USDC on Uv3. The singularity spectra obtained from the Binance time series show a left-side asymmetry and are comparable to those from Uniswap v2. However, the ones for Binance are shifted to the right indicating higher values of the Hurst exponent, as previously shown in Fig. 5. The smaller differences between Binance and Uniswap in the multifractal characteristics of volume may stem from the fact that, as shown in the basic statistics in Table 1, Uniswap has a higher transaction volume per trade, despite its slower trading if compared to Binance.
To assess the statistical significance of the observed multifractal effects in the analyzed time series, two types of surrogate time series were generated: the Fourier surrogates Schreiber and Schmitz (2000) and the randomly shuffled surrogates Theiler and Prichard (1996). As it can be seen in the lower panels of Fig. 6, the multiscale characteristics of the original time series nearly vanish when considering either of the surrogate types. In the case of the Fourier surrogates, nonlinear correlations are eliminated by randomizing the Fourier phases of the original data, leaving only linear correlations intact. As a result, the multifractal spectra are narrow and shifted to the right for volume since for the original time series. For the shuffled surrogates, both the linear and nonlinear correlations are destroyed, though the log-return distributions are preserved. Consequently, is narrow and centered around , which corresponds to an uncorrelated time series (). It should be noted that the slightly wider spectra for the Uv3 volume are a numerical artifact caused by the heavy tails in the corresponding CCDFs (for more details, see Refs. Drożdż et al. (2010); Grech and Pamuła (2013); Zhou (2012); Rak and Grech (2018)).
3.2 Correlations between volatility and volume
Another well-documented phenomenon in the mature financial markets is the correlation between volatility (absolute log-returnvolume Gillemot et al. (2006); Podobnik et al. (2009); Rak et al. (2015), which has also been observed recently in the most liquid cryptocurrencies Drożdż et al. (2023). In this study, the MFCCA methodology will be applied to explore the extent to which volatility and volume are correlated on Uniswap, where the trading mechanisms differ from those on the traditional centralized exchanges. These differences in trading mechanisms have led to the distortions in some of the time series characteristics discussed above.
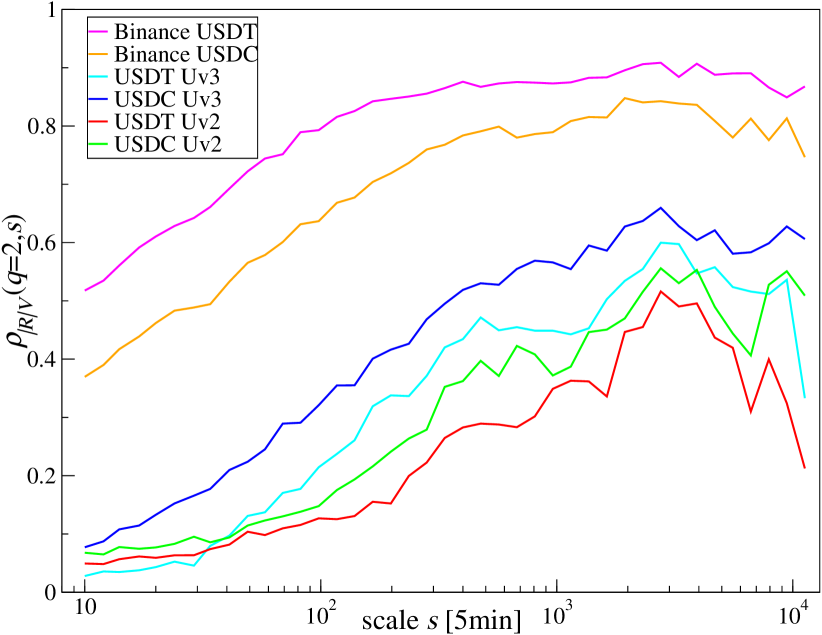
The fluctuation functions , representing correlations between volatility and volume , calculated by using Eq. (7), are shown in Fig. 7. Similar to the Binance time series (Fig. 7, top panels), Uniswap also exhibits scaling in the fluctuation functions , but only for , which means that the correlations are present mainly in the medium and large fluctuations. However, the scaling for Uniswap is poorer and begins at higher values of (around ). This scaling allows one for the estimation of using Eq. (8) and its comparison with the average generalized Hurst exponents for and defined as Arianos and Carbone (2009) – see the insets of Fig. 7. The dependence of on is evident, indicating that the correlation between volatility and volume is multifractal. However, in the case of Uniswap, the difference between and is much larger, signaling weaker cross-correlations Wątorek et al. (2019). This is further reflected in the behavior of the detrended cross-correlation coefficient (calculated by using Eq. (11)), which is shown for in Fig. 8. For and , the coefficient is significantly lower for Uniswap () compared to Binance ( in the case of ETH/USDT and in the case of ETH/USDC), particularly at small time scales. In both exchanges, increases with time scale , which is in agreement with the related phenomenon observed in the traditional financial markets Zhao et al. (2018); Wątorek et al. (2019, 2021). However, this increase occurs more rapidly in the time series from Uniswap as for Binance plateau around , reaching above 0.8.
The strongest correlation in Fig 8 is observed for the most liquid ETH/USDT pair traded on Binance, while the weakest correlations are seen in Uniswap v2. This, combined with a poorer scaling of for Uniswap, highlights the differences between Uniswap and Binance in terms of the volatility-volume cross-correlations. Uniswap appears to be a less developed market in this respect, possibly due to its different trading mechanisms and the fact that transactions on Uniswap occur less frequently but with higher average volumes per transaction than on Binance.
4 Conclusions
Despite the different trading mechanisms on the decentralized exchange Uniswap, many of the characteristics of log-returns and volume are already similar to those observed on the centralized exchanges like Binance. However, several differences remain. The log-returns from Uniswap are characterized by weaker autocorrelations, especially for Uniswap version 2, which results in a lack of scaling in the fluctuation function for Uv2 and poor scaling for Uv3. In Uv3, only large fluctuations exhibit a multifractal nature. On the other hand, no significant difference is observed in the volume characteristics between Binance and Uniswap. The cross-correlations between volatility (absolute log-returns) and volume are much weaker on Uniswap. These differences may reflect both the lower maturity level of Uniswap and its unique trading mechanism, where fewer transactions occur but with higher volumes. This newly emerging volatility-volume correspondence on DEX is an intriguing effect from the perspective of the functioning of the financial markets and should definitely become a subject of immediate, more specific, systematic research. The obtained results may help investors to adapt their investment strategies used on more common CEX exchanges to different trading conditions and price-fluctuation properties that occur on DEX exchanges.
One of the limitations of this study is the fact that the data was obtained only from the Uniswap liquidity pools. Even though it is currently the most liquid DEX exchange, there may exist some specificities on other exchanges. From the investor and arbitrageur perspective, an interesting observation is the significantly higher occurrence of the log returns around the commission-related values. An investigation of this phenomenon on a larger number of liquidity pools and trading protocols will be carried out in the future.
Conceptualization, M.W. and S.D.; methodology, M.W., M.K., J.K. and T.S.; software, M.W. and M.K.; validation, M.W., T.S. and S.D.; formal analysis, M.W., M.K., and J.K.; investigation, M.W. and M.K.; resources, M.W. and M.K.; data curation, M.W. and M.K.; writing—original draft preparation, M.W., M.K., J.K., and S.D.; writing—review and editing, M.W., M.K., T.S., and S.D; visualization, M.W. and M.K.; supervision, M.W. and S.D.; project administration, M.W. and S.D.; funding acquisition, M.W. All authors have read and agreed to the published version of the manuscript.
This research was funded in part by National Science Centre, Poland, grant number 2023/07/X/ST6/01569.
Data is freely available on the public Ethereum blockchain and on Binance platform.
The authors declare no conflicts of interest.
References
References
- Bonneau et al. (2015) Bonneau, J.; Miller, A.; Clark, J.; Narayanan, A.; Kroll, J.A.; Felten, E.W. Research Perspectives and Challenges for Bitcoin and Cryptocurrencies. 2015.
- Mohan (2022) Mohan, V. Automated market makers and decentralized exchanges: a DeFi primer. Financial Innovation 2022, 8, 20.
- Xu et al. (2023) Xu, J.; Paruch, K.; Cousaert, S.; Feng, Y. Sok: Decentralized exchanges (DEX) with automated market maker (AMM) protocols. ACM Computing Surveys 2023, 55, 1–50.
- Feder et al. (2018) Feder, A.; Gandal, N.; Hamrick, J.T.; Moore, T. The impact of DDoS and other security shocks on Bitcoin currency exchanges: evidence from Mt. Gox. Journal of Cybersecurity 2018, 3, 137–144.
- Vidal-Tomas et al. (2023) Vidal-Tomas, D.; Briola, A.; Aste, T. FTX’s downfall and Binance’s consolidation: The fragility of centralised digital finance. Physica A 2023, 625, 129044.
- Hägele (2024) Hägele, S. Centralized exchanges vs. decentralized exchanges in cryptocurrency markets: A systematic literature review. Electronic Markets 2024, 34, 33.
- Moreno et al. (2021) Moreno, S.M.; Seigneur, J.M.; Gotzev, G. A survey of KYC/AML for cryptocurrencies transactions. In Handbook of Research on Cyber Crime and Information Privacy; IGI Global, 2021; pp. 21–42.
- (8) CoinMarketCap. https://coinmarketcap.com.
- Zheng et al. (2020) Zheng, Z.; Xie, S.; Dai, H.N.; Chen, W.; Chen, X.; Weng, J.; Imran, M. An overview on smart contracts: Challenges, advances and platforms. Future Generation Computer Systems 2020, 105, 475–491.
- Aspris et al. (2021) Aspris, A.; Foley, S.; Svec, J.; Wang, L. Decentralized exchanges: The “wild west” of cryptocurrency trading. International Review of Financial Analysis 2021, 77, 101845.
- (11) Coin Gecko. https://www.coingecko.com/en/exchanges/decentralized.
- (12) DeFiLlama. https://defillama.com/chains.
- Shah et al. (2023) Shah, K.; Lathiya, D.; Lukhi, N.; Parmar, K.; Sanghvi, H. A systematic review of decentralized finance protocols. International Journal of Intelligent Networks 2023, 4, 171–181.
- Bartoletti et al. (2022) Bartoletti, M.; Chiang, J.H.Y.; Lluch-Lafuente, A. A theory of automated market makers in DeFi. Logical Methods in Computer Science 2022, 18, 12.
- Brönnimann et al. (2024) Brönnimann, W.; Egloff, P.; Krabichler, T. Automated market makers and their implications for liquidity providers. Digital Finance 2024, 6, 573–604.
- Platt et al. (2020) Platt, M.; Pierangeli, F.; Livan, G.; Righi, S. Facilitating the Decentralised Exchange of Cryptocurrencies in an Order-Driven Market. In Proceedings of the 2020 2nd Conference on Blockchain Research & Applications for Innovative Networks and Services (BRAINS), 2020, pp. 30–34.
- Warren and Bandeali (2017) Warren, W.; Bandeali, A. 0x: An open protocol for decentralized exchange on the Ethereum blockchain. Technical report, 2017.
- Takemiya (2023) Takemiya, M. ALT: Aggregate Liquidity Technology. In Proceedings of the 2023 IEEE International Conference on Blockchain and Cryptocurrency (ICBC), 2023, pp. 1–6.
- Corbet et al. (2019) Corbet, S.; Lucey, B.; Urquhart, A.; Yarovaya, L. Cryptocurrencies as a financial asset: A systematic analysis. International Review of Financial Analysis 2019, 62, 182–199.
- Makarov and Schoar (2020) Makarov, I.; Schoar, A. Trading and arbitrage in cryptocurrency markets. Journal of Financial Economics 2020, 135, 293–319.
- Fang et al. (2022) Fang, F.; Ventre, C.; Basios, M.; Kanthan, L.; Martinez-Rego, D.; Wu, F.; Li, L. Cryptocurrency trading: a comprehensive survey. Financial Innovation 2022, 8, 13.
- Aleti and Mizrach (2021) Aleti, S.; Mizrach, B. Bitcoin spot and futures market microstructure. Journal of Futures Markets 2021, 41, 194–225.
- Koker and Koutmos (2020) Koker, T.E.; Koutmos, D. Cryptocurrency Trading Using Machine Learning. Journal of Risk and Financial Management 2020, 13.
- Carol Alexander and Kaeck (2022) Carol Alexander, D.F.H.; Kaeck, A. The Role of Binance in Bitcoin Volatility Transmission. Applied Mathematical Finance 2022, 29, 1–32.
- Fassas et al. (2020) Fassas, A.P.; Papadamou, S.; Koulis, A. Price discovery in bitcoin futures. Research in International Business and Finance 2020, 52, 101116.
- Wątorek et al. (2021) Wątorek, M.; Drożdż, S.; Kwapień, J.; Minati, L.; Oświęcimka, P.; Stanuszek, M. Multiscale characteristics of the emerging global cryptocurrency market. Physics Reports 2021, 901, 1–82.
- Dimpfl and Peter (2021) Dimpfl, T.; Peter, F.J. Nothing but noise? Price discovery across cryptocurrency exchanges. Journal of Financial Markets 2021, 54, 100584.
- James (2022) James, N. Evolutionary correlation, regime switching, spectral dynamics and optimal trading strategies for cryptocurrencies and equities. Physica D 2022, 434, 133262.
- James and Menzies (2023) James, N.; Menzies, M. Collective Dynamics, Diversification and Optimal Portfolio Construction for Cryptocurrencies. Entropy 2023, 25.
- Nguyen et al. (2023) Nguyen, A.P.N.; Mai, T.T.; Bezbradica, M.; Crane, M. Volatility and returns connectedness in cryptocurrency markets: Insights from graph-based methods. Physica A 2023, 632.
- Takaishi (2018) Takaishi, T. Statistical properties and multifractality of Bitcoin. Physica A 2018, 506, 507–519.
- da Silva Filho et al. (2018) da Silva Filho, A.C.; Maganini, N.D.; de Almeida, E.F. Multifractal analysis of Bitcoin market. Physica A 2018, 512, 954–967.
- Stavroyiannis et al. (2019) Stavroyiannis, S.; Babalos, V.; Bekiros, S.; Lahmiri, S.; Uddin, G.S. The high frequency multifractal properties of Bitcoin. Physica A 2019, 520, 62–71.
- Takaishi and Adachi (2020) Takaishi, T.; Adachi, T. Market efficiency, liquidity, and multifractality of Bitcoin: A dynamic study. Asia-Pacific Financial Markets 2020, 27, 145–154.
- Mensi et al. (2019) Mensi, W.; Lee, Y.J.; Al-Yahyaee, K.H.; Sensoy, A.; Yoon, S.M. Intraday downward/upward multifractality and long memory in Bitcoin and Ethereum markets: An asymmetric multifractal detrended fluctuation analysis. Finance Research Letters 2019, 31, 19–25.
- Han et al. (2020) Han, Q.; Wu, J.; Zheng, Z. Long-range dependence, multi-fractality and volume-return causality of ether market. Chaos 2020, 30, 011101.
- Kakinaka and Umeno (2022) Kakinaka, S.; Umeno, K. Cryptocurrency market efficiency in short- and long-term horizons during COVID-19: An asymmetric multifractal analysis approach. Finance Research Letters 2022, 46, 102319.
- Ali et al. (2024) Ali, H.; Aftab, M.; Aslam, F.; Ferreira, P. Inner Multifractal Dynamics in the Jumps of Cryptocurrency and Forex Markets. Fractal and Fractional 2024, 8.
- Capponi and Jia (2021) Capponi, A.; Jia, R. The adoption of blockchain-based decentralized exchanges. arXiv preprint arXiv:2103.08842 2021.
- Lo and Medda (2021) Lo, Y.C.; Medda, F. Uniswap and the Emergence of the Decentralized Exchange. Journal of financial market infrastructures 2021, 10, 1–25.
- Alexander et al. (2023) Alexander, C.; Chen, X.; Deng, J.; Fu, Q. Impacts of Protocol Updates on Uniswap Decentralized Crypto Exchanges. Available at SSRN 4495589 2023.
- Victor and Weintraud (2021) Victor, F.; Weintraud, A.M. Detecting and quantifying wash trading on decentralized cryptocurrency exchanges. In Proceedings of the Proceedings of the Web Conference 2021, 2021, pp. 23–32.
- Gan et al. (2022) Gan, R.; Wang, L.; Ruan, X.; Lin, X. Understanding Flash-Loan-based Wash Trading. In Proceedings of the Proceedings of the 4th ACM Conference on Advances in Financial Technologies, 2022, pp. 74–88.
- Gan et al. (2024) Gan, R.; Wang, L.; Xue, L.; Lin, X. Exposing Stealthy Wash Trading on Automated Market Maker Exchanges. ACM Transactions on Internet Technology 2024, 24, 1–30.
- Wang et al. (2022) Wang, Y.; Chen, Y.; Deng, S.; Wattenhofer, R. Cyclic Arbitrage in Decentralized Exchange Markets. In Proceedings of the WWW ’22: Companion Proceedings of the Web Conference 2022, 2022.
- Adams et al. (2023) Adams, A.; Chan, B.Y.; Markovich, S.; Wan, X. Don’t Let MEV Slip: The Costs of Swapping on the Uniswap Protocol. arXiv preprint arXiv:2309.13648 2023.
- Capponi et al. (2024) Capponi, A.; Jia, R.; Yu, S. Price discovery on decentralized exchanges. Available at SSRN 4236993 2024.
- Hansson (2024) Hansson, M. Price Discovery in Constant Product Markets. Available at SSRN 4582649 2024.
- Uni (2024) Uniswap’s Universal Router for NFT and ERC20 swapping. https://github.com/Uniswap/universal-router, 2024.
- (50) Uniswap DEX. https://app.uniswap.org.
- (51) Networks on Uniswap. https://support.uniswap.org/hc/en-us/articles/14569415293325-Networks-on-Uniswap.
- Uniswapv (2) Uniswap V2. https://docs.uniswap.org/contracts/v2/concepts/protocol-overview/how-uniswap-works.
- Uniswapv (3) Uniswap V3. https://blog.uniswap.org/uniswap-v3/.
- Uniswapv (4) Uniswap V4. https://docs.uniswap.org/contracts/v4/overview.
- (55) The developers guide to Uniswap. https://blog.oceanprotocol.com/the-developers-guide-to-uniswap-48fcf6e9ee1e.
- Bauer (2022) Bauer, D.P. ERC-20: Fungible Tokens. In Getting Started with Ethereum: A Step-by-Step Guide to Becoming a Blockchain Developer; Springer, 2022; pp. 17–48.
- Uniswapv (3) Uniswap pools. https://app.uniswap.org/explore/pools/.
- (58) Liquidity in Uv3 postion as a NFT. https://app.uniswap.org/nfts/collection/0xc36442b4a4522e871399cd717abdd847ab11fe88.
- (59) Ethereum block time. https://ethereum.org/en/developers/docs/blocks/.
- Mantegna and Stanley (1995) Mantegna, R.N.; Stanley, H.E. Scaling behaviour in the dynamics of an economic index. Nature 1995, 376, 46–49.
- Gopikrishnan et al. (1999) Gopikrishnan, P.; Plerou, V.; Nunes Amaral, L.A.; Meyer, M.; Stanley, H.E. Scaling of the distribution of fluctuations of financial market indices. Physical Review E 1999, 60, 5305–5316.
- Plerou et al. (1999) Plerou, V.; Gopikrishnan, P.; Rosenow, B.; Nunes Amaral, L.A.; Stanley, H.E. Universal and nonuniversal properties of cross correlations in financial time series. Physical Review Letters 1999, 83, 1471–1474.
- Ausloos (2000) Ausloos, M. Statistical physics in foreign exchange currency and stock markets. Physica A 2000, 285, 48–65.
- (64) Binance. https://www.binance.com/.
- Mandelbrot (1963) Mandelbrot, B. The Variation of Certain Speculative Prices. The Journal of Business 1963, 36, 394–419.
- Cont (2001) Cont, R. Empirical properties of asset returns: stylized facts and statistical issues. Quantitative Finance 2001, 1, 223–236.
- Dhesi et al. (2021) Dhesi, G.; Shakeel, B.; Ausloos, M. Modelling and forecasting the kurtosis and returns distributions of financial markets: irrational fractional Brownian motion model approach. Annals of Operations Research 2021, 299, 1397–1410.
- Drożdż et al. (2007) Drożdż, S.; Forczek, M.; Kwapień, J.; Oświęcimka, P.; Rak, R. Stock market return distributions: From past to present. Physica A 2007, 383, 59–64.
- Gębarowski et al. (2019) Gębarowski, R.; Oświęcimka, P.; Wątorek, M.; Drożdż, S. Detecting correlations and triangular arbitrage opportunities in the Forex by means of multifractal detrended cross-correlations analysis. Nonlinear Dynamics 2019, 98, 2349–2364.
- Begušić et al. (2018) Begušić, S.; Kostanjčar, Z.; Eugene Stanley, H.; Podobnik, B. Scaling properties of extreme price fluctuations in Bitcoin markets. Physica A 2018, 510, 400–406.
- James et al. (2021) James, N.; Menzies, M.; Chan, J. Changes to the extreme and erratic behaviour of cryptocurrencies during COVID-19. Physica A 2021, 565, 125581.
- Ghosh et al. (2023) Ghosh, B.; Bouri, E.; Wee, J.B.; Zulfiqar, N. Return and volatility properties: Stylized facts from the universe of cryptocurrencies and NFTs. Research in International Business and Finance 2023, 65, 101945.
- Szydło et al. (2024) Szydło, P.; Wątorek, M.; Kwapień, J.; Drożdż, S. Characteristics of price related fluctuations in non-fungible token (NFT) market. Chaos 2024, 34, 013108.
- Wątorek et al. (2024) Wątorek, M.; Szydło, P.; Kwapień, J.; Drożdż, S. Correlations versus noise in the NFT market. Chaos 2024, 34, 073112.
- Wątorek et al. (2021) Wątorek, M.; Kwapień, J.; Drożdż, S. Financial return distributions: Past, present, and COVID-19. Entropy 2021, 23.
- Drożdż et al. (2010) Drożdż, S.; Kwapień, J.; Oświęcimka, P.; Rak, R. The foreign exchange market: return distributions, multifractality, anomalous multifractality and the Epps effect. New Journal of Physics 2010, 12, 105003.
- Drożdż et al. (2018) Drożdż, S.; Gębarowski, R.; Minati, L.; Oświęcimka, P.; Wątorek, M. Bitcoin market route to maturity? Evidence from return fluctuations, temporal correlations and multiscaling effects. Chaos 2018, 28, 071101.
- Drożdż et al. (2019) Drożdż, S.; Minati, L.; Oświęcimka, P.; Stanuszek, M.; Wątorek, M. Signatures of the crypto-currency market decoupling from the Forex. Future Internet 2019, 11.
- Drożdż et al. (2020) Drożdż, S.; Kwapień, J.; Oświęcimka, P.; Stanisz, T.; Wątorek, M. Complexity in economic and social systems: cryptocurrency market at around COVID-19. Entropy 2020, 22, 1043.
- (80) Record transaction on ETH/USDT Uniswap v3 liquidity pool. https://etherscan.io/tx/0x28bcfb342781641e84ab5ea821e4d2e3ecfdd0852e22460e1c64b33bcc698ae0.
- Rak et al. (2013) Rak, R.; Drożdż, S.; Kwapień, J.; Oświęcimka, P. Stock returns versus trading volume: Is the correspondence more general? Acta Physica Polonica B 2013, 44, 2035–2050.
- Yamani (2023) Yamani, E. Return–volume nexus in financial markets: A survey of research. Research in International Business and Finance 2023, 65, 101910.
- Gabaix et al. (2003) Gabaix, X.; Gopikrishnan, P.; Plerou, V.; Stanley, H.E. A theory of power-law distributions in financial market fluctuations. Nature 2003, 423, 267–270.
- Plerou et al. (2004) Plerou, V.; Gopikrishnan, P.; Gabaix, X.; Stanley, H.E. On the origin of power-law fluctuations in stock prices. Quantitative Finance 2004, 4, 11–15.
- Naeem et al. (2020) Naeem, M.; Saleem, K.; Ahmed, S.; Muhammad, N.; Mustafa, F. Extreme return-volume relationship in cryptocurrencies: Tail dependence analysis. Cogent Economics & Finance 2020, 8, 1834175.
- Drożdż et al. (2023) Drożdż, S.; Kwapień, J.; Wątorek, M. What is mature and what is still emerging in the cryptocurrency market? Entropy 2023, 25.
- Laherrère and Sornette (1998) Laherrère, J.; Sornette, D. Stretched exponential distributions in nature and economy: "fat tails" with characteristic scales. The European Physical Journal B 1998, 2, 525–539.
- Bouchaud (2010) Bouchaud, J.P. Price impact. In Encyclopedia of Quantitative Finance; Cambridge University Press, 2010; pp. 1–6.
- M. Wiliński and Hamill (2015) M. Wiliński, Wei Cui, A.B.; Hamill, P. An analysis of price impact functions of individual trades on the London stock exchange. Quantitative Finance 2015, 15, 1727–1735.
- Kutner and Świtała (2004) Kutner, R.; Świtała, F. Remarks on the possible universal mechanism of the non-linear long-term autocorrelations in financial time-series. Physica A 2004, 344, 244–251. Applications of Physics in Financial Analysis 4 (APFA4).
- Rak et al. (2007) Rak, R.; Drożdż, S.; Kwapień, J. Nonextensive statistical features of the Polish stock market fluctuations. Physica A 2007, 374, 315–324.
- Klamut and Gubiec (2021) Klamut, J.; Gubiec, T. Continuous time random walk with correlated waiting times. The crucial role of inter-trade times in volatility clustering. Entropy 2021, 23.
- Kwapień et al. (2023) Kwapień, J.; Blasiak, P.; Drożdż, S.; Oświęcimka, P. Genuine multifractality in time series is due to temporal correlations. Physical Review E 2023, 107, 034139.
- Ausloos and Ivanova (2002) Ausloos, M.; Ivanova, K. Multifractal nature of stock exchange prices. Computer Physics Communications 2002, 147, 582–585.
- Jiang et al. (2019) Jiang, Z.Q.; Xie, W.J.; Zhou, W.X.; Sornette, D. Multifractal analysis of financial markets: a review. Reports on Progress in Physics 2019, 82, 125901.
- Kutner et al. (2019) Kutner, R.; Ausloos, M.; Grech, D.; Matteo, T.D.; Schinckus, C.; Stanley, H.E. Econophysics and sociophysics: Their milestones & challenges. Physica A 2019, 516, 240–253.
- Kwapień et al. (2022) Kwapień, J.; Wątorek, M.; Bezbradica, M.; Crane, M.; Tan Mai, T.; Drożdż, S. Analysis of inter-transaction time fluctuations in the cryptocurrency market. Chaos 2022, 32, 083142.
- Wątorek et al. (2022) Wątorek, M.; Kwapień, J.; Drożdż, S. Multifractal cross-correlations of bitcoin and ether trading characteristics in the post-COVID-19 time. Future Internet 2022, 14.
- Oświęcimka et al. (2014) Oświęcimka, P.; Drożdż, S.; Forczek, M.; Jadach, S.; Kwapień, J. Detrended cross-correlation analysis consistently extended to multifractality. Physical Review E 2014, 89, 023305.
- Podobnik and Stanley (2008) Podobnik, B.; Stanley, H.E. Detrended cross-correlation analysis: A new method for analyzing two nonstationary time series. Physical Review Letters 2008, 100, 1–4.
- Zhou (2008) Zhou, W.X. Multifractal detrended cross-correlation analysis for two nonstationary signals. Physical Review E 2008, 77, 066211.
- Kantelhardt et al. (2002) Kantelhardt, J.W.; Zschiegner, S.A.; Koscielny-Bunde, E.; Havlin, S.; Bunde, A.; Stanley, H.E. Multifractal detrended fluctuation analysis of nonstationary time series. Physica A 2002, 316, 87–114.
- Peng et al. (1994) Peng, C.K.; Buldyrev, S.V.; Havlin, S.; Simons, M.; Stanley, H.E.; Goldberger, A.L. Mosaic organization of DNA nucleotides. Physical Review E 1994, 49, 1685–1689.
- Oświęcimka et al. (2013) Oświęcimka, P.; Drożdż, S.; Kwapień, J.; Górski, A. Effect of detrending on multifractal characteristics. Acta Physica Polonica A 2013, 123, 597–603.
- Barabasi and Vicsek (1991) Barabasi, A.L.; Vicsek, T. Multifractality of self-affine fractals. Physical Review A 1991, 44, 2730–2733.
- Hurst (1951) Hurst, H.E. Long-term storage capacity of reservoirs. Transactions of the American society of civil engineers 1951, 116, 770–799.
- Halsey et al. (1986) Halsey, T.C.; Jensen, M.H.; Kadanoff, L.P.; Procaccia, I.; Shraimant, B.I. Fractal measures and their singularities: The characterization of strange sets. Physical Review A 1986, 33, 1141–1151.
- Kwapień et al. (2015) Kwapień, J.; Oświęcimka, P.; Drożdż, S. Detrended fluctuation analysis made flexible to detect range of cross-correlated fluctuations. Physical Review E 2015, 92, 052815.
- Zebende (2011) Zebende, G. DCCA cross-correlation coefficient: Quantifying level of cross-correlation. Physica A 2011, 390, 614–618.
- Kwapień et al. (2017) Kwapień, J.; Oświęcimka, P.; Forczek, M.; Drożdż, S. Minimum spanning tree filtering of correlations for varying time scales and size of fluctuations. Physical Review E 2017, 95, 052313.
- Drożdż et al. (2010) Drożdż, S.; Kwapień, J.; Oświęcimka, P.; Rak, R. Quantitative features of multifractal subtleties in time-series. EPL (Europhysics Letters) 2010, 88, 60003.
- Zhou (2009) Zhou, W.X. The components of empirical multifractality in financial returns. EPL (Europhysics Letters) 2009, 88, 28004.
- Carbone et al. (2004) Carbone, A.; Castelli, G.; Stanley, H. Time-dependent Hurst exponent in financial time series. Physica A 2004, 344, 267–271.
- Grech and Mazur (2004) Grech, D.; Mazur, Z. Can one make any crash prediction in finance using the local Hurst exponent idea? Physica A 2004, 336, 133–145.
- Garcin (2017) Garcin, M. Estimation of time-dependent Hurst exponents with variational smoothing and application to forecasting foreign exchange rates. Physica A 2017, 483, 462–479.
- Matos et al. (2008) Matos, J.A.; Gama, S.M.; Ruskin, H.J.; Sharkasi, A.A.; Crane, M. Time and scale Hurst exponent analysis for financial markets. Physica A 2008, 387, 3910–3915.
- Drożdż et al. (2018) Drożdż, S.; Kowalski, R.; Oświęcimka, P.; Rak, R.; Gębarowski, R. Dynamical variety of shapes in financial multifractality. Complexity 2018, 2018, 7015721.
- Matteo et al. (2005) Matteo, T.D.; Aste, T.; Dacorogna, M.M. Long-term memories of developed and emerging markets: Using the scaling analysis to characterize their stage of development. Journal of Banking & Finance 2005, 29, 827–851. Risk Measurement.
- Cajueiro and Tabak (2006) Cajueiro, D.O.; Tabak, B.M. Testing for predictability in equity returns for European transition markets. Economic Systems 2006, 30, 56–78.
- James (2021) James, N. Dynamics, behaviours, and anomaly persistence in cryptocurrencies and equities surrounding COVID-19. Physica A 2021, 570, 125831.
- James and Menzies (2022) James, N.; Menzies, M. Collective correlations, dynamics, and behavioural inconsistencies of the cryptocurrency market over time. Nonlinear Dynamics 2022, 107, 4001–4017.
- Ammy-Driss and Garcin (2023) Ammy-Driss, A.; Garcin, M. Efficiency of the financial markets during the COVID-19 crisis: Time-varying parameters of fractional stable dynamics. Physica A 2023, 609, 128335.
- Brouty and Garcin (2024) Brouty, X.; Garcin, M. Fractal properties, information theory, and market efficiency. Chaos, Solitons & Fractals 2024, 180, 114543.
- Drożdż and Oświęcimka (2015) Drożdż, S.; Oświęcimka, P. Detecting and interpreting distortions in hierarchical organization of complex time series. Physical Review E 2015, 91, 030902.
- Schreiber and Schmitz (2000) Schreiber, T.; Schmitz, A. Surrogate time series. Physica D 2000, 142, 346–382.
- Theiler and Prichard (1996) Theiler, J.; Prichard, D. Constrained-realization Monte-Carlo method for hypothesis testing. Physica D 1996, 94, 221–235.
- Grech and Pamuła (2013) Grech, D.; Pamuła, G. On the multifractal effects generated by monofractal signals. Physica A 2013, 392, 5845–5864.
- Zhou (2012) Zhou, W.X. Finite-size effect and the components of multifractality in financial volatility. Chaos, Solitons & Fractals 2012, 45, 147–155.
- Rak and Grech (2018) Rak, R.; Grech, D. Quantitative approach to multifractality induced by correlations and broad distribution of data. Physica A 2018, 508, 48–66.
- Gillemot et al. (2006) Gillemot, L.; Farmer, J.D.; Lillo, F. There’s more to volatility than volume. Quantitative finance 2006, 6, 371–384.
- Podobnik et al. (2009) Podobnik, B.; Horvatic, D.; Petersen, A.M.; Stanley, H.E. Cross-correlations between volume change and price change. Proceedings of the National Academy of Sciences 2009, 106, 22079–22084.
- Rak et al. (2015) Rak, R.; Drożdż, S.; Kwapień, J.; Oświęcimka, P. Detrended cross-correlations between returns, volatility, trading activity, and volume traded for the stock market companies. EPL (Europhysics Letters) 2015, 112, 48001.
- Arianos and Carbone (2009) Arianos, S.; Carbone, A. Cross-correlation of long-range correlated series. Journal of Statistical Mechanics 2009, 2009, P03037.
- Wątorek et al. (2019) Wątorek, M.; Drożdż, S.; Oświęcimka, P.; Stanuszek, M. Multifractal cross-correlations between the world oil and other financial markets in 2012–2017. Energy Economics 2019, 81, 874–885.
- Zhao et al. (2018) Zhao, L.; Li, W.; Fenu, A.; Podobnik, B.; Wang, Y.; Stanley, H.E. The q-dependent detrended cross-correlation analysis of stock market. Journal of Statistical Mechanics: Theory and Experiment 2018, 2018, 023402.