3D Characterization of Reattached Flow on an Airfoil with Finite-Span Synthetic Jet Flow Control
Nomenclature
| = | Wing span [\unit\milli] |
| = | Effective spanwise control length [\unit\milli] |
| = | Span of synthetic jet actuator array [\unit\milli] |
| = | Airfoil chord length [\unit\milli] |
| = | chord-based Reynolds number |
| = | Freestream velocity [\unit[per-mode=symbol]\per] |
| , , = | Chordwise, transverse, and spanwise coordinate [\unit\milli] |
| = | Chordwise separation point [\unit\milli] |
| = | Angle of attack [\unit] |
1 Introduction
Active flow control systems with synthetic jets can improve the aerodynamics of airfoils, particularly at low Reynolds numbers. These systems offer an efficient means of reattaching separated flows and recovering airfoils from stall conditions. Their lightweight design, power efficiency, and ease of integration make them particularly valuable for applications in aviation and wind turbines. Zero-net-mass-flux synthetic jet actuators (SJAs) have been studied extensively for their ability to enhance mixing between the freestream and the separated shear layer, facilitating flow reattachment [1, 2]. Additionally, synthetic jet flow control has achieved a high technology readiness level (TRL) of 7, validated through successful implementations in real flight tests [3, 4].
Active flow control systems using SJAs are commonly implemented in two configurations: finite-span slot-style SJAs or arrays of small-orifice discrete SJAs, both typically smaller than the span of the wing being controlled, resulting in three-dimensional flows. However, most studies assessing controlled flows over airfoils have relied on data from the midspan and the center of the SJA array. This can fail to capture the resultant flow field generated by finite-span actuators, which produce three-dimensional flows [5, 6].
Previous studies have investigated the effects of flow separation control on a stalled airfoil using an array of circular SJAs [7, 8, 9]. The three-dimensional nature of the flow field was characterized by visualizing the flow across multiple spanwise planes, along with quantitative measurements providing insights into the mean flow and flow dynamics. Additionally, orthogonal smoke flow visualizations in the streamwise-spanwise and spanwise-transverse planes were conducted with a horizontal smoke wire providing a complete understanding of the three-dimensionality of the mean flow. Across varying control parameters—blowing strength, actuation frequency, and duty cycle—the flow consistently exhibited similar three-dimensional characteristics.
This paper synthesizes prior studies to develop a comprehensive three-dimensional description of reattached flow over an airfoil controlled by finite-span SJA arrays. When applied to a longer-span wing, the flow field exhibits three distinct regions: a directly controlled region, an unaffected region, and a transitional zone between them. Through the integration of multiple visualizations and measurements from both discrete and slot-style SJAs, this work provides insights into the shear layer behavior. The analysis of reattached mean flow provides insight into the interactions between controlled and surrounding flows, demonstrating broad applicability across different SJA configurations.
2 Experimental Method
Wind tunnel tests were conducted on a NACA 0025 airfoil in the low-speed recirculating wind tunnel in the Department of Mechanical and Industrial Engineering at the University of Toronto. The aluminum wing has an aspect ratio of approximately 3, with a span of \unit\milli, and a chord length of \unit\milli. The wind tunnel was operated at a freestream velocity of \unit[per-mode = symbol]\per, resulting in a chord-based Reynolds number of . With the angle of attack set to \unit, flow separation occurs without reattachment, making the airfoil in a stalled state.
An array of 12 Murata MZB1001T02 microblower SJAs, located at 10.7% chord and spaced apart, is installed at the center of the wing, for a total effective span of \unit\milli. The SJAs ingest and expel fluid at a high frequency through nozzles and are flush-mounted beneath the airfoil surface. Prior tests have demonstrated their effectiveness in flow separation control [7, 8].
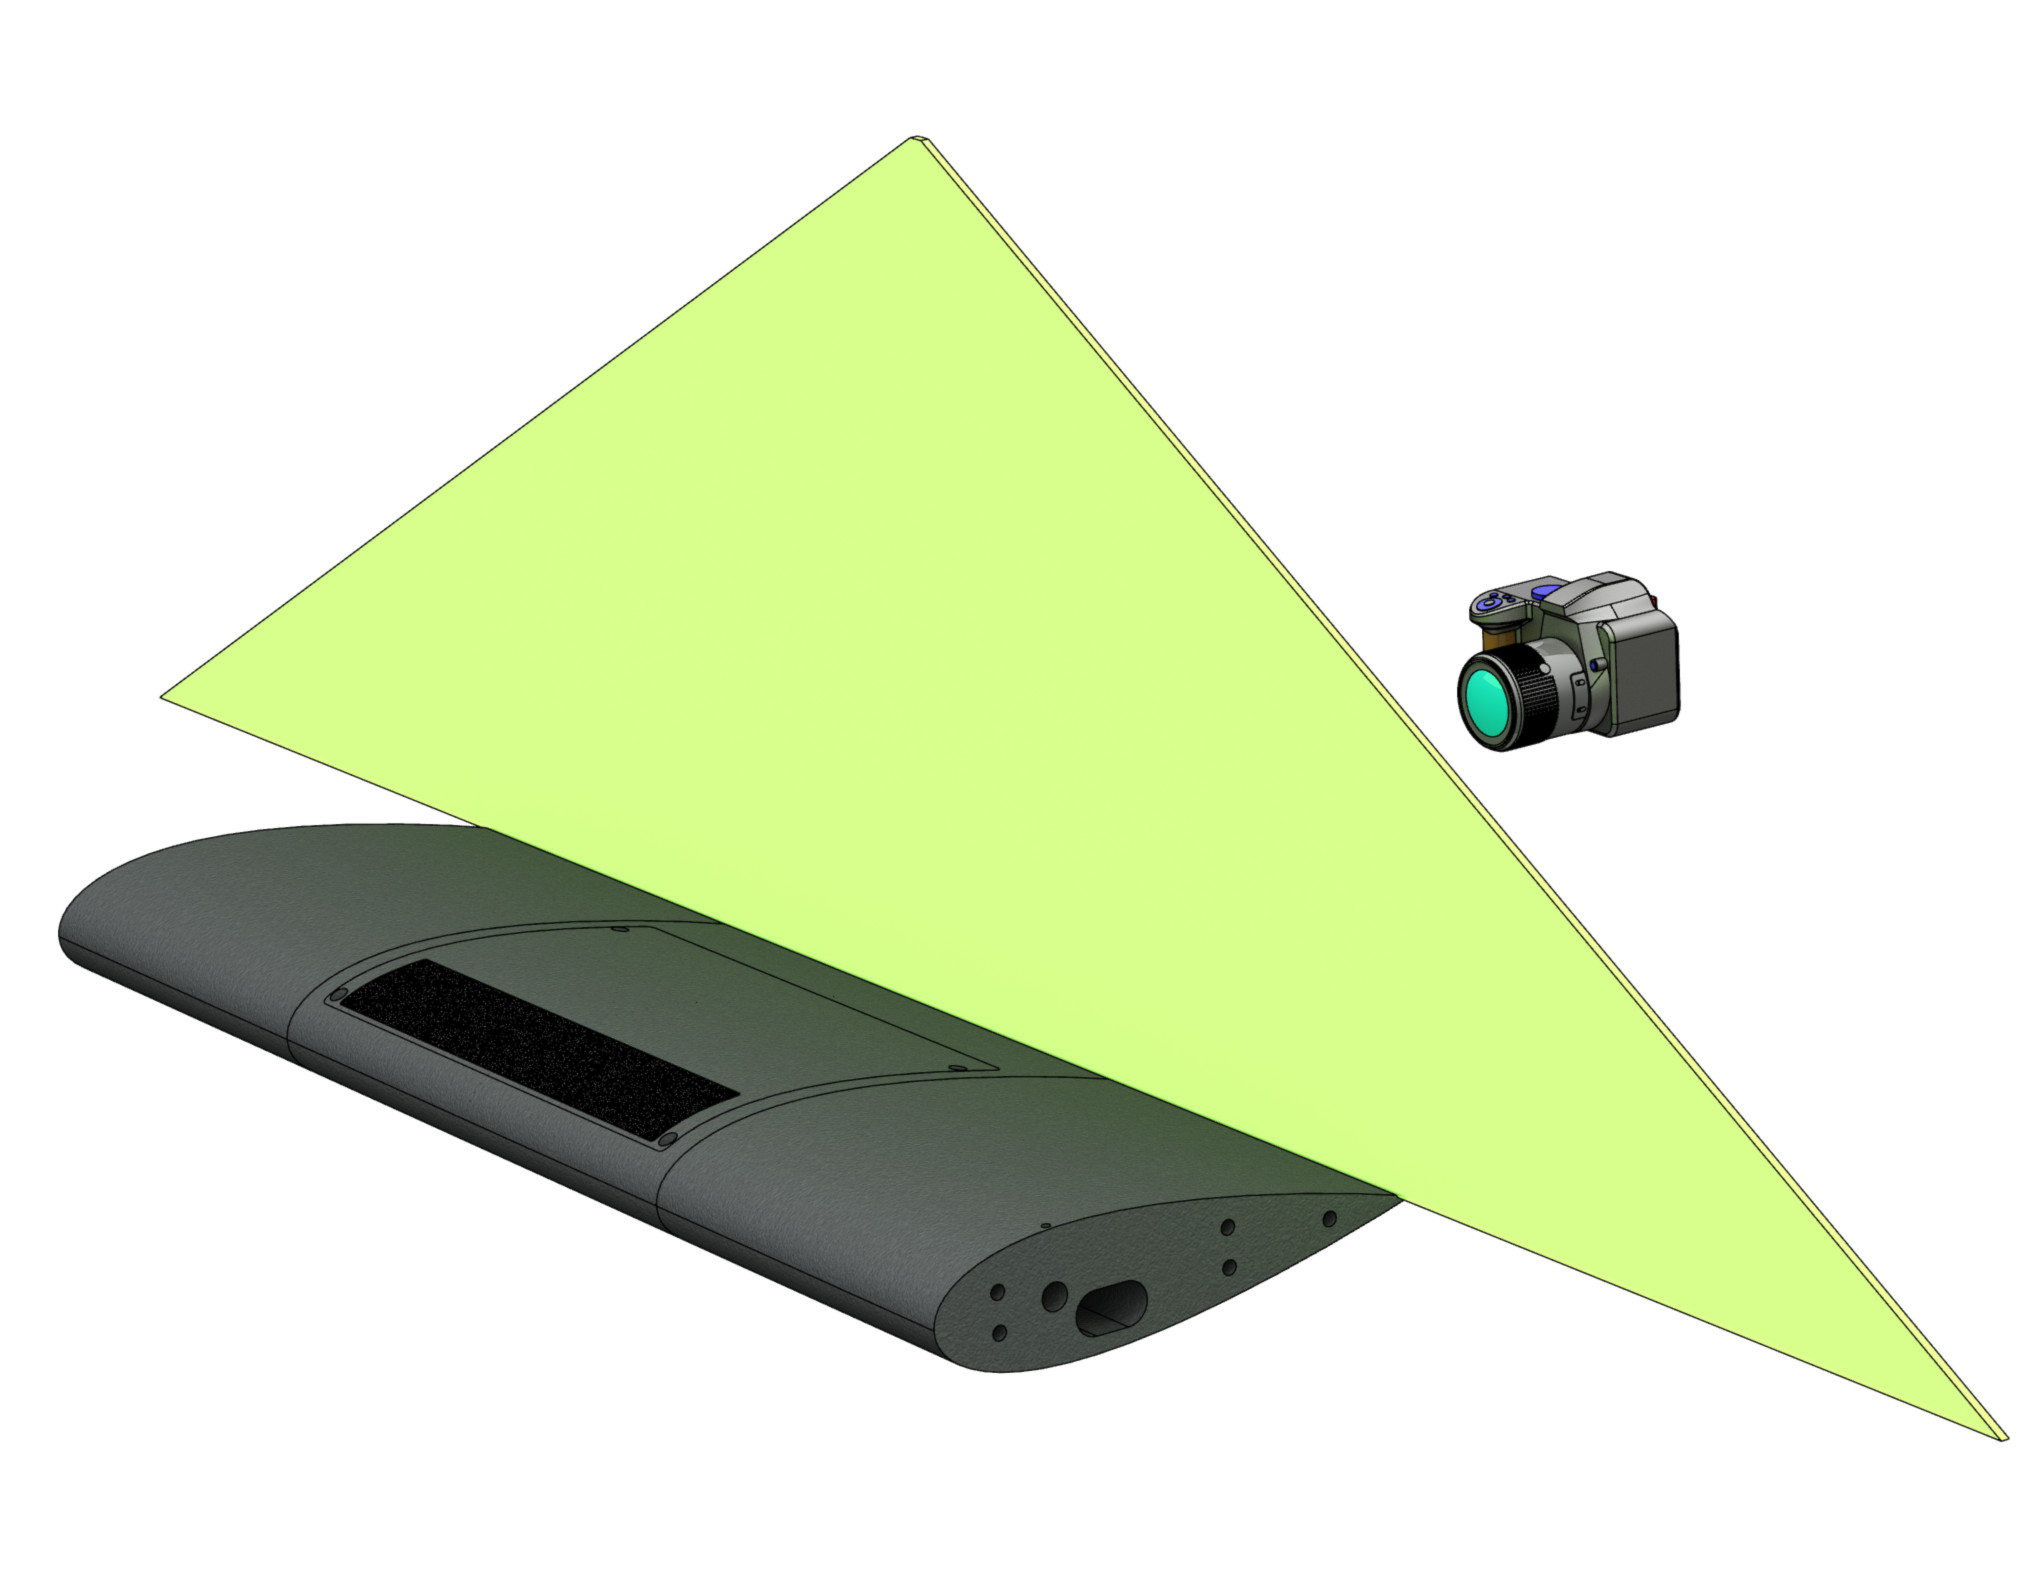
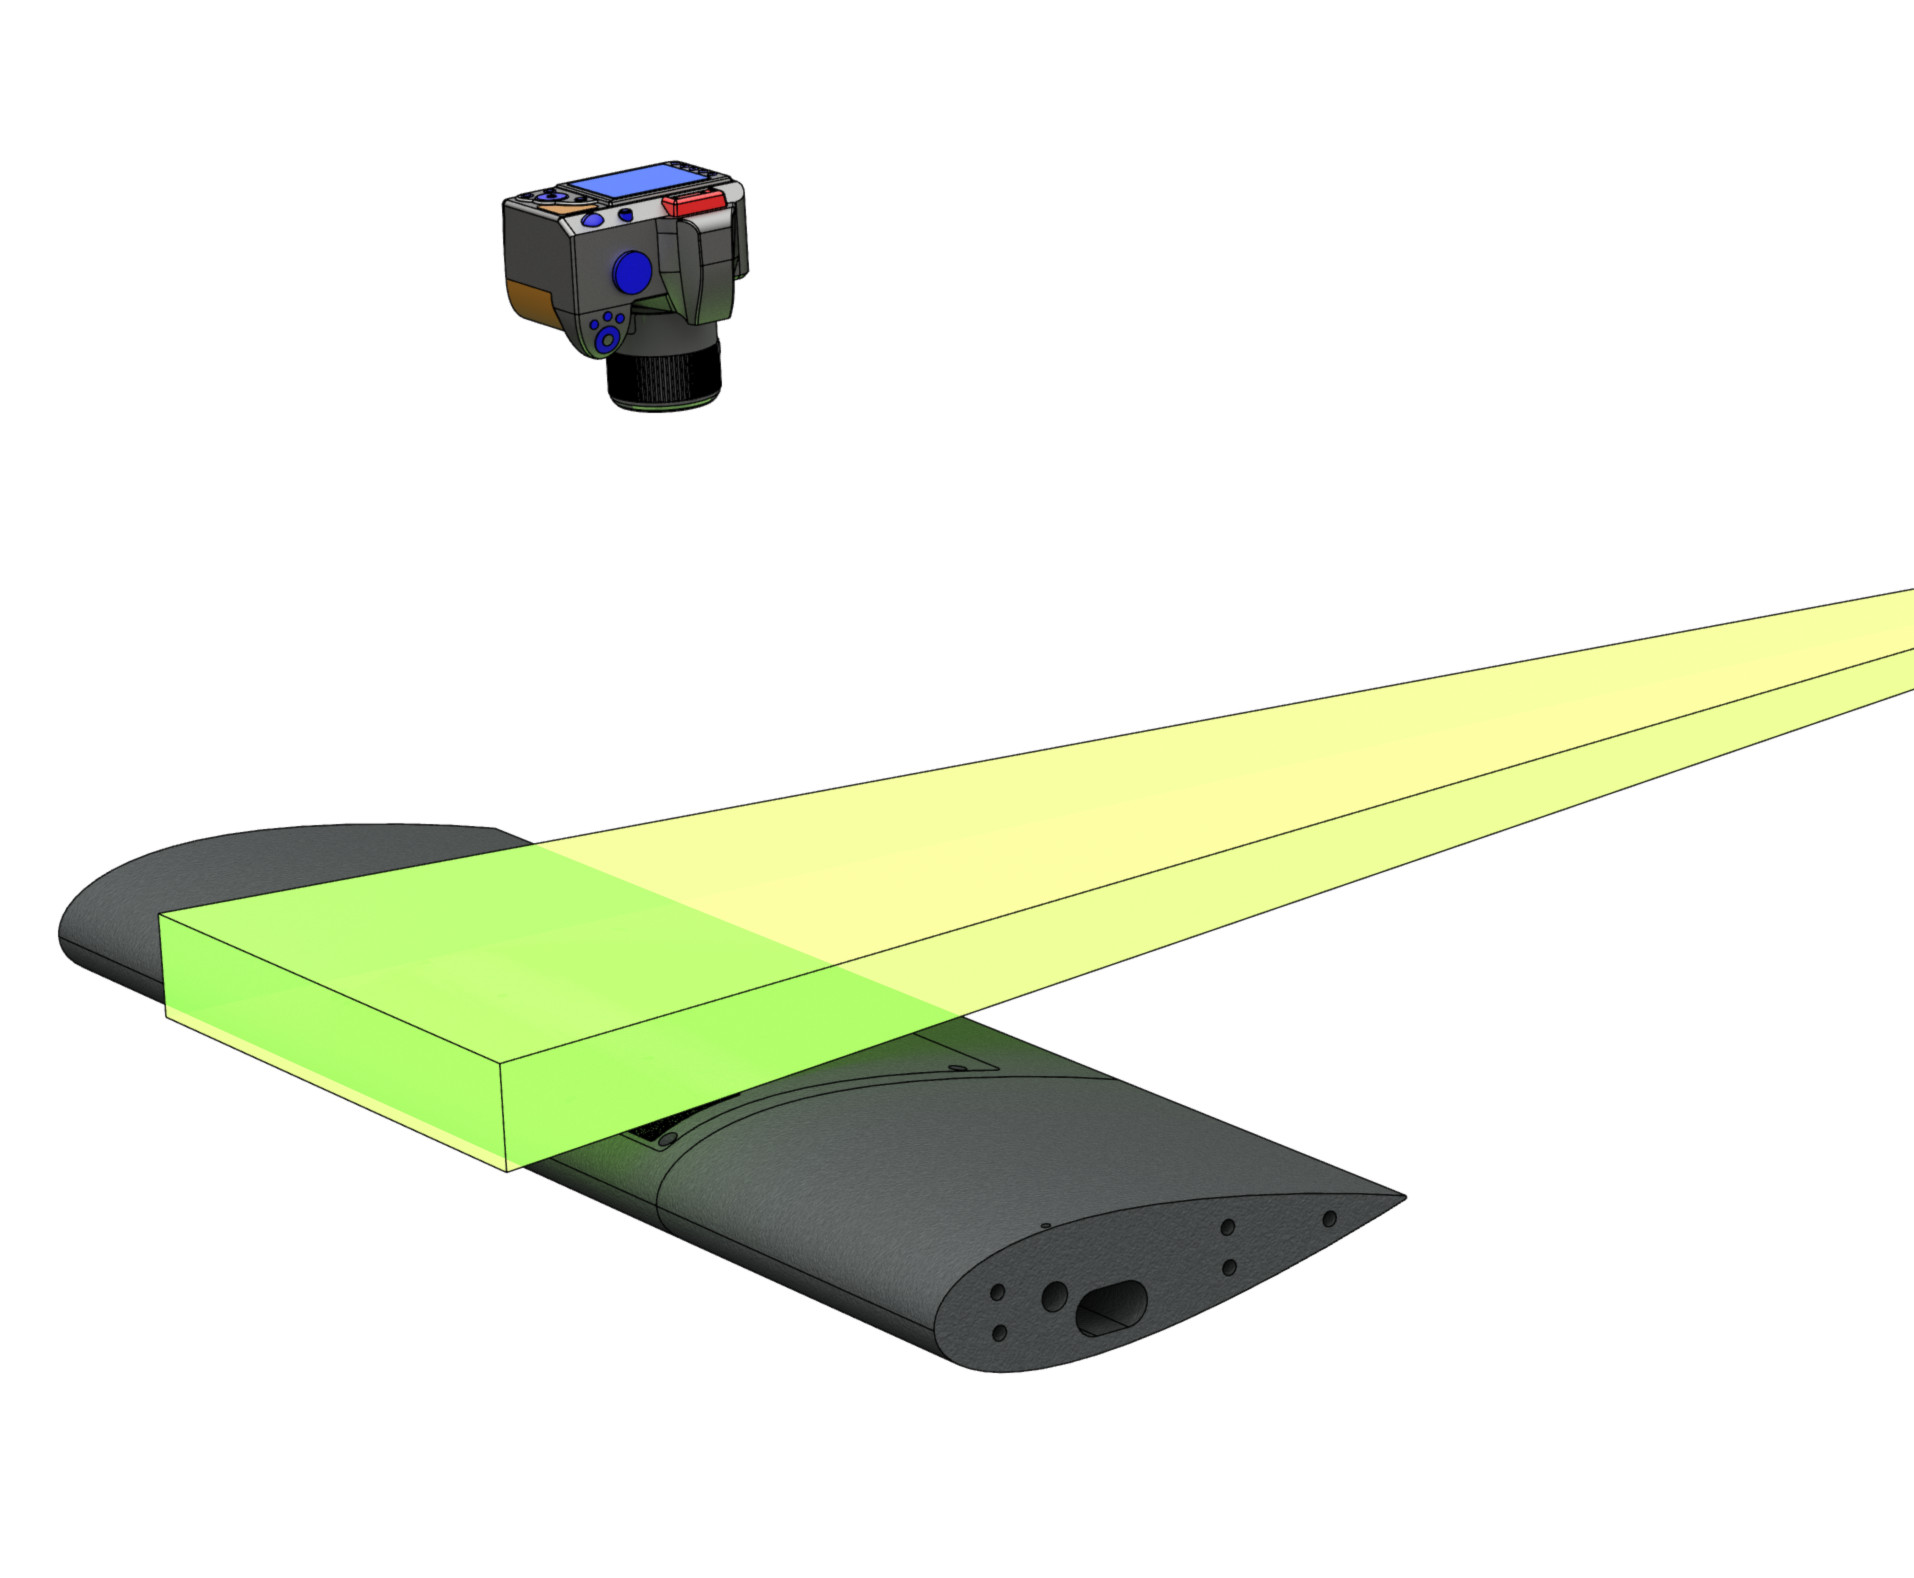
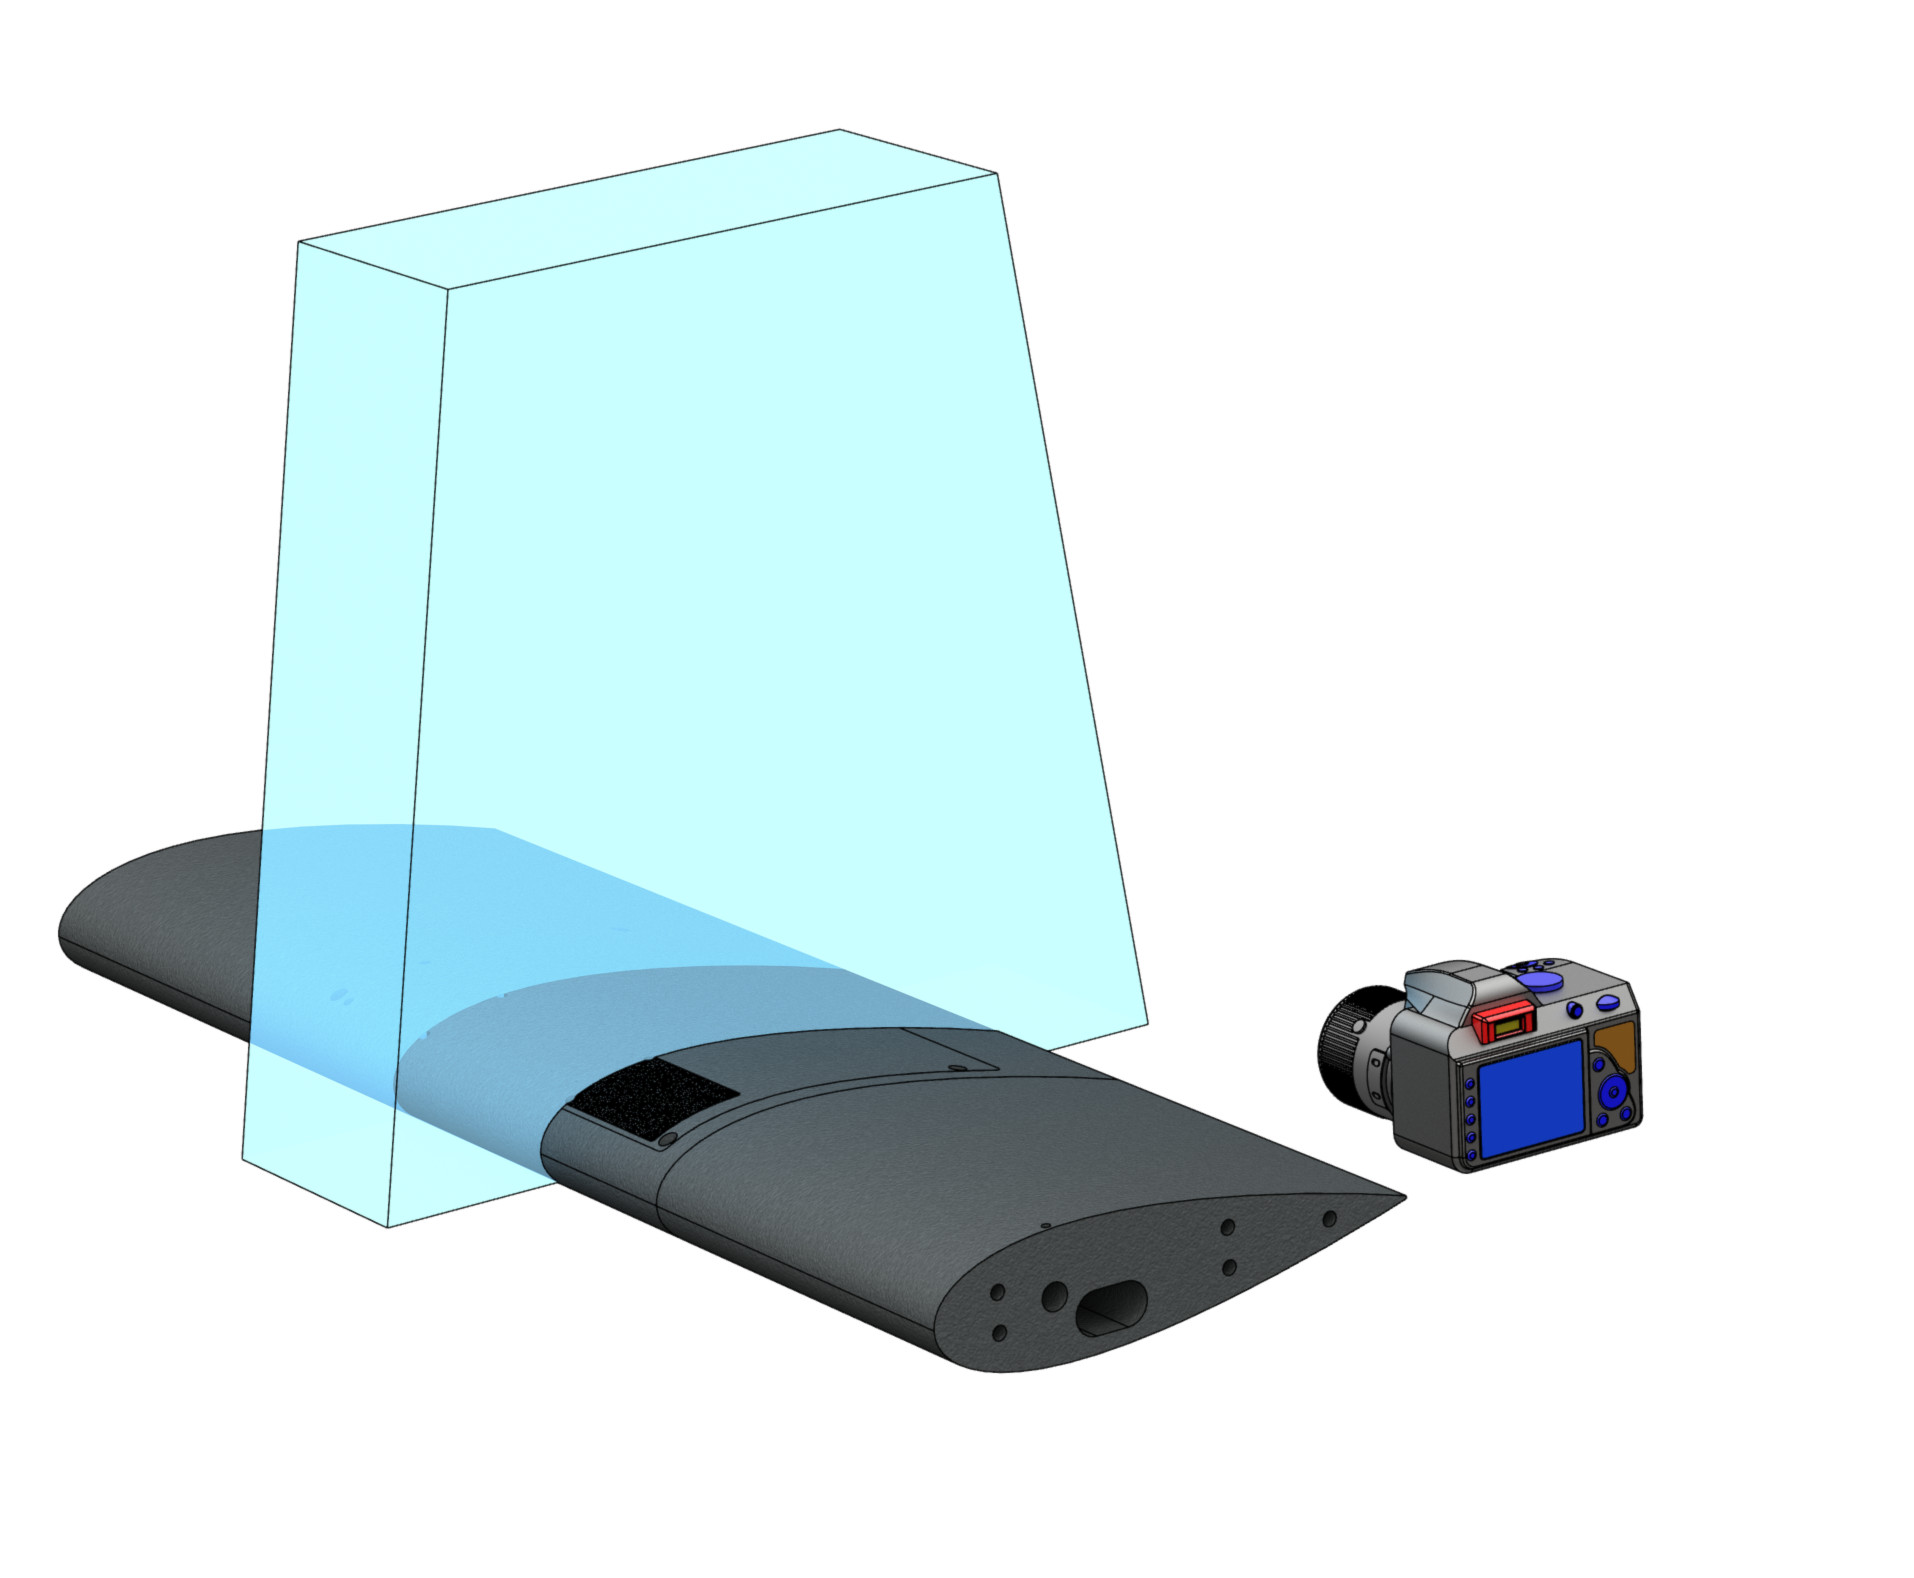
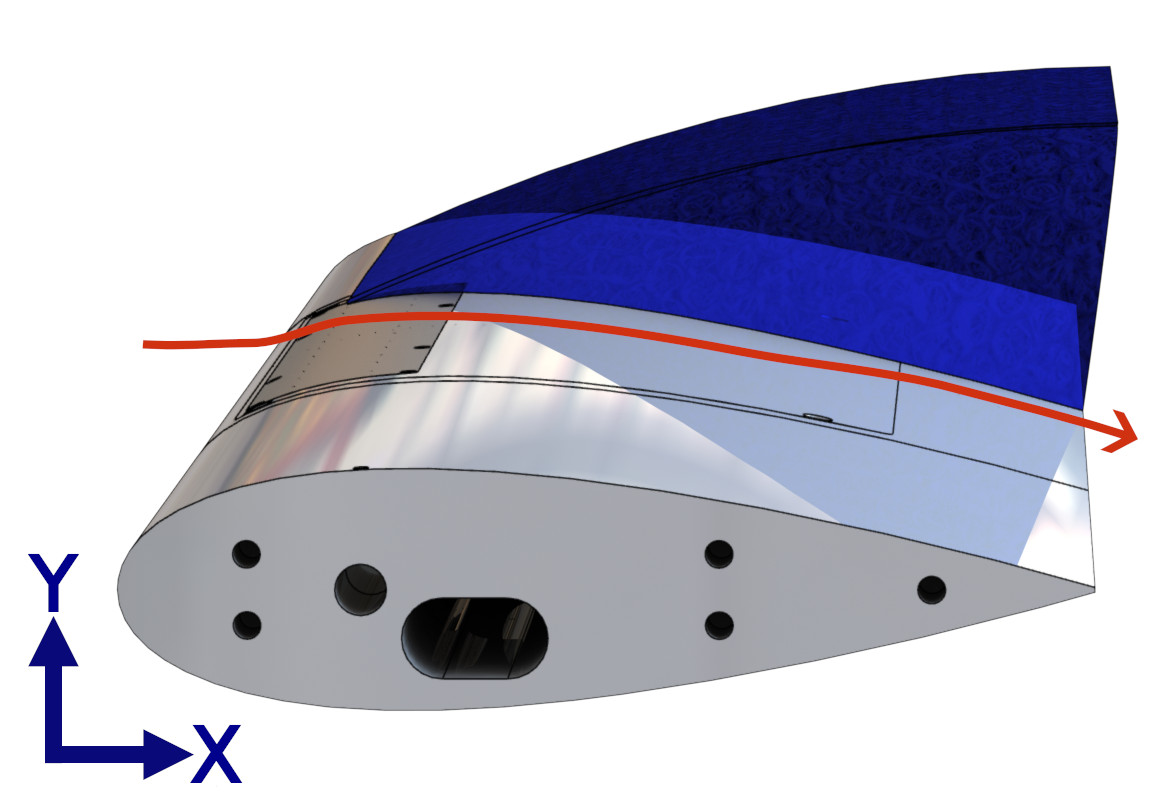
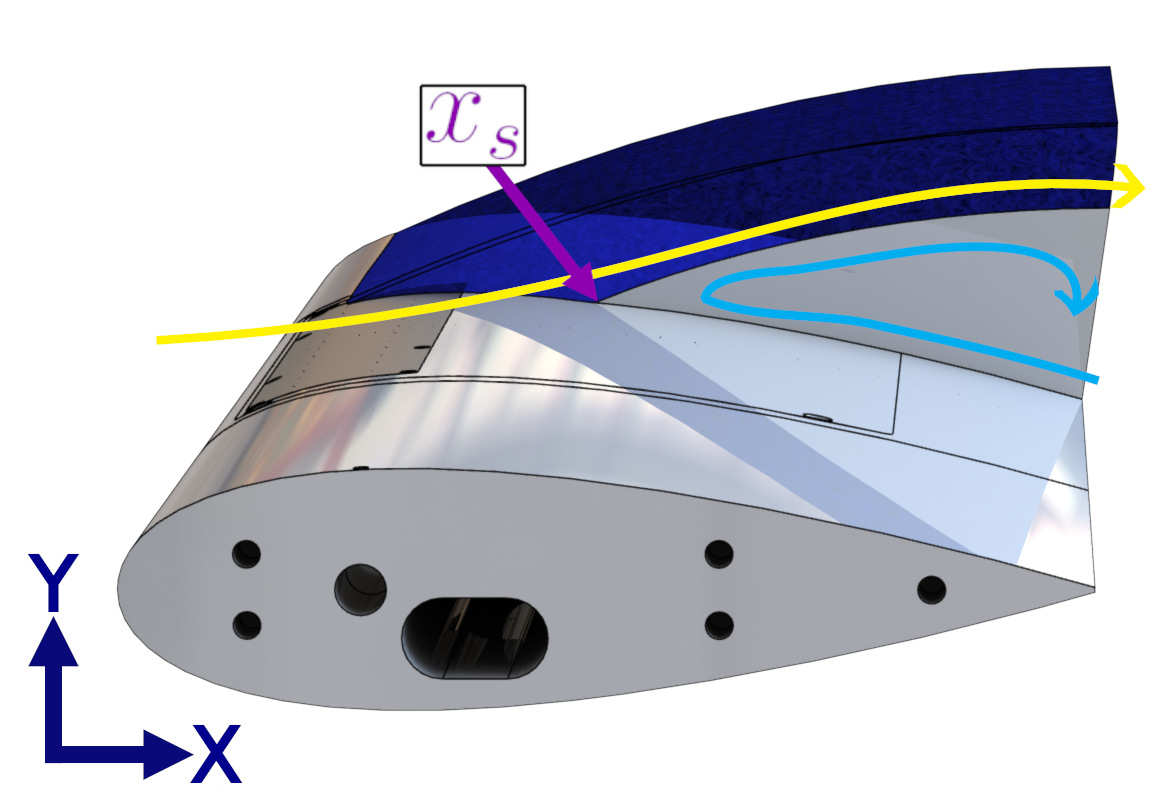
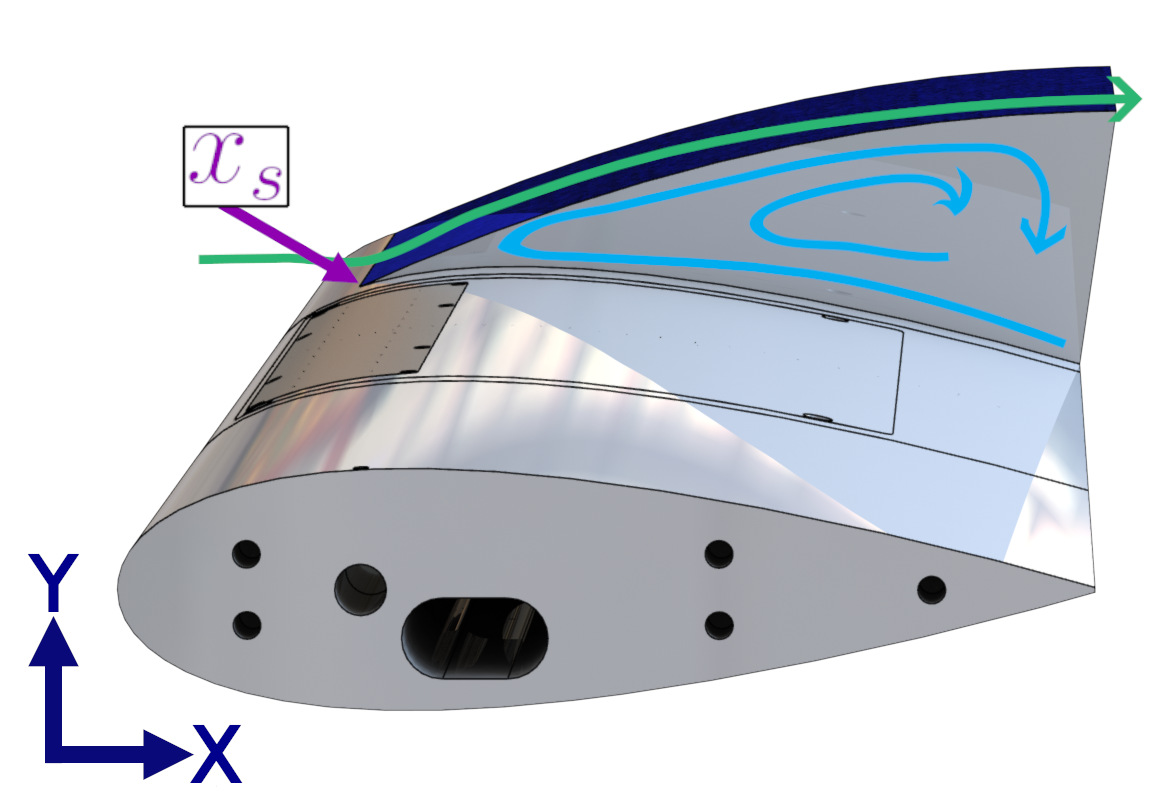
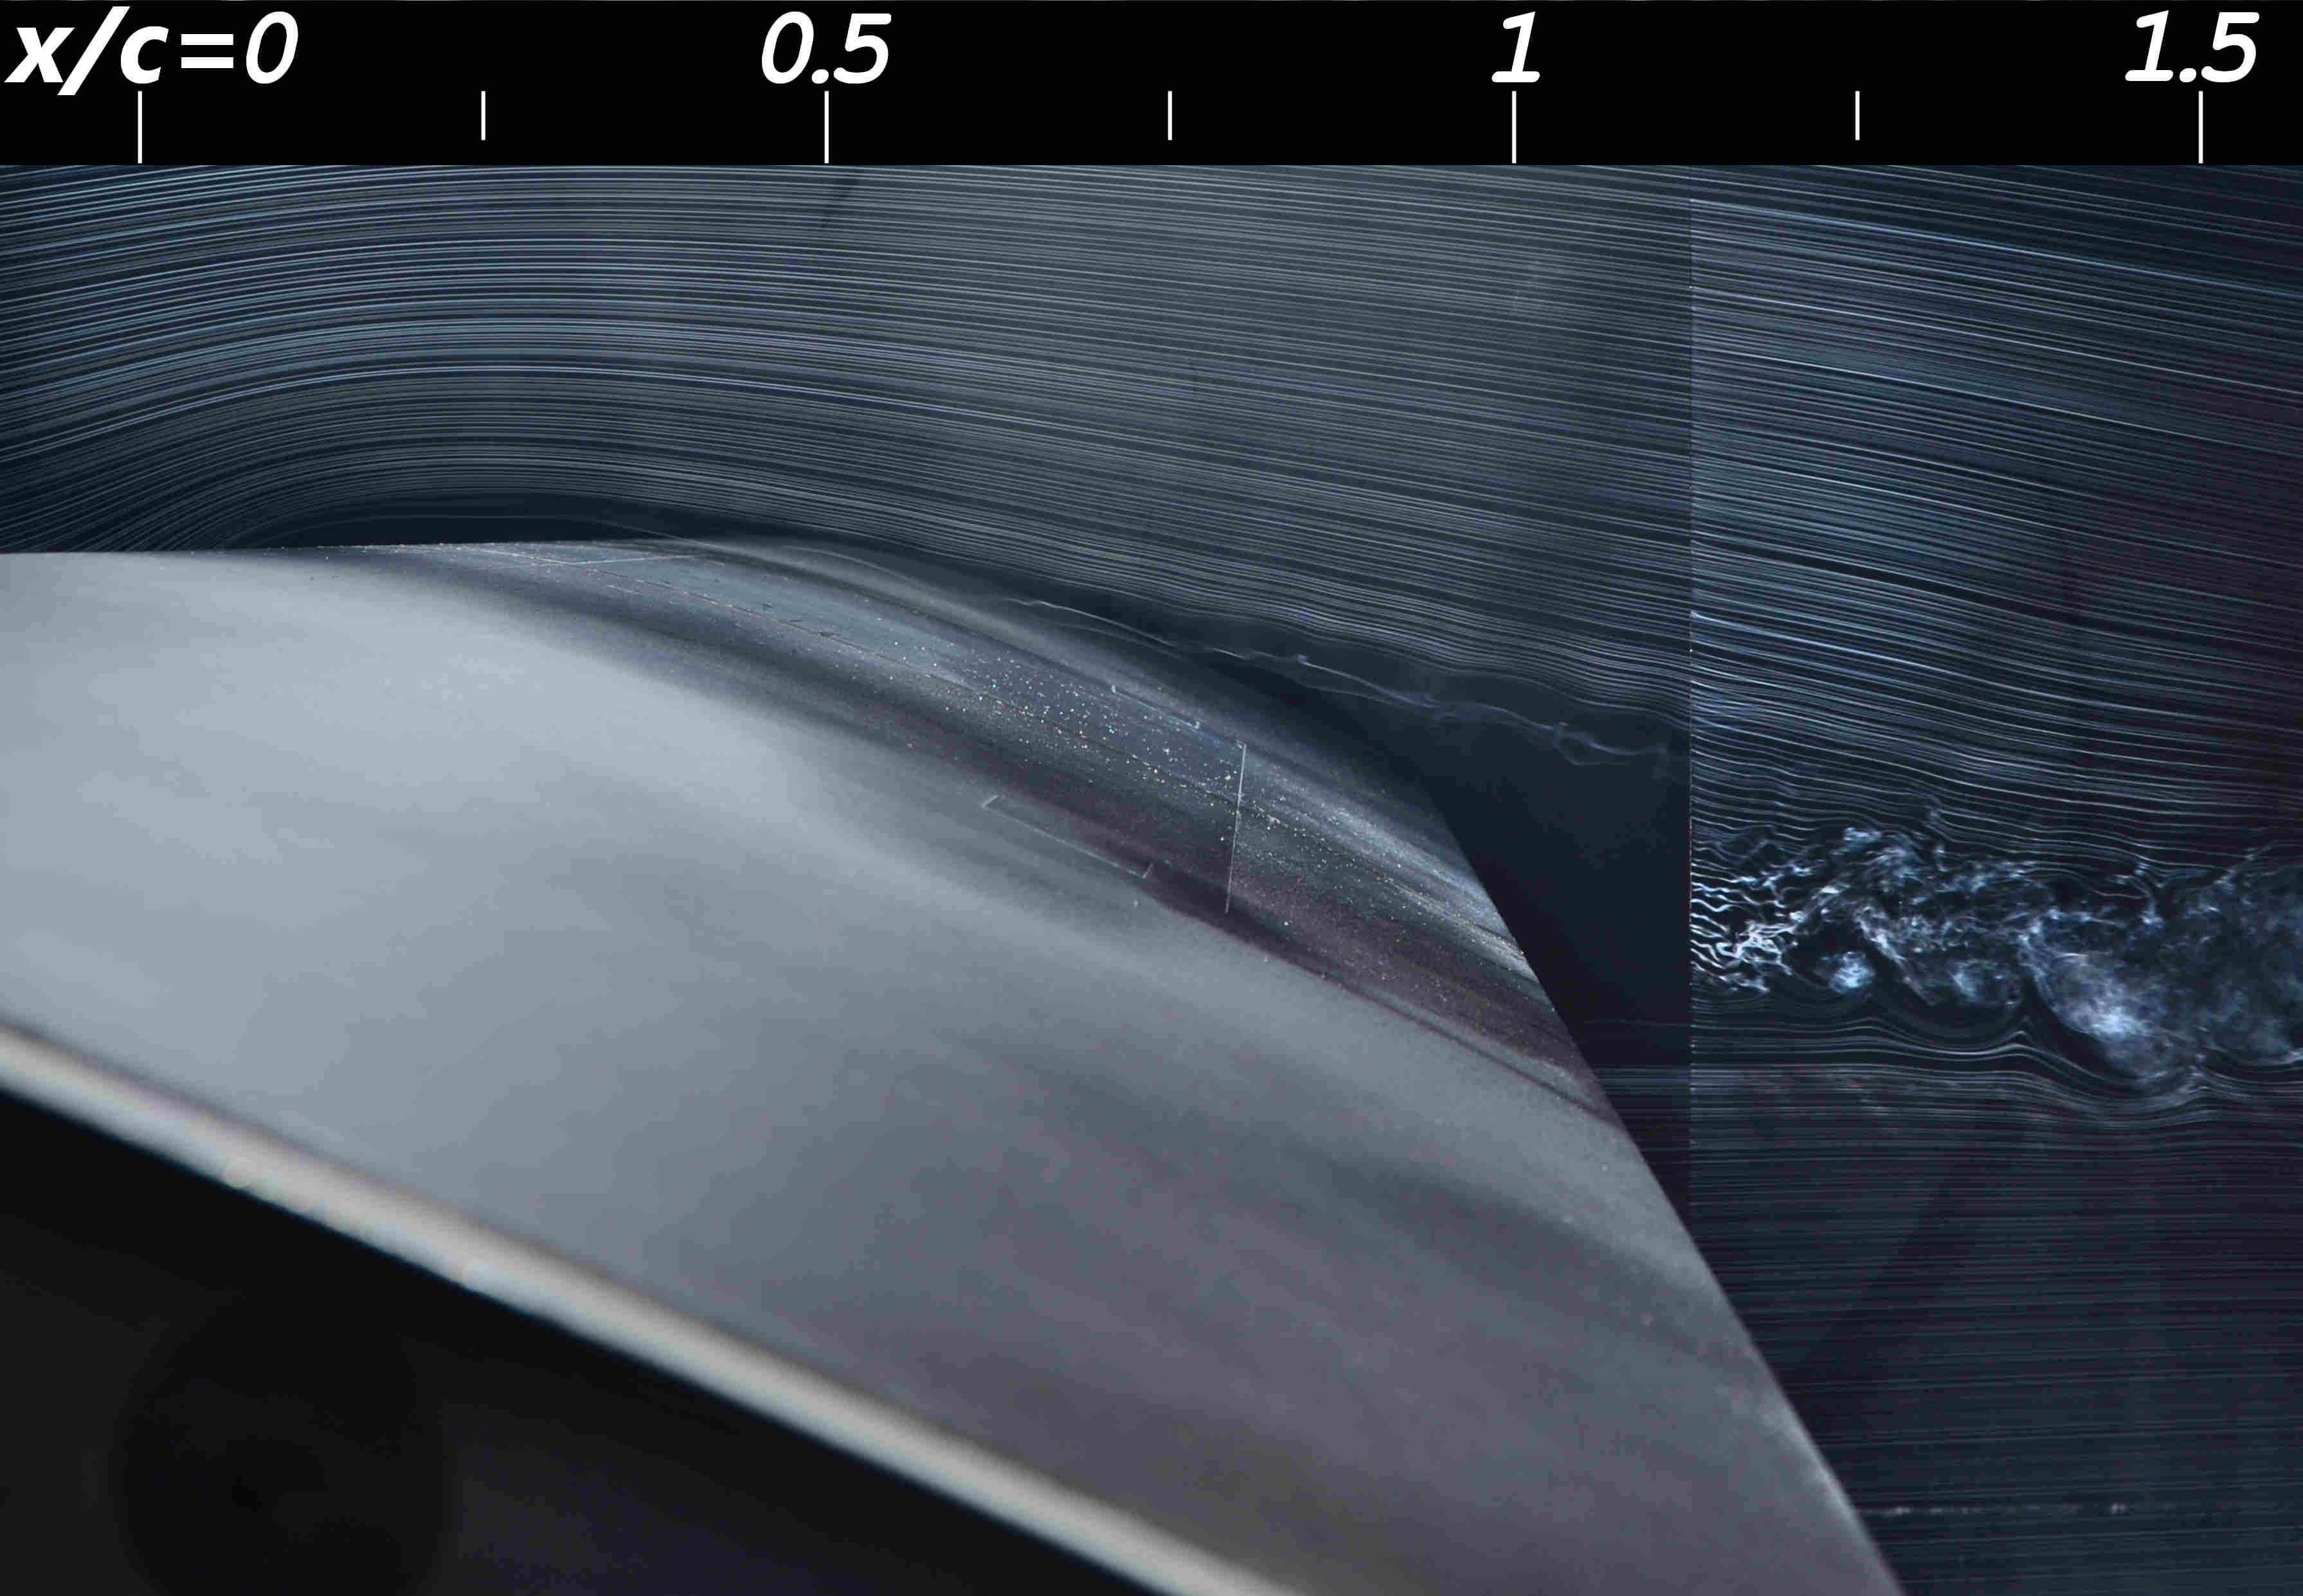
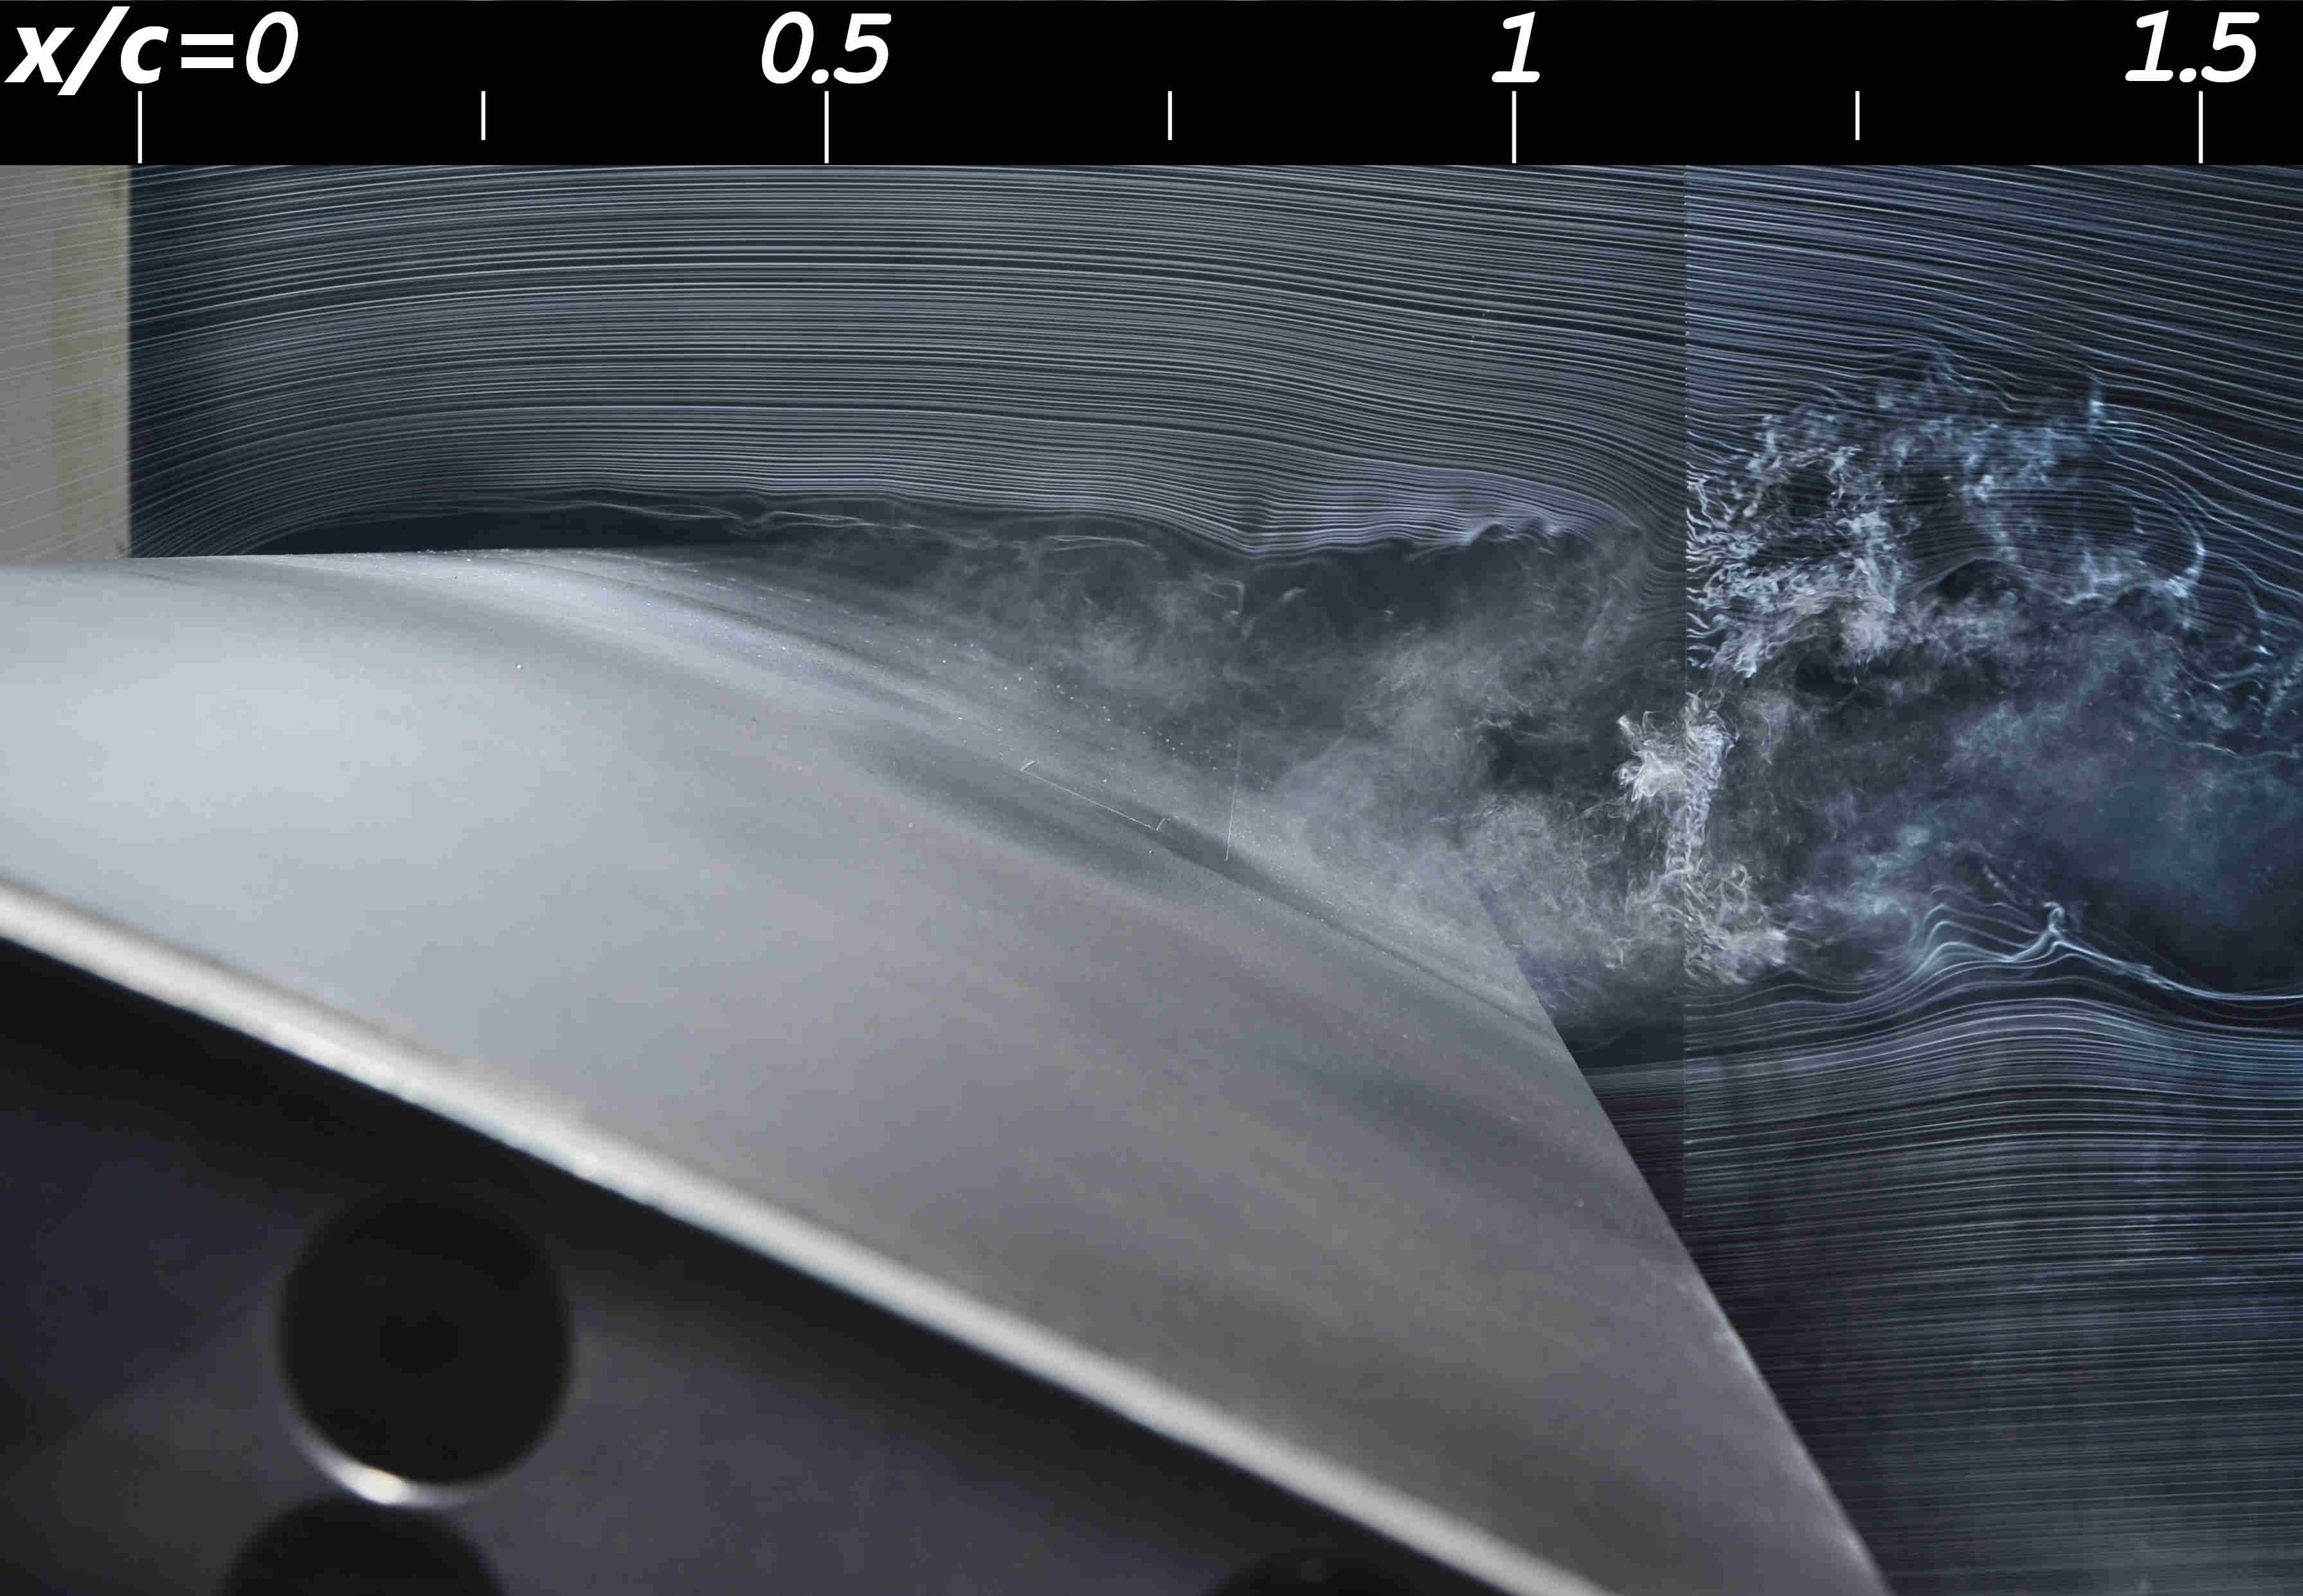
Smoke visualizations were taken at three orthogonal planes, as illustrated in Figure 1. A horizontal smoke wire, placed just upstream of the airfoil’s stagnation point, generated streaklines that traced the shear layer boundary for the configurations shown in Figures 1(a) and 1(b). A green laser, modified with optics to provide precise illumination, maximized contrast by ensuring that the background remained dark. For the more conventional side-view visualizations, a Nikon SB-800 speedlight was used to illuminate the smoke streams, as shown in Figure 1(c). The three configurations enable a detailed visualization of the flow components in the , , and directions, offering a comprehensive, three-dimensional perspective of the mean flow field. Images were captured using a Nikon D7000 DSLR camera with a remote shutter. Further details on the smoke visualization technique can be found in Machado et al. [7, 8].
For comparison, this paper presents mean velocity fields obtained with particle image velocimetry by Feero [10]. Similar experimental conditions were used with the same wing model; however, a rectangular slot-style SJA, spanning and centered at midspan, was used instead. The angle of attack was set to \unit, and the Reynolds number was .
3 Discussion
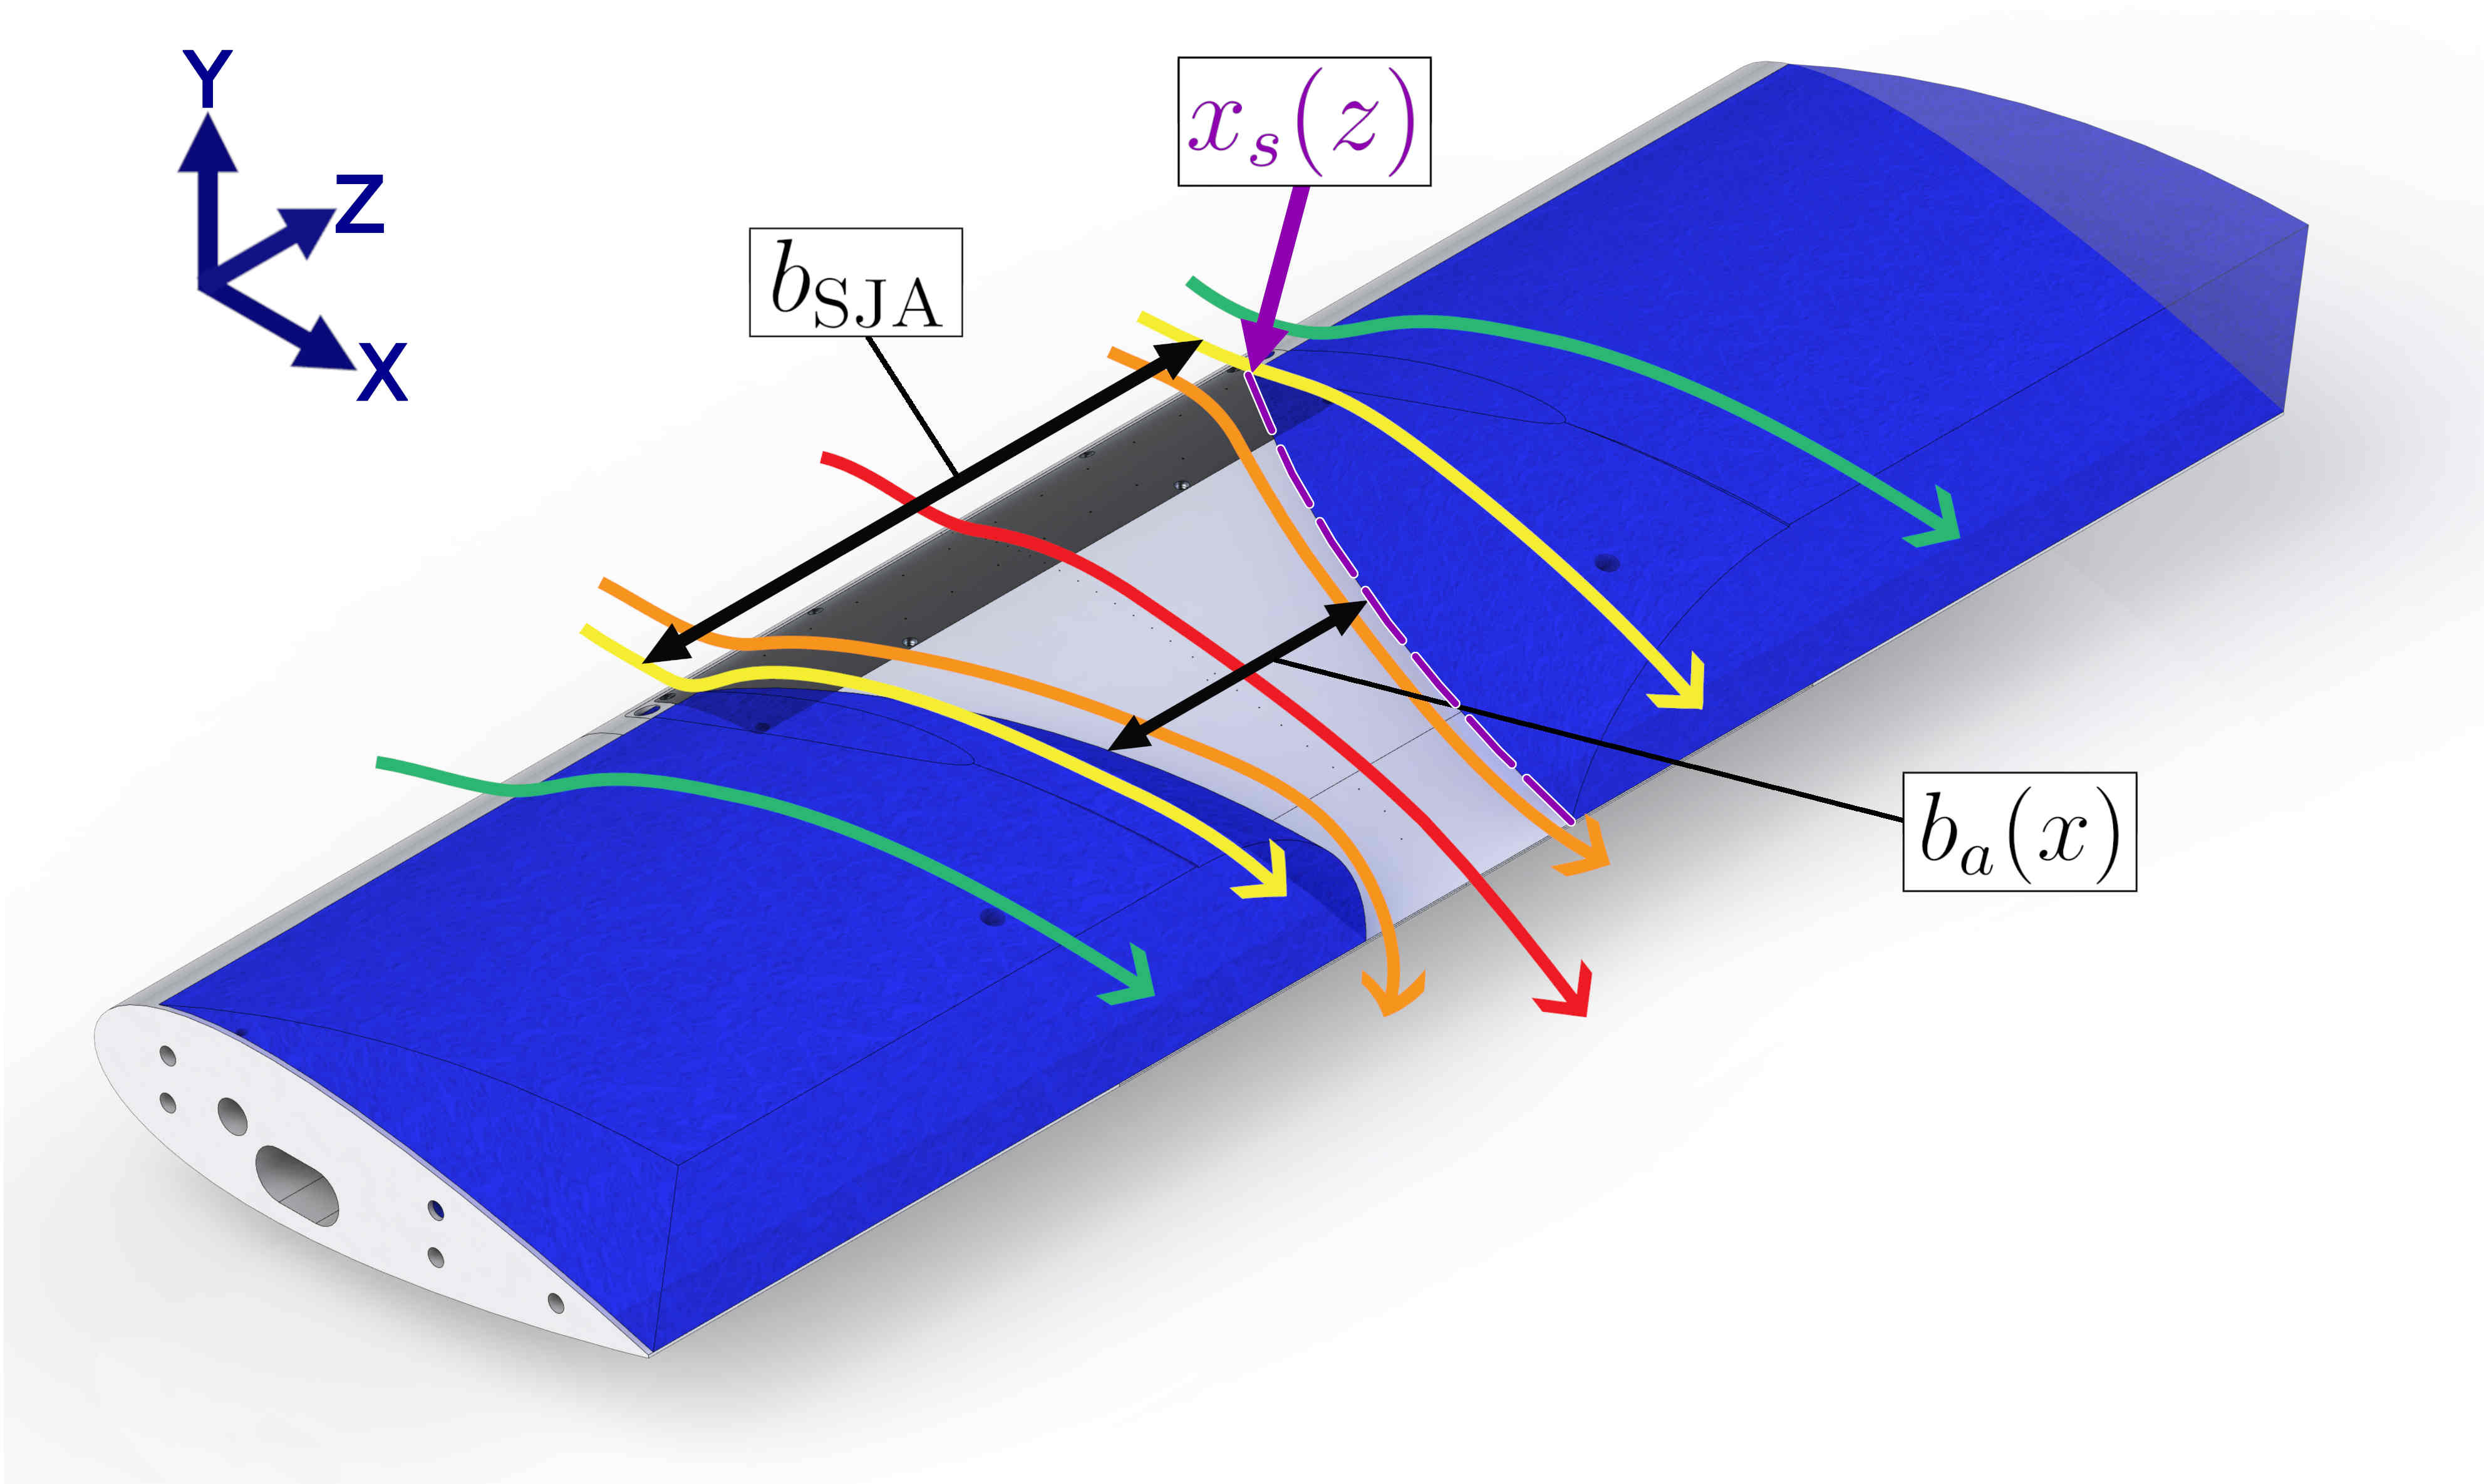
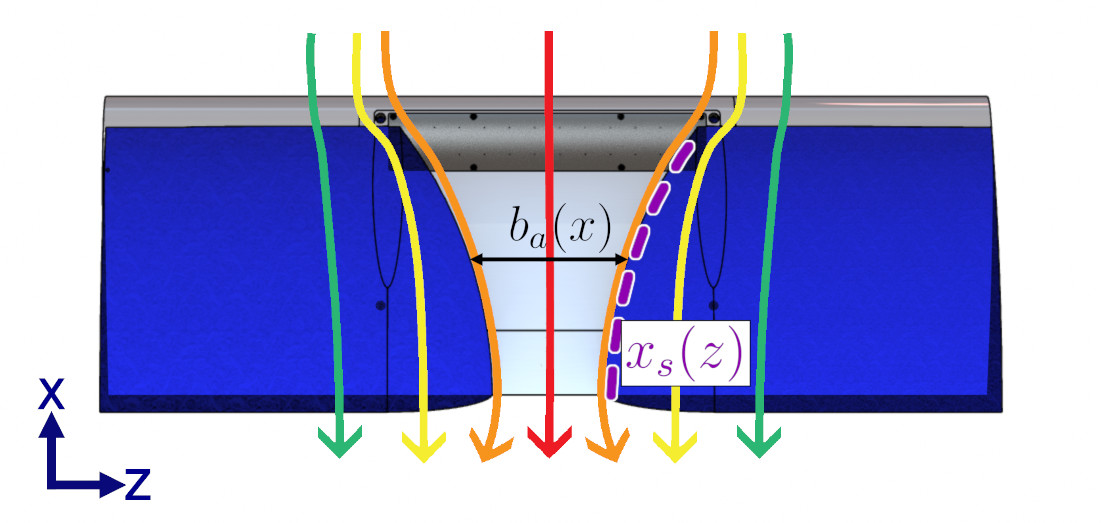
Figure 2 provides an isometric view of the conceptualized flow, with the blue volume over the airfoil representing the turbulent, high-pressure recirculation region, while the absence of blue denotes the attached flow region. Additionally, three key parameters are defined: , representing the span of the attached flow region at a given chordwise location, , representing the spanwise length of the SJA array, and , denoting the chordwise separation point at a specific spanwise position.
The reattached flow over the airfoil is modeled as three distinct control regions:
-
•
Controlled Region: Flow separation is suppressed over a spanwise length, , centered around the midspan. This effective spanwise control length decreases monotonically along the chord.
-
–
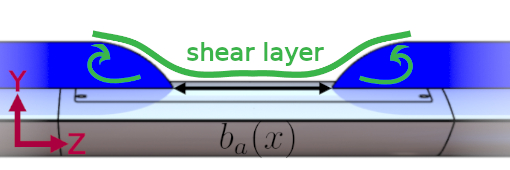
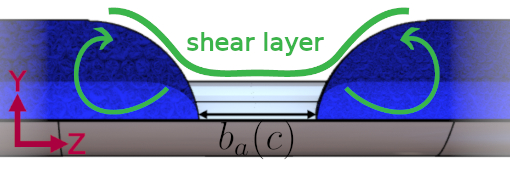
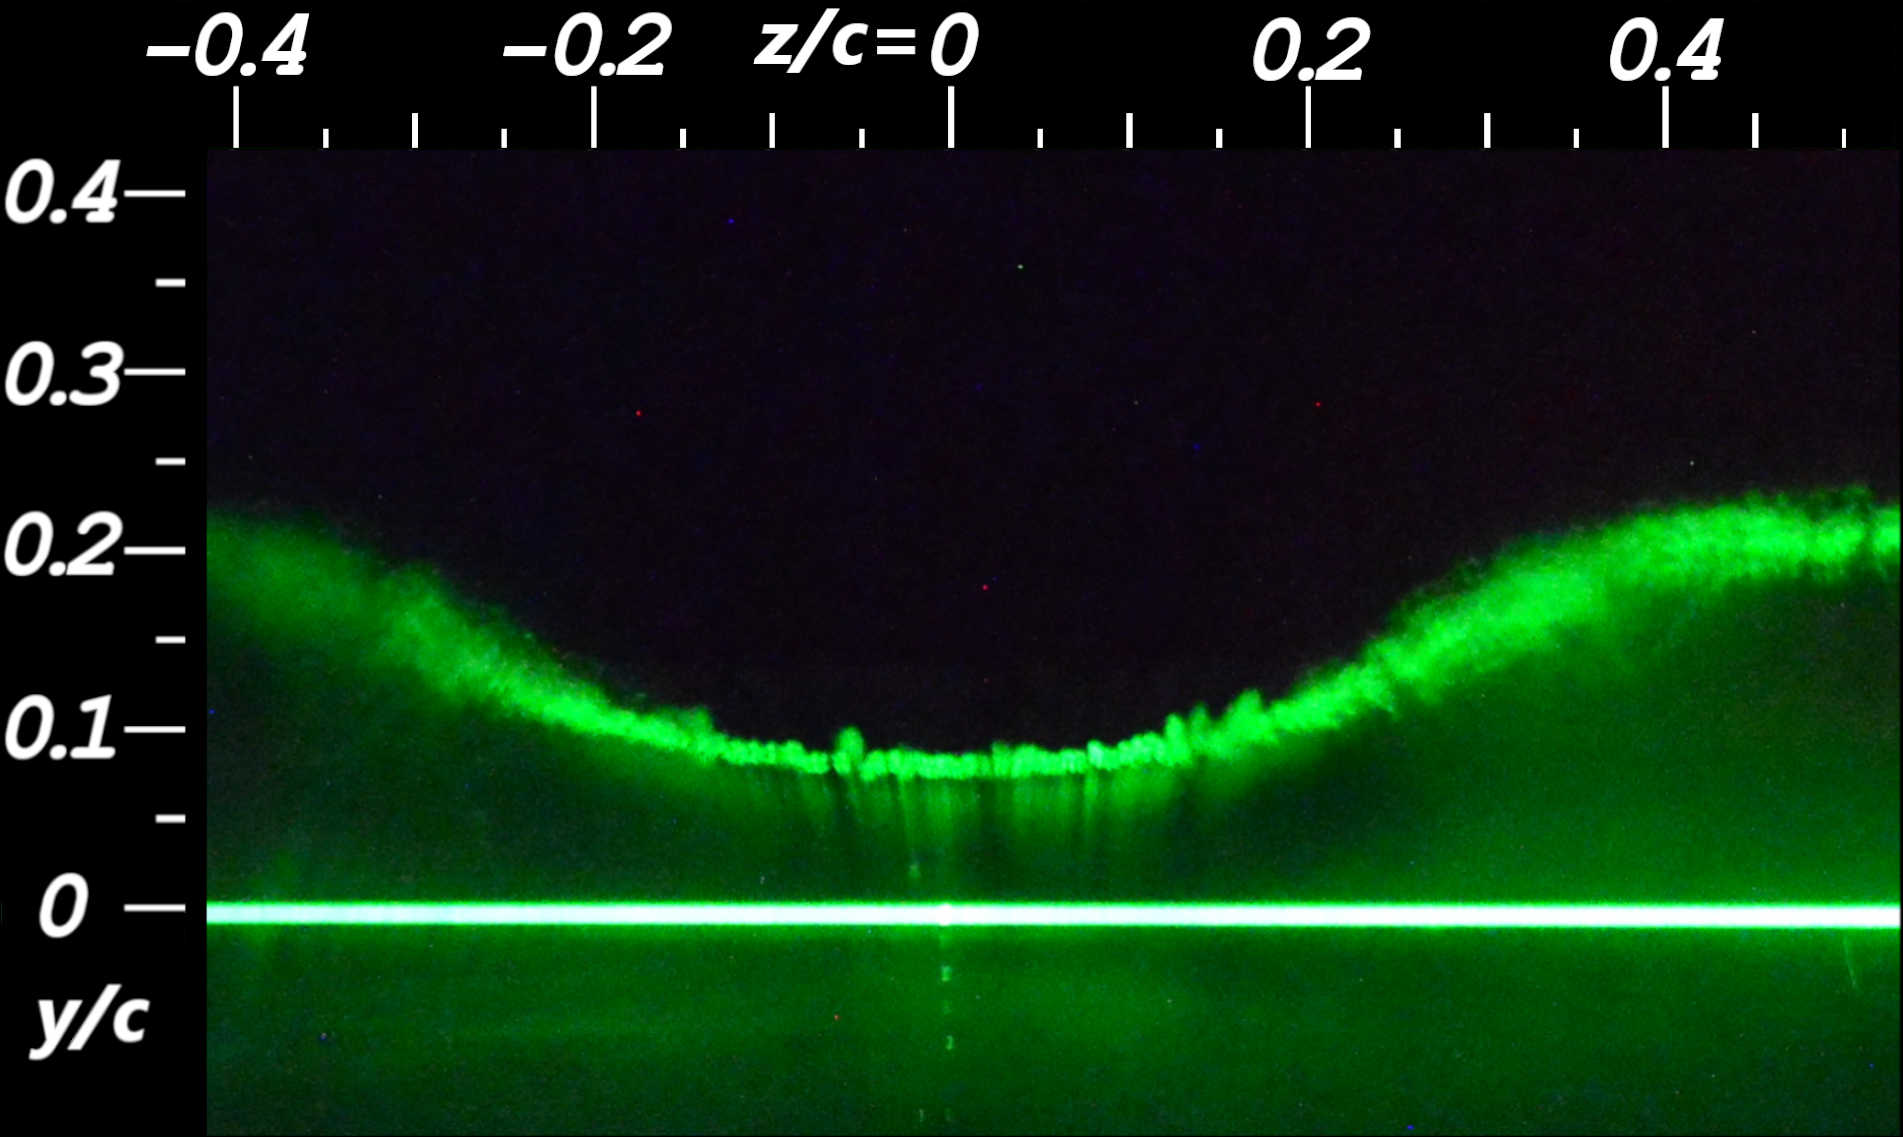
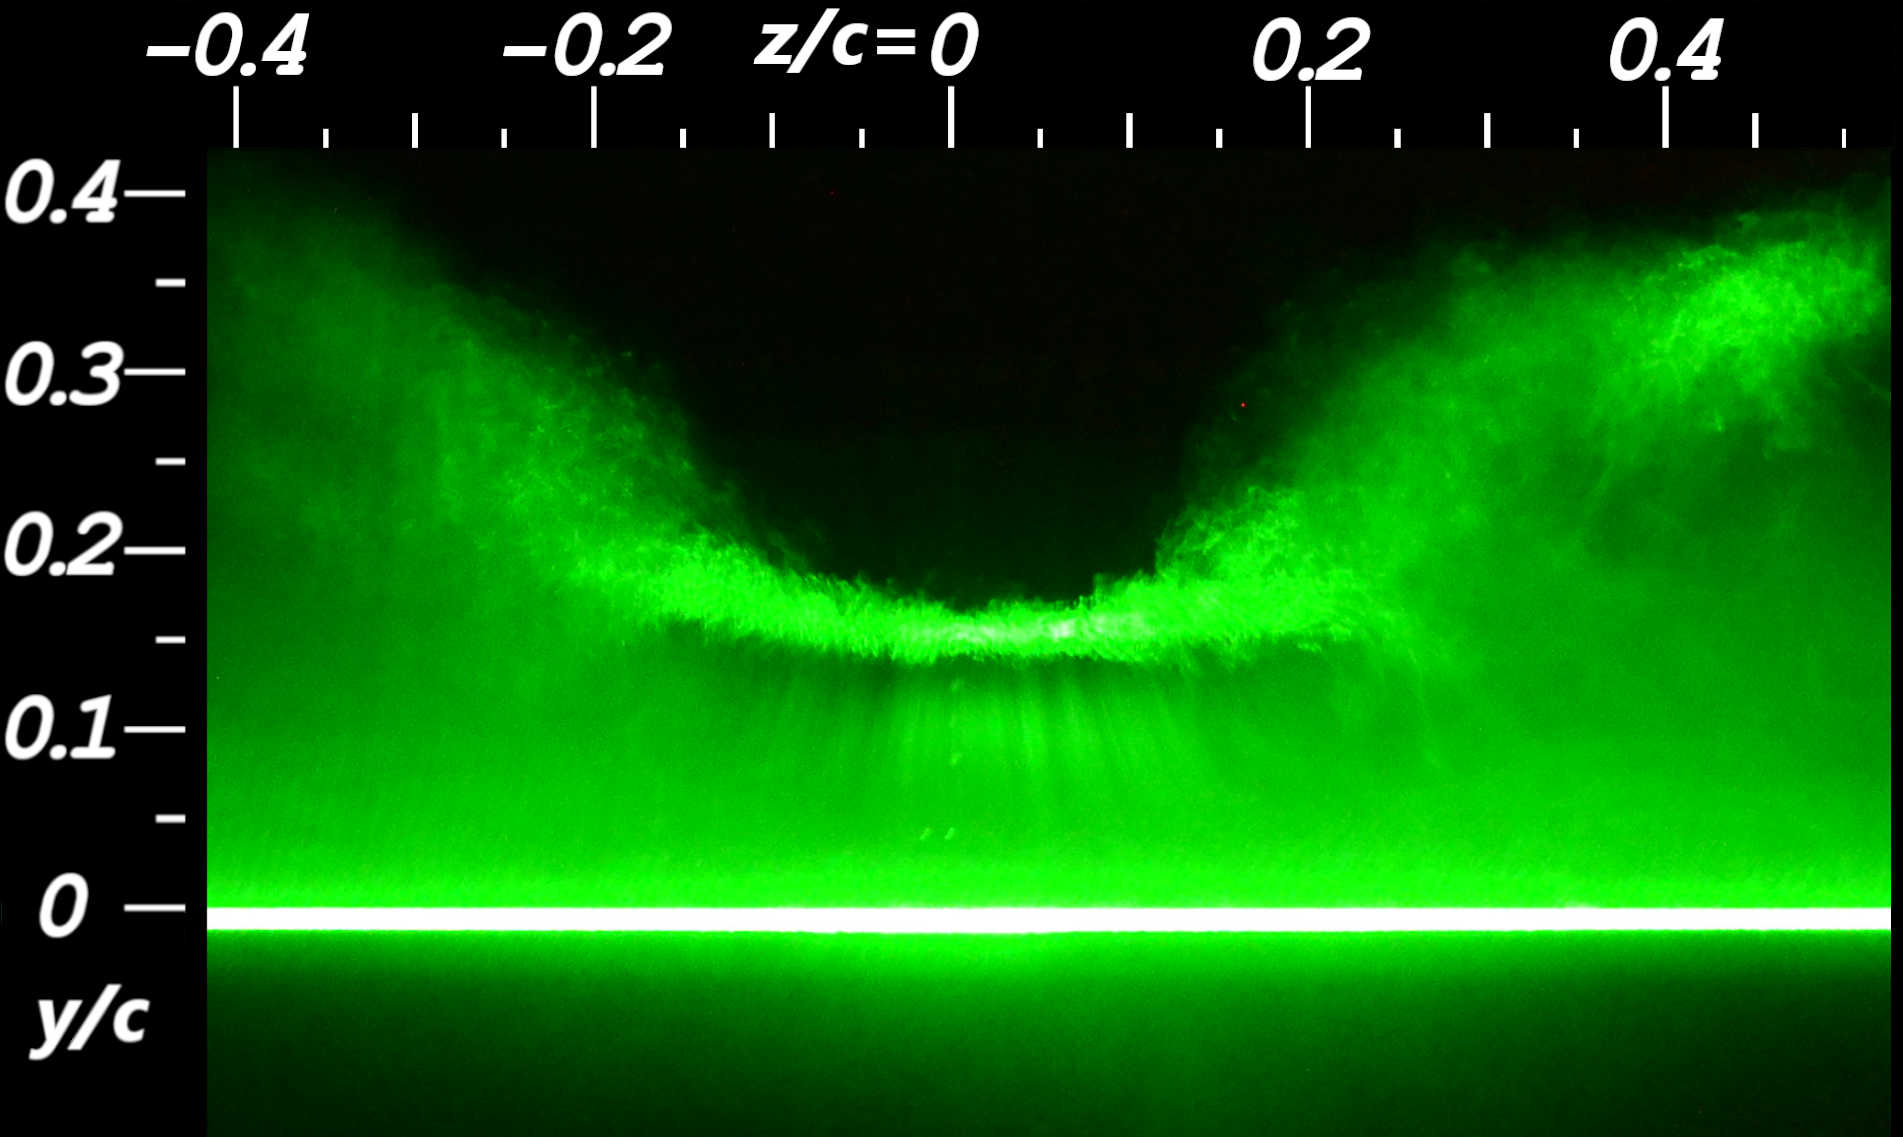
Figure 3 provides cross-sections of the shear layer in the - plane, illustrating the spanwise length of the reattached flow at different chordwise positions. At the midchord (Figure 3(a)), the shear layer exhibits a longer spanwise attached length compared to the trailing edge (Figure 3(b)). This model is validated through comparisons with experimental smoke flow visualizations of the shear layer cross-section. Figure 3(c) presents a visualization of the shear layer at , where a large attached region – marked by dense, illuminated smoke – is observed, along with a shallow curvature as the shear layer thickens along the span. In contrast, at the trailing edge (Figure 3(d)), the attached region is seen to be much shorter. Beyond this attached region, recirculating turbulent flow is evident from the diffuse smoke spreading in the -direction.
-
–
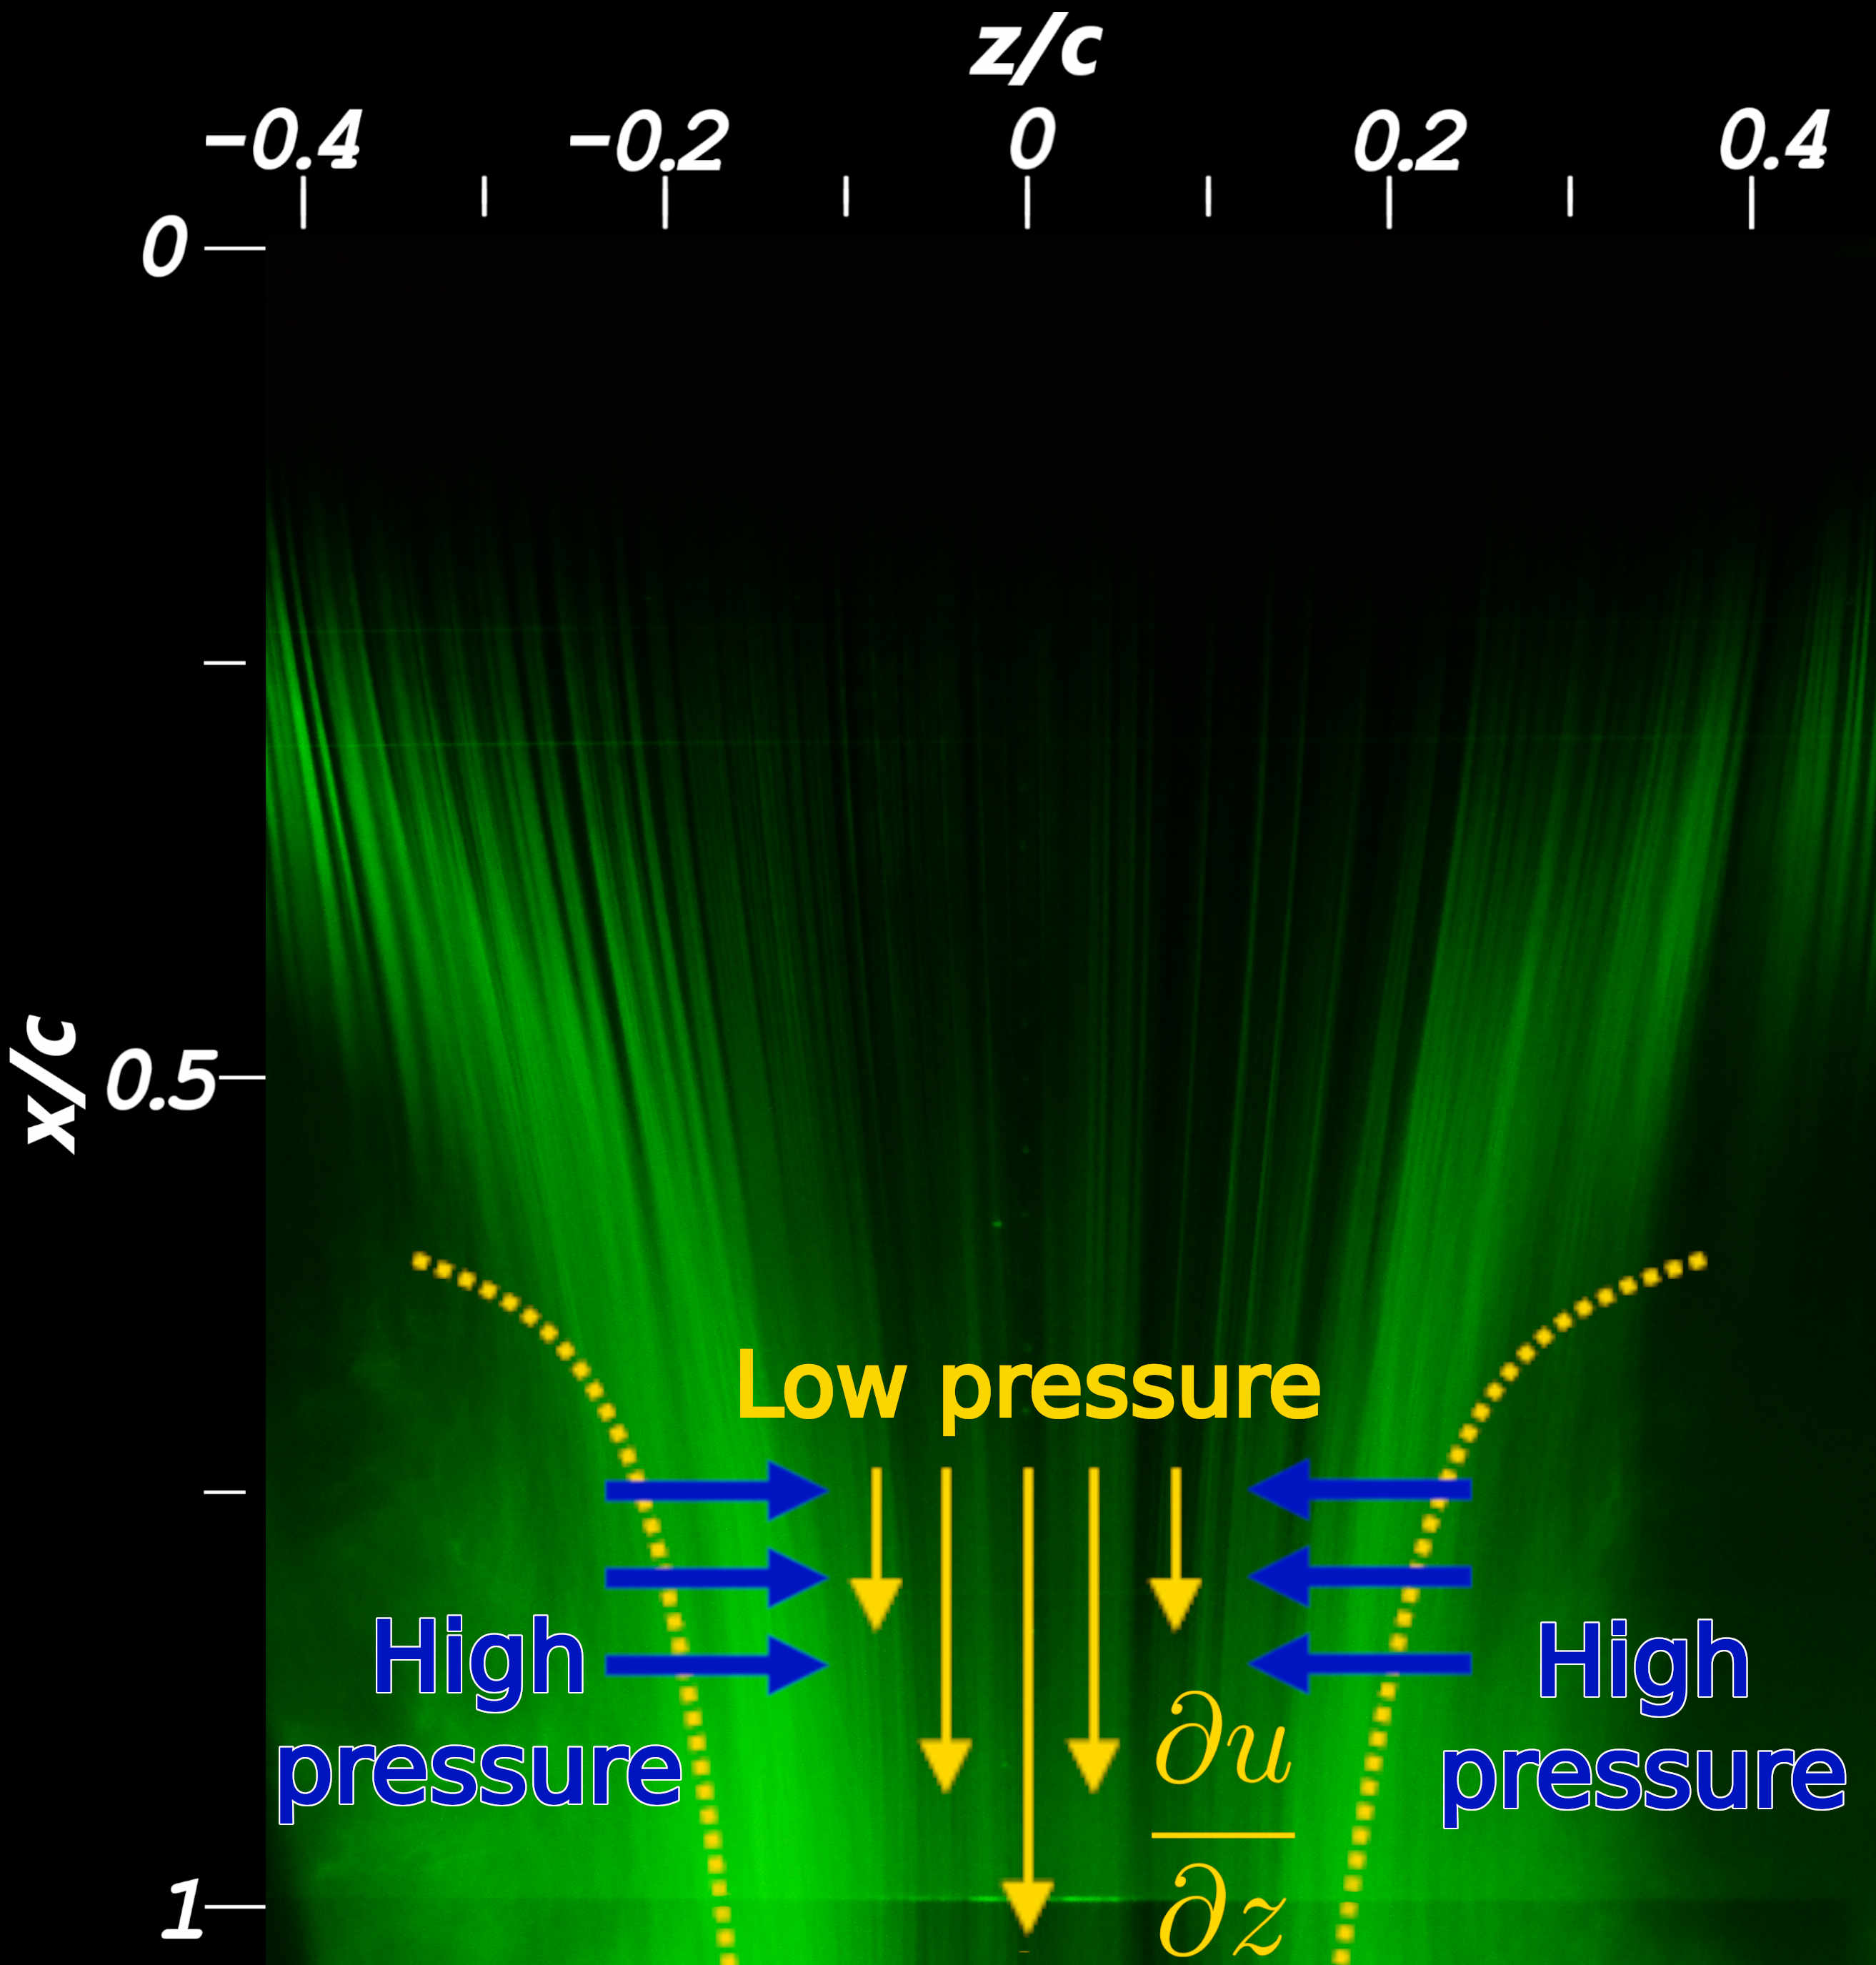
The overhead view in Figure 4 complements this understanding of the flow field. The flow exhibits a spanwise contraction which is depicted in Figure 4(a). This contraction results in the decrease of the spanwise control length , along the chord. Figure 4(b) presents a visualization of the controlled flow where smooth smoke streaks indicate laminar flow. Further downstream, the recirculation region grows, forcing the flow inward towards the midspan. The spanwise velocity gradient, , induces a spanwise pressure gradient leading to the observed contraction in the smoke streaks. A similar spanwise flow contraction was observed in prior studies by Sahni et al. [5], Feero et al. [6].
-
–
The spanwise control authority of an SJA, a crucial parameter for evaluating effectiveness, can be quantified by the ratio of attached flow at the trailing edge to the span of the SJA array, i.e. . A higher ratio value signifies greater spanwise control authority, indicating a more effective flow reattachment over the airfoil.
-
–
-
•
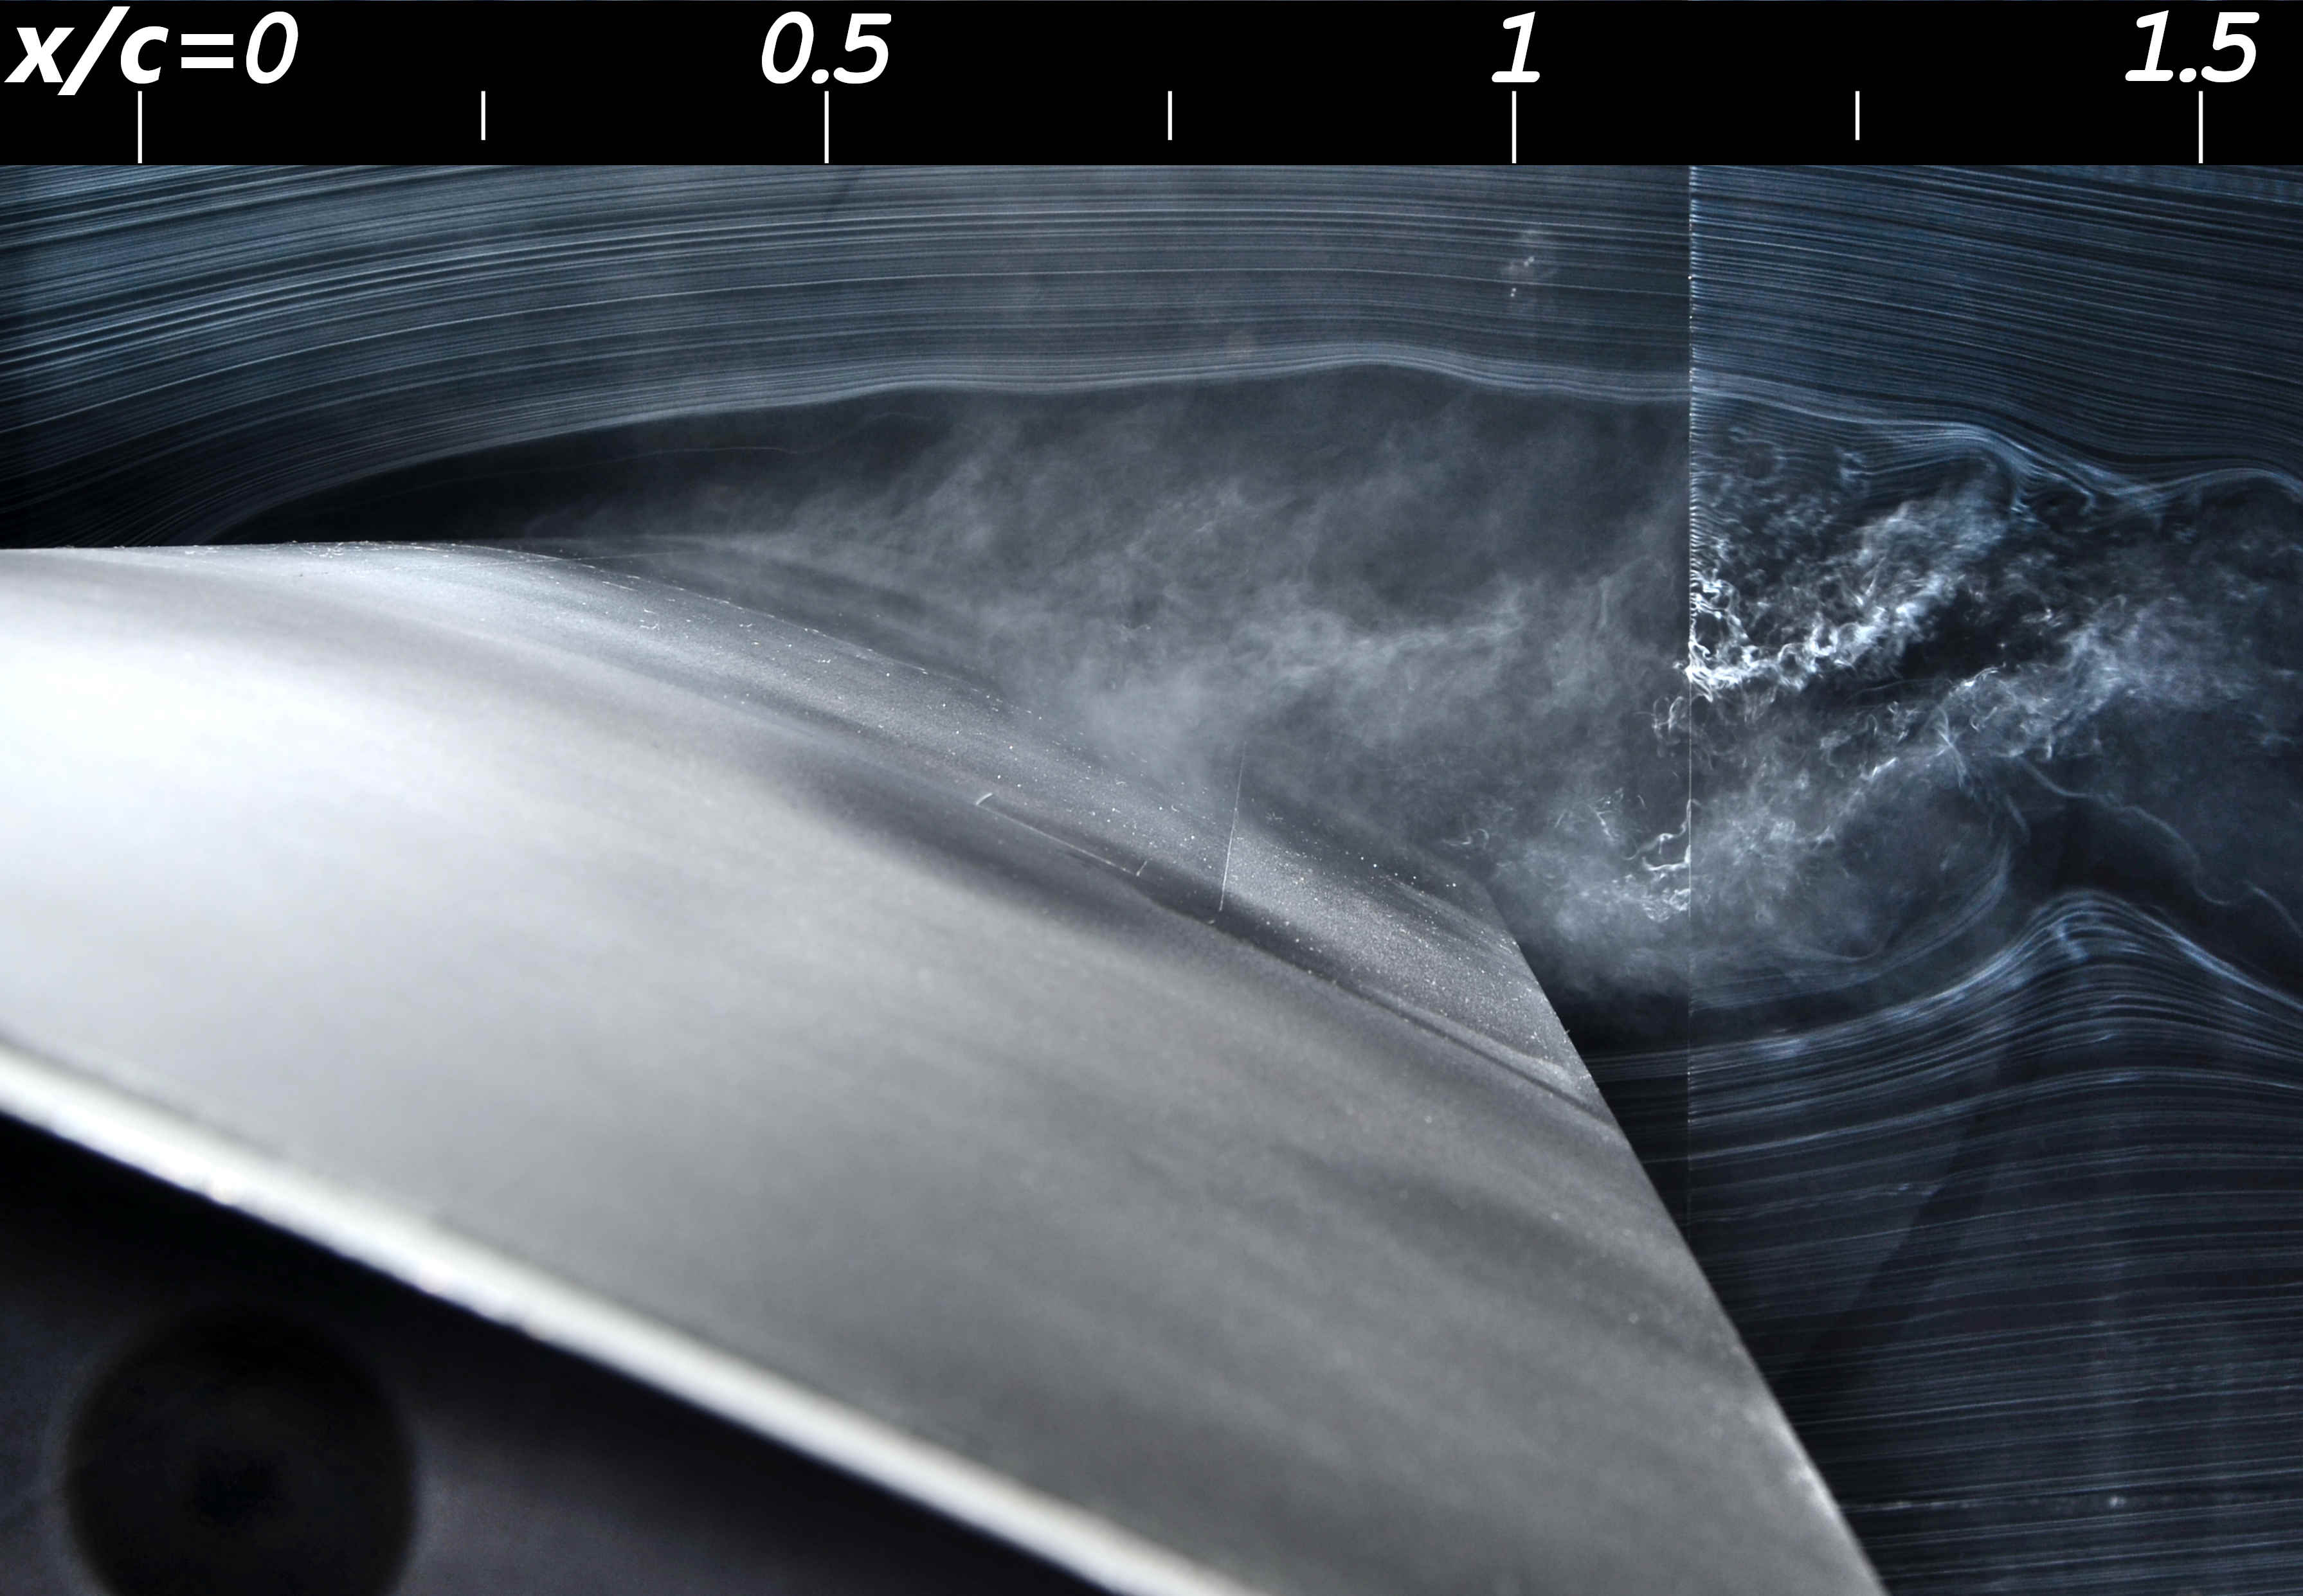
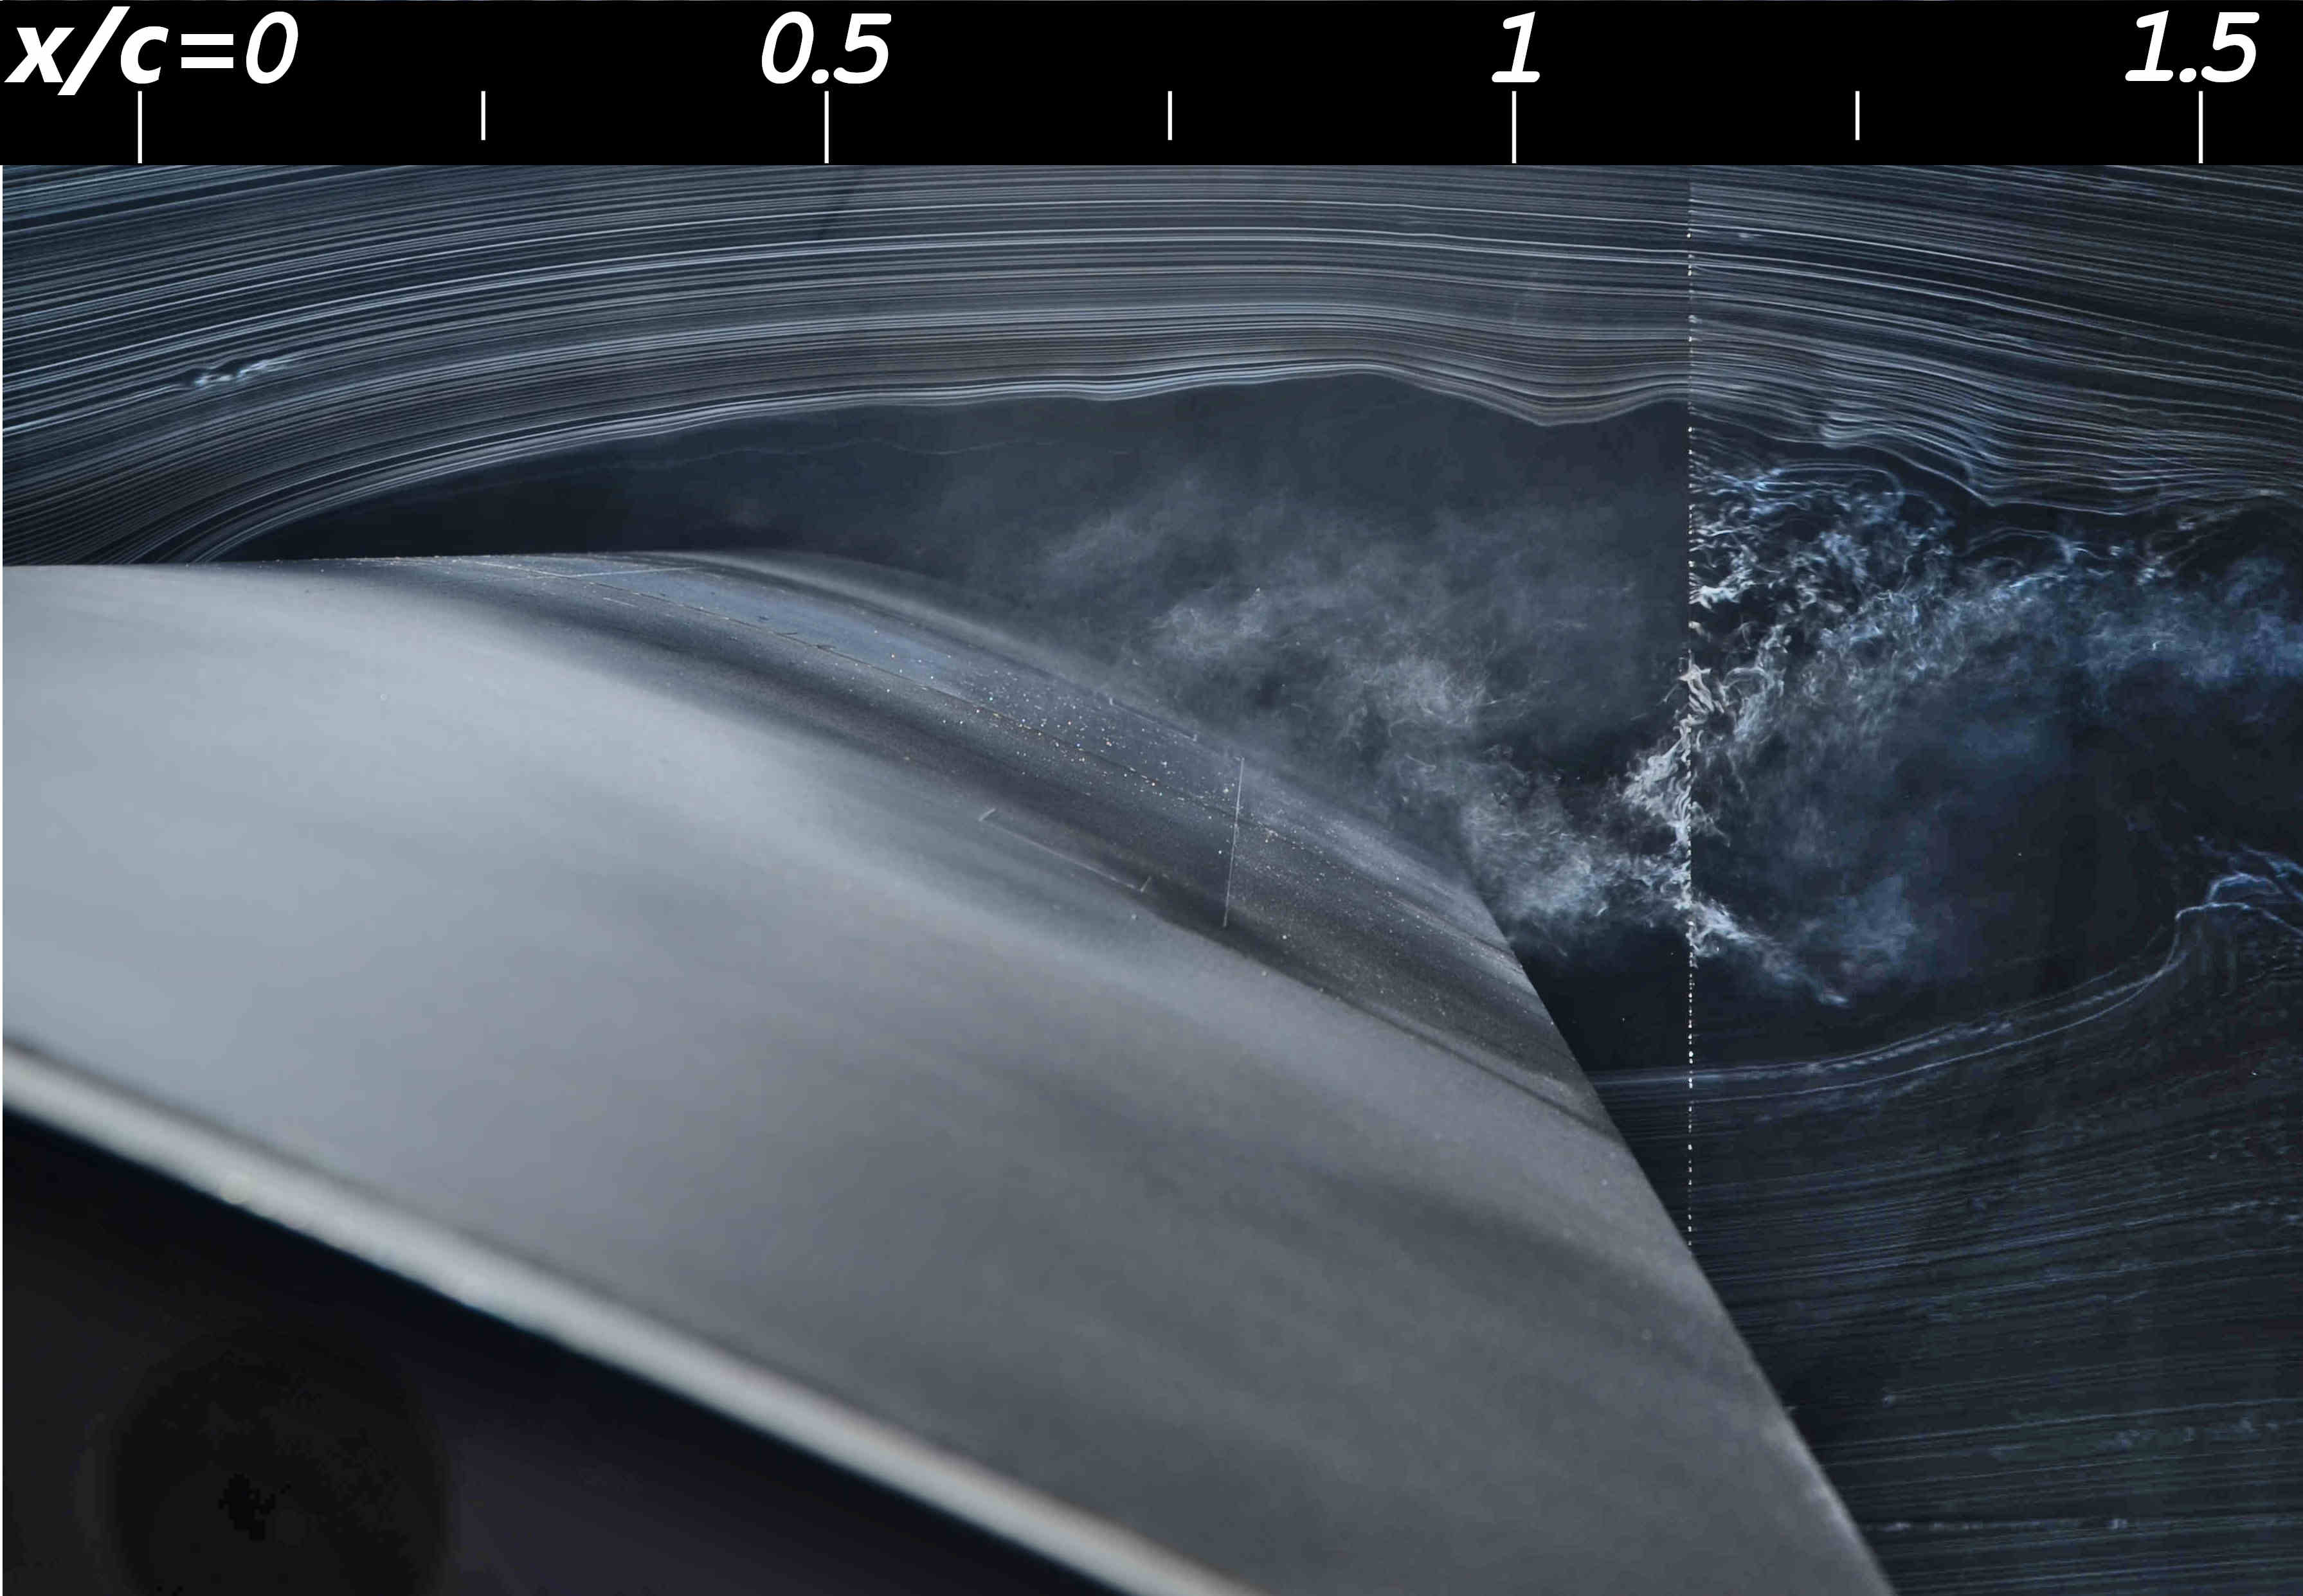
Uncontrolled Region: Beyond the effective span of the SJA array, the flow reverts to baseline conditions, as depicted in the outer blue region past the curve in Figures 3(a) and 3(b). In this region, the flow is unaffected by the SJAs and resembles the fully separated flow of the baseline case, as shown in Figure 5. This effect is most clearly seen in the side view depiction, smoke visualization, and the velocity field presented in Figures 6(c), 6(f), and 6(i), respectively.
-
•
Transitional Region: As the flow transitions along the span from fully attached to fully separated, the recirculating flow region exhibits a curved shape in both the - and - planes, encroaching toward the midspan as the flow progresses along the chord.
-
–
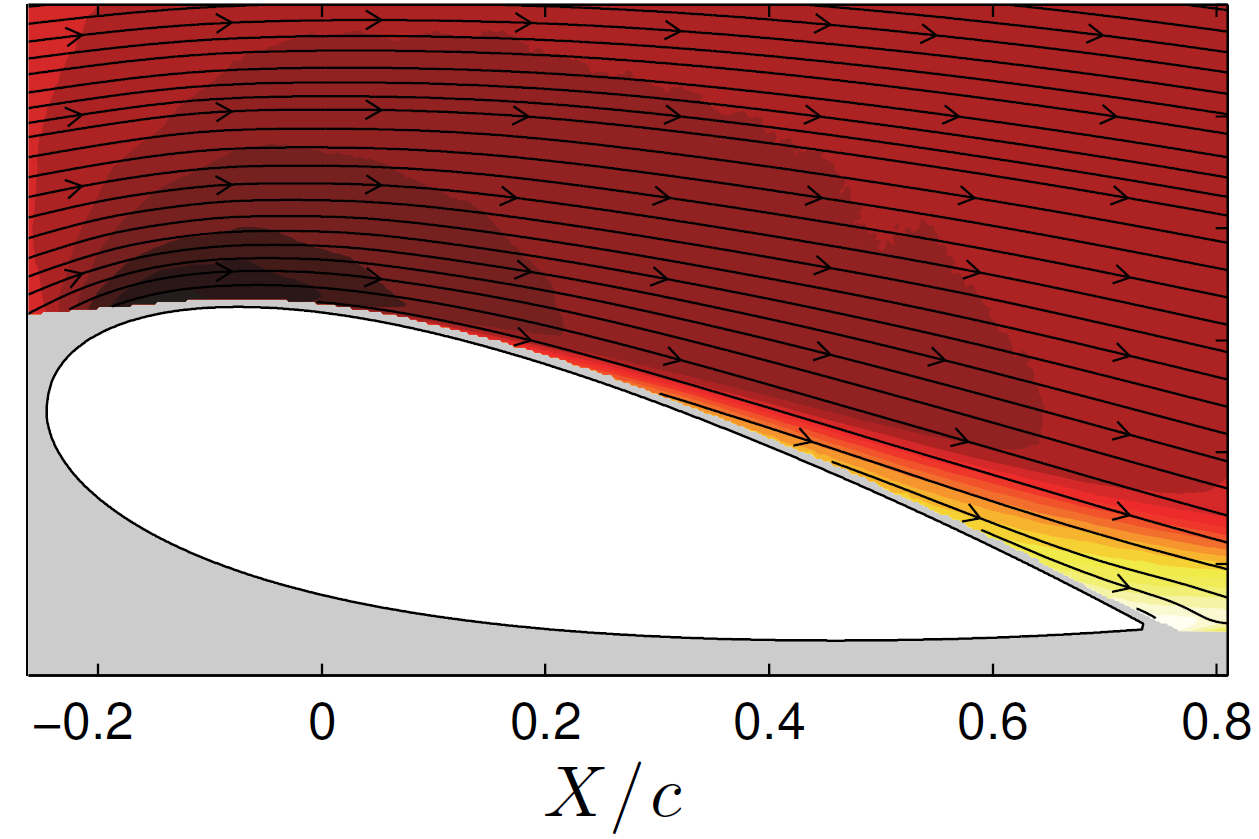
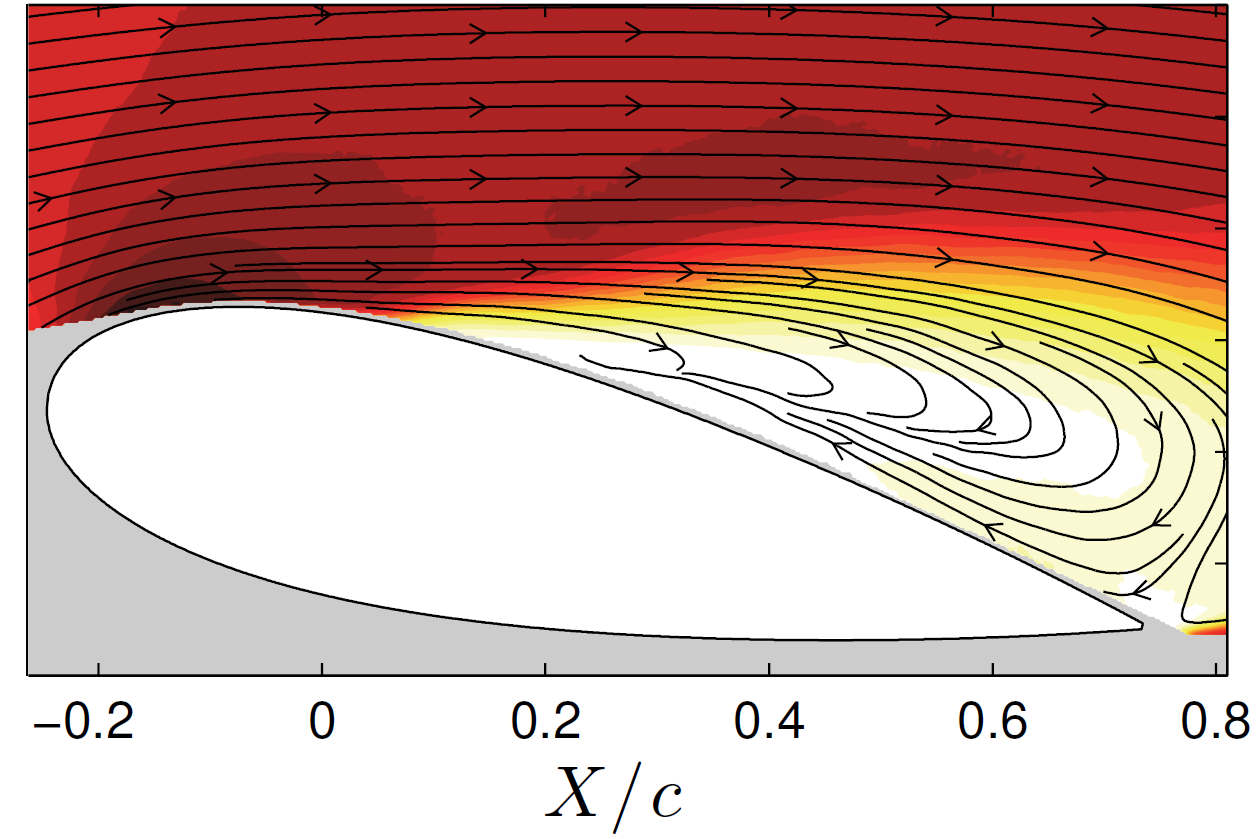
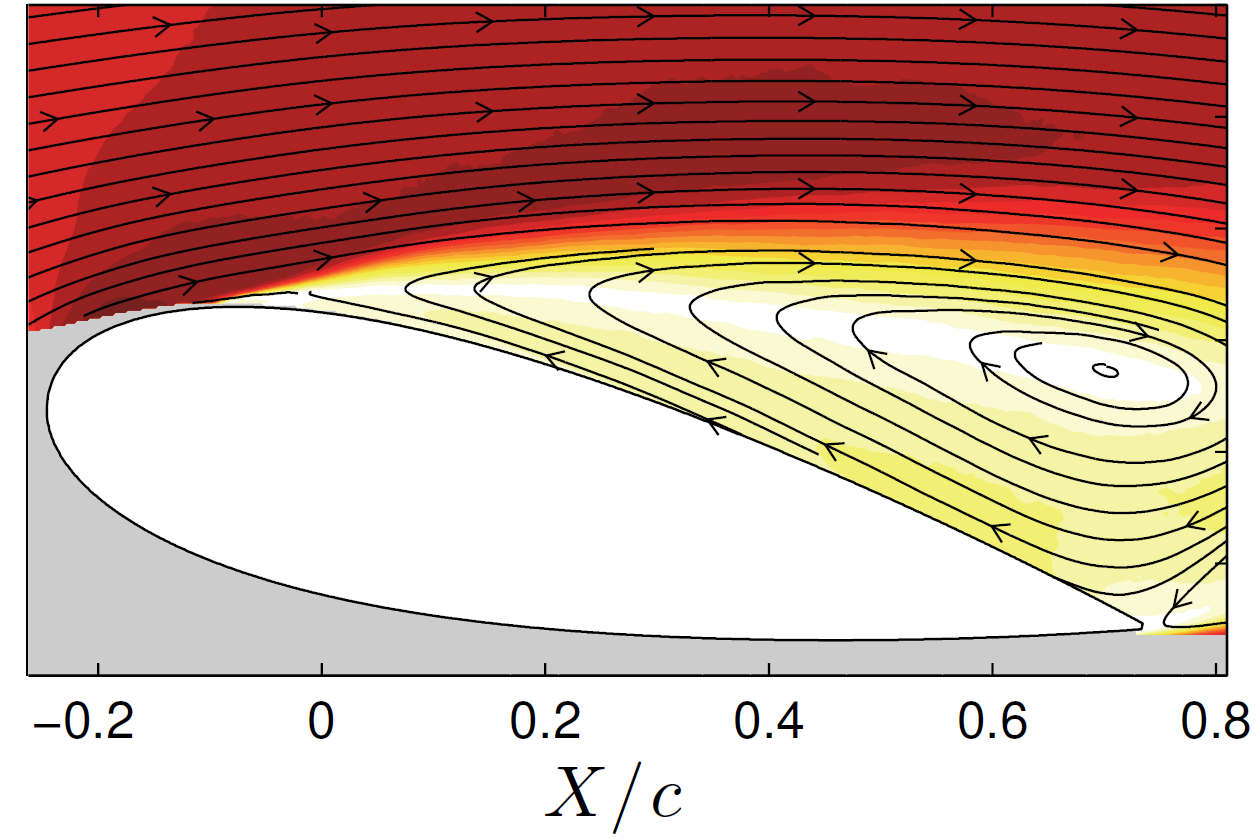
This behavior is best understood through multiple 2D flow slices, as shown in Figure 6. Near the midspan, the flow remains fully attached (Figure 6(a)). Moving away from the midspan (Figure 6(b)), the control effects diminish, leading to a recirculation zone at the trailing edge. Flow separation occurs, with the chordwise separation point depending on the spanwise coordinate. As the spanwise distance increases (increasing ), the separation point, , shifts upstream, and the recirculation area expands upward, forcing the incoming flow onto a higher trajectory. Far from the midspan (Figure 6(c)), the control effects become negligible, and the recirculation region resembles the baseline case, with a separation point that matches the baseline flow. Experimental support for this model comes from smoke visualizations (Figures 6(d) to 6(f)) and PIV velocity fields (Figures 6(g) to 6(i)).
-
–
The expansion of the recirculation region is seen in the sectional flow visualization in Figure 3(d), where diffuse smoke rises in the -direction along a curved path. This shape, depicted in Figure 3(b) and, along with the overhead perspective in Figure 4(a), provides a comprehensive view of how recirculation initiates as a localized trailing-edge region and then expands upward and upstream with increasing spanwise distance.
-
–
4 Conclusion
This paper presents a three-dimensional representation of the reattached mean flow over an airfoil controlled by a finite-span SJA array. The controlled region, characterized by suppressed flow separation, showcases the SJA’s direct impact. In contrast, the uncontrolled region exhibits flow behavior similar to the baseline case, unaffected by the SJA. The transitional region, marking the gradual change from controlled to uncontrolled flow, exhibits a complex curved shape evident in the smoke flow patterns. This conceptualization offers insights into the three-dimensional flow behavior around airfoils equipped with finite-span SJAs.
Funding Sources
This work was supported by the Natural Science and Engineering Research Council of Canada and the SciNet High Performance Computing consortium and the Canadian Microelectronics Corporation (CMC).
References
- Salunkhe et al. [2016] Salunkhe, P., Tang, H., Zheng, Y., and Wu, Y., “PIV measurement of mildly controlled flow over a straight-wing model,” International Journal of Heat and Fluid Flow, Vol. 62, 2016, pp. 552–559. 10.1016/j.ijheatfluidflow.2016.08.004.
- Liu et al. [2022] Liu, R.-B., Wei, W.-T., Wan, H.-P., Lin, Q., Li, F., and Tang, K., “Experimental study on airfoil flow separation control via an air-supplement plasma synthetic jet,” Advances in Aerodynamics, Vol. 4, 2022, p. 34. 10.1186/s42774-022-00126-w.
- Seifert et al. [2010] Seifert, A., David, S., Fono, I., Stalnov, O., and Dayan, I., “Roll Contrial via Active Flow Control: From Concept to Flight,” Journal of Aircraft, Vol. 47, 2010, pp. 864–874. 10.2514/1.45910.
- Greenblatt and Williams [2022] Greenblatt, D., and Williams, D. R., “Flow Control for Unmanned Air Vehicles,” Annual Review of Fluid Mechanics, Vol. 54, 2022, pp. 383–412. 10.1146/annurev-fluid-032221-105053.
- Sahni et al. [2011] Sahni, O., Wood, J., Jansen, K. E., and Amitay, M., “Three-dimensional interactions between a finite-span synthetic jet and a crossflow,” Journal of Fluid Mechanics, Vol. 671, 2011, pp. 254–287. 10.1017/S0022112010005604.
- Feero et al. [2017] Feero, M. A., Lavoie, P., and Sullivan, P. E., “Three-dimensional span effects of high-aspect ratio synthetic jet forcing for separation control on a low Reynolds number airfoil,” Journal of Visualization, Vol. 20, 2017. 10.1007/s12650-016-0365-7.
- Machado et al. [2024a] Machado, A., Xu, K., and Sullivan, P. E., “Visualizing three-dimensional effects of synthetic jet flow control,” Journal of Visualization, Vol. 27, 2024a. 10.1007/s12650-024-00992-0.
- Machado et al. [2024b] Machado, A., Xu, K., and Sullivan, P. E., “Spanwise control authority of synthetic jets on a stalled airfoil,” Physics of Fluids, Vol. 36, 2024b. 10.1063/5.0212135.
- Machado et al. [2024c] Machado, A., Shirinzad, A., Xu, K., and Sullivan, P. E., “Role of Duty Cycle in Burst-Modulated Synthetic Jet Flow Control,” , 2024c. Available at https://arxiv.org/abs/2410.01015.
- Feero [2018] Feero, M. A., “Investigation of Synthetic Jet Flow Control Parameters for the Mitigation of Laminar Boundary Layer Separation,” Ph.D. thesis, University of Toronto (Canada), 2018. Available at https://hdl.handle.net/1807/82937.