Disorder-Induced Spectral Splitting versus Rabi Splitting under Strong Light-Matter Coupling
Abstract
The notion of strong light-matter coupling is typically associated with the observation of Rabi splitting, corresponding to the formation of the hybrid light-matter states known as polaritons. However, this relationship is derived based on the assumption that disorder can be ignored or acts as a perturbative effect. Contrary to conventional treatment of disorder effects, we investigate the impact of strong disorder on the absorption spectrum by developing a non-perturbative effective model combined with classical electrodynamics simulation. Intriguingly, we find that strong disorder leads to an enhanced spectral splitting that closely resembles Rabi splitting, yet originates from a fundamentally different mechanism as induced by the dark modes. Specifically, we examine a disordered molecular ensemble in proximity to a plasmonic nanodisk and demonstrate disorder-induced spectral splitting in the absorption spectrum. This conclusion raises a controversial issue, suggesting that both polaritons (dominate in the strong coupling regime) and dark modes (dominate in the strong disorder regime) can lead to spectral splitting, and one cannot distinguish them solely based on the steady-state absorption spectrum.
Introduction—
A key focus of recent research in quantum light-matter interactions is on understanding molecular polaritons, which arise from the hybridization of photons absorption/emission with molecular excitations in the strong light-matter coupling regimeEbbesen (2016); Ribeiro et al. (2018); Mandal et al. (2023); Xiang and Xiong (2024). Recent reports have demonstrated many potential applications of polariton in controlling chemical and material properties, such vibrational ground-state reactivityThomas et al. (2016); Li et al. (2022); Du and Yuen-Zhou (2022) and charge carrier mobilityOrgiu et al. (2015); Xu et al. (2023); Balasubrahmaniyam et al. (2023); Steger et al. (2013); Hou et al. (2020), across various platforms such as Fabry-Pérot microcavity and plasmonic nanostructuresAberra Guebrou et al. (2012); Lidzey et al. (2000); Thomas et al. (2019); Brawley et al. (2021). It is widely accepted that the hallmark of strong light-matter coupling is Rabi splitting in the absorption spectrum, which emerges from the formation of upper/lower polariton states and is proportional to the effective coupling strengthKhitrova et al. (2006); George et al. (2015). However, a significant inconsistency remains between the observed spectral splitting and the underlying polariton-induced phenomena — larger Rabi splitting does not always enhance the corresponding strong coupling effectChen et al. (2024); Fregoni et al. (2022); Khazanov et al. (2023).
Given this inconsistency, one might wonder: Is spectral splitting exclusively a result of strong light-matter coupling? In the presence of weak disorder, the effective Rabi splitting can be either enhanced or suppressed, depending on the nature of the disorder (energetic or orientational, static or dynamical)Gera and Sebastian (2022); Zhou et al. (2023); Climent et al. (2024). It has been shown that disorder leads to unexpected phenomena, such as enhanced transport and entanglementAllard and Weick (2022); Du and Yuen-Zhou (2022); Wellnitz et al. (2022); Tutunnikov et al. (2024). To rationalize these phenomena, the prevalent explanation often involves the interaction between polaritons and dark states—molecular excitation states that remain uncoupled from the photon modeKhazanov et al. (2023); Pandya et al. (2022); Botzung et al. (2020); Upton et al. (2013). Notably, most treatments of disorder consider the dark-state contribution as a perturbation that modulates the polariton states, thereby affecting the effective Rabi splitting.Zhou et al. (2023); Pérez-Sánchez et al. (2023). Nevertheless, given that the photon mode interacts collectively with a large number of molecules and is subject to extensive disorder stemming from the spatial distribution of electromagnetic fields, molecular orientations, and environmental fluctuations, it seems improbable that perturbation theory can fully capture the impact of disorder on suppression/enhancement of spectral splitting.
In this letter, we reveal an unexpected spectral splitting as induced by strong disorder in light-matter coupling. Remarkably, in spectroscopic measurements, this disorder-induced spectral splitting is qualitatively indistinguishable from Rabi splitting observed in an ordered system. To elucidate this phenomenon, we develop non-perturbative approaches using collective bright and dark modes along with classical electrodynamics simulations. Our analytical solution predicts a phase diagram delineating the regimes of strong coupling and strong disorder where spectral splitting can be observed. Furthermore, we consider a disordered molecular ensemble coupled to a plasmonic nanodisk and numerically demonstrate this disorder-induced effect.
Model—
We consider an ensemble of molecules coupled to a plasmonic photon mode described by the total Hamiltonian
| (1) |
Here the plasmonic cavity photon is characterized by the complex-valued frequency where , and are the line width, frequency and annihilation operator for the cavity photon mode. The molecule ensemble comprises a set of identical molecules with where is the molecular excitation energy and is the relaxation rate. We denote as the annihilation operator of the -th molecule and neglect the inter-molecular interactions and dipole self-energy termsFlick et al. (2017); Mandal et al. (2020). The molecule-plasmon coupling () explicitly depends on due to the spatial distribution of the electromagnetic fields and molecular orientations beyond the long-wavelength approximation. Both the molecular systems and plasmonic cavity mode are driven by an incident field with the driving amplitude and the driving frequency . The plasmonic photon mode is coupled to the incident field by and the molecule-field coupling is . Note that we employ the rotating wave approximation.
With the model Hamiltonian, we can derive the equation of motion for their expectation values, and , using the Heisenberg equation and Ehrenfest theorem. We use the steady state anstaz and and the steady-state amplitudes and satisfy the following equation of motion (EOM)
| (2) | ||||
| (3) |
The absorption spectrum can be computed in terms of the steady-state amplitude by
| (4) |
Note that the steady-state absorption spectrum is derived using the energy loss rate of the incident field SM .
Equations of motion for collective modes—
In the presence of disorder, we express the molecule-field and molecule-plasmon coupling in the form of and . The average coupling strength is given by and . The coupling disorder is characterized by their variance and , respectively. Notably, the correlation between and is quantized by the co-variance where the correlation parameter is a complex number with .
From Eqs. (2) and (3), we define the following collective modes: (i) the bright mode , (ii) the dark mode for the molecule-plasmon coupling , and (iii) the dark mode for the molecule-field coupling . These collective modes satisfy the effective EOM
| (5) |
and the absorption power can be expressed as
| (6) |
Note that, for given values of and , solving Eq. (5) is equivalent to solving Eqs. (2) and (3). We emphasize that the absorption spectrum is expressed in terms of , and .
Under the resonant condition (), the key insight we gain from the collective-mode EOM is as follows. We notice that the matrix in Eq. (5) has two degenerate eigenvalues and two separated eigenvalues . The analytical expression of is a combination of a Lorentzian peak centered at and two side peaks centered at SM .Importantly, the energy separation between the side peaks is , indicating that the spectral splitting depends on both the bright-mode coupling strength () and the dark-mode coupling strength (). We emphasize that observing spectral splitting alone is insufficient to determine whether the splitting arises from or . Additionally, we note that the scaling of the energy separation persists regardless of whether the splitting is due to or .
Electrodynamics simulation—
In a more realistic system, the coupling parameters , , can be estimated by employing classical electrodynamics simulationsOskooi et al. (2010). Firstly, we numerically calculate the absorption spectrum in the absence of the molecules ()SM .Then we can estimate , , and by fitting the absorption spectrum to the functional form (derived from Eq. (2) with )
| (7) |
Meanwhile, the classical electrodynamics simulation provides the total field and the incident electric field . We approximate the local plasmonic field as , assuming that the far-field scattering is weakly coupled to molecules near the plasmonic nanostructure. In addition, we neglect the radiative feedback from molecular emissions, so the local field is generated solely by the plasmon mode, i.e. Miwa and Schatz (2021).
Next, to calculate the absorption spectrum in the presence of a molecular ensemble, we introduce three approaches.
(I) Homogeneous and isotropic approximation: We assume the molecular distribution is homogeneous and the molecular orientation is isotropic and uncorrelated with the position. Thus, we can treat the molecular ensemble as a continuum with the average coupling strength (due to the isotropic assumption) and numerically calculate and SM
| (8) | ||||
| (9) |
Here is the amplitude of the transition dipole moment and denote the average within a chosen volume . With , , and obtained by numerical integration of the electric fields, we can calculate by solving Eqs. (5–6).
(II) Monte Carlo Method: We randomly sample molecular position and dipole orientation in close proximity to a plasmonic nanostructure to generate and by
| (10) | ||||
| (11) |
Note that and indicate their Fourier component at frequency respectively. With and for molecular ensemble, we can solve Eqs. (2–3) by direct matrix inversion and calculate the absorption spectrum by Eq. (4).
Disorder-Induced Spectral Splitting—
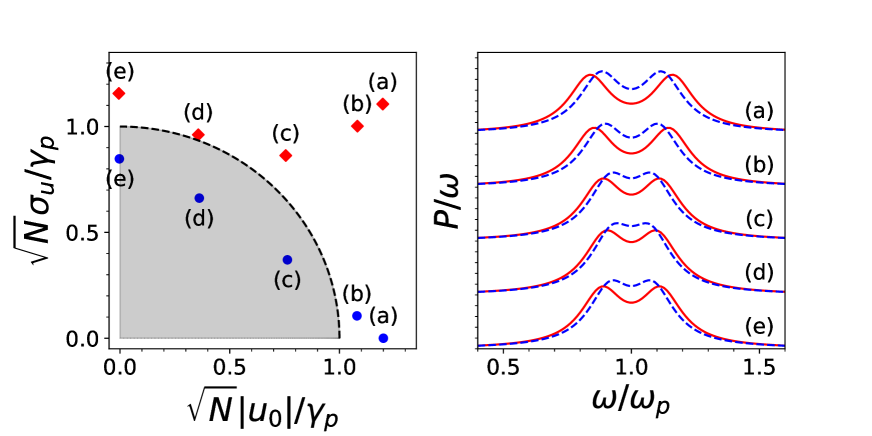
Before calculating the nanodisk spectrum, it is useful to gain insights into the effective coupling model. For simplicity, we choose as a real-valued parameter (subject to a unitary transformation)SM . First, we consider a closed cavity (, i.e. and ) where the external field is not directly coupled to the molecules. We assume that the molecule-plasmon coupling takes the form . Here is a random variable following a Gaussian distribution of mean and width for modeling the spatial variation of the electromagnetic field; is a uniform random variable in for modeling the molecular orientation. For the resonance condition, we use as a unit of energy and . We choose and consider the long-wavelength approximation (LWA) case () and the non-uniform field case ().
Fig 1 illustrates a phase diagram in terms of and and their corresponding absorption spectra. For completely aligned molecules ((a), ), both cases exhibit a spectral splitting larger than , but caused by different mechanisms. In the LWA case, the energy separation is attributed to strong bright-mode coupling (), indicating that the spectral splitting is due to strong light-matter coupling (i.e. Rabi splitting). However, in the non-uniform field case, the energy separation stems from both the bright-mode coupling and the dark-mode coupling (). Notably, for (c)–(e), the LWA cases are within the regime and the two peaks cannot be resolved (shown in the right panel).
For molecules with large orientational disorder ((e), ), the bright-mode coupling strength becomes zero (i.e. ), and the absorption spectrum solely results from the dark-mode coupling . In the right panel of Fig 1, we observe that the disorder-induced spectral splitting in the corresponding spectrum for the non-uniform field case (red (e)). More importantly, we find that the red (e) spectrum is almost identical to the blue (a) spectrum (obtained in the LWA due to strong bright-mode coupling). This result suggests that the observed spectral splitting alone is insufficient to reliably identify strong light-mater coupling.
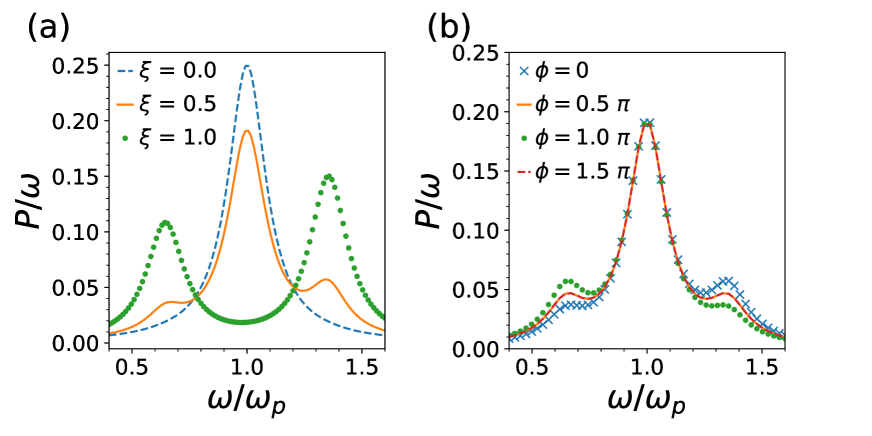
To further analyze the disorder-induced spectral splitting, we turn our attention to an open cavity with a completely disordered molecular ensemble. We set and choose the coupling variance to be and , and vary the correlation parameter . In Fig. 2(a), we differentiate the spectra for the uncorrelated(), partially correlated (), and fully correlated coupling (). For the uncorrelated case (), since the and modes are orthogonal to each other, the central peak is contributed by the mode (proportional to ) and the side peaks are contributed only by the plasmonic mode (scaled with ). Thus, the central peak dominates as we choose . For a partially correlated case (), three peaks are visible as a result of mixing the and modes. For the fully correlated coupling (), the central peak vanishes and the side peaks are dominated by the mode, manifesting disorder-induced spectral splitting. In Fig. 2(b), we show that the interference of the side peak as the relative phase of the correlation parameter varies. Since we chose to be a real value, this interference between the and modes is controlled by the relative phase .
Molecular ensemble coupled to a plasmonic nanodisk—
With the insight we gained from the effective coupling model, we are now ready to analyze the absorption spectrum as we obtained by classical electrodynamics simulations. Here we consider a gold disk of radius and thickness placed on the - plane. The incident field is chosen to be linearly polarized in the direction and propagating toward the direction. We employ the finite-difference time-domain (FDTD) method to calculate the absorption spectrum without molecular ensemble using a short pulse and SM ; Taflove and Hagness (2005); Oskooi et al. (2010); Sukharev (2023). By fitting the absorption spectrum in the absence of the molecular ensemble, we can estimate the plasmonic frequency and the linewidth . For approaches (II) and (III), we sample molecular positions with random orientations in the molecular layer of thickness and calculate and using Eqs. (10) and (11).
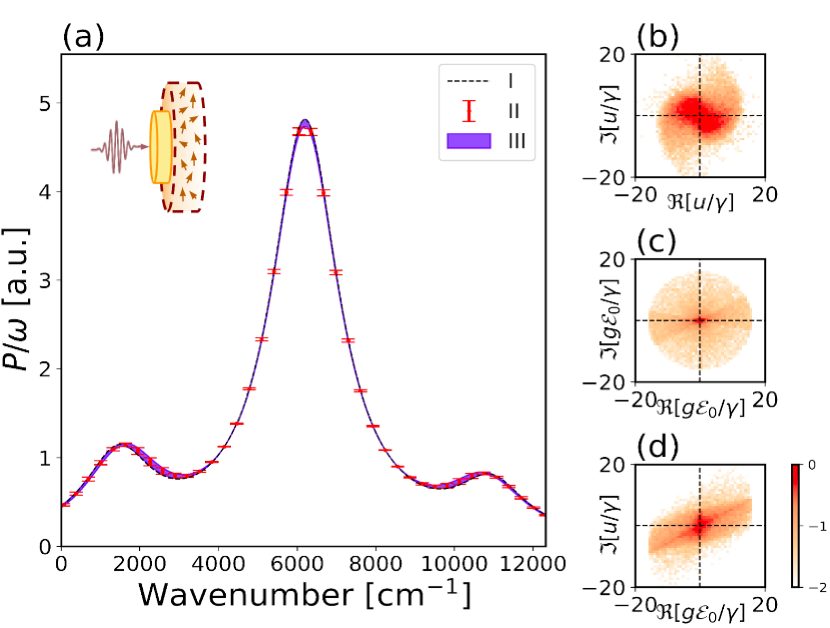
Fig. 3(a) demonstrates agreement across the three approaches for this system. Notably, the system exhibits radiative coupling disorder, as both the molecule-field coupling and molecule-plasmon coupling distributions are centered at the origin (Fig. 3 (b,c)). This observation indicates that the sampled molecules follow the isotropic approximation (as assumed in Approach (I)), with and both odd under the inversion symmetry transformation . In Fig. 3(d), the joint distribution of and clusters along a linear trend, suggesting partial correlation with . As a result, the simulated absorption spectrum agrees with the corresponding spectrum in Fig. 2(b). Furthermore, in the absence of the incident field (), the central peak will disappear, and the two side peaks recover the disorder-induced spectral splitting shown in Fig. 1.
Conclusion—
We reveal that spectral splitting, a widely accepted signature of strong light-matter interactions, can be observed in the strong disorder regime. To elaborate on this observation, we develop an effective model using collective modes and demonstrate this phenomenon using electrodynamics simulations of a molecular ensemble coupled to a plasmonic nanodisk. Our findings represent a paradigm shift in understanding strong light-matter interactions in complex chemical environments, highlighting disorder effect as a crucial factor. We emphasize that disorder-induced spectral splitting originates from collective dark modes, while the typical Rabi splitting arises from the bright mode. Notably, despite their different origins, these effects appear similar in steady-state absorption spectroscopy.
Looking ahead, a key question now is how to distinguish whether a system exhibits strong coupling effects induced by polaritons or strong disorder effects dominated by the dark states. Beyond steady-state observations, transient dynamics offer a potential route through differentiating the relaxation and decoherence behaviors of polaritonic and dark statesVirgili et al. (2011); Pérez-Sánchez et al. (2023). Another approach is to examine off-resonant excitation conditions to isolate distinct contributions from coherent polaritonsDelPo et al. (2020). We will pursue these directions to harness strong light-matter interactions in diverse, disordered environments.
Acknowledgment—
This work was supported by the University of Notre Dame and Materials Science and Engineering fellowship. We are grateful to Yi-Ting Hsu for discussions.
References
- Ebbesen (2016) T. W. Ebbesen, Accounts of Chemical Research 49, 2403 (2016).
- Ribeiro et al. (2018) R. F. Ribeiro, L. A. Martínez-Martínez, M. Du, J. Campos-Gonzalez-Angulo, and J. Yuen-Zhou, Chemical Science 9, 6325 (2018).
- Mandal et al. (2023) A. Mandal, M. A. Taylor, B. M. Weight, E. R. Koessler, X. Li, and P. Huo, Chemical Reviews 123, 9786 (2023).
- Xiang and Xiong (2024) B. Xiang and W. Xiong, Chemical Reviews 124, 2512 (2024).
- Thomas et al. (2016) A. Thomas, J. George, A. Shalabney, M. Dryzhakov, S. J. Varma, J. Moran, T. Chervy, X. Zhong, E. Devaux, C. Genet, J. A. Hutchison, and T. W. Ebbesen, Angewandte Chemie International Edition 55, 11462 (2016).
- Li et al. (2022) T. E. Li, B. Cui, J. E. Subotnik, and A. Nitzan, Annual Review of Physical Chemistry 73, 43 (2022).
- Du and Yuen-Zhou (2022) M. Du and J. Yuen-Zhou, Physical Review Letters 128, 096001 (2022).
- Orgiu et al. (2015) E. Orgiu, J. George, J. A. Hutchison, E. Devaux, J. F. Dayen, B. Doudin, F. Stellacci, C. Genet, J. Schachenmayer, C. Genes, G. Pupillo, P. Samorì, and T. W. Ebbesen, Nature Materials 14, 1123 (2015).
- Xu et al. (2023) D. Xu, A. Mandal, J. M. Baxter, S.-W. Cheng, I. Lee, H. Su, S. Liu, D. R. Reichman, and M. Delor, Nature Communications 14, 3881 (2023).
- Balasubrahmaniyam et al. (2023) M. Balasubrahmaniyam, A. Simkhovich, A. Golombek, G. Sandik, G. Ankonina, and T. Schwartz, Nature Materials (2023), 10.1038/s41563-022-01463-3.
- Steger et al. (2013) M. Steger, G. Liu, B. Nelsen, C. Gautham, D. W. Snoke, R. Balili, L. Pfeiffer, and K. West, Physical Review B 88, 235314 (2013).
- Hou et al. (2020) S. Hou, M. Khatoniar, K. Ding, Y. Qu, A. Napolov, V. M. Menon, and S. R. Forrest, Advanced Materials 32, 2002127 (2020).
- Aberra Guebrou et al. (2012) S. Aberra Guebrou, C. Symonds, E. Homeyer, J. C. Plenet, Y. N. Gartstein, V. M. Agranovich, and J. Bellessa, Physical Review Letters 108 (2012), 10.1103/PhysRevLett.108.066401.
- Lidzey et al. (2000) D. G. Lidzey, D. D. C. Bradley, A. Armitage, S. Walker, and M. S. Skolnick, Science 288, 1620 (2000).
- Thomas et al. (2019) A. Thomas, L. Lethuillier-Karl, K. Nagarajan, R. M. A. Vergauwe, J. George, T. Chervy, A. Shalabney, E. Devaux, C. Genet, J. Moran, and T. W. Ebbesen, Science 363, 615 (2019).
- Brawley et al. (2021) Z. T. Brawley, S. D. Storm, D. A. Contreras Mora, M. Pelton, and M. Sheldon, The Journal of Chemical Physics 154, 104305 (2021).
- Khitrova et al. (2006) G. Khitrova, H. M. Gibbs, M. Kira, S. W. Koch, and A. Scherer, Nature Physics 2, 81 (2006).
- George et al. (2015) J. George, S. Wang, T. Chervy, A. Canaguier-Durand, G. Schaeffer, J.-M. Lehn, J. A. Hutchison, C. Genet, and T. W. Ebbesen, Faraday Discussions 178, 281 (2015).
- Chen et al. (2024) L. Chen, A. P. Fidler, A. M. McKillop, and M. L. Weichman, Nanophotonics (2024), 10.1515/nanoph-2023-0747.
- Fregoni et al. (2022) J. Fregoni, F. J. Garcia-Vidal, and J. Feist, ACS Photonics 9, 1096 (2022).
- Khazanov et al. (2023) T. Khazanov, S. Gunasekaran, A. George, R. Lomlu, S. Mukherjee, and A. J. Musser, Chemical Physics Reviews 4, 041305 (2023).
- Gera and Sebastian (2022) T. Gera and K. L. Sebastian, The Journal of Chemical Physics 156, 194304 (2022).
- Zhou et al. (2023) Z. Zhou, H.-T. Chen, J. E. Subotnik, and A. Nitzan, Physical Review A 108, 023708 (2023).
- Climent et al. (2024) C. Climent, J. E. Subotnik, and A. Nitzan, Physical Review A 109, 052809 (2024).
- Allard and Weick (2022) T. F. Allard and G. Weick, Physical Review B 106, 245424 (2022).
- Wellnitz et al. (2022) D. Wellnitz, G. Pupillo, and J. Schachenmayer, Communications Physics 5, 1 (2022).
- Tutunnikov et al. (2024) I. Tutunnikov, M. Qutubuddin, H. R. Sadeghpour, and J. Cao, “Characterization of Polariton Dynamics in a Multimode Cavity: Noise-enhanced Ballistic Expansion,” (2024), arXiv:2410.11051.
- Pandya et al. (2022) R. Pandya, A. Ashoka, K. Georgiou, J. Sung, R. Jayaprakash, S. Renken, L. Gai, Z. Shen, A. Rao, and A. J. Musser, Advanced Science 9, 2105569 (2022).
- Botzung et al. (2020) T. Botzung, D. Hagenmüller, S. Schütz, J. Dubail, G. Pupillo, and J. Schachenmayer, Physical Review B 102, 144202 (2020).
- Upton et al. (2013) L. Upton, M. Harpham, O. Suzer, M. Richter, S. Mukamel, and T. Goodson, The Journal of Physical Chemistry Letters 4, 2046 (2013).
- Pérez-Sánchez et al. (2023) J. B. Pérez-Sánchez, A. Koner, N. P. Stern, and J. Yuen-Zhou, Proceedings of the National Academy of Sciences 120, e2219223120 (2023).
- Flick et al. (2017) J. Flick, M. Ruggenthaler, H. Appel, and A. Rubio, Proceedings of the National Academy of Sciences 114, 3026 (2017).
- Mandal et al. (2020) A. Mandal, T. D. Krauss, and P. Huo, The Journal of Physical Chemistry B 124, 6321 (2020).
- (34) See Supplemental Materials.
- Oskooi et al. (2010) A. F. Oskooi, D. Roundy, M. Ibanescu, P. Bermel, J. D. Joannopoulos, and S. G. Johnson, Computer Physics Communications 181, 687 (2010).
- Miwa and Schatz (2021) K. Miwa and G. C. Schatz, Physical Review A 103, L041501 (2021).
- Taflove and Hagness (2005) A. Taflove and S. C. Hagness, Computational Electrodynamics: The Finite-Difference Time-Domain Method, Third Edition, 3rd ed. (Artech House Publishers, Boston, 2005).
- Sukharev (2023) M. Sukharev, Journal of Computational Physics 477, 111920 (2023).
- Virgili et al. (2011) T. Virgili, D. Coles, A. M. Adawi, C. Clark, P. Michetti, S. K. Rajendran, D. Brida, D. Polli, G. Cerullo, and D. G. Lidzey, Physical Review B 83, 245309 (2011).
- DelPo et al. (2020) C. A. DelPo, B. Kudisch, K. H. Park, S.-U.-Z. Khan, F. Fassioli, D. Fausti, B. P. Rand, and G. D. Scholes, The Journal of Physical Chemistry Letters 11, 2667 (2020).