[table]capposition=top
TDDBench: A Benchmark for Training data detection
Abstract
Training Data Detection (TDD) is a task aimed at determining whether a specific data instance is used to train a machine learning model. In the computer security literature, TDD is also referred to as Membership Inference Attack (MIA). Given its potential to assess the risks of training data breaches, ensure copyright authentication, and verify model unlearning, TDD has garnered significant attention in recent years, leading to the development of numerous methods. Despite these advancements, there is no comprehensive benchmark to thoroughly evaluate the effectiveness of TDD methods. In this work, we introduce TDDBench, which consists of 13 datasets spanning three data modalities: image, tabular, and text. We benchmark 21 different TDD methods across four detection paradigms and evaluate their performance from five perspectives: average detection performance, best detection performance, memory consumption, and computational efficiency in both time and memory. With TDDBench, researchers can identify bottlenecks and areas for improvement in TDD algorithms, while practitioners can make informed trade-offs between effectiveness and efficiency when selecting TDD algorithms for specific use cases. Our large-scale benchmarking also reveals the generally unsatisfactory performance of TDD algorithms across different datasets. To enhance accessibility and reproducibility, we open-source TDDBench for the research community.
1 Introduction
Training Data Detection (TDD) (Shi et al., 2024), also known as Membership Inference Attack (MIA) in computer security literature (Shokri et al., 2017), aims to determine whether a specific data instance was used to train a target machine learning model. TDD has a wide range of applications. For example, it can be used to assess a model’s memorization of its training data and to audit the risks of data leakage (Carlini et al., 2022b). TDD has gained even more importance in the era of deep learning and large language models (LLMs), where models, often with billions of parameters, act as opaque black boxes. This raises the need to examine whether model owners have illegally utilized copyrighted material, such as books (Abd-Alrazaq et al., 2023), or personal emails (Mozes et al., 2023). Moreover, TDD contributes to discussions on machine learning accountability in the era of AI, as concerns grow over how these models handle sensitive data. As machine unlearning becomes increasingly employed to remove users’ personal data from models, TDD serves as a critical tool to validate these unlearning processes (Chen et al., 2021; Kurmanji et al., 2024).
Given the growing importance of TDD, several benchmarks have been developed to evaluate TDD algorithms (Niu et al., 2023; He et al., 2022; Duan et al., 2024). However, these benchmarks have several limitations: 1). Most evaluations primarily focus on TDD algorithms for image data, leaving other modalities like text and tabular data underexplored. 2). Many TDD methods developed in the past two years, particularly those focused on deep learning and LLMs, are not included in these benchmarks. 3). The effect of the target model (i.e., the model that was trained using the data) on TDD algorithms has not been thoroughly examined. 4). Current evaluations focus primarily on the detection performance of TDD algorithms, while practical considerations like efficiency, memory consumption, and other factors relevant to real-world deployment are often overlooked.
To address these limitations, we introduce TDDBench, a comprehensive framework for benchmarking TDD algorithms. Figure 1 provides an overview of TDDBench. The benchmark includes 13 datasets across three data modalities (tabular, text, and image) and evaluates 21 state-of-the-art TDD algorithms on 41 different target models, including the large language model Pythia-12B. We also categorize the 21 TDD algorithms into four types based on their algorithmic characteristics, including metric-based, learning-based, model-based, and query-based. Using this new benchmark, we conduct large-scale experiments to thoroughly assess TDD algorithms. Specifically, we aim to investigate: 1). The performance of TDD algorithms across various datasets and data modalities. 2). The impact of the target model on TDD algorithms. 3). The limitations and areas for improvement in TDD algorithms. 4). The performance of TDD algorithms from multiple perspectives, including detection performance, practicality, and efficiency in terms of time and memory usage.
The large-scale experimental results reveal several key findings. First, there is a significant performance gap between different types of TDD algorithms, with model-based TDD methods generally outperforming the others. However, this outperformance comes at a cost, as model-based methods require building multiple reference models, leading to high computational expenses. Second, memorization of training data plays a crucial role in the performance of TDD algorithms, with larger target models—often prone to memorization—exhibiting higher TDD success rates. Third, the performance of TDD algorithms is highly dependent on knowledge of the underlying target model architecture. Overall, our experiments show that there is no single best method across all scenarios, and notably, many TDD algorithms perform poorly on data modalities beyond images, indicating the need for further improvement in non-image domains.
The main contributions of this paper are threefold:
A novel and comprehensive TDD benchmark: We introduce TDDBench, a benchmark consisting of datasets across three modalities—image, table, and text. We have open-sourced TDDBench for the research community at https://anonymous.4open.science/r/TDDBench-8078.
New insights in TDD performance: By benchmarking 21 state-of-the-art TDD algorithms, we provide insights into recent advancements in TDD, including strategies for reducing reliance on model-specific knowledge and maximizing the benefits of greater computational resources.
Multi-aspect metrics: Our comprehensive evaluation of TDD performance goes beyond simple detection accuracy to include practical considerations such as computational complexity, highlighting the trade-offs necessary for deploying TDD algorithms in real-world applications.
2 TDDBench: Training data detection benchmark across multiple modalities
2.1 Preliminaries and Problem Definition
Training Data Detection (TDD), also known as membership inference, is formally defined as follows: Given a target machine learning model and a data point , the objective of TDD is to determine whether the target model used the data point during its training phase (Shokri et al., 2017; Carlini et al., 2022a). Here, denotes the parameters of the target machine learning model, and is often referred to as the target model.
In this work, we consider black-box training data detection, meaning that we have access only to the outcomes of the target model for specific data points. There are two reasons for this assumption. First, many real-world target models hold significant commercial value and typically do not publicly disclose model parameters, making access to internal model parameters infeasible. Secondly, existing literature has shown that white-box detection methods offer limited advantages compared to black-box methods (Sablayrolles et al., 2019; Nasr et al., 2019).
2.2 Data Modalities, Datasets and Target Models
TDDBench consists of 13 datasets across three data modalities: image, tabular, and text. It also implements 11 distinct model architectures for these data modalities, resulting in a total of 41 target models. Additionally, TDDBench incorporates 21 state-of-the-art TDD algorithms. We illustrate the main differences between the proposed TDDBench and existing benchmarks in Table 1.
Dataset. Table 2 presents a summary of the datasets in TDDBench. It includes three data modalities: image, tabular, and text. TDDBench incorporates datasets commonly used to evaluate TDD algorithms in previous literatures (Truex et al., 2019; Hui et al., 2021), such as CIFAR-10 and Purchase. We also compile new datasets that potentially contain private or copyright-sensitive information, including CelebA (human faces), BloodMNIST (medical), Adult (personal income), and Tweet (social networks), which are more likely to necessitate TDD for tasks like copyright verification and unlearning confirmation. Additionally, WIKIMIA is a dataset specifically designed to evaluate TDD algorithms on large language models.
| Modality | Dataset | #Samples | #Classes | Brief description |
| Image | CIFAR-10 (Krizhevsky et al., 2009) | 60,000 | 10 | General dataset |
| CIFAR-100 (Krizhevsky et al., 2009) | 60,000 | 100 | General dataset | |
| BloodMNIST (Yang et al., 2023) | 17,092 | 8 | Medical image | |
| CelebA (Liu et al., 2015) | 202,599 | 2 | Human face | |
| Tabular | Purchase (Shokri et al., 2017) | 197,324 | 100 | Purchase record |
| Texas (Shokri et al., 2017) | 67,330 | 100 | Hospital discharge data | |
| Adult (Asuncion et al., 2007) | 48,842 | 2 | Personal income | |
| Student (Cortez & Silva, 2008) | 4,424 | 3 | Education information | |
| Text | Rotten Tomatoes (Pang & Lee, 2005) | 10,662 | 2 | Movie reviews |
| Tweet Eval (Barbieri et al., 2020) | 12,970 | 2 | User tweets | |
| GLUE-CoLA (Wang et al., 2018) | 9,594 | 2 | Books and journal articles | |
| ECtHR Articles (Chalkidis et al., 2023) | 5,063 | 13 | Legal texts | |
| WIKIMIA (Shi et al., 2024) | 1,650 | 2 | General dataset |
Target Models. We select various model architectures for each data modality. Specifically, for image datasets, we train WRN28-2 (Zagoruyko, 2016), ResNet18 (He et al., 2016), VGG11 (Simonyan & Zisserman, 2014), and MobileNet-v2 (Sandler et al., 2018). For the tabular datasets, we employ Multilayer Perceptron (Rumelhart et al., 1986), CatBoost (Dorogush et al., 2018), and Logistic Regression (Hosmer Jr et al., 2013).
For textual datasets, except WIKIMIA, in contrast to the target models for the image and tabular modalities, which are trained from scratch, we fine-tune the open-source pre-trained language models DistilBERT (Sanh et al., 2019), RoBERTa (Liu et al., 2019), and Flan-T5 (Chung et al., 2024) on the text datasets, enabling us to detect fine-tuned data using the TDD algorithm. Finally, for the WIKIMIA dataset, we use it to perform TDD on large language models, specifically focusing on the open-sourced Pythia(Biderman et al., 2023). Training details of the target models are presented in Appendix A.3.
In summary, we implement different target models for each data modality. Since we have four image datasets, each with four target models, the total combination is 16 target image models. Similarly, for tabular data, four datasets and three target models give us a total of 12 target tabular models. For text data, four datasets and three target models provide a total of 12 target text models. Finally, Pythia is used as the target model to examine TDD on the WIKIMIA text dataset. In total, we have 41 target models, which to our knowledge, is one of the most comprehensive benchmarks for TDD.
2.3 TDD Algorithms
We implement 21 state-of-the-art TDD algorithms in TDDBench. To facilitate comparison and discussion, we categorize these TDD algorithms into four groups based on the algorithm’s design paradigm: metric-based, learning-based, model-based, and query-based algorithms. Table 3 provides an overview of the implemented TDD algorithms in TDDBench, outlining their categories and detection criteria. These TDD algorithms are discussed in detail in Appendix A.1.
| Algorithm type | Algorithm | Detection criterion |
|---|---|---|
| Metric-based | Metric-loss (Yeom et al., 2018) | Loss |
| Metric-conf (Song et al., 2019) | Confidence | |
| Metric-corr (Leino & Fredrikson, 2020) | Correctness | |
| Metric-ent (Shokri et al., 2017; Song & Mittal, 2021) | Entropy | |
| Metric-ment (Song & Mittal, 2021) | Modified prediction entropy | |
| Learning-based | Learn-original (Shokri et al., 2017) | Prediction vector |
| Learn-top3 (Salem et al., 2019) | Top3 confidence | |
| Learn-sorted (Salem et al., 2019) | Sorted prediction vector | |
| Learn-label (Nasr et al., 2018) | Prediction vector, true label | |
| Learn-merge (Amit et al., 2024) | Merging of various detection criteria | |
| Model-based | Model-loss (Sablayrolles et al., 2019) | Loss |
| Model-calibration (Watson et al., 2021) | Loss | |
| Model-lira (Carlini et al., 2022a) | Scaled logit | |
| Model-fpr (Ye et al., 2022) | Scaled logit | |
| Model-robust (Zarifzadeh et al., 2024) | Confidence | |
| Query-based | Query-augment (Choquette-Choo et al., 2021) | Correctness |
| Query-transfer (Li & Zhang, 2021) | Loss from surrogate model | |
| Query-adv (Li & Zhang, 2021; Choquette-Choo et al., 2021) | Distance from the decision boundary | |
| Query-neighbor (Jayaraman et al., 2021; Mattern et al., 2023) | Loss | |
| Query-qrm (Bertran et al., 2024) | Scaled logit | |
| Query-ref (Wen et al., 2023) | Scaled logit |
Metric-based methods rely on the analysis of certain statistical properties of a target model’s output, such as confidence scores, prediction probabilities, or loss values, to distinguish between training data and non-training data. Specifically, Metric-loss (Yeom et al., 2018) is the first metric-based detection method, predicting that data points with a loss below a certain threshold are part of the training data for the target model. Similarly, other works have proposed using the maximum confidence of the target model output (denoted as Metric-conf (Song et al., 2019)), the correctness of the target model output (denoted as Metric-corr (Leino & Fredrikson, 2020)), the entropy of prediction probability distributions (denoted as Metric-ent (Shokri et al., 2017; Song & Mittal, 2021)), and modified entropy of the prediction (denoted as Metric-ment (Song & Mittal, 2021)).
Learning-based methods involve training an auxiliary classifier (meta-classifier) to distinguish between training data and non-training data. In the literature, neural networks (NNs) are often employed as the auxiliary classifier. The primary differences between learning-based TDD methods lie in the choice of input features for the auxiliary classifier. Earlier work (Shokri et al., 2017) has proposed using the original prediction vector of the target model (denoted as Learn-original). Other works have suggested using the top-3 prediction confidences (denoted as Learn-top3 (Salem et al., 2019)) , the sorted prediction vector (denoted as Learn-sorted (Salem et al., 2019)) , the true label of the example combined with the prediction vector (denoted as Learn-label (Nasr et al., 2018)) , and a mix of different detection metrics (denoted as Learn-merge (Amit et al., 2024)). In black-box TDD scenarios, a shadow model is constructed to mimic the behavior of the target model, providing the necessary data to train the auxiliary classifier.
Model-based methods involve building multiple reference models, some of which are trained with the focal data point , while others are trained without it. The detection method then analyzes the characteristics (such as loss distribution) of data points when they are included in training versus when they are not. The target model’s output on the focal data point is then compared to the reference models’ characteristics to determine whether it was used in training. Compared to metric-based and learning-based methods, model-based methods do not solely rely on the target model’s output, but can compare it with reference models. These methods have gained significant attention in recent years due to their superior performance. In the literature, different model-based methods utilize reference models in various ways, including learning the loss distribution of data points (denoted as Model-loss (Sablayrolles et al., 2019) and Model-calibration (Watson et al., 2021)), transforming TDD into a likelihood ratio problem based on the scaled logits of prediction results (denoted as Model-lira (Carlini et al., 2022a)), designing TDD that satisfies different false positive ratios (denoted as Model-fpr (Ye et al., 2022)), and creating more robust TDD methods (denoted as Model-robust (Zarifzadeh et al., 2024)).
Query-based methods involve using additional data instances, particularly those close to the focal data point , to query the target model. Compared to the other three types of detection methods, query-based methods leverage more output information from the target model to estimate the likelihood that the focal data point was used in model training. Specifically, we consider a data augmentation-based query method (denoted as Query-augment (Choquette-Choo et al., 2021)), a neighbor-based method (denoted as Query-neighbor (Jayaraman et al., 2021; Mattern et al., 2023)), a surrogate model-based method (denoted as Query-transfer (Li & Zhang, 2021)), an adversarial learning-based method (denoted as Query-adv (Li & Zhang, 2021; Choquette-Choo et al., 2021)), a quantile regression model- based method (denoted as Query-qrm (Bertran et al., 2024)), and a reference-model-based query method (denoted as Query-ref (Wen et al., 2023)).
It is also worth noting that different types of TDD methods may have varying requirements and assumptions for executing the detection. For example, metric-based methods have the fewest assumptions, relying solely on the target model’s output for prediction. In contrast, some model-based and query-based methods require additional auxiliary data to build reference models for prediction. In TDDBench, to ensure a fair comparison, we provide auxiliary data for methods that need it, ensuring that each method achieves its best possible detection performance.
3 Experiment Results and Analyses
Having compiled TDDBench, we now benchmark the performance of TDD algorithms. Since TDD algorithms can largely be categorized into four types based on their design paradigms, our experimental analysis is conducted at the category level. This allows us to systematically compare the strengths and weaknesses of each type of TDD algorithm.
We conduct experiments in three modalities including image, tabular, and text, to answer the following questions: Q1: What is the overall performance of the TDD algorithm across different datasets and model architectures? Q2: How does the target model impact the performance of the TDD algorithm, including model size and training-data memorization? Q3: How does the TDD algorithm perform when knowledge about the target model architecture is limited? Q4: How does the TDD algorithm perform in terms of overall performance, practicality, efficiency, and other factors?
3.1 Experiment Setting
Evaluation Protocol. We follow prior literatures in TDD evaluation (Carlini et al., 2022a; Ye et al., 2022). Specifically, given a dataset in TDDBench, we divide the dataset into a target dataset and an auxiliary dataset in a 50:50 ratio. For the target dataset, we further split it into two halves, where the first half serves as the training dataset to train the target model (e.g., an image classifier), and the remaining half is not used in training the target model. Therefore, the training dataset serves as the positive examples for training data detection, while the remaining data serves as the negative examples.
For TDD algorithms, such as model-based and learning-based methods that require training reference models or shadow models, we follow the approach in (Carlini et al., 2022a; Wen et al., 2023) by randomly partitioning the target dataset multiple times to train various reference and shadow models. The auxiliary dataset, also referred to as the population dataset in (Ye et al., 2022) and the shadow dataset in (Shokri et al., 2017), is available at the user’s discretion for use in the TDD algorithms. The auxiliary and target datasets do not overlap, ensuring that the auxiliary data is not accidentally used in training the target model. This characteristic allows for the training of quantile regression model and reference model that exclude the focal data point , which are utilized in certain TDD algorithms.
Target Model Implementation. We implement target models as described in Section 2.2. Techniques such as early stopping, data augmentation, and dropout are utilized to maximize the target model’s predictive accuracy (e.g., for tasks like image classification or sentiment analysis). The training and test accuracy of the target models, along with detailed training information, can be found in Appendix A.3.
TDD Method Implementation. For the metric-based TDD methods, as they rely solely on the target model’s prediction outcome, the implementation is straightforward. For the learning-based TDD methods, we construct a two-layer neural network with 64 and 32 hidden units as the auxiliary classifier. The learning rate is set to 0.001, using the Adam optimizer, and training continues until the validation accuracy does not improve for 30 epochs or until a maximum of 500 epochs is reached. For the model-based TDD methods, we train 16 reference models. Finally, for the query-based TDD methods, including Query-neighbor, Query-augment, and Query-ref, we limit the detection algorithms to a maximum of 10 additional queries per data point.
Evaluation Metrics, Mean, and Standard Deviation. TDD is framed as a binary classification problem that determines whether a data point was used in training the target model. Accordingly, we primarily use AUROC to evaluate the performance of TDD algorithms. Additionally, we include nine supplementary metrics, such as Precision, Accuracy, and TPR@1% FPR, with detailed experimental results provided in Appendix A.6. To ensure the robustness of the experimental results, we perform multiple random partitions for each dataset and independently repeat the experiments five times. We then report the average performance of all TDD algorithms. Standard deviations across the five repeated experiments are also measured, and due to page limitations, the complete standard deviation results are reported in Appendix A.5.
3.2 Overall detection performance across different datasets and models
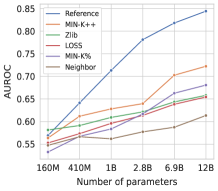
The main results from benchmarking TDD algorithms are presented in Tables 4 and 5. Specifically, Table 4 reports the average performance of TDD methods across different datasets, controlling for the same target model architecture within each modality. Table 5, on the other hand, presents the average performance of TDD methods across different target model architectures, benchmarked on CIFAR10 for image data, Purchase for tabular data, and Rotten Tomatoes for text data. Additionally, results involving large language models are illustrated in Figure 3(c) in Section 3.3.2. The results lead to several key findings:
Overall performance is not satisfactory. In most experimental settings, the AUC scores range between 0.5 and 0.6. From an AUC perspective, this is clearly unsatisfactory, as it indicates a high rate of false negatives and false positives. In other words, data points used by the target model are frequently misclassified as not being used, and vice versa. This is concerning and highlights the urgent need for advancing the performance of TDD methods. For model-based and query-based methods, whose results may be influenced by the number of reference models and queries, we perform a robust analysis by varying the number of reference models and queries. The results remain largely consistent across different configurations, as shown in Appendix A.4.
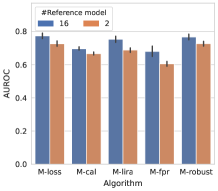
Model-based TDD methods achieve generally better detection performance. Across datasets and target models, model-based detection algorithms consistently outperform other methods. For instance, as shown in Table 4, all five model-based algorithms achieve an average performance near or above 0.65 across all 12 datasets, whereas the performance of metric-based and learning-based methods is substantially lower. Overall, these results highlight the performance advantage of model-based TDD methods.
Data’s task label information is useful. Some TDD methods leverage the focal data point’s ground truth label (e.g., image class label or sentiment class), while others do not. Experimental results demonstrate that incorporating label information significantly improves detection performance. For instance, Metric-ment consistently outperforms Metric-ent by utilizing data labels. Similar improvements are observed with Learn-label compared to Learn-original, where the former benefits from leveraging the label information while the latter does not.
Hybrid method has potential. Notably, Query-ref, which generates crafted query data for the image modality, achieves the best performance among all 21 TDD algorithms. While categorized as query-based, this method also trains reference models, similar to model-based methods, making it a hybrid of query-based and model-based approaches. This highlights the potential of combining the merits of different methods to enhance detection accuracy.
| Modality | Image | Tabular | Text | Avg. | |||||||||
| Dataset | CIFAR-10 | CIFAR-100 | BloodMNIST | CelebA | Purchase | Texas | Adult | Student | Rotten | Tweet | CoLA | ECtHR | |
| Metric-loss | 0.635 | 0.858 | 0.527 | 0.509 | 0.619 | 0.629 | 0.500 | 0.566 | 0.582 | 0.566 | 0.571 | 0.521 | 0.590 |
| Metric-conf | 0.635 | 0.858 | 0.527 | 0.509 | 0.619 | 0.629 | 0.500 | 0.566 | 0.582 | 0.566 | 0.571 | 0.521 | 0.590 |
| Metric-corr | 0.552 | 0.708 | 0.517 | 0.507 | 0.551 | 0.610 | 0.501 | 0.560 | 0.557 | 0.550 | 0.550 | 0.519 | 0.557 |
| Metric-ent | 0.628 | 0.848 | 0.525 | 0.508 | 0.616 | 0.563 | 0.498 | 0.520 | 0.561 | 0.528 | 0.519 | 0.507 | 0.568 |
| Metric-ment | 0.635 | 0.858 | 0.527 | 0.509 | 0.620 | 0.630 | 0.500 | 0.566 | 0.582 | 0.566 | 0.571 | 0.522 | 0.591 |
| Learn-original | 0.631 | 0.870 | 0.508 | 0.503 | 0.652 | 0.597 | 0.502 | 0.531 | 0.558 | 0.529 | 0.568 | 0.506 | 0.580 |
| Learn-top3 | 0.628 | 0.851 | 0.526 | 0.503 | 0.677 | 0.573 | 0.500 | 0.520 | 0.561 | 0.528 | 0.531 | 0.502 | 0.575 |
| Learn-sorted | 0.628 | 0.850 | 0.529 | 0.508 | 0.666 | 0.573 | 0.501 | 0.520 | 0.561 | 0.528 | 0.510 | 0.501 | 0.573 |
| Learn-label | 0.633 | 0.882 | 0.515 | 0.507 | 0.656 | 0.669 | 0.503 | 0.590 | 0.584 | 0.570 | 0.622 | 0.517 | 0.604 |
| Learn-merge | 0.656 | 0.893 | 0.523 | 0.507 | 0.684 | 0.686 | 0.502 | 0.595 | 0.584 | 0.569 | 0.620 | 0.530 | 0.612 |
| Model-loss | 0.664 | 0.852 | 0.560 | 0.522 | 0.725 | 0.767 | 0.509 | 0.670 | 0.773 | 0.756 | 0.752 | 0.655 | 0.684 |
| Model-calibration | 0.639 | 0.763 | 0.553 | 0.520 | 0.684 | 0.718 | 0.508 | 0.648 | 0.695 | 0.714 | 0.699 | 0.638 | 0.648 |
| Model-lira | 0.690 | 0.937 | 0.536 | 0.512 | 0.755 | 0.753 | 0.503 | 0.634 | 0.753 | 0.728 | 0.737 | 0.604 | 0.679 |
| Model-fpr | 0.647 | 0.852 | 0.552 | 0.516 | 0.697 | 0.723 | 0.507 | 0.641 | 0.679 | 0.722 | 0.708 | 0.635 | 0.657 |
| Model-robust | 0.635 | 0.889 | 0.552 | 0.520 | 0.711 | 0.762 | 0.509 | 0.669 | 0.766 | 0.745 | 0.746 | 0.621 | 0.677 |
| Query-augment | 0.573 | 0.761 | 0.517 | 0.502 | 0.612 | 0.612 | 0.500 | 0.560 | 0.570 | 0.551 | 0.561 | 0.518 | 0.570 |
| Query-transfer | 0.522 | 0.622 | 0.503 | 0.502 | 0.529 | 0.581 | 0.499 | 0.522 | 0.530 | 0.530 | 0.526 | 0.510 | 0.531 |
| Query-adv | 0.615 | 0.838 | 0.508 | 0.514 | 0.620 | 0.579 | 0.500 | 0.563 | 0.571 | 0.551 | 0.568 | 0.519 | 0.579 |
| Query-neighbor | 0.511 | 0.553 | 0.497 | 0.501 | 0.533 | 0.612 | 0.500 | 0.535 | 0.533 | 0.556 | 0.550 | 0.522 | 0.534 |
| Query-qrm | 0.532 | 0.574 | 0.510 | 0.505 | 0.523 | 0.530 | 0.500 | 0.526 | 0.524 | 0.521 | 0.511 | 0.512 | 0.522 |
| Query-ref | 0.735 | 0.941 | 0.566 | 0.526 | N/A | N/A | N/A | N/A | N/A | N/A | N/A | N/A | 0.692 |
| Dataset | CIFAR10(Image) | Purchase(Tabular) | Rotten-tomatoes(Text) | Avg. | |||||||
|---|---|---|---|---|---|---|---|---|---|---|---|
| Target model | WRN28-2 | ResNet18 | VGG11 | MobileNet-v2 | MLP | CatBoost | LR | DistilBERT | RoBERTa | Flan-T5 | |
| Metric-loss | 0.635 | 0.659 | 0.684 | 0.592 | 0.619 | 0.948 | 0.640 | 0.582 | 0.571 | 0.517 | 0.645 |
| Metric-conf | 0.635 | 0.659 | 0.684 | 0.592 | 0.619 | 0.948 | 0.640 | 0.582 | 0.571 | 0.517 | 0.645 |
| Metric-corr | 0.552 | 0.557 | 0.574 | 0.548 | 0.551 | 0.636 | 0.622 | 0.557 | 0.542 | 0.513 | 0.565 |
| Metric-ent | 0.628 | 0.654 | 0.680 | 0.582 | 0.616 | 0.943 | 0.594 | 0.561 | 0.555 | 0.509 | 0.632 |
| Metric-ment | 0.635 | 0.659 | 0.685 | 0.592 | 0.620 | 0.950 | 0.642 | 0.582 | 0.571 | 0.517 | 0.645 |
| Learn-original | 0.631 | 0.623 | 0.694 | 0.533 | 0.652 | 0.935 | 0.644 | 0.558 | 0.546 | 0.515 | 0.633 |
| Learn-top3 | 0.628 | 0.653 | 0.680 | 0.582 | 0.677 | 0.967 | 0.660 | 0.561 | 0.555 | 0.509 | 0.647 |
| Learn-sorted | 0.628 | 0.654 | 0.680 | 0.578 | 0.666 | 0.963 | 0.661 | 0.561 | 0.555 | 0.509 | 0.646 |
| Learn-label | 0.633 | 0.612 | 0.707 | 0.557 | 0.656 | 0.954 | 0.701 | 0.584 | 0.565 | 0.520 | 0.649 |
| Learn-merge | 0.656 | 0.628 | 0.727 | 0.528 | 0.684 | 0.968 | 0.716 | 0.584 | 0.566 | 0.518 | 0.657 |
| Model-loss | 0.664 | 0.709 | 0.729 | 0.607 | 0.725 | 0.975 | 0.776 | 0.773 | 0.656 | 0.602 | 0.721 |
| Model-calibration | 0.639 | 0.671 | 0.690 | 0.595 | 0.684 | 0.865 | 0.719 | 0.695 | 0.622 | 0.592 | 0.677 |
| Model-lira | 0.690 | 0.749 | 0.780 | 0.601 | 0.755 | 0.995 | 0.761 | 0.753 | 0.630 | 0.569 | 0.728 |
| Model-fpr | 0.647 | 0.684 | 0.712 | 0.619 | 0.697 | 0.976 | 0.724 | 0.679 | 0.623 | 0.589 | 0.695 |
| Model-robust | 0.635 | 0.677 | 0.704 | 0.602 | 0.711 | 0.983 | 0.796 | 0.766 | 0.639 | 0.574 | 0.709 |
| Query-augment | 0.573 | 0.575 | 0.633 | 0.542 | 0.612 | 0.696 | 0.664 | 0.570 | 0.546 | 0.512 | 0.592 |
| Query-transfer | 0.522 | 0.522 | 0.533 | 0.507 | 0.529 | 0.587 | 0.574 | 0.530 | 0.515 | 0.506 | 0.533 |
| Query-adv | 0.615 | 0.621 | 0.666 | 0.583 | 0.620 | 0.727 | 0.662 | 0.571 | 0.552 | 0.516 | 0.613 |
| Query-neighbor | 0.511 | 0.512 | 0.509 | 0.509 | 0.533 | 0.820 | 0.530 | 0.533 | 0.527 | 0.504 | 0.549 |
| Query-qrm | 0.532 | 0.537 | 0.541 | 0.530 | 0.523 | 0.946 | 0.632 | 0.524 | 0.528 | 0.506 | 0.580 |
| Query-ref | 0.735 | 0.800 | 0.843 | 0.656 | N/A | N/A | N/A | N/A | N/A | N/A | 0.759 |
3.3 The impact of target model
In this section, we examine the impact of the target model on TDD detection performance.
3.3.1 Data Memorization and Overfitting
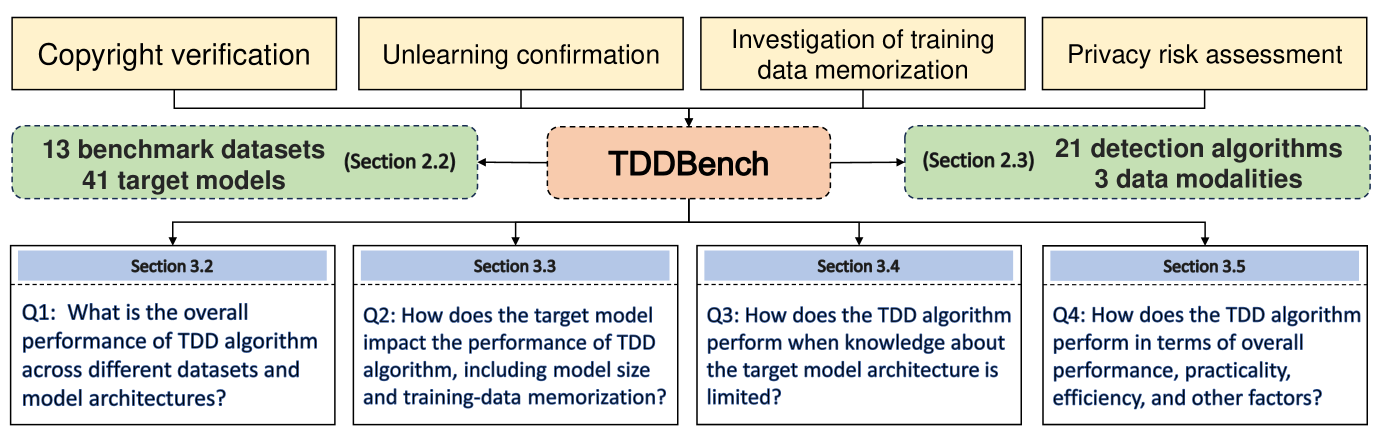
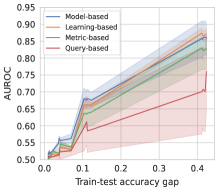
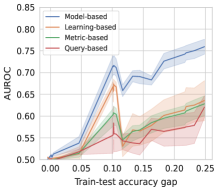
A common view is that the effectiveness of TDD is closely tied to the level of training-data memorization or overfitting exhibited by the target model during training (Yeom et al., 2018; Long et al., 2018). The disparity between the target model’s accuracy on the training set and the test set, known as the train-test accuracy gap, serves as an indicator of data memorization in prior literature (Carlini et al., 2022a). In our experiments, we document the train-test gaps of 12 distinct target models in Table 4, along with the corresponding performance of all detection methods. Specifically, the training of target models is repeated five times with different random training samples. Figure 2 illustrates the performance of various detection algorithms across different train-test gaps, with error bars representing 95% confidence intervals obtained from five independent trials. It is evident that the performance of all TDD methods is positively correlated with the train-test accuracy gap of the target model. When the train-test gap is maximal, indicating the target model may overfit to the training data, identifying whether a data point was used by the target model becomes relatively easier. In contrast, when the target model has a minimal train-test gap, the TDD algorithms often fall short in detection performance. Therefore, it is crucial for future TDD research to examine the generalizability of target models and report TDD performance when the train-test gap is small.
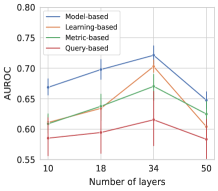
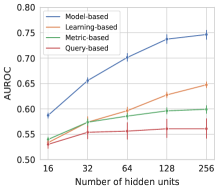
3.3.2 Target model size
We examine the impact of target model size on TDD performance. Specifically, in our experiment, we vary the number of layers in the ResNet architecture for image data, the number of hidden units in the MLP for tabular data, and the parameter sizes of the large language model Pythia for text data.
Due to limitations in computing resources, TDD on large models often does not involve the creation of shadow models or reference models. Drawing from prior studies (Shi et al., 2024; Duan et al., 2024), we utilize multiple detection methods suitable for pretrained large language models. Detailed descriptions of these detection methods can be found in Appendix A.2. Additionally, due to the lack of specific information regarding the training data used for large language models, we utilize the WIKIMIA (Shi et al., 2024), which collects training and non-training data for the large language model based on the model’s release timeline to evaluate the TDD method in large language models.
The results of the experiments are illustrated in Figure 3. It is observed that, in most cases, the performance of the detection method improves as the size of the model increases. This aligns with the expectation that an increase in model size typically enhances model memorization (Carlini et al., 2023; Arpit et al., 2017). However, an exception occurs when the number of layers in the ResNet model is expanded from 34 to 50, resulting in a decline in the detection method’s performance. One potential explanation for this anomaly is that the integration of residual connections in ResNet helps alleviate issues related to excessive memorization stemming from the increased depth of the model.
3.4 Performance when Knowledge about the Target Model is Limited
In the above experiments, we assumed that despite the black-box setting, TDD algorithms had some knowledge about the target model’s training algorithm. However, in real-world scenarios, it is possible that the data owner may lack detailed knowledge about the target model’s architecture, leading to significant differences between the reference and shadow models constructed by the TDD method and the actual target model. To explore this issue, we assess the performance of TDD when the reference and shadow models differ from the target model.
The results, presented in Table 6, show a noticeable decline in detection performance when the data owner has limited knowledge about the target model’s architecture. For example, Learn-original exhibits a 5.3% performance decline when using ResNet18 as the shadow model. This performance degradation can be attributed to discrepancies between the shadow and target models, which result in biased input features for training the auxiliary classifier. Moreover, the overall AUC performance remains unsatisfactory, highlighting the ineffectiveness of TDD algorithms in most datasets when knowledge about the target model is limited.
| Target model | WRN28-2(CIFAR-10) | MLP(Purchase) | DistilBERT(Rotten-tomatoes) | Avg. | |||||||
|---|---|---|---|---|---|---|---|---|---|---|---|
| Shadow/reference model | WRN28-2 | ResNet18 | VGG11 | MobileNet-v2 | MLP | CatBoost | LR | DistilBERT | RoBERTa | Flan-T5 | |
| Learn-original | 0.631 | 0.578 | 0.632 | 0.539 | 0.652 | 0.651 | 0.564 | 0.558 | 0.560 | 0.546 | 0.591 |
| Learn-top3 | 0.628 | 0.628 | 0.628 | 0.628 | 0.677 | 0.646 | 0.515 | 0.561 | 0.561 | 0.561 | 0.603 |
| Learn-sorted | 0.628 | 0.629 | 0.628 | 0.629 | 0.666 | 0.656 | 0.532 | 0.561 | 0.561 | 0.561 | 0.605 |
| Learn-label | 0.633 | 0.591 | 0.644 | 0.563 | 0.656 | 0.651 | 0.551 | 0.584 | 0.584 | 0.580 | 0.604 |
| Learn-merge | 0.656 | 0.581 | 0.651 | 0.509 | 0.684 | 0.517 | 0.595 | 0.584 | 0.584 | 0.580 | 0.594 |
| Model-loss | 0.664 | 0.657 | 0.641 | 0.632 | 0.725 | 0.608 | 0.611 | 0.773 | 0.607 | 0.589 | 0.651 |
| Model-calibration | 0.639 | 0.634 | 0.617 | 0.614 | 0.684 | 0.579 | 0.588 | 0.695 | 0.595 | 0.587 | 0.623 |
| Model-lira | 0.690 | 0.659 | 0.666 | 0.610 | 0.755 | 0.686 | 0.588 | 0.753 | 0.602 | 0.553 | 0.656 |
| Model-fpr | 0.647 | 0.668 | 0.638 | 0.664 | 0.697 | 0.645 | 0.643 | 0.679 | 0.557 | 0.567 | 0.641 |
| Model-robust | 0.635 | 0.639 | 0.633 | 0.621 | 0.711 | 0.632 | 0.625 | 0.766 | 0.624 | 0.591 | 0.648 |
| Query-augment | 0.573 | 0.555 | 0.575 | 0.552 | 0.612 | 0.612 | 0.612 | 0.570 | 0.569 | 0.565 | 0.580 |
| Query-transfer | 0.522 | 0.529 | 0.518 | 0.518 | 0.529 | 0.535 | 0.529 | 0.530 | 0.529 | 0.514 | 0.525 |
| Query-qrm | 0.532 | 0.532 | 0.533 | 0.532 | 0.523 | 0.625 | 0.622 | 0.524 | 0.524 | 0.528 | 0.548 |
| Query-ref | 0.735 | 0.740 | 0.722 | 0.708 | N/A | N/A | N/A | N/A | N/A | N/A | 0.726 |
3.5 Performance tradeoff of TDD algorithms
| Algorithm type | Average performance | Best performance | Running time(s) | Memory usage(MB) |
|---|---|---|---|---|
| Metric-based | 0.626 | 0.645 | 232 | 0 |
| Learning-based | 0.646 | 0.657 | 2,107 | 855 |
| Model-based | 0.706 | 0.728 | 4,089 | 13,680 |
| Query-based | 0.604 | 0.759 | 40,963 | 13,680 |
Most evaluations of TDD algorithms primarily focus on detection accuracy. However, other factors, such as computational efficiency, are equally important in real-world applications. For instance, model-based methods, which require building numerous reference models, may be too costly in terms of time and memory when applied to large AI models. Therefore, in TDDBench, we emphasize the computational complexity of running different TDD algorithms. Specifically, we document the maximum runtime and memory usage for each type of TDD algorithm. This provides a holistic evaluation beyond detection accuracy. We present an overall assessment of the four types of TDD algorithms in Table 7. Evidently, each type of TDD algorithm has its own advantages and disadvantages. While model-based methods offer the best average performance, they come with significantly higher running time and memory usage. Therefore, data owners performing TDD must strike a balance between practicality, resource utilization, and detection accuracy, depending on their specific scenario. For instance, in resource-constrained environments, metric-based methods are a suitable choice for TDD, as they require minimal computational resources and fewer assumptions compared to other methods.
4 Related Work
Training data detection (TDD) is commonly employed to assess privacy risks in machine learning models (Murakonda & Shokri, 2020). It has been applied across various domains, including image classification (Hui et al., 2021; Rezaei & Liu, 2021), text generation (Shejwalkar et al., 2021; Oh et al., 2022), graph neural networks (Wu et al., 2021; Olatunji et al., 2021), and recommendation systems (Zhang et al., 2021; Wang et al., 2022). TDD has a wide range of applications such as dataset copyright protection (Maini et al., 2021) and for verifying machine unlearning (Chen et al., 2021).
Shokri et al., 2017 introduce the first TDD algorithm, utilizing shadow models to help identifying differences in the model’s predictions for training data versus other data. Yeom et al., 2018 demonstrate that satisfactory results could be achieved by utilizing only the loss of the target model on the sample. Building on this foundation, subsequent studies employ the entropy (Song & Mittal, 2021) and maximum confidence (Song et al., 2019) of the target model’s predictions as additional detection criteria. Carlini et al., 2022a criticize methods based solely on the target model’s output, arguing that they overlook the inherent characteristics of the data, which can lead to biased estimates regarding whether a sample belongs to the training dataset. They propose training multiple reference models to better understand how the sample’s characteristics influence metrics like loss. Additionally, increasing the number of queries (Rahimian et al., 2020) to the target model is a viable improvement for TDD algorithms, with newly added query samples typically being neighbors of the data under detection, enriching the detection criterion. In short, there is a rapidly growing body of literature on TDD methods, and we provide a brief summarization in Section 2.3.
Existing benchmarking works. He et al., 2022 evaluate 9 TDD algorithms on image data, while Niu et al., 2023 expand the evaluation to 15 algorithms, focusing on how sample differences within datasets affect TDD performance. Duan et al., 2024 investigate five TDD algorithms on large language models (LLMs) and find that current TDD algorithms perform poorly in this context. In summary, existing TDD benchmarks have limited coverage of data modalities and algorithms, underscoring the need for a more comprehensive analysis of TDD algorithms. This paper, along with the developed TDDBench, aims to address this gap by providing in-depth insights into the development and performance tradeoff in state-of-the-art TDD algorithms.
5 Conclusion
In this article, we introduce TDDBench, a novel and comprehensive training data detection benchmark. Unlike existing benchmarks, TDDBench extends evaluations across multiple data modalities, including image, tabular, and text. It also implements large-scale target models and benchmarks 21 state-of-the-art TDD algorithms. Our comprehensive evaluation sheds critical light on the development of TDD algorithms and helps both researchers and practitioners reconsider the trade-offs involved in using TDD algorithms. For example, our evaluation shows that model-based TDD algorithms outperform others but at the cost of higher time and memory complexity. Additionally, all existing TDD algorithms experience performance degradation when the target model avoids overfitting. Based on our findings with TDDBench, we believe future work on TDD algorithms should focus on, but not be limited to: (1) designing TDD algorithms robust to target models less prone to overfitting, (2) creating TDD algorithms that require minimal knowledge of the target model architecture, (3) achieving a better balance between performance and practical considerations such as computational complexity, and (4) developing algorithms tailored to specific application contexts or data modalities, such as training data detection for large language models and recommendation systems.
References
- Abd-Alrazaq et al. (2023) Alaa Abd-Alrazaq, Rawan AlSaad, Dari Alhuwail, Arfan Ahmed, Padraig Mark Healy, Syed Latifi, Sarah Aziz, Rafat Damseh, Sadam Alabed Alrazak, Javaid Sheikh, et al. Large language models in medical education: opportunities, challenges, and future directions. JMIR Medical Education, 9(1):e48291, 2023.
- Amit et al. (2024) Guy Amit, Abigail Goldsteen, and Ariel Farkash. Sok: Reducing the vulnerability of fine-tuned language models to membership inference attacks. arXiv preprint arXiv:2403.08481, 2024.
- Arpit et al. (2017) Devansh Arpit, Stanisław Jastrzębski, Nicolas Ballas, David Krueger, Emmanuel Bengio, Maxinder S Kanwal, Tegan Maharaj, Asja Fischer, Aaron Courville, Yoshua Bengio, et al. A closer look at memorization in deep networks. In International conference on machine learning, pp. 233–242. PMLR, 2017.
- Asuncion et al. (2007) Arthur Asuncion, David Newman, et al. Uci machine learning repository, 2007.
- Barbieri et al. (2020) Francesco Barbieri, Jose Camacho-Collados, Luis Espinosa Anke, and Leonardo Neves. Tweeteval: Unified benchmark and comparative evaluation for tweet classification. In Findings of the Association for Computational Linguistics: EMNLP 2020, pp. 1644–1650, 2020.
- Bertran et al. (2024) Martin Bertran, Shuai Tang, Aaron Roth, Michael Kearns, Jamie H Morgenstern, and Steven Z Wu. Scalable membership inference attacks via quantile regression. Advances in Neural Information Processing Systems, 36, 2024.
- Biderman et al. (2023) Stella Biderman, Hailey Schoelkopf, Quentin Gregory Anthony, Herbie Bradley, Kyle O’Brien, Eric Hallahan, Mohammad Aflah Khan, Shivanshu Purohit, USVSN Sai Prashanth, Edward Raff, et al. Pythia: A suite for analyzing large language models across training and scaling. In International Conference on Machine Learning, pp. 2397–2430. PMLR, 2023.
- Carlini et al. (2019) Nicholas Carlini, Chang Liu, Úlfar Erlingsson, Jernej Kos, and Dawn Song. The secret sharer: Evaluating and testing unintended memorization in neural networks. In 28th USENIX security symposium (USENIX security 19), pp. 267–284, 2019.
- Carlini et al. (2021) Nicholas Carlini, Florian Tramer, Eric Wallace, Matthew Jagielski, Ariel Herbert-Voss, Katherine Lee, Adam Roberts, Tom Brown, Dawn Song, Ulfar Erlingsson, et al. Extracting training data from large language models. In 30th USENIX Security Symposium (USENIX Security 21), pp. 2633–2650, 2021.
- Carlini et al. (2022a) Nicholas Carlini, Steve Chien, Milad Nasr, Shuang Song, Andreas Terzis, and Florian Tramer. Membership inference attacks from first principles. In 2022 IEEE Symposium on Security and Privacy (SP), pp. 1897–1914. IEEE, 2022a.
- Carlini et al. (2022b) Nicholas Carlini, Matthew Jagielski, Chiyuan Zhang, Nicolas Papernot, Andreas Terzis, and Florian Tramer. The privacy onion effect: Memorization is relative. Advances in Neural Information Processing Systems, 35:13263–13276, 2022b.
- Carlini et al. (2023) Nicholas Carlini, Daphne Ippolito, Matthew Jagielski, Katherine Lee, Florian Tramer, and Chiyuan Zhang. Quantifying memorization across neural language models. In The Eleventh International Conference on Learning Representations, 2023.
- Chalkidis et al. (2023) Ilias Chalkidis, Nicolas Garneau, Cătălina Goan\textcommabelowtă, Daniel Katz, and Anders Søgaard. Lexfiles and legallama: Facilitating english multinational legal language model development. In Proceedings of the 61st Annual Meeting of the Association for Computational Linguistics (Volume 1: Long Papers), pp. 15513–15535, 2023.
- Chen et al. (2021) Min Chen, Zhikun Zhang, Tianhao Wang, Michael Backes, Mathias Humbert, and Yang Zhang. When machine unlearning jeopardizes privacy. In Proceedings of the 2021 ACM SIGSAC conference on computer and communications security, pp. 896–911, 2021.
- Choquette-Choo et al. (2021) Christopher A Choquette-Choo, Florian Tramer, Nicholas Carlini, and Nicolas Papernot. Label-only membership inference attacks. In International conference on machine learning, pp. 1964–1974. PMLR, 2021.
- Chung et al. (2024) Hyung Won Chung, Le Hou, Shayne Longpre, Barret Zoph, Yi Tay, William Fedus, Yunxuan Li, Xuezhi Wang, Mostafa Dehghani, Siddhartha Brahma, et al. Scaling instruction-finetuned language models. Journal of Machine Learning Research, 25(70):1–53, 2024.
- Cortez & Silva (2008) Paulo Cortez and Alice Maria Gonçalves Silva. Using data mining to predict secondary school student performance. Proceedings of 5th Annual Future Business Technology Conference, 2008.
- Dorogush et al. (2018) Anna Veronika Dorogush, Vasily Ershov, and Andrey Gulin. Catboost: gradient boosting with categorical features support. arXiv preprint arXiv:1810.11363, 2018.
- Duan et al. (2024) Michael Duan, Anshuman Suri, Niloofar Mireshghallah, Sewon Min, Weijia Shi, Luke Zettlemoyer, Yulia Tsvetkov, Yejin Choi, David Evans, and Hannaneh Hajishirzi. Do membership inference attacks work on large language models? arXiv preprint arXiv:2402.07841, 2024.
- He et al. (2016) Kaiming He, Xiangyu Zhang, Shaoqing Ren, and Jian Sun. Deep residual learning for image recognition. In Proceedings of the IEEE conference on computer vision and pattern recognition, pp. 770–778, 2016.
- He et al. (2022) Xinlei He, Zheng Li, Weilin Xu, Cory Cornelius, and Yang Zhang. Membership-doctor: Comprehensive assessment of membership inference against machine learning models. arXiv preprint arXiv:2208.10445, 2022.
- Hosmer Jr et al. (2013) David W Hosmer Jr, Stanley Lemeshow, and Rodney X Sturdivant. Applied logistic regression. John Wiley & Sons, 2013.
- Hui et al. (2021) Bo Hui, Yuchen Yang, Haolin Yuan, Philippe Burlina, Neil Zhenqiang Gong, and Yinzhi Cao. Practical blind membership inference attack via differential comparisons. arXiv preprint arXiv:2101.01341, 2021.
- Jayaraman et al. (2021) Bargav Jayaraman, Lingxiao Wang, Katherine Knipmeyer, Quanquan Gu, and David Evans. Revisiting membership inference under realistic assumptions. Proceedings on Privacy Enhancing Technologies, 2021.
- Krizhevsky et al. (2009) Alex Krizhevsky, Geoffrey Hinton, et al. Learning multiple layers of features from tiny images. 2009.
- Kurmanji et al. (2024) Meghdad Kurmanji, Peter Triantafillou, Jamie Hayes, and Eleni Triantafillou. Towards unbounded machine unlearning. Advances in neural information processing systems, 36, 2024.
- Leino & Fredrikson (2020) Klas Leino and Matt Fredrikson. Stolen memories: Leveraging model memorization for calibrated White-Box membership inference. In 29th USENIX security symposium (USENIX Security 20), pp. 1605–1622, 2020.
- Li & Zhang (2021) Zheng Li and Yang Zhang. Membership leakage in label-only exposures. In Proceedings of the 2021 ACM SIGSAC Conference on Computer and Communications Security, pp. 880–895, 2021.
- Liu et al. (2019) Yinhan Liu, Myle Ott, Naman Goyal, Jingfei Du, Mandar Joshi, Danqi Chen, Omer Levy, Mike Lewis, Luke Zettlemoyer, and Veselin Stoyanov. Roberta: A robustly optimized BERT pretraining approach. CoRR, abs/1907.11692, 2019. URL http://arxiv.org/abs/1907.11692.
- Liu et al. (2015) Ziwei Liu, Ping Luo, Xiaogang Wang, and Xiaoou Tang. Deep learning face attributes in the wild. In Proceedings of International Conference on Computer Vision (ICCV), December 2015.
- Long et al. (2018) Yunhui Long, Vincent Bindschaedler, Lei Wang, Diyue Bu, Xiaofeng Wang, Haixu Tang, Carl A Gunter, and Kai Chen. Understanding membership inferences on well-generalized learning models. arXiv preprint arXiv:1802.04889, 2018.
- Maini et al. (2021) Pratyush Maini, Mohammad Yaghini, and Nicolas Papernot. Dataset inference: Ownership resolution in machine learning. arXiv preprint arXiv:2104.10706, 2021.
- Mattern et al. (2023) Justus Mattern, Fatemehsadat Mireshghallah, Zhijing Jin, Bernhard Schoelkopf, Mrinmaya Sachan, and Taylor Berg-Kirkpatrick. Membership inference attacks against language models via neighbourhood comparison. In Findings of the Association for Computational Linguistics: ACL 2023, pp. 11330–11343, 2023.
- Mozes et al. (2023) Maximilian Mozes, Xuanli He, Bennett Kleinberg, and Lewis D Griffin. Use of llms for illicit purposes: Threats, prevention measures, and vulnerabilities. arXiv preprint arXiv:2308.12833, 2023.
- Murakonda & Shokri (2020) Sasi Kumar Murakonda and Reza Shokri. Ml privacy meter: Aiding regulatory compliance by quantifying the privacy risks of machine learning. arXiv preprint arXiv:2007.09339, 2020.
- Nasr et al. (2018) Milad Nasr, Reza Shokri, and Amir Houmansadr. Machine learning with membership privacy using adversarial regularization. In Proceedings of the 2018 ACM SIGSAC conference on computer and communications security, pp. 634–646, 2018.
- Nasr et al. (2019) Milad Nasr, Reza Shokri, and Amir Houmansadr. Comprehensive privacy analysis of deep learning: Passive and active white-box inference attacks against centralized and federated learning. In 2019 IEEE symposium on security and privacy (SP), pp. 739–753. IEEE, 2019.
- Niu et al. (2023) Jun Niu, Xiaoyan Zhu, Moxuan Zeng, Ge Zhang, Qingyang Zhao, Chunhui Huang, Yangming Zhang, Suyu An, Yangzhong Wang, Xinghui Yue, et al. Sok: Comparing different membership inference attacks with a comprehensive benchmark. arXiv preprint arXiv:2307.06123, 2023.
- Oh et al. (2022) Myung Gyo Oh, Leo Hyun Park, Jaeuk Kim, Jaewoo Park, and Taekyoung Kwon. On membership inference attacks to generative language models across language domains. In International Conference on Information Security Applications, pp. 143–155. Springer, 2022.
- Olatunji et al. (2021) Iyiola E Olatunji, Wolfgang Nejdl, and Megha Khosla. Membership inference attack on graph neural networks. In 2021 Third IEEE International Conference on Trust, Privacy and Security in Intelligent Systems and Applications (TPS-ISA), pp. 11–20. IEEE, 2021.
- Pang & Lee (2005) Bo Pang and Lillian Lee. Seeing stars: Exploiting class relationships for sentiment categorization with respect to rating scales. In Proceedings of the 43rd Annual Meeting of the Association for Computational Linguistics (ACL’05), pp. 115–124, 2005.
- Rahimian et al. (2020) Shadi Rahimian, Tribhuvanesh Orekondy, and Mario Fritz. Sampling attacks: Amplification of membership inference attacks by repeated queries. arXiv preprint arXiv:2009.00395, 2020.
- Rezaei & Liu (2021) Shahbaz Rezaei and Xin Liu. On the difficulty of membership inference attacks. In Proceedings of the IEEE/CVF Conference on Computer Vision and Pattern Recognition, pp. 7892–7900, 2021.
- Rumelhart et al. (1986) David E Rumelhart, Geoffrey E Hinton, and Ronald J Williams. Learning internal representations by error propagation, parallel distributed processing, explorations in the microstructure of cognition, ed. de rumelhart and j. mcclelland. vol. 1. 1986. Biometrika, 71(599-607):6, 1986.
- Sablayrolles et al. (2019) Alexandre Sablayrolles, Matthijs Douze, Cordelia Schmid, Yann Ollivier, and Hervé Jégou. White-box vs black-box: Bayes optimal strategies for membership inference. In International Conference on Machine Learning, pp. 5558–5567. PMLR, 2019.
- Salem et al. (2019) Ahmed Salem, Yang Zhang, Mathias Humbert, Pascal Berrang, Mario Fritz, and Michael Backes. Ml-leaks: Model and data independent membership inference attacks and defenses on machine learning models. In Proceedings 2019 Network and Distributed System Security Symposium. Internet Society, 2019.
- Sandler et al. (2018) Mark Sandler, Andrew Howard, Menglong Zhu, Andrey Zhmoginov, and Liang-Chieh Chen. Mobilenetv2: Inverted residuals and linear bottlenecks. In Proceedings of the IEEE conference on computer vision and pattern recognition, pp. 4510–4520, 2018.
- Sanh et al. (2019) Victor Sanh, Lysandre Debut, Julien Chaumond, and Thomas Wolf. Distilbert, a distilled version of bert: smaller, faster, cheaper and lighter. ArXiv, abs/1910.01108, 2019.
- Shejwalkar et al. (2021) Virat Shejwalkar, Huseyin A Inan, Amir Houmansadr, and Robert Sim. Membership inference attacks against nlp classification models. In NeurIPS 2021 Workshop Privacy in Machine Learning, 2021.
- Shi et al. (2024) Weijia Shi, Anirudh Ajith, Mengzhou Xia, Yangsibo Huang, Daogao Liu, Terra Blevins, Danqi Chen, and Luke Zettlemoyer. Detecting pretraining data from large language models. In The Twelfth International Conference on Learning Representations, 2024.
- Shokri et al. (2017) Reza Shokri, Marco Stronati, Congzheng Song, and Vitaly Shmatikov. Membership inference attacks against machine learning models. In 2017 IEEE symposium on security and privacy (SP), pp. 3–18. IEEE, 2017.
- Simonyan & Zisserman (2014) Karen Simonyan and Andrew Zisserman. Very deep convolutional networks for large-scale image recognition. arXiv preprint arXiv:1409.1556, 2014.
- Song & Mittal (2021) Liwei Song and Prateek Mittal. Systematic evaluation of privacy risks of machine learning models. In 30th USENIX Security Symposium (USENIX Security 21), pp. 2615–2632, 2021.
- Song et al. (2019) Liwei Song, Reza Shokri, and Prateek Mittal. Privacy risks of securing machine learning models against adversarial examples. In Proceedings of the 2019 ACM SIGSAC conference on computer and communications security, pp. 241–257, 2019.
- Truex et al. (2019) Stacey Truex, Ling Liu, Mehmet Emre Gursoy, Lei Yu, and Wenqi Wei. Demystifying membership inference attacks in machine learning as a service. IEEE transactions on services computing, 14(6):2073–2089, 2019.
- Wang et al. (2018) Alex Wang, Amanpreet Singh, Julian Michael, Felix Hill, Omer Levy, and Samuel R Bowman. Glue: A multi-task benchmark and analysis platform for natural language understanding. EMNLP 2018, pp. 353, 2018.
- Wang et al. (2022) Zihan Wang, Na Huang, Fei Sun, Pengjie Ren, Zhumin Chen, Hengliang Luo, Maarten de Rijke, and Zhaochun Ren. Debiasing learning for membership inference attacks against recommender systems. In Proceedings of the 28th ACM SIGKDD Conference on Knowledge Discovery and Data Mining, pp. 1959–1968, 2022.
- Watson et al. (2021) Lauren Watson, Chuan Guo, Graham Cormode, and Alexandre Sablayrolles. On the importance of difficulty calibration in membership inference attacks. In International Conference on Learning Representations, 2021.
- Wen et al. (2023) Yuxin Wen, Arpit Bansal, Hamid Kazemi, Eitan Borgnia, Micah Goldblum, Jonas Geiping, and Tom Goldstein. Canary in a coalmine: Better membership inference with ensembled adversarial queries. In The Eleventh International Conference on Learning Representations, 2023.
- Wu et al. (2021) Bang Wu, Xiangwen Yang, Shirui Pan, and Xingliang Yuan. Adapting membership inference attacks to gnn for graph classification: Approaches and implications. In 2021 IEEE International Conference on Data Mining (ICDM), pp. 1421–1426. IEEE, 2021.
- Yang et al. (2023) Jiancheng Yang, Rui Shi, Donglai Wei, Zequan Liu, Lin Zhao, Bilian Ke, Hanspeter Pfister, and Bingbing Ni. Medmnist v2-a large-scale lightweight benchmark for 2d and 3d biomedical image classification. Scientific Data, 10(1):41, 2023.
- Ye et al. (2022) Jiayuan Ye, Aadyaa Maddi, Sasi Kumar Murakonda, Vincent Bindschaedler, and Reza Shokri. Enhanced membership inference attacks against machine learning models. In Proceedings of the 2022 ACM SIGSAC Conference on Computer and Communications Security, pp. 3093–3106, 2022.
- Yeom et al. (2018) Samuel Yeom, Irene Giacomelli, Matt Fredrikson, and Somesh Jha. Privacy risk in machine learning: Analyzing the connection to overfitting. In 2018 IEEE 31st computer security foundations symposium (CSF), pp. 268–282. IEEE, 2018.
- Zagoruyko (2016) Sergey Zagoruyko. Wide residual networks. arXiv preprint arXiv:1605.07146, 2016.
- Zarifzadeh et al. (2024) Sajjad Zarifzadeh, Philippe Liu, and Reza Shokri. Low-cost high-power membership inference attacks. In Forty-first International Conference on Machine Learning, 2024.
- Zhang et al. (2024) Jingyang Zhang, Jingwei Sun, Eric Yeats, Yang Ouyang, Martin Kuo, Jianyi Zhang, Hao Yang, and Hai Li. Min-k%++: Improved baseline for detecting pre-training data from large language models. arXiv preprint arXiv:2404.02936, 2024.
- Zhang et al. (2021) Minxing Zhang, Zhaochun Ren, Zihan Wang, Pengjie Ren, Zhunmin Chen, Pengfei Hu, and Yang Zhang. Membership inference attacks against recommender systems. In Proceedings of the 2021 ACM SIGSAC Conference on Computer and Communications Security, pp. 864–879, 2021.
Appendix A Appendix
A.1 Details of the algorithms included in TDDBench
A.1.1 Metric-based dectection
Several studies (Carlini et al., 2019; 2021) indicate that models retain a certain degree of memory regarding the training data during the learning process. This memorization can result in significant differences between the model’s predictions on training and test data, which can be leveraged as a decision basis for TDD algorithms. Specifically, Metric-loss (Yeom et al., 2018) utilizes the loss of the target model’s prediction on data points as the detection criterion. Since the target model is instructed to minimize training loss during optimization, a training data point typically exhibits a lower loss than a test data point. Similarly, Metric-conf (Metric-confidence) (Song et al., 2019) identifies that the maximum confidence of the target model’s predictions can also serve as the detection criterion. Metric-corr (Metric-correctness) (Leino & Fredrikson, 2020) further demonstrates that even without access to the model’s prediction confidence or logits for a specific data point, comparing the predicted label with the true label can provide an effective detection basis. Metric-corr achieves training data detection (TDD) with fewer assumptions than both Metric-loss and Metric-conf.
Beyond individual prediction values, the distribution of prediction results can also serve as a valuable detection criterion. Metric-ent (Metric-entropy) (Shokri et al., 2017; Song & Mittal, 2021) posits that the target model exhibits greater confidence in its predictions for training data, as evidenced by a more concentrated distribution of prediction confidences across different classes. Building on this, entropy is utilized as the detection criterion for Metric-ent. Metric-ment (Metric-modified entropy) (Song & Mittal, 2021) further incorporates the true label of the data point into Metric-ent to prevent the detection algorithm from predicting data points where the target model has misclassified as its training data.
A.1.2 Learning-based dectection
The metric-based algorithms design various metrics to extract detection basis from the prediction results of the target model. However, manually designed metrics may not accurately capture the differences between the predicted results of training and test data. A more robust approach is to use neural networks to automatically extract training data detection (TDD)-friendly information from the target model’s predictions, known as learning-based detection algorithms. Learn-original (Shokri et al., 2017) is the first algorithm to propose building an auxiliary classifier for TDD. It inputs the prediction vector of the target model into the auxiliary classifier, aiming to directly produce a detection result. To train the auxiliary classifier, Learn-original employs a shadow model similar to the target model, utilizing shadow training techniques. Since the shadow model’s training process is conducted by the detectors, they can obtain both the training and test data of the shadow model. The predictions made by the shadow model on its training and test data are utilized to facilitate the training of the auxiliary classifier.
Different learning-based detection algorithms primarily differ in the input features of their auxiliary classifiers. For instance, Learn-top3 and Learn-sorted (Salem et al., 2019) utilize the top-3 prediction confidences and ranked prediction vectors as input features, respectively. Building on Learn-original, Learn-label (Nasr et al., 2018) supplements the input features with the true label of the data point. Learn-merge (Amit et al., 2024) further incorporates the entropy, loss, and predicted label into the input features. It is noteworthy that while Learn-original builds multiple shadow models, most learning-based methods utilize only one. Moreover, previous work demonstrates that training data detection (TDD) with a single shadow model achieves performance comparable to that of multiple shadow models. Therefore, to ensure a fair comparison among learning-based methods, we standardize the number of shadow models to one for all learning-based approaches.
A.1.3 Model-based dectection
The two lines of TDD methods discussed above rely solely on the prediction results of the target model, overlooking the inherent characteristics of the data points, which may introduce bias into the detection criteria. For example, abnormal training data may exhibit higher losses than normal test data due to inherent data characteristics (Carlini et al., 2022b; a), making it challenging for Metric-loss to detect these data. Therefore, the design of the detection criterion must consider data characteristics to eliminate bias.
Model-based algorithms address this issue by utilizing a set of reference models that share a similar architecture to the target model. These reference models are used to obtain predictions for data point across different models, which helps to de-bias the detection criteria of the target model. To elaborate, Model-loss (Sablayrolles et al., 2019) calculates the mean loss of data point across all reference models and then subtracts the loss from the target model to eliminate bias induced by data characteristics. In contrast, Model-calibration (Watson et al., 2021) uses only reference models that exclude data point from its training data, allowing it to implement model-based TDD for any new data point. Moreover, Model-lira (Carlini et al., 2022a) treats the detection process as a likelihood ratio test, determining whether the rescaled logit value of data point in the target model originates from models trained on . Building on Model-lira, Model-fpr (Ye et al., 2022) designs a detection method that meets the specified arbitrary false positive ratio. Model-robust (Zarifzadeh et al., 2024) introduces a robust TDD method that utilizes only one reference model.
A.1.4 Query-based dectection
The motivation for query-based algorithms stems from two main reasons. Firstly, some of them aim to implement label-only training data detection (TDD), where the target model provides only predicted labels. In such cases, the detector can depend solely on prediction correctness as the detection criterion, which limits the ability to acquire more intricate and effective detection information. To address this limitation, Query-augment(Query-augmentmentation) (Choquette-Choo et al., 2021) proposes obtaining multiple neighbors of a data point through data augmentation. The correctness of the target model on these augmented data points is then combined to form input features for the auxiliary classifier in the learning-based algorithm. Query-transfer (Li & Zhang, 2021), on the other hand, suggests training a surrogate model based on the prediction labels of the target model. The surrogate model is expected to closely resemble the target model and subsequently replace it to provide more detailed prediction results for arbitrary data points, enabling the generation of a more intricate detection criterion. Moreover, Query-adv(Query-adversarial) (Li & Zhang, 2021; Choquette-Choo et al., 2021) considers the distance of a data point from the target model’s decision boundary as a detection criterion with the aid of adversarial tools. This is based on the assumption that training data will generally be farther from the decision boundary than test data.
Another type of query-based algorithm does not assume that the target model only returns prediction labels. In these algorithms, additional queries are introduced to provide more information to aid in detection. For example, Query-neighbor (Jayaraman et al., 2021; Mattern et al., 2023) adds random noise to the data point and uses the difference between the loss of the target model on and its average loss on the neighboring points of as the detection criterion. Query-qrm (Bertran et al., 2024) collects a large amount of data that is explicitly not from the target model’s training data and obtains the scaled logits of the target model on these samples to train a quantile regression model. This quantile regression model can determine the likelihood that is not part of the target model’s training data. Additionally, Query-ref(Query-reference) (Wen et al., 2023) makes extra queries for adversarial samples of generated based on reference models. These samples help to better reflect the differences in the predicted results of when is training data versus when it is not.
Remark. Query-ref is categorized as a query-based method rather than a reference-based method because of its innovative query sample generation strategy. It is specifically designed to generate suitable query data for image datasets, rather than for tabular or text data.
A.2 Training data detection algorithms in large language models
In this section, we provide a brief introduction to the TDD algorithms for large language models; please refer to the related works for specific details.
Loss (Yeom et al., 2018) refers to the Metric-loss mentioned in the article. Instead of using cross-entropy as in classification models, the log likelihood of each text under the target model serves as the basis for detection in pretraining language models.
Zlib (Carlini et al., 2021) calibrates the sample’s loss under the target model using the sample’s zlib compression size.
MIN-K% (Shi et al., 2024) utilizes the k% of tokens with the lowest likelihoods as the detection basis, rather than average loss.
MIN-K++ (Zhang et al., 2024) is based on the observation that training samples tend to be local maxima of the modeled distribution along each input dimension due to maximum likelihood training, effectively translating the TDD problem into the identification of local maxima.
Reference (Carlini et al., 2021) borrows from model-based approaches, utilizing the reference model to help correct the detection basis derived from the prediction results of the target model. Reference models for TDD in large language models are typically open-source and have architectures similar to the target model, thus avoiding the significant computational cost of training the reference model from scratch.
Neighbor, or Query-neighbor (Mattern et al., 2023), supplements the detection information provided by the sample point with the loss of the target model on the neighboring samples of .
A.3 Performances and training details of target models
| Modality | Dataset | # Classes | Train accuracy | Test accuracy | Train-test accuracy gap |
|---|---|---|---|---|---|
| Image | CIFAR-10 | 10 | 0.981 | 0.877 | 0.104 |
| CIFAR-100 | 100 | 1.000 | 0.583 | 0.417 | |
| BloodMNIST | 8 | 0.989 | 0.955 | 0.034 | |
| CelebA | 2 | 0.988 | 0.976 | 0.013 | |
| Tabular | Purchase | 100 | 1.000 | 0.897 | 0.103 |
| Texas | 100 | 0.766 | 0.546 | 0.220 | |
| Adult | 2 | 0.831 | 0.830 | 0.001 | |
| Student | 3 | 0.855 | 0.735 | 0.121 | |
| Text | Rotten tomatoes | 2 | 0.947 | 0.833 | 0.113 |
| Tweet Eval | 2 | 0.840 | 0.739 | 0.101 | |
| GLUE-CoLA | 2 | 0.864 | 0.763 | 0.100 | |
| ECtHR Articles | 13 | 0.476 | 0.438 | 0.038 |
| Dataset | Target model | Train accuracy | Test accuracy | Train-test accuracy gap |
|---|---|---|---|---|
| CIFAR-10 | WRN28-2 | 0.981 | 0.877 | 0.104 |
| ResNet18 | 0.992 | 0.880 | 0.112 | |
| VGG11 | 1.000 | 0.853 | 0.147 | |
| MobileNet-v2 | 0.934 | 0.845 | 0.089 | |
| Purchase | Multilayer Perceptron | 1.000 | 0.897 | 0.103 |
| CatBoost | 1.000 | 0.725 | 0.276 | |
| Logistic Regression | 0.999 | 0.755 | 0.244 | |
| Rotten tomatoes | DistilBERT | 0.947 | 0.833 | 0.113 |
| RoBERTa | 0.964 | 0.881 | 0.083 | |
| Flan-T5 | 0.911 | 0.886 | 0.025 |
| Modality | Target model | Learning rate | Weight decay | Maximum epochs | Optimizer | Learning rate schedule | Batch size |
|---|---|---|---|---|---|---|---|
| Image | WRN28-2 | 0.1 | 0.0005 | 200 | SGD | Cosine Annealing | 256 |
| ResNet18 | 0.1 | 0.0005 | 200 | SGD | Cosine Annealing | 256 | |
| VGG11 | 0.1 | 0.0005 | 200 | SGD | Cosine Annealing | 256 | |
| MobileNet-v2 | 0.1 | 0.0005 | 200 | SGD | Cosine Annealing | 256 | |
| Tabular | MLP | 0.001 | 0.0001 | 200 | Adam | N/A | 256 |
| CatBoost | 0.05 | N/A | 10,000 | N/A | N/A | N/A | |
| LR | N/A | N/A | 100 | N/A | N/A | N/A | |
| Text | DistilBERT | 0.00002 | 0.01 | 10 | AdamW | N/A | 32 |
| RoBERTa | 0.00002 | 0.01 | 10 | AdamW | N/A | 32 | |
| Flan-T5 | 0.00002 | 0.01 | 10 | AdamW | N/A | 32 |
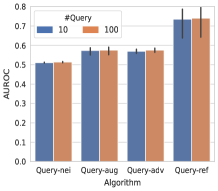
A.4 Detection performance with more queries and reference models.
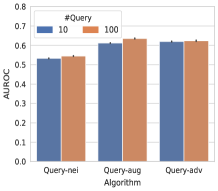
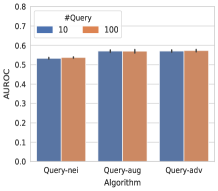
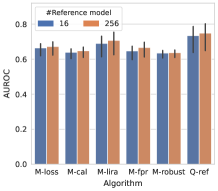
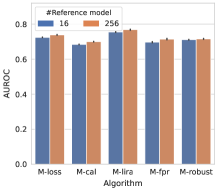
In this part, we analyze the potential of the two latest types of TDD algorithms: reference-based and query-based. Specifically, we expand the number of reference models that the reference-based algorithm can create and the number of queries that the query-based algorithm can handle. Due to limitations in computational resources, we opt to decrease rather than increase the number of reference models in the text modality. We anticipate that similar conclusions can be drawn with a larger number of reference models. The results in Figure 4 demonstrate that increasing the number of queries or reference models can improve the TDD algorithm’s performance. Adjusting the number of reference models has a more significant impact on the algorithm’s performance compared to increasing the number of queries. Nevertheless, enhancing computational resources does not close the gap in algorithm design. For instance, in tabular data, even with 256 reference models, other algorithms fail to outperform LiRA with 16 reference models.
A.5 Complete version of the experimental results
| Modality | Image | Tabular | Text | Avg. | |||||||||
| Dataset | CIFAR-10 | CIFAR-100 | BloodMNIST | CelebA | Purchase | Texas | Adult | Student | Rotten | Tweet | CoLA | ECtHR | |
| Metric-loss | 0.635 | 0.858 | 0.527 | 0.509 | 0.619 | 0.629 | 0.500 | 0.566 | 0.582 | 0.566 | 0.571 | 0.521 | 0.590 |
| ( 0.053) | ( 0.004) | ( 0.018) | ( 0.012) | ( 0.003) | ( 0.013) | ( 0.003) | ( 0.032) | ( 0.007) | ( 0.005) | ( 0.003) | ( 0.007) | ( 0.094) | |
| Metric-conf | 0.635 | 0.858 | 0.527 | 0.509 | 0.619 | 0.629 | 0.500 | 0.566 | 0.582 | 0.566 | 0.571 | 0.521 | 0.590 |
| ( 0.053) | ( 0.004) | ( 0.018) | ( 0.012) | ( 0.003) | ( 0.013) | ( 0.003) | ( 0.032) | ( 0.007) | ( 0.005) | ( 0.003) | ( 0.007) | ( 0.094) | |
| Metric-corr | 0.552 | 0.708 | 0.517 | 0.507 | 0.551 | 0.610 | 0.501 | 0.560 | 0.557 | 0.550 | 0.550 | 0.519 | 0.557 |
| ( 0.009) | ( 0.002) | ( 0.006) | ( 0.002) | ( 0.001) | ( 0.012) | ( 0.002) | ( 0.022) | ( 0.006) | ( 0.005) | ( 0.007) | ( 0.005) | ( 0.055) | |
| Metric-ent | 0.628 | 0.848 | 0.525 | 0.508 | 0.616 | 0.563 | 0.498 | 0.520 | 0.561 | 0.528 | 0.519 | 0.507 | 0.568 |
| ( 0.058) | ( 0.004) | ( 0.018) | ( 0.010) | ( 0.003) | ( 0.010) | ( 0.003) | ( 0.018) | ( 0.007) | ( 0.005) | ( 0.003) | ( 0.016) | ( 0.096) | |
| Metric-ment | 0.635 | 0.858 | 0.527 | 0.509 | 0.620 | 0.630 | 0.500 | 0.566 | 0.582 | 0.566 | 0.571 | 0.522 | 0.591 |
| ( 0.053) | ( 0.004) | ( 0.018) | ( 0.012) | ( 0.003) | ( 0.013) | ( 0.003) | ( 0.031) | ( 0.007) | ( 0.005) | ( 0.003) | ( 0.007) | ( 0.094) | |
| Learn-original | 0.631 | 0.870 | 0.508 | 0.503 | 0.652 | 0.597 | 0.502 | 0.531 | 0.558 | 0.529 | 0.568 | 0.506 | 0.580 |
| ( 0.064) | ( 0.003) | ( 0.010) | ( 0.007) | ( 0.002) | ( 0.011) | ( 0.005) | ( 0.024) | ( 0.009) | ( 0.003) | ( 0.009) | ( 0.007) | ( 0.103) | |
| Learn-top3 | 0.628 | 0.851 | 0.526 | 0.503 | 0.677 | 0.573 | 0.500 | 0.520 | 0.561 | 0.528 | 0.531 | 0.502 | 0.575 |
| ( 0.057) | ( 0.004) | ( 0.016) | ( 0.002) | ( 0.003) | ( 0.012) | ( 0.004) | ( 0.018) | ( 0.007) | ( 0.005) | ( 0.020) | ( 0.015) | ( 0.100) | |
| Learn-sorted | 0.628 | 0.850 | 0.529 | 0.508 | 0.666 | 0.573 | 0.501 | 0.520 | 0.561 | 0.528 | 0.510 | 0.501 | 0.573 |
| ( 0.057) | ( 0.004) | ( 0.016) | ( 0.010) | ( 0.028) | ( 0.011) | ( 0.004) | ( 0.018) | ( 0.007) | ( 0.005) | ( 0.022) | ( 0.016) | ( 0.100) | |
| Learn-label | 0.633 | 0.882 | 0.515 | 0.507 | 0.656 | 0.669 | 0.503 | 0.590 | 0.584 | 0.570 | 0.622 | 0.517 | 0.604 |
| ( 0.056) | ( 0.005) | ( 0.011) | ( 0.007) | ( 0.005) | ( 0.016) | ( 0.003) | ( 0.042) | ( 0.009) | ( 0.006) | ( 0.010) | ( 0.010) | ( 0.104) | |
| Learn-merge | 0.656 | 0.893 | 0.523 | 0.507 | 0.684 | 0.686 | 0.502 | 0.595 | 0.584 | 0.569 | 0.620 | 0.530 | 0.612 |
| ( 0.065) | ( 0.004) | ( 0.017) | ( 0.001) | ( 0.003) | ( 0.017) | ( 0.002) | ( 0.040) | ( 0.009) | ( 0.005) | ( 0.010) | ( 0.004) | ( 0.108) | |
| Model-loss | 0.664 | 0.852 | 0.560 | 0.522 | 0.725 | 0.767 | 0.509 | 0.670 | 0.773 | 0.756 | 0.752 | 0.655 | 0.684 |
| ( 0.050) | ( 0.004) | ( 0.017) | ( 0.004) | ( 0.002) | ( 0.011) | ( 0.006) | ( 0.068) | ( 0.020) | ( 0.010) | ( 0.017) | ( 0.012) | ( 0.107) | |
| Model-calibration | 0.639 | 0.763 | 0.553 | 0.520 | 0.684 | 0.718 | 0.508 | 0.648 | 0.695 | 0.714 | 0.699 | 0.638 | 0.648 |
| ( 0.040) | ( 0.005) | ( 0.016) | ( 0.004) | ( 0.002) | ( 0.011) | ( 0.006) | ( 0.063) | ( 0.012) | ( 0.006) | ( 0.014) | ( 0.011) | ( 0.082) | |
| Model-lira | 0.690 | 0.937 | 0.536 | 0.512 | 0.755 | 0.753 | 0.503 | 0.634 | 0.753 | 0.728 | 0.737 | 0.604 | 0.679 |
| ( 0.085) | ( 0.002) | ( 0.009) | ( 0.002) | ( 0.003) | ( 0.007) | ( 0.002) | ( 0.063) | ( 0.024) | ( 0.007) | ( 0.014) | ( 0.014) | ( 0.126) | |
| Model-fpr | 0.647 | 0.852 | 0.552 | 0.516 | 0.697 | 0.723 | 0.507 | 0.641 | 0.679 | 0.722 | 0.708 | 0.635 | 0.657 |
| ( 0.056) | ( 0.002) | ( 0.020) | ( 0.007) | ( 0.004) | ( 0.015) | ( 0.005) | ( 0.073) | ( 0.041) | ( 0.008) | ( 0.029) | ( 0.011) | ( 0.099) | |
| Model-robust | 0.635 | 0.889 | 0.552 | 0.520 | 0.711 | 0.762 | 0.509 | 0.669 | 0.766 | 0.745 | 0.746 | 0.621 | 0.677 |
| ( 0.030) | ( 0.004) | ( 0.016) | ( 0.003) | ( 0.002) | ( 0.017) | ( 0.006) | ( 0.061) | ( 0.022) | ( 0.008) | ( 0.014) | ( 0.013) | ( 0.112) | |
| Query-augment | 0.573 | 0.761 | 0.517 | 0.502 | 0.612 | 0.612 | 0.500 | 0.560 | 0.570 | 0.551 | 0.561 | 0.518 | 0.570 |
| ( 0.025) | ( 0.010) | ( 0.008) | ( 0.002) | ( 0.001) | ( 0.011) | ( 0.002) | ( 0.022) | ( 0.007) | ( 0.006) | ( 0.015) | ( 0.006) | ( 0.070) | |
| Query-transfer | 0.522 | 0.622 | 0.503 | 0.502 | 0.529 | 0.581 | 0.499 | 0.522 | 0.530 | 0.530 | 0.526 | 0.510 | 0.531 |
| ( 0.008) | ( 0.028) | ( 0.010) | ( 0.003) | ( 0.004) | ( 0.011) | ( 0.003) | ( 0.012) | ( 0.011) | ( 0.008) | ( 0.005) | ( 0.006) | ( 0.036) | |
| Query-adv | 0.615 | 0.838 | 0.508 | 0.514 | 0.620 | 0.579 | 0.500 | 0.563 | 0.571 | 0.551 | 0.568 | 0.519 | 0.579 |
| ( 0.038) | ( 0.015) | ( 0.008) | ( 0.007) | ( 0.003) | ( 0.008) | ( 0.003) | ( 0.024) | ( 0.007) | ( 0.006) | ( 0.014) | ( 0.005) | ( 0.089) | |
| Query-neighbor | 0.511 | 0.553 | 0.497 | 0.501 | 0.533 | 0.612 | 0.500 | 0.535 | 0.533 | 0.556 | 0.550 | 0.522 | 0.534 |
| ( 0.003) | ( 0.006) | ( 0.004) | ( 0.004) | ( 0.001) | ( 0.007) | ( 0.005) | ( 0.015) | ( 0.004) | ( 0.005) | ( 0.010) | ( 0.014) | ( 0.032) | |
| Query-qrm | 0.532 | 0.574 | 0.510 | 0.505 | 0.523 | 0.530 | 0.500 | 0.526 | 0.524 | 0.521 | 0.511 | 0.512 | 0.522 |
| ( 0.072) | ( 0.163) | ( 0.017) | ( 0.012) | ( 0.057) | ( 0.080) | ( 0.003) | ( 0.048) | ( 0.038) | ( 0.028) | ( 0.031) | ( 0.009) | ( 0.060) | |
| Query-ref | 0.735 | 0.941 | 0.566 | 0.526 | N/A | N/A | N/A | N/A | N/A | N/A | N/A | N/A | 0.692 |
| ( 0.108) | ( 0.008) | ( 0.022) | ( 0.017) | N/A | N/A | N/A | N/A | N/A | N/A | N/A | N/A | ( 0.176) | |
| Dataset | CIFAR10(Image) | Purchase(Tabular) | Rotten-tomatoes(Text) | Avg. | |||||||
|---|---|---|---|---|---|---|---|---|---|---|---|
| Target model | WRN28-2 | ResNet18 | VGG11 | MobileNet-v2 | MLP | CatBoost | LR | DistilBERT | RoBERTa | Flan-T5 | |
| Metric-loss | 0.635 | 0.659 | 0.684 | 0.592 | 0.619 | 0.948 | 0.640 | 0.582 | 0.571 | 0.517 | 0.645 |
| ( 0.053) | ( 0.042) | ( 0.004) | ( 0.057) | ( 0.003) | ( 0.009) | ( 0.003) | ( 0.007) | ( 0.019) | ( 0.004) | ( 0.115) | |
| Metric-conf | 0.635 | 0.659 | 0.684 | 0.592 | 0.619 | 0.948 | 0.640 | 0.582 | 0.571 | 0.517 | 0.645 |
| ( 0.053) | ( 0.042) | ( 0.004) | ( 0.057) | ( 0.003) | ( 0.009) | ( 0.003) | ( 0.007) | ( 0.019) | ( 0.004) | ( 0.115) | |
| Metric-corr | 0.552 | 0.557 | 0.574 | 0.548 | 0.551 | 0.636 | 0.622 | 0.557 | 0.542 | 0.513 | 0.565 |
| ( 0.009) | ( 0.006) | ( 0.003) | ( 0.019) | ( 0.001) | ( 0.001) | ( 0.002) | ( 0.006) | ( 0.014) | ( 0.002) | ( 0.036) | |
| Metric-ent | 0.628 | 0.654 | 0.680 | 0.582 | 0.616 | 0.943 | 0.594 | 0.561 | 0.555 | 0.509 | 0.632 |
| ( 0.058) | ( 0.048) | ( 0.004) | ( 0.060) | ( 0.003) | ( 0.012) | ( 0.003) | ( 0.007) | ( 0.015) | ( 0.003) | ( 0.118) | |
| Metric-ment | 0.635 | 0.659 | 0.685 | 0.592 | 0.620 | 0.950 | 0.642 | 0.582 | 0.571 | 0.517 | 0.645 |
| ( 0.053) | ( 0.042) | ( 0.004) | ( 0.056) | ( 0.003) | ( 0.009) | ( 0.003) | ( 0.007) | ( 0.019) | ( 0.004) | ( 0.116) | |
| Learn-original | 0.631 | 0.623 | 0.694 | 0.533 | 0.652 | 0.935 | 0.644 | 0.558 | 0.546 | 0.515 | 0.633 |
| ( 0.064) | ( 0.031) | ( 0.004) | ( 0.017) | ( 0.002) | ( 0.092) | ( 0.008) | ( 0.009) | ( 0.015) | ( 0.007) | ( 0.121) | |
| Learn-top3 | 0.628 | 0.653 | 0.680 | 0.582 | 0.677 | 0.967 | 0.660 | 0.561 | 0.555 | 0.509 | 0.647 |
| ( 0.057) | ( 0.047) | ( 0.005) | ( 0.059) | ( 0.003) | ( 0.019) | ( 0.008) | ( 0.007) | ( 0.015) | ( 0.003) | ( 0.124) | |
| Learn-sorted | 0.628 | 0.654 | 0.680 | 0.578 | 0.666 | 0.963 | 0.661 | 0.561 | 0.555 | 0.509 | 0.646 |
| ( 0.057) | ( 0.048) | ( 0.004) | ( 0.057) | ( 0.028) | ( 0.019) | ( 0.008) | ( 0.007) | ( 0.015) | ( 0.003) | ( 0.124) | |
| Learn-label | 0.633 | 0.612 | 0.707 | 0.557 | 0.656 | 0.954 | 0.701 | 0.584 | 0.565 | 0.520 | 0.649 |
| ( 0.056) | ( 0.011) | ( 0.005) | ( 0.025) | ( 0.005) | ( 0.044) | ( 0.005) | ( 0.009) | ( 0.020) | ( 0.007) | ( 0.121) | |
| Learn-merge | 0.656 | 0.628 | 0.727 | 0.528 | 0.684 | 0.968 | 0.716 | 0.584 | 0.566 | 0.518 | 0.657 |
| ( 0.065) | ( 0.017) | ( 0.006) | ( 0.005) | ( 0.003) | ( 0.024) | ( 0.006) | ( 0.009) | ( 0.021) | ( 0.005) | ( 0.128) | |
| Model-loss | 0.664 | 0.709 | 0.729 | 0.607 | 0.725 | 0.975 | 0.776 | 0.773 | 0.656 | 0.602 | 0.721 |
| ( 0.050) | ( 0.028) | ( 0.005) | ( 0.045) | ( 0.002) | ( 0.015) | ( 0.002) | ( 0.020) | ( 0.034) | ( 0.017) | ( 0.106) | |
| Model-calibration | 0.639 | 0.671 | 0.690 | 0.595 | 0.684 | 0.865 | 0.719 | 0.695 | 0.622 | 0.592 | 0.677 |
| ( 0.040) | ( 0.015) | ( 0.005) | ( 0.036) | ( 0.002) | ( 0.029) | ( 0.002) | ( 0.012) | ( 0.028) | ( 0.011) | ( 0.078) | |
| Model-lira | 0.690 | 0.749 | 0.780 | 0.601 | 0.755 | 0.995 | 0.761 | 0.753 | 0.630 | 0.569 | 0.728 |
| ( 0.085) | ( 0.066) | ( 0.005) | ( 0.053) | ( 0.003) | ( 0.003) | ( 0.005) | ( 0.024) | ( 0.028) | ( 0.009) | ( 0.120) | |
| Model-fpr | 0.647 | 0.684 | 0.712 | 0.619 | 0.697 | 0.976 | 0.724 | 0.679 | 0.623 | 0.589 | 0.695 |
| ( 0.056) | ( 0.033) | ( 0.006) | ( 0.071) | ( 0.004) | ( 0.013) | ( 0.003) | ( 0.041) | ( 0.059) | ( 0.008) | ( 0.109) | |
| Model-robust | 0.635 | 0.677 | 0.704 | 0.602 | 0.711 | 0.983 | 0.796 | 0.766 | 0.639 | 0.574 | 0.709 |
| ( 0.030) | ( 0.011) | ( 0.006) | ( 0.041) | ( 0.002) | ( 0.011) | ( 0.003) | ( 0.022) | ( 0.025) | ( 0.017) | ( 0.115) | |
| Query-augment | 0.573 | 0.575 | 0.633 | 0.542 | 0.612 | 0.696 | 0.664 | 0.570 | 0.546 | 0.512 | 0.592 |
| ( 0.025) | ( 0.009) | ( 0.005) | ( 0.024) | ( 0.001) | ( 0.002) | ( 0.004) | ( 0.007) | ( 0.020) | ( 0.009) | ( 0.057) | |
| Query-transfer | 0.522 | 0.522 | 0.533 | 0.507 | 0.529 | 0.587 | 0.574 | 0.530 | 0.515 | 0.506 | 0.533 |
| ( 0.008) | ( 0.007) | ( 0.014) | ( 0.003) | ( 0.004) | ( 0.001) | ( 0.003) | ( 0.011) | ( 0.011) | ( 0.004) | ( 0.027) | |
| Query-adv | 0.615 | 0.621 | 0.666 | 0.583 | 0.620 | 0.727 | 0.662 | 0.571 | 0.552 | 0.516 | 0.613 |
| ( 0.038) | ( 0.026) | ( 0.031) | ( 0.042) | ( 0.003) | ( 0.002) | ( 0.005) | ( 0.007) | ( 0.020) | ( 0.007) | ( 0.063) | |
| Query-neighbor | 0.511 | 0.512 | 0.509 | 0.509 | 0.533 | 0.820 | 0.530 | 0.533 | 0.527 | 0.504 | 0.549 |
| ( 0.003) | ( 0.004) | ( 0.004) | ( 0.003) | ( 0.001) | ( 0.015) | ( 0.002) | ( 0.004) | ( 0.004) | ( 0.005) | ( 0.092) | |
| Query-qrm | 0.532 | 0.537 | 0.541 | 0.530 | 0.523 | 0.946 | 0.632 | 0.524 | 0.528 | 0.506 | 0.580 |
| ( 0.072) | ( 0.083) | ( 0.088) | ( 0.060) | ( 0.057) | ( 0.007) | ( 0.004) | ( 0.038) | ( 0.035) | ( 0.007) | ( 0.136) | |
| Query-ref | 0.735 | 0.800 | 0.843 | 0.656 | N/A | N/A | N/A | N/A | N/A | N/A | 0.759 |
| ( 0.108) | ( 0.085) | ( 0.013) | ( 0.103) | N/A | N/A | N/A | N/A | N/A | N/A | ( 0.107) | |
| Target model | WRN28-2(CIFAR-10) | MLP(Purchase) | DistilBERT(Rotten-tomatoes) | Avg. | |||||||
|---|---|---|---|---|---|---|---|---|---|---|---|
| Shadow/reference model | WRN28-2 | ResNet18 | VGG11 | MobileNet-v2 | MLP | CatBoost | LR | DistilBERT | RoBERTa | Flan-T5 | |
| Learn-original | 0.631 | 0.578 | 0.632 | 0.539 | 0.652 | 0.651 | 0.564 | 0.558 | 0.560 | 0.546 | 0.591 |
| ( 0.064) | ( 0.030) | ( 0.061) | ( 0.015) | ( 0.002) | ( 0.005) | ( 0.008) | ( 0.009) | ( 0.007) | ( 0.006) | ( 0.051) | |
| Learn-top3 | 0.628 | 0.628 | 0.628 | 0.628 | 0.677 | 0.646 | 0.515 | 0.561 | 0.561 | 0.561 | 0.603 |
| ( 0.057) | ( 0.057) | ( 0.057) | ( 0.057) | ( 0.003) | ( 0.023) | ( 0.007) | ( 0.007) | ( 0.007) | ( 0.007) | ( 0.059) | |
| Learn-sorted | 0.628 | 0.629 | 0.628 | 0.629 | 0.666 | 0.656 | 0.532 | 0.561 | 0.561 | 0.561 | 0.605 |
| ( 0.057) | ( 0.058) | ( 0.057) | ( 0.058) | ( 0.028) | ( 0.019) | ( 0.048) | ( 0.007) | ( 0.007) | ( 0.007) | ( 0.058) | |
| Learn-label | 0.633 | 0.591 | 0.644 | 0.563 | 0.656 | 0.651 | 0.551 | 0.584 | 0.584 | 0.580 | 0.604 |
| ( 0.056) | ( 0.024) | ( 0.060) | ( 0.014) | ( 0.005) | ( 0.005) | ( 0.009) | ( 0.009) | ( 0.009) | ( 0.007) | ( 0.045) | |
| Learn-merge | 0.656 | 0.581 | 0.651 | 0.509 | 0.684 | 0.517 | 0.595 | 0.584 | 0.584 | 0.580 | 0.594 |
| ( 0.065) | ( 0.022) | ( 0.063) | ( 0.017) | ( 0.003) | ( 0.019) | ( 0.025) | ( 0.009) | ( 0.009) | ( 0.008) | ( 0.061) | |
| Model-loss | 0.664 | 0.657 | 0.641 | 0.632 | 0.725 | 0.608 | 0.611 | 0.773 | 0.607 | 0.589 | 0.651 |
| ( 0.050) | ( 0.045) | ( 0.039) | ( 0.025) | ( 0.002) | ( 0.001) | ( 0.002) | ( 0.020) | ( 0.008) | ( 0.008) | ( 0.061) | |
| Model-calibration | 0.639 | 0.634 | 0.617 | 0.614 | 0.684 | 0.579 | 0.588 | 0.695 | 0.595 | 0.587 | 0.623 |
| ( 0.040) | ( 0.033) | ( 0.032) | ( 0.019) | ( 0.002) | ( 0.001) | ( 0.002) | ( 0.012) | ( 0.007) | ( 0.007) | ( 0.043) | |
| Model-lira | 0.690 | 0.659 | 0.666 | 0.610 | 0.755 | 0.686 | 0.588 | 0.753 | 0.602 | 0.553 | 0.656 |
| ( 0.085) | ( 0.064) | ( 0.067) | ( 0.025) | ( 0.003) | ( 0.003) | ( 0.002) | ( 0.024) | ( 0.009) | ( 0.010) | ( 0.075) | |
| Model-fpr | 0.647 | 0.668 | 0.638 | 0.664 | 0.697 | 0.645 | 0.643 | 0.679 | 0.557 | 0.567 | 0.641 |
| ( 0.056) | ( 0.061) | ( 0.053) | ( 0.056) | ( 0.004) | ( 0.003) | ( 0.003) | ( 0.041) | ( 0.007) | ( 0.008) | ( 0.055) | |
| Model-robust | 0.635 | 0.639 | 0.633 | 0.621 | 0.711 | 0.632 | 0.625 | 0.766 | 0.624 | 0.591 | 0.648 |
| ( 0.030) | ( 0.036) | ( 0.034) | ( 0.022) | ( 0.002) | ( 0.001) | ( 0.002) | ( 0.022) | ( 0.010) | ( 0.006) | ( 0.053) | |
| Query-augment | 0.573 | 0.555 | 0.575 | 0.552 | 0.612 | 0.612 | 0.612 | 0.570 | 0.569 | 0.565 | 0.580 |
| ( 0.025) | ( 0.019) | ( 0.025) | ( 0.016) | ( 0.001) | ( 0.002) | ( 0.001) | ( 0.007) | ( 0.008) | ( 0.011) | ( 0.026) | |
| Query-transfer | 0.522 | 0.529 | 0.518 | 0.518 | 0.529 | 0.535 | 0.529 | 0.530 | 0.529 | 0.514 | 0.525 |
| ( 0.008) | ( 0.018) | ( 0.013) | ( 0.017) | ( 0.004) | ( 0.001) | ( 0.001) | ( 0.011) | ( 0.010) | ( 0.006) | ( 0.012) | |
| Query-qrm | 0.532 | 0.532 | 0.533 | 0.532 | 0.523 | 0.625 | 0.622 | 0.524 | 0.524 | 0.528 | 0.548 |
| ( 0.072) | ( 0.072) | ( 0.074) | ( 0.070) | ( 0.057) | ( 0.003) | ( 0.003) | ( 0.038) | ( 0.037) | ( 0.039) | ( 0.061) | |
| Query-ref | 0.735 | 0.740 | 0.722 | 0.708 | N/A | N/A | N/A | N/A | N/A | N/A | 0.726 |
| ( 0.108) | ( 0.100) | ( 0.093) | ( 0.074) | N/A | N/A | N/A | N/A | N/A | N/A | ( 0.088) | |
A.6 Performance under different metrics
| Algorithm | Precision | Recall | F1-score | Acc | FNR | FPR | MA | TPR@1%FPR | TPR@10%FPR | AUROC |
|---|---|---|---|---|---|---|---|---|---|---|
| Metric-loss | 0.579 | 0.905 | 0.706 | 0.623 | 0.095 | 0.659 | 0.246 | 0.009 | 0.132 | 0.635 |
| ( 0.030) | ( 0.039) | ( 0.033) | ( 0.045) | ( 0.039) | ( 0.057) | ( 0.091) | ( 0.005) | ( 0.014) | ( 0.053) | |
| Metric-conf | 0.579 | 0.905 | 0.706 | 0.623 | 0.095 | 0.659 | 0.246 | 0.009 | 0.131 | 0.635 |
| ( 0.030) | ( 0.039) | ( 0.033) | ( 0.045) | ( 0.039) | ( 0.057) | ( 0.091) | ( 0.005) | ( 0.014) | ( 0.053) | |
| Metric-corr | 0.528 | 0.982 | 0.687 | 0.552 | 0.018 | 0.877 | 0.105 | 0.000 | 0.000 | 0.552 |
| ( 0.004) | ( 0.041) | ( 0.013) | ( 0.009) | ( 0.041) | ( 0.025) | ( 0.018) | ( 0.000) | ( 0.000) | ( 0.009) | |
| Metric-ent | 0.574 | 0.878 | 0.694 | 0.614 | 0.122 | 0.649 | 0.229 | 0.012 | 0.133 | 0.628 |
| ( 0.032) | ( 0.073) | ( 0.046) | ( 0.050) | ( 0.073) | ( 0.028) | ( 0.101) | ( 0.001) | ( 0.015) | ( 0.058) | |
| Metric-ment | 0.579 | 0.901 | 0.705 | 0.624 | 0.099 | 0.654 | 0.247 | 0.010 | 0.133 | 0.635 |
| ( 0.029) | ( 0.044) | ( 0.035) | ( 0.046) | ( 0.044) | ( 0.050) | ( 0.091) | ( 0.005) | ( 0.015) | ( 0.053) | |
| Learn-original | 0.570 | 0.872 | 0.688 | 0.611 | 0.128 | 0.650 | 0.222 | 0.015 | 0.162 | 0.631 |
| ( 0.031) | ( 0.128) | ( 0.065) | ( 0.051) | ( 0.128) | ( 0.031) | ( 0.102) | ( 0.005) | ( 0.031) | ( 0.064) | |
| Learn-top3 | 0.576 | 0.877 | 0.695 | 0.616 | 0.123 | 0.645 | 0.232 | 0.012 | 0.130 | 0.628 |
| ( 0.033) | ( 0.071) | ( 0.046) | ( 0.051) | ( 0.071) | ( 0.033) | ( 0.102) | ( 0.001) | ( 0.013) | ( 0.057) | |
| Learn-sorted | 0.575 | 0.875 | 0.694 | 0.615 | 0.125 | 0.645 | 0.230 | 0.012 | 0.132 | 0.628 |
| ( 0.032) | ( 0.070) | ( 0.046) | ( 0.050) | ( 0.070) | ( 0.032) | ( 0.101) | ( 0.001) | ( 0.014) | ( 0.057) | |
| Learn-label | 0.573 | 0.925 | 0.708 | 0.618 | 0.075 | 0.689 | 0.237 | 0.015 | 0.156 | 0.633 |
| ( 0.027) | ( 0.061) | ( 0.038) | ( 0.045) | ( 0.061) | ( 0.036) | ( 0.090) | ( 0.005) | ( 0.031) | ( 0.056) | |
| Learn-merge | 0.580 | 0.908 | 0.708 | 0.625 | 0.092 | 0.658 | 0.250 | 0.020 | 0.178 | 0.656 |
| ( 0.030) | ( 0.039) | ( 0.034) | ( 0.046) | ( 0.039) | ( 0.054) | ( 0.093) | ( 0.008) | ( 0.041) | ( 0.065) | |
| Model-loss | 0.581 | 0.811 | 0.676 | 0.611 | 0.189 | 0.589 | 0.222 | 0.050 | 0.211 | 0.664 |
| ( 0.026) | ( 0.053) | ( 0.022) | ( 0.032) | ( 0.053) | ( 0.086) | ( 0.065) | ( 0.015) | ( 0.027) | ( 0.050) | |
| Model-calibration | 0.566 | 0.835 | 0.674 | 0.597 | 0.165 | 0.641 | 0.193 | 0.040 | 0.173 | 0.639 |
| ( 0.020) | ( 0.040) | ( 0.018) | ( 0.027) | ( 0.040) | ( 0.069) | ( 0.054) | ( 0.011) | ( 0.013) | ( 0.040) | |
| Model-lira | 0.591 | 0.810 | 0.682 | 0.622 | 0.190 | 0.567 | 0.243 | 0.120 | 0.300 | 0.690 |
| ( 0.039) | ( 0.036) | ( 0.026) | ( 0.049) | ( 0.036) | ( 0.108) | ( 0.097) | ( 0.059) | ( 0.107) | ( 0.085) | |
| Model-fpr | 0.624 | 0.520 | 0.566 | 0.605 | 0.480 | 0.310 | 0.210 | 0.074 | 0.261 | 0.647 |
| ( 0.042) | ( 0.074) | ( 0.060) | ( 0.038) | ( 0.074) | ( 0.027) | ( 0.076) | ( 0.034) | ( 0.064) | ( 0.056) | |
| Model-robust | 0.553 | 0.882 | 0.676 | 0.583 | 0.118 | 0.716 | 0.167 | 0.070 | 0.221 | 0.635 |
| ( 0.015) | ( 0.135) | ( 0.039) | ( 0.018) | ( 0.135) | ( 0.123) | ( 0.036) | ( 0.023) | ( 0.032) | ( 0.030) | |
| Query-augment | 0.539 | 0.917 | 0.679 | 0.567 | 0.083 | 0.783 | 0.135 | 0.004 | 0.071 | 0.573 |
| ( 0.013) | ( 0.039) | ( 0.019) | ( 0.022) | ( 0.039) | ( 0.027) | ( 0.045) | ( 0.003) | ( 0.046) | ( 0.025) | |
| Query-transfer | 0.519 | 0.943 | 0.670 | 0.535 | 0.057 | 0.873 | 0.070 | 0.006 | 0.101 | 0.522 |
| ( 0.005) | ( 0.033) | ( 0.012) | ( 0.008) | ( 0.033) | ( 0.019) | ( 0.017) | ( 0.003) | ( 0.003) | ( 0.008) | |
| Query-adv | 0.583 | 0.916 | 0.712 | 0.631 | 0.084 | 0.654 | 0.261 | 0.002 | 0.084 | 0.615 |
| ( 0.035) | ( 0.027) | ( 0.031) | ( 0.042) | ( 0.027) | ( 0.074) | ( 0.084) | ( 0.004) | ( 0.050) | ( 0.038) | |
| Query-neighbor | 0.514 | 0.417 | 0.452 | 0.510 | 0.583 | 0.396 | 0.021 | 0.000 | 0.074 | 0.511 |
| ( 0.005) | ( 0.115) | ( 0.079) | ( 0.001) | ( 0.115) | ( 0.116) | ( 0.003) | ( 0.000) | ( 0.011) | ( 0.003) | |
| Query-qrm | 0.518 | 0.583 | 0.522 | 0.529 | 0.417 | 0.525 | 0.057 | 0.000 | 0.000 | 0.532 |
| ( 0.037) | ( 0.301) | ( 0.150) | ( 0.058) | ( 0.301) | ( 0.252) | ( 0.116) | ( 0.000) | ( 0.000) | ( 0.072) | |
| Query-ref | 0.649 | 0.776 | 0.696 | 0.666 | 0.224 | 0.445 | 0.331 | 0.152 | 0.355 | 0.735 |
| ( 0.075) | ( 0.140) | ( 0.050) | ( 0.062) | ( 0.140) | ( 0.180) | ( 0.123) | ( 0.084) | ( 0.152) | ( 0.108) |
| Algorithm | Precision | Recall | F1-score | Acc | FNR | FPR | MA | TPR@1%FPR | TPR@10%FPR | AUROC |
|---|---|---|---|---|---|---|---|---|---|---|
| Metric-loss | 0.587 | 0.956 | 0.727 | 0.642 | 0.044 | 0.672 | 0.283 | 0.010 | 0.108 | 0.619 |
| ( 0.002) | ( 0.006) | ( 0.003) | ( 0.003) | ( 0.006) | ( 0.005) | ( 0.007) | ( 0.000) | ( 0.001) | ( 0.003) | |
| Metric-conf | 0.587 | 0.956 | 0.727 | 0.642 | 0.044 | 0.672 | 0.283 | 0.010 | 0.108 | 0.619 |
| ( 0.002) | ( 0.006) | ( 0.003) | ( 0.003) | ( 0.006) | ( 0.005) | ( 0.007) | ( 0.000) | ( 0.001) | ( 0.003) | |
| Metric-corr | 0.527 | 1.000 | 0.690 | 0.551 | 0.000 | 0.897 | 0.103 | 0.000 | 0.000 | 0.551 |
| ( 0.002) | ( 0.000) | ( 0.001) | ( 0.001) | ( 0.000) | ( 0.002) | ( 0.002) | ( 0.000) | ( 0.000) | ( 0.001) | |
| Metric-ent | 0.582 | 0.948 | 0.721 | 0.634 | 0.052 | 0.680 | 0.268 | 0.010 | 0.108 | 0.616 |
| ( 0.002) | ( 0.008) | ( 0.004) | ( 0.004) | ( 0.008) | ( 0.006) | ( 0.007) | ( 0.000) | ( 0.001) | ( 0.003) | |
| Metric-ment | 0.587 | 0.962 | 0.729 | 0.643 | 0.038 | 0.676 | 0.286 | 0.010 | 0.108 | 0.620 |
| ( 0.002) | ( 0.005) | ( 0.003) | ( 0.003) | ( 0.005) | ( 0.008) | ( 0.007) | ( 0.000) | ( 0.001) | ( 0.003) | |
| Learn-original | 0.582 | 0.956 | 0.724 | 0.635 | 0.044 | 0.686 | 0.270 | 0.016 | 0.151 | 0.652 |
| ( 0.003) | ( 0.010) | ( 0.002) | ( 0.002) | ( 0.010) | ( 0.011) | ( 0.005) | ( 0.002) | ( 0.005) | ( 0.002) | |
| Learn-top3 | 0.585 | 0.956 | 0.726 | 0.639 | 0.044 | 0.678 | 0.279 | 0.018 | 0.175 | 0.677 |
| ( 0.002) | ( 0.006) | ( 0.003) | ( 0.003) | ( 0.006) | ( 0.005) | ( 0.007) | ( 0.001) | ( 0.010) | ( 0.003) | |
| Learn-sorted | 0.586 | 0.949 | 0.725 | 0.640 | 0.051 | 0.670 | 0.280 | 0.018 | 0.167 | 0.666 |
| ( 0.003) | ( 0.007) | ( 0.003) | ( 0.004) | ( 0.007) | ( 0.007) | ( 0.008) | ( 0.004) | ( 0.034) | ( 0.028) | |
| Learn-label | 0.585 | 0.965 | 0.728 | 0.640 | 0.035 | 0.685 | 0.280 | 0.016 | 0.153 | 0.656 |
| ( 0.002) | ( 0.003) | ( 0.002) | ( 0.003) | ( 0.003) | ( 0.006) | ( 0.006) | ( 0.000) | ( 0.004) | ( 0.005) | |
| Learn-merge | 0.589 | 0.953 | 0.728 | 0.644 | 0.047 | 0.665 | 0.288 | 0.020 | 0.187 | 0.684 |
| ( 0.002) | ( 0.005) | ( 0.002) | ( 0.003) | ( 0.005) | ( 0.006) | ( 0.006) | ( 0.001) | ( 0.003) | ( 0.003) | |
| Model-loss | 0.611 | 0.843 | 0.708 | 0.653 | 0.157 | 0.537 | 0.306 | 0.056 | 0.276 | 0.725 |
| ( 0.006) | ( 0.028) | ( 0.006) | ( 0.001) | ( 0.028) | ( 0.030) | ( 0.003) | ( 0.002) | ( 0.003) | ( 0.002) | |
| Model-calibration | 0.590 | 0.842 | 0.693 | 0.628 | 0.158 | 0.586 | 0.256 | 0.040 | 0.206 | 0.684 |
| ( 0.011) | ( 0.063) | ( 0.016) | ( 0.002) | ( 0.063) | ( 0.065) | ( 0.003) | ( 0.002) | ( 0.002) | ( 0.002) | |
| Model-lira | 0.614 | 0.913 | 0.734 | 0.670 | 0.087 | 0.573 | 0.340 | 0.134 | 0.378 | 0.755 |
| ( 0.003) | ( 0.022) | ( 0.006) | ( 0.002) | ( 0.022) | ( 0.021) | ( 0.004) | ( 0.009) | ( 0.005) | ( 0.003) | |
| Model-fpr | 0.636 | 0.658 | 0.646 | 0.640 | 0.342 | 0.377 | 0.281 | 0.073 | 0.296 | 0.697 |
| ( 0.009) | ( 0.035) | ( 0.012) | ( 0.002) | ( 0.035) | ( 0.032) | ( 0.005) | ( 0.008) | ( 0.012) | ( 0.004) | |
| Model-robust | 0.599 | 0.839 | 0.697 | 0.638 | 0.161 | 0.564 | 0.275 | 0.094 | 0.289 | 0.711 |
| ( 0.012) | ( 0.074) | ( 0.018) | ( 0.002) | ( 0.074) | ( 0.074) | ( 0.005) | ( 0.003) | ( 0.003) | ( 0.002) | |
| Query-augment | 0.563 | 0.963 | 0.711 | 0.609 | 0.037 | 0.745 | 0.218 | 0.000 | 0.000 | 0.612 |
| ( 0.002) | ( 0.002) | ( 0.002) | ( 0.001) | ( 0.002) | ( 0.003) | ( 0.003) | ( 0.000) | ( 0.000) | ( 0.001) | |
| Query-transfer | 0.523 | 0.981 | 0.682 | 0.544 | 0.019 | 0.893 | 0.088 | 0.010 | 0.100 | 0.529 |
| ( 0.003) | ( 0.008) | ( 0.004) | ( 0.005) | ( 0.008) | ( 0.002) | ( 0.009) | ( 0.000) | ( 0.002) | ( 0.004) | |
| Query-adv | 0.569 | 0.879 | 0.690 | 0.607 | 0.121 | 0.665 | 0.214 | 0.000 | 0.000 | 0.620 |
| ( 0.005) | ( 0.038) | ( 0.008) | ( 0.003) | ( 0.038) | ( 0.038) | ( 0.006) | ( 0.000) | ( 0.000) | ( 0.003) | |
| Query-neighbor | 0.524 | 0.527 | 0.522 | 0.524 | 0.473 | 0.480 | 0.048 | 0.000 | 0.115 | 0.533 |
| ( 0.006) | ( 0.094) | ( 0.046) | ( 0.001) | ( 0.094) | ( 0.093) | ( 0.002) | ( 0.000) | ( 0.002) | ( 0.001) | |
| Query-qrm | 0.516 | 0.313 | 0.282 | 0.529 | 0.687 | 0.255 | 0.058 | 0.000 | 0.000 | 0.523 |
| ( 0.037) | ( 0.421) | ( 0.313) | ( 0.064) | ( 0.421) | ( 0.313) | ( 0.128) | ( 0.000) | ( 0.000) | ( 0.057) |
| Algorithm | Precision | Recall | F1-score | Acc | FNR | FPR | MA | TPR@1%FPR | TPR@10%FPR | AUROC |
|---|---|---|---|---|---|---|---|---|---|---|
| Metric-loss | 0.549 | 0.828 | 0.660 | 0.578 | 0.172 | 0.672 | 0.156 | 0.011 | 0.121 | 0.582 |
| ( 0.010) | ( 0.031) | ( 0.013) | ( 0.009) | ( 0.031) | ( 0.017) | ( 0.019) | ( 0.003) | ( 0.010) | ( 0.007) | |
| Metric-conf | 0.549 | 0.828 | 0.660 | 0.578 | 0.172 | 0.672 | 0.156 | 0.011 | 0.121 | 0.582 |
| ( 0.010) | ( 0.031) | ( 0.013) | ( 0.009) | ( 0.031) | ( 0.017) | ( 0.019) | ( 0.003) | ( 0.010) | ( 0.007) | |
| Metric-corr | 0.529 | 0.947 | 0.678 | 0.557 | 0.053 | 0.833 | 0.113 | 0.000 | 0.000 | 0.557 |
| ( 0.009) | ( 0.008) | ( 0.008) | ( 0.006) | ( 0.008) | ( 0.006) | ( 0.011) | ( 0.000) | ( 0.000) | ( 0.006) | |
| Metric-ent | 0.536 | 0.766 | 0.629 | 0.555 | 0.234 | 0.655 | 0.110 | 0.011 | 0.119 | 0.561 |
| ( 0.009) | ( 0.061) | ( 0.020) | ( 0.007) | ( 0.061) | ( 0.050) | ( 0.013) | ( 0.003) | ( 0.010) | ( 0.007) | |
| Metric-ment | 0.549 | 0.828 | 0.660 | 0.578 | 0.172 | 0.672 | 0.156 | 0.011 | 0.121 | 0.582 |
| ( 0.010) | ( 0.031) | ( 0.013) | ( 0.009) | ( 0.031) | ( 0.017) | ( 0.019) | ( 0.003) | ( 0.010) | ( 0.007) | |
| Learn-original | 0.533 | 0.780 | 0.633 | 0.552 | 0.220 | 0.675 | 0.105 | 0.012 | 0.120 | 0.558 |
| ( 0.010) | ( 0.053) | ( 0.017) | ( 0.009) | ( 0.053) | ( 0.050) | ( 0.017) | ( 0.003) | ( 0.007) | ( 0.009) | |
| Learn-top3 | 0.536 | 0.766 | 0.629 | 0.555 | 0.234 | 0.655 | 0.110 | 0.011 | 0.119 | 0.561 |
| ( 0.009) | ( 0.061) | ( 0.020) | ( 0.007) | ( 0.061) | ( 0.050) | ( 0.013) | ( 0.003) | ( 0.009) | ( 0.007) | |
| Learn-sorted | 0.536 | 0.766 | 0.629 | 0.555 | 0.234 | 0.655 | 0.110 | 0.011 | 0.119 | 0.561 |
| ( 0.009) | ( 0.061) | ( 0.020) | ( 0.007) | ( 0.061) | ( 0.050) | ( 0.013) | ( 0.003) | ( 0.010) | ( 0.007) | |
| Learn-label | 0.546 | 0.866 | 0.670 | 0.578 | 0.134 | 0.711 | 0.155 | 0.011 | 0.122 | 0.584 |
| ( 0.009) | ( 0.023) | ( 0.012) | ( 0.009) | ( 0.023) | ( 0.019) | ( 0.018) | ( 0.003) | ( 0.007) | ( 0.009) | |
| Learn-merge | 0.547 | 0.862 | 0.669 | 0.578 | 0.138 | 0.705 | 0.157 | 0.012 | 0.122 | 0.584 |
| ( 0.010) | ( 0.017) | ( 0.011) | ( 0.009) | ( 0.017) | ( 0.018) | ( 0.019) | ( 0.002) | ( 0.009) | ( 0.009) | |
| Model-loss | 0.683 | 0.707 | 0.694 | 0.691 | 0.293 | 0.324 | 0.383 | 0.148 | 0.385 | 0.773 |
| ( 0.011) | ( 0.061) | ( 0.025) | ( 0.015) | ( 0.061) | ( 0.033) | ( 0.030) | ( 0.021) | ( 0.034) | ( 0.020) | |
| Model-calibration | 0.606 | 0.777 | 0.680 | 0.639 | 0.223 | 0.500 | 0.277 | 0.106 | 0.234 | 0.695 |
| ( 0.008) | ( 0.045) | ( 0.015) | ( 0.006) | ( 0.045) | ( 0.041) | ( 0.013) | ( 0.011) | ( 0.019) | ( 0.012) | |
| Model-lira | 0.631 | 0.813 | 0.710 | 0.671 | 0.187 | 0.471 | 0.342 | 0.183 | 0.374 | 0.753 |
| ( 0.007) | ( 0.043) | ( 0.018) | ( 0.017) | ( 0.043) | ( 0.032) | ( 0.035) | ( 0.026) | ( 0.048) | ( 0.024) | |
| Model-fpr | 0.671 | 0.506 | 0.573 | 0.630 | 0.494 | 0.245 | 0.260 | 0.141 | 0.340 | 0.679 |
| ( 0.006) | ( 0.094) | ( 0.062) | ( 0.025) | ( 0.094) | ( 0.048) | ( 0.049) | ( 0.024) | ( 0.043) | ( 0.041) | |
| Model-robust | 0.651 | 0.797 | 0.715 | 0.684 | 0.203 | 0.429 | 0.368 | 0.162 | 0.375 | 0.766 |
| ( 0.031) | ( 0.063) | ( 0.008) | ( 0.021) | ( 0.063) | ( 0.101) | ( 0.042) | ( 0.028) | ( 0.027) | ( 0.022) | |
| Query-augment | 0.537 | 0.878 | 0.666 | 0.565 | 0.122 | 0.747 | 0.131 | 0.000 | 0.000 | 0.570 |
| ( 0.008) | ( 0.019) | ( 0.003) | ( 0.006) | ( 0.019) | ( 0.026) | ( 0.012) | ( 0.000) | ( 0.000) | ( 0.007) | |
| Query-transfer | 0.525 | 0.933 | 0.672 | 0.549 | 0.067 | 0.835 | 0.098 | 0.008 | 0.090 | 0.530 |
| ( 0.011) | ( 0.009) | ( 0.011) | ( 0.007) | ( 0.009) | ( 0.007) | ( 0.014) | ( 0.005) | ( 0.040) | ( 0.011) | |
| Query-adv | 0.537 | 0.881 | 0.667 | 0.566 | 0.119 | 0.750 | 0.131 | 0.000 | 0.000 | 0.571 |
| ( 0.008) | ( 0.031) | ( 0.010) | ( 0.005) | ( 0.031) | ( 0.040) | ( 0.011) | ( 0.000) | ( 0.000) | ( 0.007) | |
| Query-neighbor | 0.525 | 0.909 | 0.665 | 0.548 | 0.091 | 0.813 | 0.096 | 0.011 | 0.091 | 0.533 |
| ( 0.008) | ( 0.021) | ( 0.010) | ( 0.004) | ( 0.021) | ( 0.018) | ( 0.007) | ( 0.003) | ( 0.005) | ( 0.004) | |
| Query-qrm | 0.509 | 0.722 | 0.597 | 0.525 | 0.278 | 0.672 | 0.049 | 0.000 | 0.000 | 0.524 |
| ( 0.023) | ( 0.079) | ( 0.042) | ( 0.035) | ( 0.079) | ( 0.035) | ( 0.070) | ( 0.000) | ( 0.000) | ( 0.038) |