Graph-based Confidence Calibration for Large Language Models
Abstract
One important approach to improving the reliability of large language models (LLMs) is to provide accurate confidence estimations regarding the correctness of their answers. However, developing a well-calibrated confidence estimation model is challenging, as mistakes made by LLMs can be difficult to detect. We propose a novel method combining the LLM’s self-consistency with labeled data and training an auxiliary model to estimate the correctness of its responses to questions. This auxiliary model predicts the correctness of responses based solely on their consistent information. To set up the learning problem, we use a weighted graph to represent the consistency among the LLM’s multiple responses to a question. Correctness labels are assigned to these responses based on their similarity to the correct answer. We then train a graph neural network to estimate the probability of correct responses. Experiments demonstrate that the proposed approach substantially outperforms several of the most recent methods in confidence calibration across multiple widely adopted benchmark datasets. Furthermore, the proposed approach significantly improves the generalization capability of confidence calibration on out-of-domain (OOD) data.
1 Introduction
In recent years, large language models (LLMs) have demonstrated remarkable capabilities across various natural language processing tasks such as question answering (Wei et al., 2022; Shen et al., 2023; Zheng et al., 2023; Qin et al., 2023; Singhal et al., 2023), text summarization (Tang et al., 2023; Deroy et al., 2023; Tam et al., 2023; Roit et al., 2023), and even creative writing (Gómez-Rodríguez & Williams, 2023; Wang et al., 2024; Deng et al., 2024). Despite their impressive performance, LLMs often give wrong answers in question-answering tasks. There is an urgent need to check the correctness of LLMs’ responses. One particularly interesting question is to calibrate the confidence levels of the correctness of responses from LLMs (Kuhn et al., 2022; Ulmer et al., 2022; He & Jiang, 2023; Van Landeghem et al., 2022; Vazhentsev et al., 2023; Ulmer et al., 2024). Accurate confidence estimation is vital for deploying LLMs in the real world, as it allows users to gauge the reliability of the model’s predictions and make informed decisions based on these outputs. On the contrary, miscalibrated confidence may lead to over-trust in incorrect responses or doubts about the correct ones. For example, a misleading response may steer a patient in the wrong direction when making health decisions; it may also lead an investor to impulsive investment decisions.
In this work, we consider calibrating the confidence with the correctness of LLMs’ responses. This task is challenging in several aspects. First, due to LLMs’ superior ability to generate text, mistakes in an LLM’s response are usually at the semantic level, making it hard to detect even for humans. There are methods using an auxiliary Language Model (e.g., DeBERTa (He et al., 2020)) to check whether the LLM’s response answers the question Ulmer et al. (2024). Since the LLM is supposed to be much stronger than the LM, the LLM should be able to avoid most mistakes that can be detected by an LM; this type of method may omit a significant fraction of wrong answers. Second, it is hard to detect mistakes from the LLM’s internal working mechanism. Because the LLM uses many hidden layers to process the information, it is hard to discern the signal from a small number of hidden units. Even if this is possible, it is not easy to apply this type of method to black-box LLMs.
Recently, there has been some progress in quantifying the model’s own confidence in a response through consistency among the model’s responses (Chen & Mueller, 2023; Lin et al., 2024). If the LLM always gives similar responses, then there is less uncertainty, and any one of these responses tends to have a high probability of being correct. In particular, the results show that the model’s own confidence in its response has a strong correlation with the correctness of the response. This new development leads to an important research question: whether we can calibrate the confidence of correctness from consistency among the LLM’s responses.
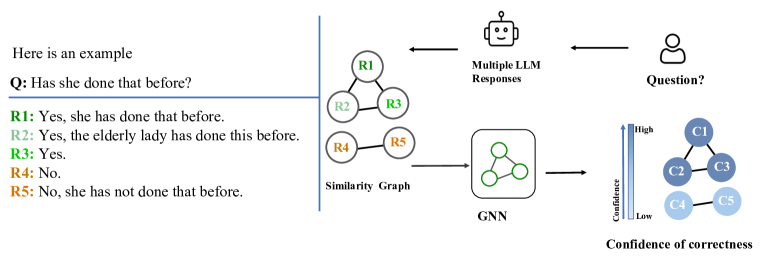
In this work, we develop a new method to calibrate the confidence of correctness from the consistency of an LLM’s responses. To achieve this goal, we train a separate calibration model to predict the correctness of the LLM’s responses. To get the input to the calibration model, we form a similarity graph over the LLM’s multiple responses to the same question. The similarity graph encodes information about the consistency between LLM’s responses. A response consistent with more answers tends to have a higher likelihood of being correct, so the consistency graph is predictive of the responses’ correctness. In our new approach, the calibration model only considers the consistency among responses without processing any actual language information. Thus, we can use a relatively simple and efficient model.
Our model achieves premium performance in the empirical study. Compared with previous calibration methods, our model has much better calibration performance because of the usage of consistency graphs. Compared to prior methods based on consistency inputs, our method improves not only the calibration performance but also the ranking performance. Furthermore, our method improves the generalizability of confidence calibration for out-of-domain settings, demonstrating the advantage of using a separate learning model. In summary, our main contributions are:
-
•
Graph-based confidence calibration method: We propose a novel graph-based confidence calibration approach to improve the reliability of LLMs.
-
•
Enhanced calibration performance: Our evaluations demonstrate that the proposed method substantially outperforms recent methods in confidence calibration across several widely used benchmark datasets.
-
•
Improved OOD generalizability: Evaluations on OOD confidence calibration show that our graph-based approach significantly improves generalizability in OOD settings.
2 Related Work
Due to the urgent need to improve the reliability of LLMs, confidence estimation and calibration for these models have become active areas of research. Existing research in LLM uncertainty quantification can be summarized into two main categories: uncertainty quantification and confidence calibration (Geng et al., 2023). Confidence estimation for short responses (e.g., for multi-choice or yes-no questions) is generally less complicated than for long responses (Ye et al., 2024). For a brief response, the LLM’s output logits are informative about its confidence; the easy comparisons of responses to the true answer facilitate both calibration and evaluation. Confidence estimation for long responses cannot simply depend on LLM’s output logits (Duan et al., 2023; Bakman et al., 2024) because the logits indicate more about the probability of text and less about the semantics behind it. There are also methods using the internal state of an LLM (Ren et al., 2022), but it is not always available to have such information about the LLM interface.
Another approach is to check the LLM’s consistency in its responses. Kotelanski et al. (2023) demonstrate that repeated sampling and consistency checks across multiple outputs can serve as reliable proxies for model confidence. Manakul et al. (2023) generates multiple responses from the LLM and checks the consistency between responses using various methods, including querying the LLM. Chen & Mueller (2023) combines the consistency between responses and the LLM’s self-reflection certainty to quantify the uncertainty. Kuhn et al. (2022) considers confidence from semantic equivalence and proposes a method based on clustering of responses. Lin et al. (2024) organize responses in a graph with their pairwise semantic similarity and then extract graph statistics for confidence estimation. Zhang et al. (2024) examines methods of comparing responses via entailment and contradiction relationships. These studies highlight the importance of semantic consistency in confidence estimation. These methods are evaluated by comparing their estimated confidence values against the correctness of responses. The correct labels are often obtained by reference matching (Huang et al., 2024), checking whether responses match true answers with a particular similarity measure.
To better calibrate the confidence estimation, some methods directly use correctness labels in their calibration procedures. Mielke et al. (2022) trains a calibrator to predict the correctness of a response for a given question. With a similar idea, Ulmer et al. (2024) trains a language model (e.g., DeBERTa) based on question-response pairs to predict the probability of responses’ correctness. Based on SelfCheckGPT (Manakul et al., 2023) and JAFC (Tian et al., 2023), Chen et al. (2024) train supervised models to reduce grouping losses and improve the confidence estimation. The method by Liu et al. (2024) uses an LLM’s latent representations to predict the correctness of responses. Detommaso et al. (2024) uses the “multicalibration” technique to calibrate the probability of correctness. (Fadeeva et al., 2023) offers a detailed comparative study of various confidence estimation methods, providing empirical evidence on their effectiveness across different tasks. However, these studies have not sufficiently exploited response consistency to predict the probabilities of the responses being correct.
3 Method
Our ultimate goal is to quantify the probability of the correctness of a response from an LLM. Since the LLM can give a correct answer with different phrases, we need to consider the probability that the response is semantically correct.
Background: The formulation of semantic equivalence (Kuhn et al., 2022) provides a framework for our analysis. Let be the space of all possible responses. Given a question , the space is divided into a set of semantic classes: and for any two different semantic classes . For two responses in the same equivalent class, they are considered as the same semantic response: if one is the correct answer, the other is correct as well, and vice versa. Then, we can consider the quality of the LLM’s responses at the semantic level. In particular, a semantic response has probability
| (1) |
Here is the probability of a single response from the LLM.
However, it is non-trivial to define the equivalent class, and we will discuss the approximation later. To estimate , one approach is through semantic similarities between response samples of an LLM for the same question . Let be responses from the same question , and they form clusters by their semantic similarity. We can use Natural language inference (NLI) systems to predict the relationships (e.g., entailment and contradiction) between responses and derive their similarity.
We assume that each cluster cluster is from a different semantic class , then can be approximated by
| (2) |
From the cluster probabilities, the uncertainty of the LLM on the question is estimated as the entropy of the empirical distribution over clusters (Kuhn et al., 2022), and the confidence of a response is estimated as (assuming similarity values are binary) (Lin et al., 2024).
Now, we depart from the setup of semantic classes and consider the correctness of responses. Let be the correct semantic answer to question . Without knowing which responses are correct answers, a common assumption is that the model’s confidence reflects the correctness, that is, the model’s confidence in a semantic response is approximately the probability of correctness, then
| (3) |
It says that the more certain the model is about a semantic response, the more likely the response is correct. Conversely, a wide variation in the LLM’s responses indicates low confidence in all responses and low accuracy. This pattern is also found in previous studies (Kuhn et al., 2022; Lin et al., 2024).
While we agree that a positive correlation exists between the LLM’s confidence and the probability of correctness, we do not believe that they are equal, as shown in equation 3. Therefore, we need further calibration to reflect the probability of correctness.
3.1 Confidence calibration as graph learning problem
Now, we set a supervised learning problem and train a model to calibrate the confidence of the correctness of responses. We first consider the correctness labels of the LLM’s responses. In the supervised setting, we have a correct answer to the question . Then to assign correctness labels to sampled responses for the same question . In our work, we use the ROUGE similarity. Specifically, we compute the ROUGE similarity between a sampled response and the correct answer to decide the correctness label.
| (4) |
Here is one if the condition is true or 0 otherwise. The ROUGE metric is reasonably accurate in measuring semantic similarity between short sentences (Lin & Och, 2004).
We then consider the input to the calibration model. We form a similar graph over responses to encode information about their consistency. The graph contains the clustering structure of responses and likely further useful information to predict the correctness of responses. The graph is a fully connected graph, with the node set consisting of responses and the edge weight being the similarity between the pair of responses . We compute the similarity from the two responses’ embeddings. In particular, we first use the Sentence-BERT model (Reimers & Gurevych, 2019) to compute the two responses’ vector representations and then compute the cosine similarity
| (5) |
Here, represents the embedding function.
Then, we treat the problem as a node classification problem (Xiao et al., 2022). In particular, we run a Graph Neural Network (GNN) to predict the probability of each response being correct
| (6) |
Here contains the probabilities for responses being correct.
To provide clustering information to the GNN, we first run the K-means clustering algorithm on the responses’ embeddings and assign cluster IDs from 0 to based on the order from largest to smallest (ties are randomly broken). Then, we feed each response’s cluster membership as a one-hot feature input to the GNN. Therefore, the GNN’s predictions are purely based on the relationships between responses in semantic space. We choose NOT to feed in the embedding vectors of responses to avoid the GNN’s dependency on textual information. This helps the GNN generalize questions from different domains. The overall framework is shown in Fig 1.
The main purpose of the learning model is to calibrate . One approach is to minimize the cross-entropy loss of against correctness labels. The loss computed from the question is
| (7) |
Note that the loss is consistent marginally since the loss is minimized when . An alternative approach is to minimize the squared error , from which we get similar performances, so we choose the cross-entropy loss. A further consideration is to explicitly consider the similarity between and given the response similarity . We leave such exploration to the future.
3.2 Improve the estimation through multiple prompts
It is well known that the syntactic form of a question influences responses and introduces additional variance. To reduce this variance and evaluate the LLM’s semantic consistency, we analyze the LLM’s responses to multiple prompts derived from the same question. These responses are treated as answers to the same semantic question. We then apply the same method as before to predict the correctness of each response.
In particular, we rephrase the original question into different forms while maintaining the original sentence’s semantic meaning. We employ a multiple rephrased questions strategy for answer sampling. Specifically, we prompt the GPT-4 to give different but with the same meaning rephrased questions for the given question . Then, we sample responses from the LLM for each rephrased question and still get a total of responses, from which the confidence calibration is the same as we have described above. The model is more likely to produce diverse responses for questions about which the LLM is less certain. Confidence calibration is more accurate in this scenario because the model’s uncertainty becomes more apparent.
4 Experiments
The goal of this section is to compare our proposed framework with baseline methods in terms of confidence calibration. All experiments are conducted on NVIDIA A100 GPUs with 80GB of memory. The supplementary materials and Appendix provide the code for our model, more experiment details in Appendix A.1, and prompting strategy and Appendix A.6.
4.1 Dataset and Experiment setup
Dataset: We conduct experiments on two public benchmark datasets: (1) CoQA (Reddy et al., 2019), an open-book conversational question answering (QA) task; (2) TriviaQA (Joshi et al., 2017), a commonsense QA task. We use the first 4k as training data and 1582 for validation and testing, both of equal size. We provide more details about training in the Appendix A.1.
Baselines: We compare our methods with the following baselines.
Length-normalized sequence likelihoods (Seq. likelihood) (Malinin & Gales, 2021; Kuhn et al., 2022) is a standard measure for confidence. This method calculates the likelihood of each sequence and normalizes it by the length of the sequence to provide a fair comparison between different lengths of sequences. Platt scaling (Platt, 1999), a variant of the sequence likelihood baseline, applies Platt scaling to the raw likelihoods. GraphSpectral (Chen et al., 2024) uses the graph theory to estimate the confidence. Then we also include post-hoc uncertainty calibration,GraphSpectral+Iso and GraphSpectral+Platt into the baseline methods. Self-check GPT(Manakul et al., 2023) checked the consistency between responses querying the LLM. Verbalized Uncertainty (Lin et al., 2022; Tian et al., 2023; Xiong et al., 2024) generates verbal statements about the model’s confidence in its predictions. Verbalized Qual maps the confidence percent (Verbalized %) into numerical values. APRICOT (Ulmer et al., 2024), a supervised method, fine-tunes the Deberta language model to predict confidence scores for LLM outputs. Furthermore, we also include the baseline of applying two post-hoc uncertainty calibration methods, APRICOT+Iso and APRICOT+Platt, to adjust the confidence scores obtained by Apricot. We performed all the baseline experiments utilizing the open-source codebase.
Graph construction: For each question, we prompt the LLM to generate 30 answers. Each generated answer is then processed using the SentenceBert model Reimers & Gurevych (2019) to obtain the answer’s high-dimensional embeddings. To quantify the semantic similarity between the answers, we compute the cosine similarity between every pair of answer embeddings. These similarity scores are then utilized as edge weights in our similarity graph, where each node represents an individual answer, and the edges signify the degree of semantic relation between them.
Model hyper-parameters: To ensure our model can capture complex and abstract features at each layer, our model comprises three Graph Convolutional Network (GCN) layers, with embedding dimensions of 256, 512, and 1024 for the first, second, and third layers, respectively. The initial learning rate was set to . If the validation loss did not show improvement over ten consecutive epochs, the learning rate was reduced by a factor of 0.9. The optimization was performed using the Adam optimizer, configured with hyperparameters and . The batch size was 16.
LLMs: We assess our confidence calibration method on two LLMs with excellent performance: Llama3-8B (Llama3)(Meta, 2024), and Vicuna-7b-v1.5 (Vicuna) (Zheng et al., 2024).
Labeling the data: To obtain the correctness label for CoQA and TriviaQA datasets, we followed previous work (Kuhn et al., 2022) and used the Rougel-L metric for labeling.
Evaluation metrics: The evaluation metrics include Expectation Calibration Error (ECE), Brier Score, and AUROC. Specifically, (1) ECE quantifies the consistency between the prediction error and the uncertainty of the prediction. An ideal calibration curve should exhibit a lower ECE. It measures the consistency between the prediction error and the confidence of the prediction. Specifically, the confidence interval is grouped into fixed bins, and the average of the difference between the confidence and error in each bin is compared. Formally, ECE is calculated as
| (8) |
where is the number of predictions in bin , is the total number of data points and and are the accuracy and confidence of bin b, respectively. (2) Brier Score (Brier, 1950), which is the mean squared difference between predicted probabilities and the actual binary results. Lower Brier Scores indicate better performance. (3) AUROC to indicate the models’ discriminatory ability.
| Method | TriviaQA | CoQA | ||||
|---|---|---|---|---|---|---|
| Brier | AUROC | ECE | Brier | AUROC | ECE | |
| GraphSpectral (GS) | 0.22 | 0.80 | 0.056 | 0.19 | 0.76 | 0.091 |
| GS + Iso | 0.16 | 0.80 | 0.072 | 0.16 | 0.76 | 0.054 |
| GS + Platt | 0.16 | 0.79 | 0.048 | 0.16 | 0.74 | 0.041 |
| Self-check GPT | 0.33 | 0.65 | 0.187 | 0.21 | 0.63 | 0.178 |
| Seq. likelihood | 0.54 | 0.53 | 0.22 | 0.38 | 0.47 | 0.17 |
| Platt | 0.28 | 0.59 | 0.05 | 0.26 | 0.47 | 0.09 |
| Verbalized Qual | 0.32 | 0.62 | 0.14 | 0.30 | 0.68 | 0.16 |
| Verbalized % | 0.25 | 0.67 | 0.033 | 0.42 | 0.66 | 0.21 |
| APRICOT | 0.14 | 0.76 | 0.074 | 0.17 | 0.78 | 0.132 |
| APRICOT + Iso | 0.18 | 0.76 | 0.073 | 0.17 | 0.78 | 0.097 |
| APRICOT + Platt | 0.17 | 0.76 | 0.039 | 0.17 | 0.78 | 0.069 |
| Ours | 0.14 | 0.84 | 0.025 | 0.12 | 0.77 | 0.016 |
| Ours (Multi prompts) | 0.14 | 0.84 | 0.025 | 0.12 | 0.78 | 0.015 |
4.2 Experiment Results
For the Llama3 model, the confidence calibration performance on TriviaQA and CoQA are shown in Table 1. For the TriviaQA dataset, it can be observed that the likelihood-based method performs poorly on the calibration error (ECE and Brier Score) and AUROC due to unreliable model prediction probability (Zhang et al., 2024). Platt scaling improves the ECE post-calibration and enhances the model’s discriminative ability, resulting in higher AUROC results. However, this method cannot capture the semantic equivalence among answers, leading to sub-optimal performance. The Verbalized and Verbalized Qual prompts LLM to output confidence for their answers, improving AUROC by compared with the likelihood baseline. However, it faces the overconfidence issue; thus, the calibration errors are still high. The graphSpectral method can produce good confidence estimations, but its calibration performance is poor. Even with the addition of techniques such as Isotonic Calibration or Platt Scaling, this issue can only be partially mitigated. The auxiliary DeBERTa method combines the LLM outputs, Chain-of-Thoughts (CoT) outputs, and verbalized confidence to fine-tune the DeBERTa model for predicting confidence. Our method captures the prediction confidence based on the graph structure of LLM’s responses in semantic space and achieves better ECE and smECE results. The ECE is reduced from to and improves the AUROC from to compared with the baseline calibration methods. The experiment results on CoQA for the Llama3 model are shown in Table 1. These results show a similar trend, with our model achieving superior performance in confidence calibration compared to the baseline methods.
| Method | TriviaQA | CoQA | ||||
|---|---|---|---|---|---|---|
| Brier | AUROC | ECE | Brier | AUROC | ECE | |
| GraphSpectral (GS) | 0.19 | 0.79 | 0.112 | 0.27 | 0.69 | 0.202 |
| GS + Iso | 0.19 | 0.79 | 0.059 | 0.24 | 069 | 0.037 |
| GS + Platt | 0.17 | 0.79 | 0.067 | 0.22 | 0.69 | 0.055 |
| Self-check GPT | 0.35 | 0.63 | 0.18 | 0.22 | 0.64 | 0.192 |
| Verbalized Qual | 0.38 | 0.62 | 0.02 | 0.45 | 0.48 | 0.00 |
| Verbalized % | 0.39 | 0.52 | 0.38 | 0.49 | 0.53 | 0.32 |
| Seq. likelihood | 0.47 | 0.58 | 0.42 | 0.30 | 0.68 | 0.16 |
| Platt | 0.34 | 0.58 | 0.25 | 0.30 | 0.68 | 0.16 |
| APRICOT | 0.18 | 0.78 | 0.068 | 0.19 | 0.74 | 0.073 |
| APRICOT + Iso | 0.17 | 0.78 | 0.049 | 0.19 | 0.74 | 0.06 |
| APRICOT + Platt | 0.17 | 0.78 | 0.052 | 0.19 | 0.74 | 0.049 |
| Ours | 0.17 | 0.81 | 0.020 | 0.18 | 0.75 | 0.02 |
| Ours (Multi prompts) | 0.16 | 0.81 | 0.018 | 0.16 | 0.75 | 0.016 |
Furthermore, we also compare the confidence calibration performance for the Vicuna model on the TriviaQA and CoQA datasets. The results are summarized in Table 2. Our model consistently improves the calibration error compared to the baseline methods.
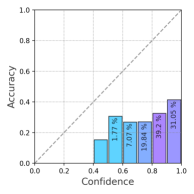
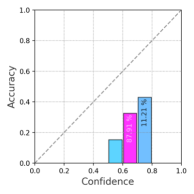
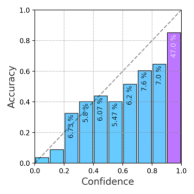
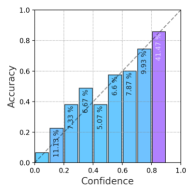
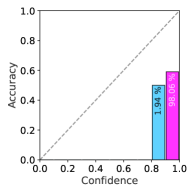
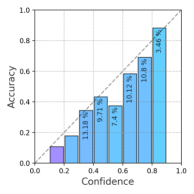
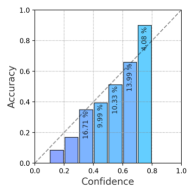
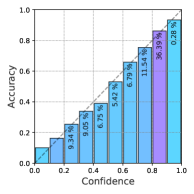
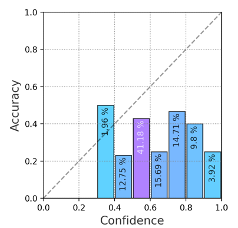
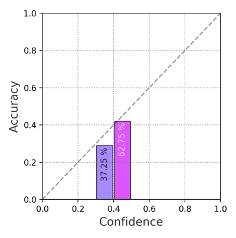
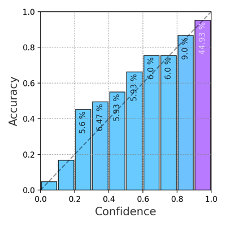
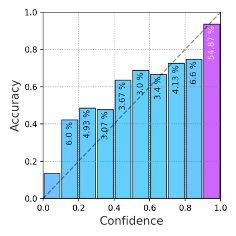
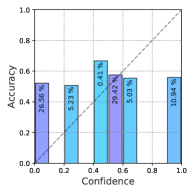
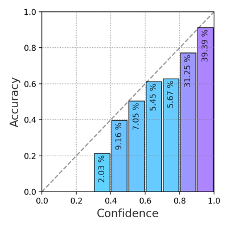
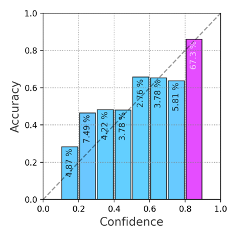
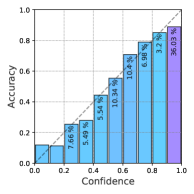
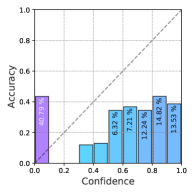
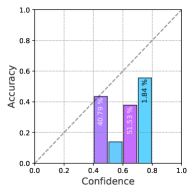
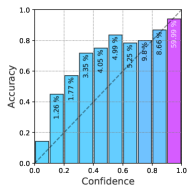
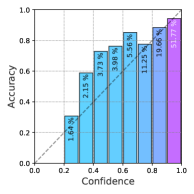
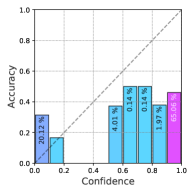
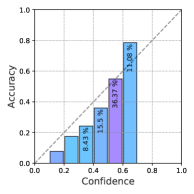
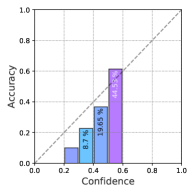
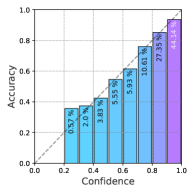
To understand the improvements of our model, we present the reliability diagrams for the baseline methods applied to the Vicuna model on TriviaQA. The reliability diagram is created by discretizing the confidence value into bins and then computing the average accuracy for samples in each bin. The ideal calibration curve should align with the diagonal line, indicating that the confidence value can match the probability of correctness. The reliability diagram is shown in Fig. 2. (We also show other reliability diagrams for the different methods for Llamas on TriviaQA and CoQA in the Appendix A.5). The figure presents the reliability diagrams for different methods, each utilizing 10 bins. In these diagrams, both the color intensity and the percentage numbers within each bar represent the proportion of total responses that fall into each respective bin. Specifically, larger proportions are depicted with colors closer to purple, while the height of each bar indicates the ratio of correct predictions within that bin. An ideal reliability diagram should exhibit a wide distribution of responses across multiple bins, demonstrating the model’s strong ability to differentiate between varying confidence levels in its predictions. Additionally, the heights of the bars should align closely with the diagonal line, which represents perfect calibration—where the predicted confidence matches the empirical accuracy. It can be observed that the likelihood-based confidence methods exhibit significant overconfidence, with curves below the diagonal, indicating many samples have high confidence but low accuracy. This results in poor ECE performance. Although the Platting scaling calibration method enhances the ECE performance, it still has poor AUROC. The Auxiliary DeBERTa (APRICOT) method, which integrates LLM outputs, Chain-of-Thought (CoT) outputs, and verbalized confidence to train an auxiliary DeBERTa model, enhances the AUROC. However, it still experiences some overconfidence issues, potentially caused by the inherent overconfidence in the input verbalized confidence scores. The baseline method’s reliability diagrams revealed that this method frequently assigned high confidence scores to incorrect predictions, deviating markedly from the ideal calibration represented by the diagonal line. For example, the verbalized method’s predictions in the highest confidence bins (80-90%) were significantly below the corresponding empirical accuracy, indicating a tendency to overestimate the certainty of its outputs. In contrast, our framework achieves a broad spread of responses across the bins, showing good differentiation capabilities; at the same time, the bar heights closely follow the diagonal line, indicating better calibration.
4.3 Out of Domain evaluation
Domain shift poses significant challenges for deploying machine learning models in real-world scenarios where data variability is expected. To comprehensively assess the robustness and generalization capabilities of our proposed model compared to baseline methods, we conducted a series of out-of-domain (OOD) evaluations.
Experiment setup: We evaluate the confidence calibration of different approaches under out-of-domain settings. We have two experiment configurations: out-of-domain dataset OODD, and out-of-domain LLMs (OODL). For OODD, we train the confidence calibration model on TriviaQA from Llama3 responses and test it on CoQA Llama3 answers. For OODL, we use the same training data from Llama3 but test the Vicuna model’s responses on the TriviaQA and CoQA datasets. We compare our model with the Apricot and GraphSpectral (with Platt scaling) methods.
Results and Analysis: The OOD experiments results revealed that our model maintained a high level of performance across tested domains Table. 3. Specifically, the model demonstrated consistent calibration, as evidenced by low ECE values and strong discriminative ability, reflected in high AUROC scores on in-domain and OOD datasets. For example, while the model achieved an ECE of 0.025 and an AUROC of 0.84 on TriviaQA (in-domain), it maintained an ECE of 0.077 and an AUROC of 0.77 on CoQA. Furthermore, the Brier scores across domains remained within acceptable ranges, demonstrating reliable probabilistic predictions even when faced with unfamiliar data distributions. The relatively small increase in ECE and a slight decrease in AUROC for OOD datasets suggest that while there is some degradation in performance, the model retains substantial robustness and accuracy. This is primarily because similarity graph patterns are highly invariant to the data distribution. Specifically, our model employs the consistency graph and the clustering feature that does not alter with data distribution shifts, enabling it to maintain stable performance across different datasets. In contrast, Apricot typically relies on specific dataset features, which leads to poor performance in OOD scenarios. Furthermore, calibration methods like the Platt scaling can improve the confidence calibration in-domain, but their calibration effectiveness remains limited under domain shift scenarios. This is because this calibration technique mainly adjusts the output probabilities but does not fundamentally address the biases introduced by feature representation changes across distributions. Table. 3 shows the OOD performance of the baseline methods.
| Dataset | Method | Brier | AUROC | ECE |
|---|---|---|---|---|
| llama3 CoQA | GraphSpectral(w Platt scaling) | 0.17 | 0.72 | 0.095 |
| Apricot | 0.24 | 0.59 | 0.154 | |
| Ours | 0.13 | 0.77 | 0.077 | |
| Vicuna TriviaQA | GraphSpectral(w Platt scaling) | 0.24 | 0.53 | 0.07 |
| Apricot | 0.19 | 0.76 | 0.13 | |
| Ours | 0.17 | 0.81 | 0.07 | |
| Vicuna CoQA | GraphSpectral(w Platt scaling) | 0.35 | 0.55 | 0.26 |
| Apricot | 0.24 | 0.59 | 0.08 | |
| Ours | 0.22 | 0.73 | 0.10 |
4.4 Sensitivity Analysis
In this subsection, we conducted several sensitivity analyses of our model.
Number of training samples We conducted experiments to examine the relationship between performance and the amount of training data. Specifically, we tested our model performance on the Llama3 TriviaQA dataset and varied the training size from 100 to 4000. The results are displayed in Table 4. We observed that the model’s performance does not drop significantly with the reduced training data. These experimental results indicate that the model performs well with limited data availability, demonstrating its applicability in real-world scenarios where only smaller datasets are available. We also tested the baseline performance, the results are shown in Appendix A.5.
| # of Training Samples | ECE | AUROC | Brier |
|---|---|---|---|
| 100 | 0.095 | 0.770 | 0.201 |
| 300 | 0.062 | 0.786 | 0.187 |
| 500 | 0.049 | 0.792 | 0.181 |
| 1000 | 0.037 | 0.799 | 0.177 |
| 4000 | 0.020 | 0.820 | 0.172 |
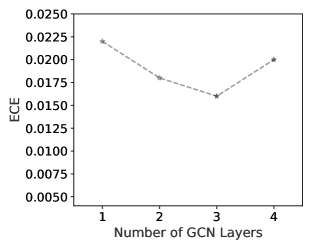
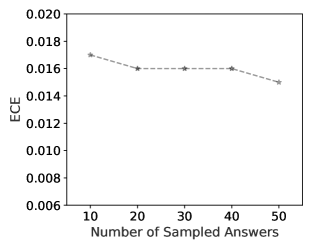
Hyperparameter sensitivity We conduct the sensitivity analysis of our model’s calibration error performance concerning two key configurations: the number of sampled answers used to construct the graph and the number of Graph Convolutional Network (GCN) layers in the GNN model. The results are displayed in Fig. 3. The experiments are conducted using the Llama3 model on the TriviaQA dataset. For Fig. 3 (a) experiments, we varied the number of sampled answers from 10 to 50 while keeping other configurations and hyperparameters fixed, as described in the experimental setup. We observe that increasing the number of sampled answers slightly improves performance, which then stabilizes. In Fig. 3(b), the sensitivity to the number of GCN layers indicates that our model remains stable with 1 to 4 layers, with the best performance observed at three layers.
5 Conclusion and Future Work
In summary, in this work, we proposed one effective strategy of confidence calibration by combining the LLM’s self-consistency with labeled data and training an auxiliary GNN model to estimate the correctness of its responses to questions. Experiments demonstrate that the proposed approach improves confidence calibration significantly across several datasets compared to baseline methods. We acknowledge that one limitation of our approach is the computation time of sampling multiple answers from LLMs. However, this cost can be effectively alleviated by parallel sampling. In the Appendix A.2, we provide the details of the sampling time. In future work, we aim to extend the framework to incorporate the data uncertainty coming from ambiguous questions and also explore the multi-step confidence calibration in the chain-of-thought framework. Our approach relies on a consistency graph to calibrate confidence.
Large Language Models (LLMs) are powerful tools that deliver valuable information across a wide range of applications. However, the misinformation they may generate can lead to significant societal issues. Our calibration model evaluates the accuracy of an LLM’s responses, thereby enhancing their reliability. When integrated into real-world systems, our model would enable LLMs to abstain from answering uncertain queries or allow users to decide the level of trust they place in the responses. We anticipate that our research will positively influence the responsible deployment and use of LLMs in society.
References
- Bakman et al. (2024) Yavuz Faruk Bakman, Duygu Nur Yaldiz, Baturalp Buyukates, Chenyang Tao, Dimitrios Dimitriadis, and Salman Avestimehr. Mars: Meaning-aware response scoring for uncertainty estimation in generative llms. arXiv preprint arXiv:2402.11756, 2024.
- Brier (1950) Glenn W. Brier. Verification of Forecasts Expressed in Terms of Probability. Monthly Weather Review, 78(1):1, January 1950. doi: 10.1175/1520-0493(1950)078¡0001:VOFEIT¿2.0.CO;2.
- Chen & Mueller (2023) Jiuhai Chen and Jonas Mueller. Quantifying uncertainty in answers from any language model and enhancing their trustworthiness, 2023.
- Chen et al. (2024) Lihu Chen, Alexandre Perez-Lebel, Fabian M Suchanek, and Gaël Varoquaux. Reconfidencing llms from the grouping loss perspective. arXiv preprint arXiv:2402.04957, 2024.
- Deng et al. (2024) Zekun Deng, Hao Yang, and Jun Wang. Can ai write classical chinese poetry like humans? an empirical study inspired by turing test, 2024.
- Deroy et al. (2023) Aniket Deroy, Kripabandhu Ghosh, and Saptarshi Ghosh. How ready are pre-trained abstractive models and llms for legal case judgement summarization?, 2023.
- Detommaso et al. (2024) Gianluca Detommaso, Martin Bertran, Riccardo Fogliato, and Aaron Roth. Multicalibration for confidence scoring in llms, 2024.
- Duan et al. (2023) Jinhao Duan, Hao Cheng, Shiqi Wang, Chenan Wang, Alex Zavalny, Renjing Xu, Bhavya Kailkhura, and Kaidi Xu. Shifting attention to relevance: Towards the uncertainty estimation of large language models. arXiv preprint arXiv:2307.01379, 2023.
- Fadeeva et al. (2023) Ekaterina Fadeeva, Roman Vashurin, Akim Tsvigun, Artem Vazhentsev, Sergey Petrakov, Kirill Fedyanin, Daniil Vasilev, Elizaveta Goncharova, Alexander Panchenko, Maxim Panov, et al. Lm-polygraph: Uncertainty estimation for language models. arXiv preprint arXiv:2311.07383, 2023.
- Geng et al. (2023) Jiahui Geng, Fengyu Cai, Yuxia Wang, Heinz Koeppl, Preslav Nakov, and Iryna Gurevych. A survey of language model confidence estimation and calibration. arXiv preprint arXiv:2311.08298, 2023.
- Gómez-Rodríguez & Williams (2023) Carlos Gómez-Rodríguez and Paul Williams. A confederacy of models: a comprehensive evaluation of LLMs on creative writing. In Houda Bouamor, Juan Pino, and Kalika Bali (eds.), Findings of the Association for Computational Linguistics: EMNLP 2023, pp. 14504–14528, Singapore, December 2023. Association for Computational Linguistics. doi: 10.18653/v1/2023.findings-emnlp.966. URL https://aclanthology.org/2023.findings-emnlp.966.
- He et al. (2020) Pengcheng He, Xiaodong Liu, Jianfeng Gao, and Weizhu Chen. Deberta: Decoding-enhanced bert with disentangled attention. arXiv preprint arXiv:2006.03654, 2020.
- He & Jiang (2023) Wenchong He and Jiang. A survey on uncertainty quantification methods for deep learning. arXiv preprint arXiv:2302.13425, 2023.
- Huang et al. (2024) Xinmeng Huang, Shuo Li, Mengxin Yu, Matteo Sesia, Hamed Hassani, Insup Lee, Osbert Bastani, and Edgar Dobriban. Uncertainty in language models: Assessment through rank-calibration. arXiv preprint arXiv:2404.03163, 2024.
- Joshi et al. (2017) Mandar Joshi, Eunsol Choi, Daniel Weld, and Luke Zettlemoyer. TriviaQA: A large scale distantly supervised challenge dataset for reading comprehension. In Regina Barzilay and Min-Yen Kan (eds.), Proceedings of the 55th Annual Meeting of the Association for Computational Linguistics (Volume 1: Long Papers), pp. 1601–1611, Vancouver, Canada, July 2017. Association for Computational Linguistics. doi: 10.18653/v1/P17-1147. URL https://aclanthology.org/P17-1147.
- Kotelanski et al. (2023) Maia Kotelanski, Robert Gallo, Ashwin Nayak, and Thomas Savage. Methods to estimate large language model confidence. arXiv preprint arXiv:2312.03733, 2023.
- Kuhn et al. (2022) Lorenz Kuhn, Yarin Gal, and Sebastian Farquhar. Semantic uncertainty: Linguistic invariances for uncertainty estimation in natural language generation. In The Eleventh International Conference on Learning Representations, 2022.
- Lin & Och (2004) Chin-Yew Lin and Franz Josef Och. Automatic evaluation of machine translation quality using longest common subsequence and skip-bigram statistics. In Proceedings of the 42nd annual meeting of the association for computational linguistics (ACL-04), pp. 605–612, 2004.
- Lin et al. (2022) Stephanie Lin, Jacob Hilton, and Owain Evans. Teaching models to express their uncertainty in words. Transactions on Machine Learning Research, 2022. ISSN 2835-8856. URL https://openreview.net/forum?id=8s8K2UZGTZ.
- Lin et al. (2024) Zhen Lin, Shubhendu Trivedi, and Jimeng Sun. Generating with confidence: Uncertainty quantification for black-box large language models. Transactions on Machine Learning Research, 2024. URL https://openreview.net/forum?id=DWkJCSxKU5.
- Liu et al. (2024) Linyu Liu, Yu Pan, Xiaocheng Li, and Guanting Chen. Uncertainty estimation and quantification for llms: A simple supervised approach. arXiv preprint arXiv:2404.15993, 2024.
- Malinin & Gales (2021) Andrey Malinin and Mark Gales. Uncertainty estimation in autoregressive structured prediction. In International Conference on Learning Representations, 2021.
- Manakul et al. (2023) Potsawee Manakul, Adian Liusie, and Mark Gales. Selfcheckgpt: Zero-resource black-box hallucination detection for generative large language models. In The 2023 Conference on Empirical Methods in Natural Language Processing, 2023.
- Meta (2024) Meta. Meta llama 3. https://github.com/meta-llama/llama3, 2024.
- Mielke et al. (2022) Sabrina J Mielke, Arthur Szlam, Emily Dinan, and Y-Lan Boureau. Reducing conversational agents’ overconfidence through linguistic calibration. Transactions of the Association for Computational Linguistics, 10:857–872, 2022.
- Platt (1999) John C. Platt. Probabilistic outputs for support vector machines and comparisons to regularized likelihood methods. In Advances in Large Margin Classifiers, pp. 61–74. MIT Press, 1999.
- Qin et al. (2023) Yujia Qin, Zihan Cai, Dian Jin, Lan Yan, Shihao Liang, Kunlun Zhu, Yankai Lin, Xu Han, Ning Ding, Huadong Wang, Ruobing Xie, Fanchao Qi, Zhiyuan Liu, Maosong Sun, and Jie Zhou. WebCPM: Interactive web search for Chinese long-form question answering. In Anna Rogers, Jordan Boyd-Graber, and Naoaki Okazaki (eds.), Proceedings of the 61st Annual Meeting of the Association for Computational Linguistics (Volume 1: Long Papers), pp. 8968–8988, Toronto, Canada, July 2023. Association for Computational Linguistics. doi: 10.18653/v1/2023.acl-long.499. URL https://aclanthology.org/2023.acl-long.499.
- Reddy et al. (2019) Siva Reddy, Danqi Chen, and Christopher D. Manning. CoQA: A conversational question answering challenge. Transactions of the Association for Computational Linguistics, 7:249–266, 2019. doi: 10.1162/tacl˙a˙00266. URL https://aclanthology.org/Q19-1016.
- Reimers & Gurevych (2019) Nils Reimers and Iryna Gurevych. Sentence-bert: Sentence embeddings using siamese bert-networks. In Proceedings of the 2019 Conference on Empirical Methods in Natural Language Processing and the 9th International Joint Conference on Natural Language Processing (EMNLP-IJCNLP), pp. 3982–3992, 2019.
- Ren et al. (2022) Jie Ren, Jiaming Luo, Yao Zhao, Kundan Krishna, Mohammad Saleh, Balaji Lakshminarayanan, and Peter J Liu. Out-of-distribution detection and selective generation for conditional language models. In The Eleventh International Conference on Learning Representations, 2022.
- Roit et al. (2023) Paul Roit, Johan Ferret, Lior Shani, Roee Aharoni, Geoffrey Cideron, Robert Dadashi, Matthieu Geist, Sertan Girgin, Leonard Hussenot, Orgad Keller, Nikola Momchev, Sabela Ramos Garea, Piotr Stanczyk, Nino Vieillard, Olivier Bachem, Gal Elidan, Avinatan Hassidim, Olivier Pietquin, and Idan Szpektor. Factually consistent summarization via reinforcement learning with textual entailment feedback. In Anna Rogers, Jordan Boyd-Graber, and Naoaki Okazaki (eds.), Proceedings of the 61st Annual Meeting of the Association for Computational Linguistics (Volume 1: Long Papers), pp. 6252–6272, Toronto, Canada, July 2023. Association for Computational Linguistics. doi: 10.18653/v1/2023.acl-long.344. URL https://aclanthology.org/2023.acl-long.344.
- Shen et al. (2023) Sheng Shen, Le Hou, Yanqi Zhou, Nan Du, Shayne Longpre, Jason Wei, Hyung Won Chung, Barret Zoph, William Fedus, Xinyun Chen, Tu Vu, Yuexin Wu, Wuyang Chen, Albert Webson, Yunxuan Li, Vincent Y. Zhao, Hongkun Yu, Kurt Keutzer, Trevor Darrell, and Denny Zhou. Flan-moe: Scaling instruction-finetuned language models with sparse mixture of experts. CoRR, abs/2305.14705, 2023. doi: 10.48550/ARXIV.2305.14705. URL https://doi.org/10.48550/arXiv.2305.14705.
- Singhal et al. (2023) Karan Singhal, Tao Tu, Juraj Gottweis, Rory Sayres, Ellery Wulczyn, Le Hou, Kevin Clark, Stephen Pfohl, Heather Cole-Lewis, Darlene Neal, Mike Schaekermann, Amy Wang, Mohamed Amin, Sami Lachgar, Philip Mansfield, Sushant Prakash, Bradley Green, Ewa Dominowska, Blaise Aguera y Arcas, Nenad Tomasev, Yun Liu, Renee Wong, Christopher Semturs, S. Sara Mahdavi, Joelle Barral, Dale Webster, Greg S. Corrado, Yossi Matias, Shekoofeh Azizi, Alan Karthikesalingam, and Vivek Natarajan. Towards expert-level medical question answering with large language models, 2023.
- Tam et al. (2023) Derek Tam, Anisha Mascarenhas, Shiyue Zhang, Sarah Kwan, Mohit Bansal, and Colin Raffel. Evaluating the factual consistency of large language models through news summarization. In Anna Rogers, Jordan Boyd-Graber, and Naoaki Okazaki (eds.), Findings of the Association for Computational Linguistics: ACL 2023, pp. 5220–5255, Toronto, Canada, July 2023. Association for Computational Linguistics. doi: 10.18653/v1/2023.findings-acl.322. URL https://aclanthology.org/2023.findings-acl.322.
- Tang et al. (2023) Liyan Tang, Zhaoyi Sun, Betina Idnay, Jordan Nestor, Ali Soroush, Pierre Elias, Ziyang Xu, Ying Ding, Greg Durrett, Justin Rousseau, Chunhua Weng, and Yifan Peng. Evaluating large language models on medical evidence summarization. npj Digital Medicine, 6, 08 2023. doi: 10.1038/s41746-023-00896-7.
- Tian et al. (2023) Katherine Tian, Eric Mitchell, Allan Zhou, Archit Sharma, Rafael Rafailov, Huaxiu Yao, Chelsea Finn, and Christopher D Manning. Just ask for calibration: Strategies for eliciting calibrated confidence scores from language models fine-tuned with human feedback. In The 2023 Conference on Empirical Methods in Natural Language Processing, 2023. URL https://openreview.net/forum?id=g3faCfrwm7.
- Ulmer et al. (2022) Dennis Ulmer, Jes Frellsen, and Christian Hardmeier. Exploring predictive uncertainty and calibration in NLP: A study on the impact of method & data scarcity. In Yoav Goldberg, Zornitsa Kozareva, and Yue Zhang (eds.), Findings of the Association for Computational Linguistics: EMNLP 2022, pp. 2707–2735, Abu Dhabi, United Arab Emirates, December 2022. Association for Computational Linguistics. doi: 10.18653/v1/2022.findings-emnlp.198. URL https://aclanthology.org/2022.findings-emnlp.198.
- Ulmer et al. (2024) Dennis Ulmer, Martin Gubri, Hwaran Lee, Sangdoo Yun, and Seong Joon Oh. Calibrating large language models using their generations only. arXiv preprint arXiv:2403.05973, 2024.
- Van Landeghem et al. (2022) Jordy Van Landeghem, Matthew Blaschko, Bertrand Anckaert, and Marie-Francine Moens. Benchmarking scalable predictive uncertainty in text classification. IEEE Access, 10:43703–43737, 2022. doi: 10.1109/ACCESS.2022.3168734.
- Vazhentsev et al. (2023) Artem Vazhentsev, Gleb Kuzmin, Akim Tsvigun, Alexander Panchenko, Maxim Panov, Mikhail Burtsev, and Artem Shelmanov. Hybrid uncertainty quantification for selective text classification in ambiguous tasks. In Anna Rogers, Jordan Boyd-Graber, and Naoaki Okazaki (eds.), Proceedings of the 61st Annual Meeting of the Association for Computational Linguistics (Volume 1: Long Papers), pp. 11659–11681, Toronto, Canada, July 2023. Association for Computational Linguistics. doi: 10.18653/v1/2023.acl-long.652. URL https://aclanthology.org/2023.acl-long.652.
- Wang et al. (2024) Tiannan Wang, Jiamin Chen, Qingrui Jia, Shuai Wang, Ruoyu Fang, Huilin Wang, Zhaowei Gao, Chunzhao Xie, Chuou Xu, Jihong Dai, Yibin Liu, Jialong Wu, Shengwei Ding, Long Li, Zhiwei Huang, Xinle Deng, Teng Yu, Gangan Ma, Han Xiao, Zixin Chen, Danjun Xiang, Yunxia Wang, Yuanyuan Zhu, Yi Xiao, Jing Wang, Yiru Wang, Siran Ding, Jiayang Huang, Jiayi Xu, Yilihamu Tayier, Zhenyu Hu, Yuan Gao, Chengfeng Zheng, Yueshu Ye, Yihang Li, Lei Wan, Xinyue Jiang, Yujie Wang, Siyu Cheng, Zhule Song, Xiangru Tang, Xiaohua Xu, Ningyu Zhang, Huajun Chen, Yuchen Eleanor Jiang, and Wangchunshu Zhou. Weaver: Foundation models for creative writing, 2024.
- Wei et al. (2022) Jason Wei, Maarten Bosma, Vincent Zhao, Kelvin Guu, Adams Wei Yu, Brian Lester, Nan Du, Andrew M. Dai, and Quoc V Le. Finetuned language models are zero-shot learners. In International Conference on Learning Representations, 2022. URL https://openreview.net/forum?id=gEZrGCozdqR.
- Xiao et al. (2022) Shunxin Xiao, Shiping Wang, Yuanfei Dai, and Wenzhong Guo. Graph neural networks in node classification: survey and evaluation. Machine Vision and Applications, 33(1):4, 2022.
- Xiong et al. (2024) Miao Xiong, Zhiyuan Hu, Xinyang Lu, YIFEI LI, Jie Fu, Junxian He, and Bryan Hooi. Can LLMs express their uncertainty? an empirical evaluation of confidence elicitation in LLMs. In The Twelfth International Conference on Learning Representations, 2024. URL https://openreview.net/forum?id=gjeQKFxFpZ.
- Ye et al. (2024) Fanghua Ye, Mingming Yang, Jianhui Pang, Longyue Wang, Derek F Wong, Emine Yilmaz, Shuming Shi, and Zhaopeng Tu. Benchmarking llms via uncertainty quantification. arXiv preprint arXiv:2401.12794, 2024.
- Zhang et al. (2024) Caiqi Zhang, Fangyu Liu, Marco Basaldella, and Nigel Collier. Luq: Long-text uncertainty quantification for llms. arXiv preprint arXiv:2403.20279, 2024.
- Zheng et al. (2024) Lianmin Zheng, Wei-Lin Chiang, Ying Sheng, Siyuan Zhuang, Zhanghao Wu, Yonghao Zhuang, Zi Lin, Zhuohan Li, Dacheng Li, Eric Xing, et al. Judging llm-as-a-judge with mt-bench and chatbot arena. Advances in Neural Information Processing Systems, 36, 2024.
- Zheng et al. (2023) Shen Zheng, Jie Huang, and Kevin Chen-Chuan Chang. Why does chatgpt fall short in providing truthful answers?, 2023.
Appendix A Appendix
A.1 Hyperparameters and Model configurations
Model hyper-parameters:
Our model used three GCN layers; typically, the embedding dimension was for three GCN layers. For the training process, we used the binary cross-entropy loss with a decaying learning rate that reduced the learning rate by if the validation loss did not improve epochs (with an initial learning rate of and a minimum learning rate of ). The optimizer was Adam with and . The batch size was 32. For the rephrased prompts, we set , , so for each rephrased question, we sampled ten answers. While calculating the ECE, we divide the confidence into bins.
Evaluation Setup:
For each question, we evaluate the confidence prediction corresponding to the most likely answers from the LLM response. The setup is consistent with the baseline methods.
Graph construction:
For each question, we prompt the LLM to give 30 answers, and the temperature for LLM is set to be 0.6. For each answer, the SentenceBert model Reimers & Gurevych (2019) is used to get each answer’s embedding. The cosine similarity between each answer’s embedding is taken as the edge weight of the graph. We apply the K-Means clustering method to cluster similar semantic responses. The maximum cluster number is set as 3.
A.2 Computational cost
We performed all experiments on NVIDIA A100 GPUs with 80GB of memory. Generating 30 responses using the Llama3 and Vicuna models for 6000 questions from CoQA and TriviaQA data required up to 4 hours, with an average of approximately 2 seconds per question. The CoQA dataset demanded more processing time due to the longer contextual information in the input. The time can be shortened by parallel sampling.
A.3 Additional Cases
To better understand our method intuitively, we have collected a few examples to show the difference between our algorithm and APRICOT.
To summarize our observation here:
1. Multiple responses to the same question does reveal the LLM’s confidence in its answers. 2. The LLM’s self-evaluation of confidence is often much higher than it should be – the LLM is overconfident about its responses. 3. The chain-of-thought responses used by ApriCoT add some information to make each answer more complete and reasonable in the spirit of 1, but it mainly adds the information within one response, not as much information as the multiple responses used by ours.
Example 1:
Question: Who plays Captain Jack Sparrow’s father Edward Teague in the Pirates of the Caribbean films?
True answer:: Keith Richards
LLM response: David Schofield
More responses from the LLM: Martin Klebba. Keith Richards, Geoffrey Rush, Martin Klebba. Keith Richards. Martin Klebba. David Schofield. (only list 7 responses here to save space)
GCC-estimated confidence: 0.23
CoT response: David Schofield,
Self-evaluation: (with the further question ”Please provide your confidence in the answer only in percent (0-100 %):”)
ApriCoT-estimated confidence: 0.79
Example 2:
Question: In which film will you find the Rodger Young?
True answer:: Starship Troopers
LLM response: The Bridge on the River Kwai.
More responses from the LLM: The Greatest Story Ever Told. The Best Years of Our Lives. The Bridge on the River Kwai. The Best Years of Our Lives (1946). 1949’s Battleground. The Best Years of Our Lives.
GCC-estimated confidence: 0.22
CoT response: All the President’s Men.
Self-evaluation: 95%
ApriCoT-estimated confidence: 0.81
Example 3:
Question: BS is the international car registration of which country?
True answer:: Bahamas.
LLM response: Germany.
More responses from the LLM: Bahamas. Bahrain. Bangladesh. Bahamas. Belgium. Bahamas. Germany. Bhutan. Belgium.
GCC-estimated confidence: 0.34
CoT response: Belgium
Self-evaluation: 98%
ApriCoT-estimated confidence: 0.61
A.4 Additional Visualizations
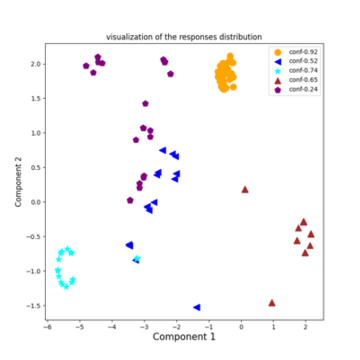
Besides the cases we show in the previous section. Here, we present several case examples and visualize the response patterns. We performed dimension reduction of LLM’s responses to different questions and then plotted their embeddings to the 2-dimensional space. Fig 4 shows the responses generated by Llama3 as an example. From the figure, we observe that answers with higher confidence levels tend to cluster closely together, indicating consistency and reliability in these responses. In contrast, answers with lower confidence levels exhibit greater diversity, reflecting a broader range of possibilities. This behavior aligns well with our initial assumption, demonstrating that higher confidence responses are more consistent, while lower confidence responses capture a wider variety of potential answers.
A.5 Additional results
Additional reliability plots We showed all reliability diagrams for Llama3 for TriviaQA in Fig. 5 and CoQA dataset in Fig. 6. To summarize the trends, we observe that Platt scaling narrows the range to the middle value. Verbalized uncertainty cannot generate a wider range of confidence values. GraphSpecral with Platt tends to generate a wider range of confidence values, but the bias can not be improved across all cases, resulting in the bar height not following the diagonal line closely. Our model can predict a wider range of confidence values and achieve better calibration in all settings, with the auxiliary consistency graph and clustering features contributing to improved calibration overall.
Additional baseline results In Table 5, we showed the performance of the baseline method under varying training sizes. As the number of training data decreases, the ece will drop from 0.096 to 0.165.
| # of Training Samples | ECE | AUROC | Brier |
|---|---|---|---|
| 100 | 0.165 | 0.611 | 0.229 |
| 300 | 0.133 | 0.634 | 0.211 |
| 500 | 0.112 | 0.695 | 0.204 |
| 1000 | 0.105 | 0.722 | 0.192 |
| 4000 | 0.096 | 0.743 | 0.187 |
A.6 Prompting strategy
Here, we showed the prompts we used to generate the rephrasing questions.
You are a helpful assistant. I have a question that I would like to see it rephrased in multiple ways. Please take the original question and generate several rephrased versions while maintaining the same meaning. The question can only have one direct answer. Here is the original question: …. Please provide four distinct rephrases of the question.