On the Instrumental Discrepancies in Lyman-alpha Observations of Solar Flares
Abstract
Despite the energetic significance of Lyman-alpha (Ly; 1216Å) emission from solar flares, regular observations of flare related Ly have been relatively scarce until recently. Advances in instrumental capabilities and a shift in focus over previous Solar Cycles mean it is now routinely possible to take regular co-observations of Ly emission in solar flares. Thus, it is valuable to examine how the instruments selected for flare observations may influence the conclusions drawn from the analysis of their unique measurements. Here, we examine three M-class flares each observed in Ly by GOES-14/EUVS-E, GOES-15/EUVS-E, or GOES-16/EXIS-EUVS-B, and at least one other instrument from PROBA2/LYRA, MAVEN/EUVM, ASO-S/LST-SDI, and SDO/EVE-MEGS-P. For each flare, the relative and excess flux, contrast, total energy, and timings of the Ly emission were compared between instruments. It was found that while the discrepancies in measurements of the relative flux between instruments may be considered minimal, the calculated contrasts, excess fluxes, and energetics may differ significantly - in some cases up to a factor of five. This may have a notable impact on multi-instrument investigations of the variable Ly emission in solar flares and estimates of the contribution of Ly to the radiated energy budget of the chromosphere. The findings presented in this study will act as a guide for the interpretation of observations of flare-related Ly from upcoming instruments during future Solar Cycles and inform conclusions drawn from multi-instrument studies.
1 Introduction
The Lyman-alpha line of neutral hydrogen (Ly; 1216Å) is the most intense emission line in the quiescent solar spectrum (Curdt et al., 2001). In spite of this, observations of flare-related Ly emission have historically been relatively scarce. Among the earliest measurements of flare-related Ly emission were the spectroscopic observations of Skumanich et al. (1978) using the Laboratoire de Physique Stellaire et Planetaire (LPSP; Bonnet et al. 1978) onboard Eighth Orbiting Solar Observatory (OSO-8), and of Canfield and van Hoosier (1980) using the NRL Spectrograph (Bartoe et al., 1977) within the Apollo Telescope Mount onboard Skylab. However, due to the individual instrumental capabilities required to observe such an energetic emission line on flare timescales, it has only been possible in the last decade to conduct statistical studies using calibrated photometric measurements of flare-related Ly.
Milligan et al. (2020) conducted a large-scale statistical study of Ly flares observed by the Geostationary Operational Environmental Satellites (GOES) during Solar Cycle 24. From their analysis of 500 M- and X-class flares, it was found that both the energy and contrast in flare-related Ly emission tend to scale with Soft X-Ray (SXR) magnitude. Furthermore, it was found that 95% of the flares sampled had an associated Ly contrast of 10%. However, unique cases could reach contrasts of up to 30%. Comparatively, observations of flare-related Ly from the Project for On-Board Autonomy (PROBA2; Santandrea et al. 2013) have consistently found contrasts of (Kretzschmar et al. 2013; Raulin et al. 2013). One explanation for these notably low contrasts may be significant detector degradation and the presence of contaminants in the PROBA2 signal. Currently, the extent to which these discrepancies may exist in co-observations between individual instruments is not well documented.
Ly emission is optically thick and therefore observations in Ly are subject to effects of Centre-to-Limb Variation (CLV), whereby the position of a flare on the solar disk (and the subsequent column depth along the observing line of sight) can impact the measured Ly irradiance (for further discussion see Woods et al. 1995, 2006; Milligan 2021). The extent to which CLV may impact Ly observations was examined by Milligan et al. (2020) using combined stereoscopic observations of an X1.1 flare from GOES-15 and the Mars Atmosphere and Volatile Evolution (MAVEN; Eparvier et al. 2015) in orbit around Mars. For MAVEN, the flare was located close to disk-centre, whereas for GOES the flare appeared at the solar limb. Subsequently, a 45% increase in flare-related Ly excess was observed at Mars relative to Earth, thus demonstrating the magnitude of CLV on observations of optically-thick emission.
Temporally, flare-related Ly emission tends to peak in conjunction with nonthermal Hard X-Ray (HXR) emission and therefore the derivative of the SXRs in alignment with the Neupert Effect (Neupert, 1968); examples of the nonthermal origin of Ly emission are demonstrated in Nusinov et al. (2006), da Costa et al. (2009), Milligan et al. (2017), Dominique et al. (2018), Li et al. (2022), Tian et al. (2023), and Greatorex et al. (2023). In some instances, secondary Ly emission peaks occur during the decay-phase, which is speculated to originate from cooling loop plasma rather than the flare footpoint regions (Kretzschmar et al., 2013), or from filament eruptions (Wauters et al., 2022). However, systematic effects have also been shown to account for apparent violations of expected Neupertian behaviour. Milligan and Chamberlin (2016) found flare-related Ly emission observed by the Extreme-ultraviolet Variability Experiment (EVE; Woods et al. 2012) onboard SDO to peak within the gradual phase co-temporally with the associated Soft X-ray (SXR) emission. This was later attributed to issues with the Kalman filters used during data processing (D. Woodraska - Private Communication)
Recent instrumental advancements mean that it is now possible to image solar flares in Ly on sufficient timescales to observe the dynamic spatial development of flare footpoints, loops, and ribbons. Li et al. (2022) studied a C1.4 flare using observations from the Ly channel of High Resolution Imager within the Extreme Ultraviolet Imager onboard Solar Orbiter (SO/EUI-HRILyα; Müller et al. 2020; Rochus et al. 2020111SO was omitted from this study due to difficulty in obtaining sufficient calibration data.). In their study, the authors found a co-spatial relationship between Ly emission and nonthermal HXR sources, similarity in spatiotemporal behaviour between Ly and He ii (304Å) emission observed by the Extreme Ultraviolet Imager (EUVI; Howard et al. 2008) onboard the Solar Terrestrial Relations Observatory Ahead (STEREO-A; Kaiser et al. 2008) and the Atmospheric Imaging Assembly onboard the Solar Dynamics Observatory (SDO/AIA; Pesnell et al. 2012; Boerner et al. 2012), and Ly brightenings in both the rise and decay phase of the flare. Furthermore, the Solar Disk Imager within the Lyman-alpha Solar Telescope onboard the recently launched Advanced Space-based Solar Observatory (ASO-S/SDI-LST; Li et al. 2019; Feng et al. 2019; Gan et al. 2023; Chen et al. 2024) has been used to examine the presence of long-period QPPs in an X6.4 solar flare, co-temporal with the associated HXR emission (Li et al., 2024). Similar behaviour was presented by Milligan et al. (2017) in a multi-instrument study using observations from GOES, SDO, and the Reuven Ramaty High Energy Solar Spectroscopic Imager (RHESSI; Lin et al. 2002).
Multi-instrument observations are crucial for examining fundamental open questions surrounding the origin of flare-related emission, constraining the radiated energy budget of the chromosphere, and the temporal evolution of flare-related emission during different phases of solar flares. Using joint observations from SDO, GOES, PROBA2, and RHESSI, Wauters et al. (2022) examined an M6.7 flare with an additional peak in Ly emission during the decay phase of the flare that had no temporal correlation to the HXR or SXR emission. Using images in 1600Å from SDO/AIA, the source of the emission was later attributed to a failed filament eruption in proximity to the flare origin. Moreover, using combined observations from RHESSI and GOES, both Milligan et al. (2014) and Greatorex et al. (2023) were able to examine the contribution of Ly to the radiated energy budget of the chromosphere during solar flares. These studies found for both an X- and M-class flare, Ly may account for up to 8% of the energy deposited into the chromosphere by nonthermal electrons.
When conducting precise analysis of solar flares, it is currently unclear to what extent the instruments chosen for observations may impact the conclusions drawn from their observations. This fact becomes more pertinent with the consideration of newly-launched and upcoming missions such as ASO-S, GOES-R, and Solar-C (Watanabe, 2014). With the wealth of available data from current missions, it is possible to thoroughly examine Ly emission during solar flares. This paper aims to assess the level of agreement in Ly observations of solar flares between different missions, focussing on observable metrics that may be used to infer the underlying mechanisms driving the emission, such as the relative and excess fluxes, the flare contrasts, energetics, and timings. This analysis should act as a guide for future studies using next generation instruments.
The instruments examined within this study are summarised in Section 2. A discussion of the unique instrumental observing capabilities including the spectral response functions and bandpasses is presented in Section 3. The flare sample used for the individual case studies, as well as the calibration, standardisation, and analysis techniques are presented in Section 4. Section 5 details the results of each case study. Finally, a discussion of the impact of this study and future Ly observation capabilities is presented in Section 6.
2 Instrumentation
This study focuses on the examination of observations of flare-related Ly emission from multiple missions that have served the solar community over Solar Cycle 24 and 25. The following section presents a brief summary of each instrument included in this study and details the individual calibration processes carried out for each instrument where relevant. Table 1 contains a technical summary of each instrument.
2.1 GOES-14/EUVS–E and GOES-15/EUVS–E
GOES-14 and GOES-15 both featured an X-Ray Sensor (XRS; Hanser and Sellers 1996; Chamberlin et al. 2009) and Extreme Ultraviolet Sensor (EUVS; Viereck et al. 2007; Evans et al. 2010), observing disk-integrated SXR and Extreme Ultraviolet (EUV) emission at a near 100% duty cycle. EUVS consisted of five channels (A–E) covering the 50–170Å, 240–340Å, 200–620Å, 200–800Å, and 1180–1250Å wavelength ranges. The E-channel (EUVS–E) was a dedicated broadband channel centred around the Ly line at 1216Å, observing the full solar disk at 10.24s cadence. These GOES satellites operated in a geostationary orbit at an altitude of approximately 36 000 km. Thus, observations from GOES are subject to geocoronal absorption that are more pronounced around the equinoxes. In this instance, EUV emission is absorbed by hydrogen in the geocorona, leading to a reduction in the observed emission. As a result, it is important to consider Ly observations where the effect of the geocorona is minimal and/or can be accounted for. The GOES-14/EUVS-E and GOES-15/EUVS-E observations suffer from degradation over time, which is compensated for by using daily averages from the Solar Stellar Irradiance Comparison Experiment onboard the Solar Radiation and Climate Experiment (SORCE/SOLSTICE; McClintock et al. 2005) to scale the daily averages from GOES. Thus, while the degradation and absolute values are scaled to SORCE/SOLSTICE, the variability is determined by the GOES instrument. For this study, the degradation corrected 1nm band (121-122nm) data were used.
2.2 GOES-16/EXIS–EUVS–B
GOES-16 operates with an incorporated set of SXR and EUV sensors as part of a combined Extreme Ultraviolet and X-ray Irradiance Sensors (EXIS) suite. The EUVS for EXIS is comprised of two channels (A and B) measuring the spectral irradiance of lines within the 250–310Å and 1170–1410Å wavelength ranges, respectively, and a third channel (Channel-C) taking relative measurements of the Mg ii core/wing ratio between 2750–2850Å. The EUVS–B channel is comprised of a photodiode array with diode clusters allocated to cover significant solar emission lines such as C iii (1175Å), H i Ly (1216Å), C ii (1335Å), and S iv/O iv (1405Å), each with an approximate width of 6Å. The final irradiance data from EUVS-B is a summation of the fluxes over the photodiodes for each separate cluster. At the time of writing, these full-disk L2 irradiances from EXIS/EUVS–B are available at 60s cadence, future products following additional processing are expected to have cadences of 1s. Similar to red GOES-14/15, GOES-16 operates in a geostationary orbit with an altitude of approximately 36 000 km (see Eparvier et al. 2009 for a detailed discussion of EUVS for GOES-16). For this study, Version 1.0.5 of the science-quality solar line data from GOES-16/EXIS were used; at the time of writing this is the most up-to-date publicly available version of the GOES-16 data.
Several caveats need to be considered for GOES-16/EXIS-EUVS-B data. Firstly, the presence of multi-hour post-eclipse thermal dips in the spectral lines due to incompletely corrected temperature impacts may affect the EUVS observations, although it is simple to exclude these data as required. The magnitude of this in the Ly line is difficult to quantify due to the additional effect of the geocorona. Furthermore, an annual cycle oscillation artifact with a magnitude of 1.3% of the measured flux impacts the irradiances of the Ly channel of EUVS. It is unclear what impact these may have on the observations presented in this study.
2.3 PROBA2/LYRA
The Large Yield Radiometer (LYRA; Hochedez et al. 2006; Dominique et al. 2013) onboard PROBA2 is a tri-unit broadband radiometer with four distinct channels observing in the SXR to mid-ultraviolet regime. The Ly filters from Units 1 and 2 (MSM Diamond Detector) and Unit 3 (AXUV Si Detector) of LYRA cover the 1200–1230Å wavelength range, taking full-disk irradiance measurements at 0.05s cadence. The nominal unit of LYRA has suffered significant degradation and no longer observes Ly emission, due to changes in the Ly channel bandpass. The degradation of the LYRA instrument has been attributed to the deposition of carbon and silicon on the detectors, creating a contaminant layer that is more opaque to longer wavelengths relative to short resulting in different signal losses depending on wavelength (BenMoussa et al. 2015; Wauters et al. 2022). The data collected during special observing campaigns using the backup unit are still sufficient to observe flare related Ly emission (M. Dominique. 2023 - Private Communication). PROBA2 has a Sun-synchronous orbit at 720 km altitude placing it in Low-Earth Orbit.
2.4 MAVEN/EUVM
The Extreme Ultraviolet Monitor (EUVM) onboard the MAVEN satellite is a Sun-facing instrument consisting of three channels taking disk-integrated broadband irradiances in the SXR and EUV regimes. The Ly channel (Channel C) of EUVM covers the 1170–1250Å wavelength range, measuring irradiance at 1s cadence. Nominal EUVM observations are taken in the operations case with the Sun within science FOV and aperture mechanism “open”, which produces valid solar irradiance measurements. MAVEN operates in a highly elliptical orbit around Mars, with an apoapsis of 6000 km and periapsis of 150 km.
2.5 SDO/EVE-MEGS-P
SDO/EVE features a set of Multiple EUV Grating Spectrographs (MEGS) comprised of three main components. The grazing-incidence spectrograph (MEGS-A) and normal-incidence spectrograph (MEGS-B) sample the 50-370Å and 350-1050Å wavelength range at 1Å resolution, respectively222Due to an instrumentation failure on 26 May 2014, MEGS-A is no longer operational.. The broadband photodiode (MEGS-P) used with the first grating of MEGS-B is centred on the Ly line. SDO operates in a 28∘ inclined geosynchronous orbit at an altitude of 36 000 km. At the time of writing, the degradation of MEGS-B means that MEGS-P operates on a flare trigger system, with a 60s cadence (previously MEGS-P has operated with 10s cadence).
2.6 ASO-S/LST-SDI
The ASO-S mission is the first space-based Chinese mission dedicated to solar observation. The LST is one of the instruments onboard ASO-S. The SDI within LST images the full solar disk at 1216Å with a spatial resolution of and a routine exposure time of 13.5s333This has increased to 16.5s due to degradation of the instrument.. ASO-S operates in a Sun-synchronous orbit with an altitude of 720 km and an inclination of 98∘ relative to Earth’s equator. The nominal cadence for routine SDI observations is between 4–40s; SDI images are also available in 60s intervals due to the “image download interval” set in response to telemetry limitations.
| Mission | Instrument | Orbit | Observation | Cadence | Bandpass | Response Peak |
|---|---|---|---|---|---|---|
| Type | (s)* | FWHM (Å) | (Å) | |||
| GOES-14 | EUVS–E | Geostationary | Photometry | 10.24 | 131.1 | 1214 |
| GOES-15 | EUVS–E | Geostationary | Photometry | 10.24 | 108.7 | 1227** |
| GOES-16 | EXIS–EUVS–B | Geostationary | Photometry | 60.0 | - | - |
| PROBA2 | LYRA | Sun-synchronous | Photometry | 0.05 | 104.5 | 1200 |
| MAVEN | EUVM | Areocentric | Photometry | 1.0 | 64.4 | 1200 |
| SDO | EVE-MEGS-P | Geosynchronous | Photometry | 60.0 | 91.6 | 1205 |
| ASO-S | LST-SDI | Sun-synchronous | Imaging | 60.0 | 92.3 | 1216 |
3 Spectral Response Functions and Bandpasses
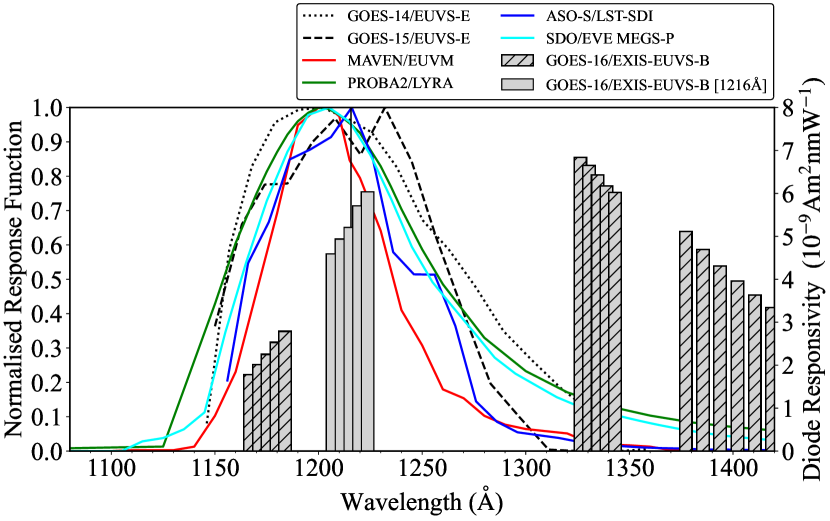
The spectral response of a given instrument quantifies the effectiveness of an instrument in transforming incident flux into a measurable output for a given emission spectrum. Figure 1 shows the normalised spectral response for each broadband instrument described in Section 2. Also presented are the diode responsivities of GOES-16/EXIS–EUVS–B, where each grey bar denotes a unique photodiode. Generally, the normalised spectral responses for the broadband Ly instruments resemble a Gaussian profile with the central peak residing within the 1200-1220Å wavelength range. It appears that several of the spectral responses are centred slightly blueward of the Ly core at 1216Å (denoted by the vertical solid black line in Figure 1). The GOES-15/EUVS–E spectral response appears to be double peaked, with the larger peak appearing around 1245Å and the average of the two peaks being 1227Å. The responsivities for GOES-16/EXIS–EUVS–B show the distinct clusters centred about their unique corresponding emission lines, with cluster B positioned about the Ly core and the responsivity apparently increasing monotonically with wavelength. It should be noted that the responses are normalised for comparison and do not necessarily give an indication of the true instrumental responsivity as they are dimensionless. The true responsivity may change due to degradation over the instrument lifetime. The wavelength at the peak of the spectral response for each instrument is summarised in Table 1.
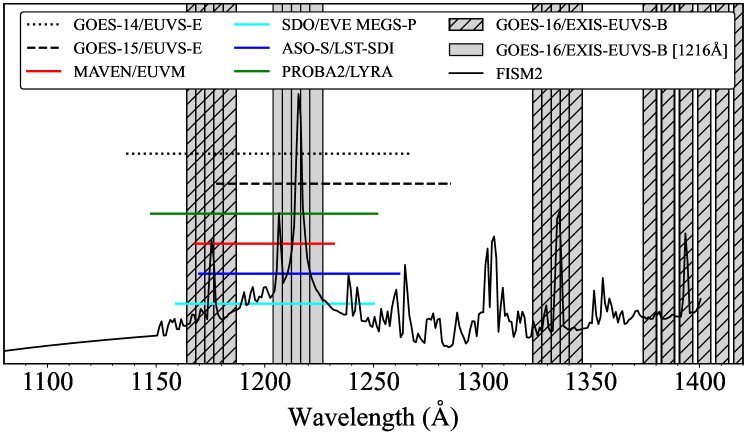
The FWHM of the spectral response function for each instrument is presented as a horizontal line in Figure 2. Also included is a model of a daily averaged quiet-Sun (QS) EUV spectrum from the Flare Irradiance Spectral Model v2 (FISM2; Chamberlin et al. 2020), where the prominent central peak corresponds to the Ly line. The values of the FWHM bandpasses are summarised in Table 1. From Figure 2, GOES-14/EUVS–E has the broadest bandpass and MAVEN/EUVM has the narrowest. In terms of FWHM values, the values between instruments show reasonable similarity. However, the central point of the bandpass appears to demonstrate a non-negligible difference between each instrument.
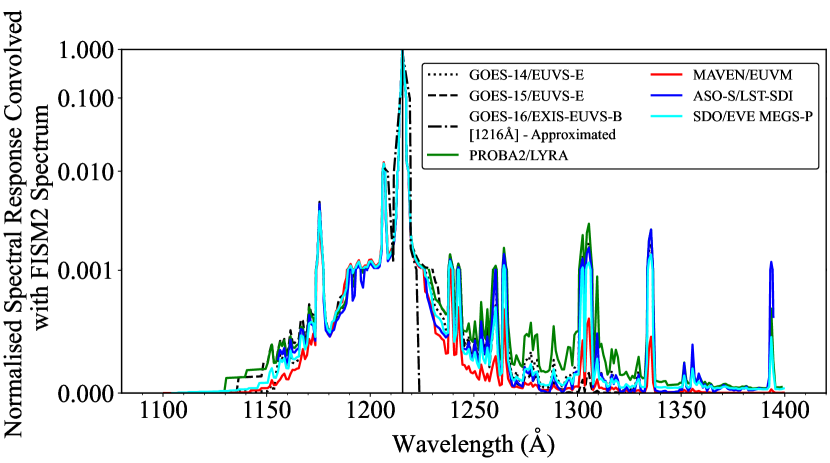
To explore the spectral purity of the observations, the spectral response for each instrument was convolved with a model QS spectra from FISM2 in the 1080–1420Å wavelength range (Figure 3). From this convolution, it is apparent that for all the instruments examined the measured irradiance across the full bandpass is dominated by Ly. From Figure 3 it is apparent that contributions to the irradiance from nearby species such as Si iii (1206Å) and O v (1218Å) are found to be 100–1000 less than that of Ly, thus suggesting it is reasonable to assume that the observed irradiance from each instrument is dominated by Ly (Woods et al. (2012) state the filter purity of MEGS-P to be 99%).
4 Flare Sample and Analysis
In order to make instrumental comparison between flare observations, three case studies were conducted each using a unique combination of instruments. The flare sample used for these studies was selected on the fulfillment of the following criteria:
-
•
Each flare was M-class or above to facilitate sufficient observable Ly flux increases attributed to the flare.
-
•
Each flare was co-observed by the active GOES satellite at the time of the observation and at least one other instrument from Section 2.
-
•
Each flare occurred on-disk from the respective instrument FOV, reducing the impact of Centre-to-Limb Variation.
-
•
The full flare period was observed by each instrument examined in that case study, with a sufficient preflare period to calculate a background flux value.
-
•
Instruments must be operating in standard observation modes to prevent additional impact of increased cadences, additional attenuation from filters, spacecraft maneuvers, and variable pointing (imagers, etc.).
Table 2 presents a summary of three flares that met the above criteria. The flare timings and classes were taken from the 1–8Å SXR observations from the XRS instrument on the relevant GOES satellite.
| Solar | GOES | GOES | GOES | GOES | Heliographic | Observing |
|---|---|---|---|---|---|---|
| Object | Start | Peak | End | Class | Position | Instrument |
| Locator | (UT) | (UT) | (UT) | |||
| SOL2010–02–08 | 13:32 | 13:47 | 13:50 | M2.0 | N28W08 | GOES-14/EUVS–E |
| PROBA2/LYRA | ||||||
| SOL2016–04–18 | 00:14 | 00:29 | 00:39 | M6.7 | N11W60 | GOES-15/EUVS–E |
| MAVEN/EUVM | ||||||
| SOL2023–05–09 | 03:42 | 03:54 | 04:05 | M6.5 | N13W26 | GOES-16/EXIS–EUVS–B |
| ASO-S/LST-SDI | ||||||
| SDO/EVE-MEGS-P |
4.1 Standardisation and Calibration
In order to make a reasonable comparison between instruments, Ly measurements were converted to disk-integrated irradiance at 1AU, in units of . The following sections detail the calibration and standardisation procedures conducted for the relevant instruments.
4.1.1 Scaling Observations to 1AU
As MAVEN is a Mars orbiting mission, a scaling factor is required to convert the Ly observations from Mars to Earth distance. This scaling factor is calculated as , where and are the Mars-Sun and Earth-Sun separation distances at the time of the flare, respectively. A scaling factor of 2.52 was found for MAVEN.
Additionally, a light travel-time correction factor was calculated as:
| (1) |
where c is the speed of light in and the separation distance is given in m. This Earth-Mars travel time could then be subtracted from the observation time to align with observation time taken at 1AU. The calculated value of for MAVEN at the time of the flare was found to be 289s. Similar scaling was performed for Earth-orbiting instruments to ensure all observations were scaled to 1AU.
4.1.2 Radiometric Calibration of Images
Image data require radiometric calibration in order to covert the pixel data in to irradiance in . For ASO-S/LST-SDI, this calibration was carried out using the IDL program lst_radcalib.pro within the LST analysis package available from the Science Operation and Data Centre (SODC). For this calibration, the image data were despiked using “L.A.Cosmic” cosmic ray identification algorithm (van Dokkum et al. 2012), incorporated into the LST software package, and a Radiometric Calibration Factor (RCF) of was applied. The RCF is calculated using the ratio of EUVS Ly daily averages from GOES to LST data and is time-dependent due to degradation of instrument over the mission lifetime. Following this, image data from ASO-S/LST-SDI was converted from spatially-resolved data to 1-dimensional lightcurves via summation of the pixels present in the full-disk image. It was assumed that the flux within the image exposure time may be extrapolated across the total imaging cadence. This may have an impact on the understanding of the temporal behaviour of the flux, although will not impact the magnitude of Ly emission.
4.1.3 Centre-to-Limb Variation Correction
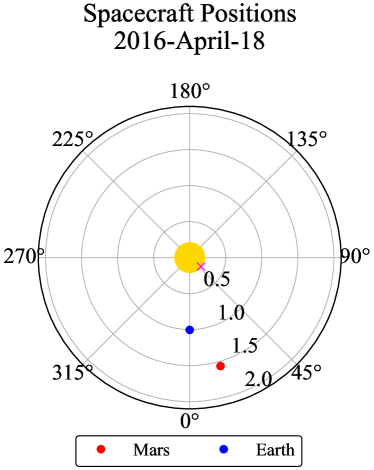
Given the position of SOL2016–04–18 on the solar disk, and the differing vantage points of GOES-15 and MAVEN, a CLV correction factor was required to account for the impact of the relative flare position on the observed Ly emission. Firstly, a translation of the longitudinal flare position was performed from the position on-disk as seen from Earth to the approximate position as seen from Mars. This was carried out under the assumption of an unchanged flare latitude via the following:
| (2) |
where and denote the approximate longitudes as observed from Mars and Earth, respectively, and denotes the angular separation between Earth and Mars at the time of the flare. The position of Mars relative to Earth at the time of SOL2016–04–18 is presented in Figure 4. The value of was found to be 15.8∘. From Equation 2, the angle was calculated as 44∘, thus giving approximate heliographic coordinates of SOL2016–04–18 relative to Mars of N11W44.
Following this, a CLV correction factor (C) was calculated for both vantage points using a cosine-squared method, which is justified by the fall-off of irradiance toward the solar limb as demonstrated by Milligan et al. (2020). The CLV correction factor is calculated as:
| (3) |
where is the heliographic latitude in degrees and is the heliographic longitude in degrees. This yielded CLV correction factors for the MAVEN and GOES-15 observations of 0.8030 and 0.8512, respectively. The measured Ly fluxes from each instrument were then multiplied by their respective correction factors.
4.1.4 Recalibration of PROBA2/LYRA Data
The PROBA2/LYRA observations for SOL2010–02–08 were studied in detail by Kretzschmar et al. (2013). In their study, the authors note that the standard degradation correction may underestimate the flare irradiance increase. Instead they opted to manually calibrate the L1 data, correcting for degradation, dark currents, and spacecraft motion. The Ly observations from PROBA2/LYRA were recalibrated using the methods from Kretzschmar et al. (2013) to reproduce their observations for this study. Dark currents were estimated as a function of temperature and removed from the irradiance. A multiplicative degradation correction was applied by dividing the flux by the estimated (approximately linear) degradation for 08–February–2010. Finally, an orbital correction was applied by constructing an orbital pattern for 08–February–2010 and dividing the flux by this. The observations were also degraded to 3s cadence by summation, thus providing an improved signal-to-noise ratio (SNR).
4.2 Flare Analysis
For each flare, the preflare background was taken as the mean flux over a 10 minute period before the XRS start time. The flare contrast was calculated from the peak flux divided by the background, while the excess flux was taken as the background subtracted irradiance. The energy radiated in Ly was found by converting the background subtracted irradiance from flux measured at Earth () to power radiated at the Sun () by the following:
| (4) |
where is the Sun-Earth distance and all observations were scaled to 1AU. The value is a conversion factor from J to erg. The total energy for each flare was then calculated by integrating the power between the GOES X-ray (XRS 1–8Å) start and end times. The uncertainty in the observed fluxes was taken as the standard deviation of the flux in the preflare background period. Finally, the time of the measured Ly peak for each observation relative to the GOES X-ray peak was calculated as () for each instrument. The uncertainty in peak time was taken as .
5 Results
Each case presented below details flare observations in Ly from two or more instruments, examining the relative flux in Ly, the flare-related contrast, the excess flux, energetics, and timing. A quantitative summary of these observations is presented in Table 3.
5.1 SOL2010–02–08
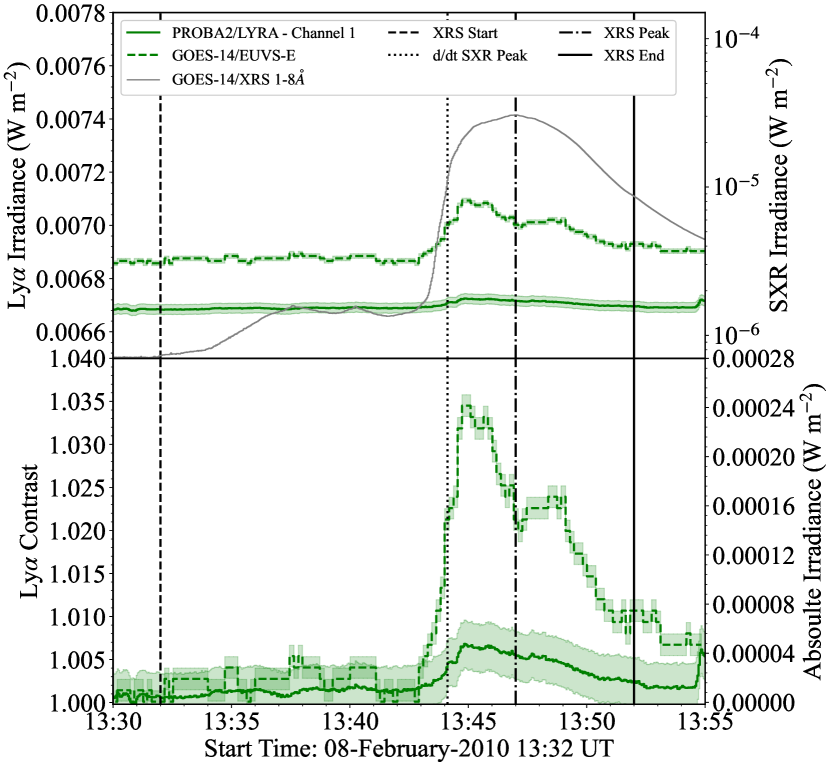
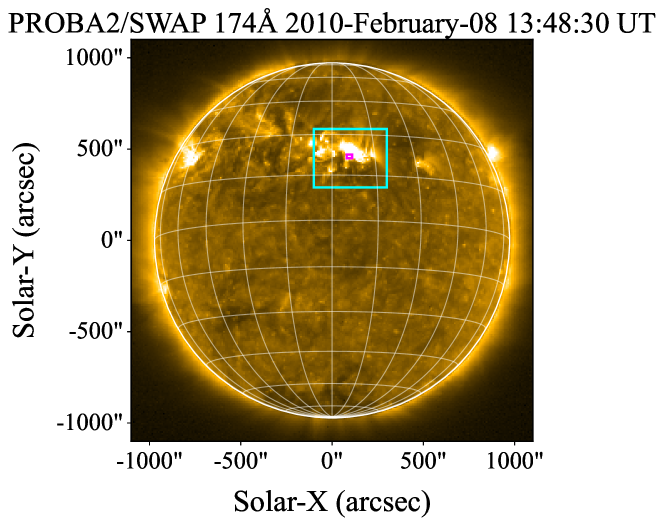
The M2.0 flare that occurred on 08–February–2010 was jointly observed by GOES-14/EUVS-E and PROBA2/LYRA. An image from the Sun Watcher using Active Pixel System detector and Image Processing (SWAP; Berghmans et al. 2006) onboard PROBA2 is presented in Figure 5 and the raw lightcurves from both instruments are presented in top panel of Figure 6, while the contrasts and excess fluxes are shown in the bottom panel. From Figure 6 it is apparent that there is a substantial disagreement between the relative fluxes from GOES-14/EUVS–E and PROBA2/LYRA, with the flare profile from PROBA2/LYRA appearing notably lower in comparison to GOES-14/EUVS–E. The peak value of the relative flux was found to be and for GOES/EUVS–E and PROBA2/LYRA, respectively. The respective peaks in Ly from the two instruments appear to show temporal agreement with each other but not the SXR derivative. Kretzschmar et al. (2013) conducted a detailed analysis of this flare and found similar results in the flux, suggesting this is due to delayed brightening in the EUV wavelengths as the flare plasma cools and is therefore coronal in origin.
From the bottom panel of Figure 6, the peak contrasts in Ly were found to be approximately 3.5% and 0.7% for GOES-14/EUVS–E and PROBA2/LYRA, respectively, demonstrating a factor of five difference in their calculated values. Moreover, the peak value of excess flux was found to vary from and between observations. Converting the excess flux to units of power and integrating over the full flare period, the total energy radiated in Ly as observed by GOES-14/EUVS–E was found to be , three times larger than that found for PROBA2/LYRA, which was calculated as . Such a difference in total energy becomes significant to calculations of the chromospheric energy budget when compared with HXR spectroscopic observations.
One explanation for the significant difference in contrast and flare excess between GOES-14/EUVS-E and PROBA2/LYRA could be contamination of the LYRA bandpass from continuum emission during QS conditions. Specifically the response function of unit 2 of PROBA2/LYRA (used for this study) contains an additional feature at approximately 2000Å, which is beyond the range of Figure 2. The “out-of-band” continuum emission in this range accounts for approximately 70% of the observed QS emission in this unit. Despite this, during flare conditions the enhancements in emission in this spectral range are minimal. Thus, the relative flare signal measured by PROBA2/LYRA in this case can be considered to be dominated by Ly. However, when discussing contrast and flare excess it is likely that the continuum emission in the preflare signal may contribute to a large background flux, which in turn leads to a reduced contrast and flare excess in the overall measurements from PROBA2/LYRA (M. Dominique. 2024 - Private Communication).
5.2 SOL2016–04–18
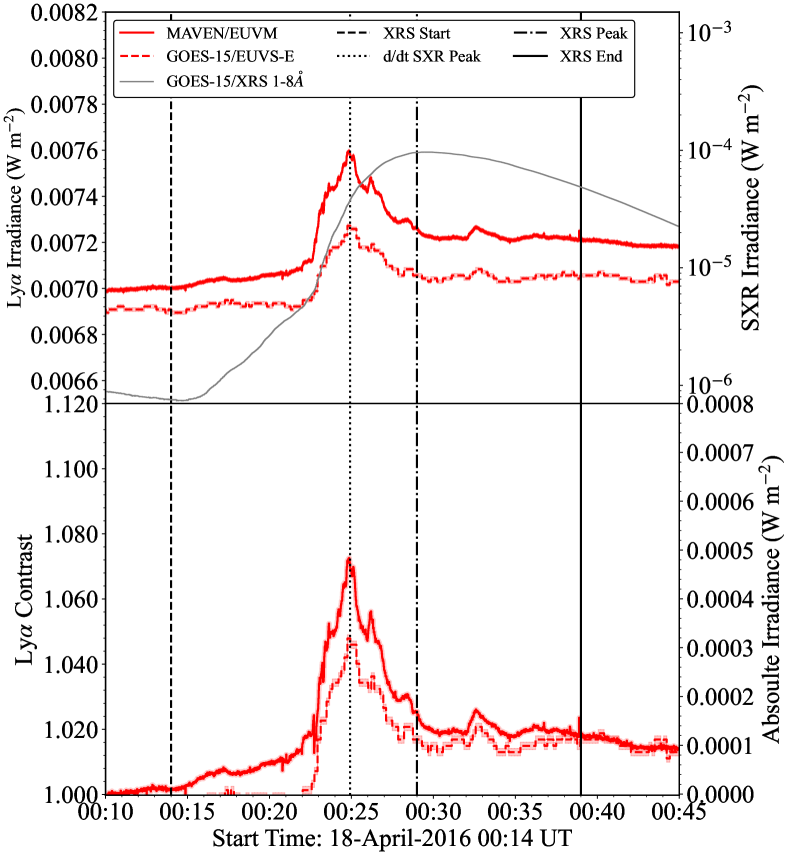
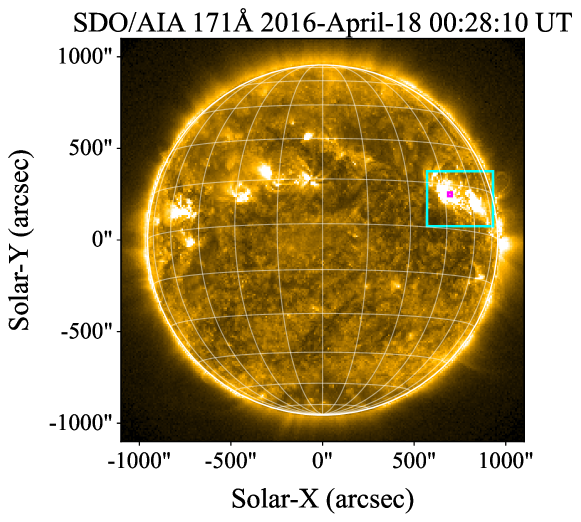
The M6.7 flare on 18–April–2016 was co-observed in Ly from Earth and Mars by GOES-15/EUVS–E and MAVEN/EUVM, respectively. Imaging for this flare from SDO/AIA (171Å) is presented in Figure 7. Lightcurves from both observations (following the standardisation of the MAVEN/EUVM data and CLV correction) are presented in the top panel Figure 8. The peak relative flux was found to be within 4% between GOES-15/EUVS–E and MAVEN/EUVM. The observations show remarkable temporal agreement. Slight differences in their temporal behaviour only occur around short bursts, which are captured by MAVEN/EUVM but not GOES-15/EUVS–E due to the factor of 10 difference in their cadences. The contrasts and excess fluxes calculated from each observation are presented in the bottom panel of Figure 8. The peak contrasts for GOES-15/EUVS–E and MAVEN/EUVM were found to be 4.2% and 7.4%, respectively. The peak values of the excess flux were found to be within a factor of 1.5, with corresponding total energies of and . Thus, the energy found using MAVEN/EUVM is almost a factor of two larger than that of GOES-15/EUVS–E.
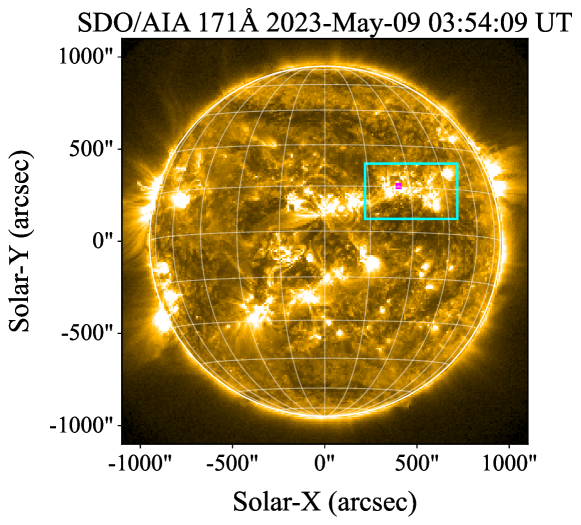
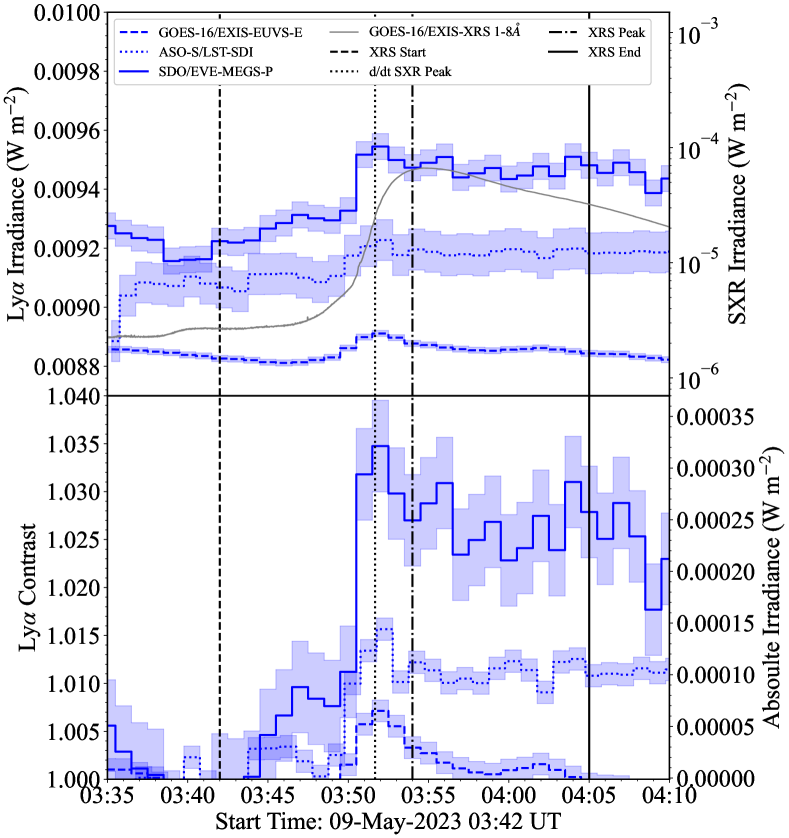
5.3 SOL2023–05–09
The M6.5 flare on 09–May–2023 was observed photometrically in Ly by both GOES-16/EXIS–EUVS–B and SDO/EVE-MEGS-P, as well as imaged by ASO-S/LST-SDI. A context image from SDO/AIA (171Å) is presented in Figure 9. Following the radiometric calibration of the ASO-S/LST-SDI data detailed in Section 4.1.2, comparison was made with the photometric observations. The top panel of Figure 10 presents the relative flux from each instrument. It is apparent that peak relative fluxes for the three observing instruments differ by approximately 6%. The larger flux found SDO/EVE-MEGS-P may be attributed to broadening of the instrument bandpass over time, which is not necessarily measurable (Woodraska. 2023 - Private Communication).
Despite the similarity in flare profiles, the contrasts were found to range from 0.7% to 3.5%. This suggests that despite the similarity in the measured Ly peak, the sensitivity to the QS flux levels may drive discrepancies in the background values with which the contrasts are calculated. Similarly, the peak excess fluxes differed by up to between all observations, translating to a maximum discrepancy in total energy of .
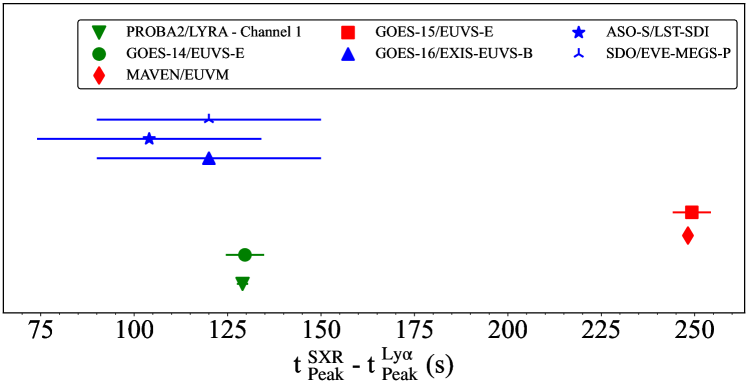
5.4 Timings
For each flare, the time difference between the GOES SXR peak in the 1–8Å band and the observed Ly peak from each instrument was calculated in order to identify any lag or lead times. Figure 11 presents the absolute value of () for each instrument. The uncertainty is taken as , given by the horizontal error bars. For SOL2010–02–08 there is a disparity of 0.6s between the values calculated for PROBA2/LYRA and GOES-14/EUVS–E. There is a remarkable agreement between the values calculated for GOES-15/EUVS–E and MAVEN/EUVM for SOL2016–04–18 with a discrepancy of 0.3s. For SOL2023–05–09, there is a broad agreement in between GOES-16/EXIS–EUVS–B and SDO/EVE-MEGS-P, although the uncertainty of these values is particularly large due to the relatively low (60s) cadence between measurements. There is a time difference of 16s in between these two instruments and ASO-S/LST-SDI. However, the values for this flare all lie withing the associated uncertainties of one another. Generally, the peak times between instruments are in relatively good agreement with each other given the associated uncertainties in the recorded times.
| Flare | Observing | Peak FluxRel | Peak | Peak FluxExc | Total Energy | |
|---|---|---|---|---|---|---|
| Identifier | Instrument | () | Contrast (%) | () | () | (s) |
| SOL2010–02–08 | GOES-14/EUVS–E | 7.1 0.009 | 3.5 0.1 | 2.4 0.09 | 1.3 0.001 | 129.65.12 |
| PROBA2/LYRA | 6.7 0.01 | 0.7 0.2 | 0.5 0.1 | 0.4 0.00007 | 129.01.5 | |
| SOL2016–04–18 | GOES-15/EUVS–E | 7.3 0.008 | 4.4 0.1 | 3.2 0.08 | 3.0 0.001 | 249.25.12 |
| MAVEN/EUVM | 7.6 0.007 | 7.4 0.1 | 5.0 0.007 | 5.5 0.0001 | 248.10.5 | |
| SOL2023–05–09 | GOES-16/EXIS–EUVS–B | 8.9 0.01 | 0.7 0.1 | 0.7 0.01 | 0.3 0.009 | 120.030.0 |
| SDO/EVE-MEGS-P | 9.5 0.04 | 3.5 0.5 | 3.2 0.04 | 4.3 0.04 | 120.030.0 | |
| ASO-S/LST-SDI | 9.2 0.01 | 1.6 0.1 | 1.4 0.01 | 2.0 0.009 | 104.030.0 |
6 Discussion and Future Missions
In this work, we present an inter-instrument comparison of flare-related Ly observations for three M-class flares, focussing on the relative and excess flux, the calculated flare contrast, and the total radiated energy. From this we find measurement inconsistencies to exist to a varying degree across seven different Ly instruments. The key findings are as follows:
-
•
Relative fluxes between instruments for all three flares examined here are in sufficient agreement, such that the conclusions drawn from their analysis will be negligibly impacted by the choice of instrument.
-
•
Discrepancies in the contrasts and excess fluxes are of sufficient degree to have a substantial effect on the conclusions drawn from multi-instrument Ly studies.
-
•
The calculated energies between instruments are sufficiently different to potentially have a significant impact on constraining the contribution of Ly to the radiated energy budget of solar flares.
-
•
The flare timings between instruments are in relatively good agreement considering the uncertainties and therefore are minimally impacted by the choice of observing instrument.
Milligan et al. (2020) demonstrated that 95 % of M- and X-class flares observed by GOES-15/EUVS–E have an associated Ly contrast of 10%, with an upper limit to the contrast of 30 %, while Raulin et al. (2013) found Ly contrasts measured by PROBA2/LYRA to be consistently 1%. The flares examined here were found to have contrasts ranging from 0.3% up to 7.4%, but importantly it has been demonstrated here that these ranges may be influenced by the observing instrument. The findings presented here show that the contrast range may vary by up to 3.5% depending on the observing instrument. This discrepancy is over half of the range of contrast variability found in Greatorex et al. (2023). Moreover, it has been shown that the calculated values of excess flux can vary by up to a factor of five between instruments. This implies that analyses of solar flare excess in Ly may be significantly impacted by the choice of observing instrument, thus influencing the conclusions drawn from flare observations and further calculations of the flare energy carried out using these fluxes. On the contrary, the values of relative flux were found to be in sufficient agreement such that any analysis done with these fluxes would be minimally impacted by the discrepancies between observations from different instruments.
Calculations of the radiated energy in Ly are also vital for estimating the contribution of this wavelength (and therefore others) to the radiated energy budget of the chromosphere. Relatively few studies have compared the radiated energy in Ly to the incident nonthermal electron energy deposited into the chromosphere during flares. From those studies, Ly has been found to radiate up to 8% of the chromospheric energy (Milligan et al. 2014). Here it has been demonstrated that calculations of the radiated energy in Ly may vary by up to an order of magnitude between observations from different instruments. This has significant implication for statistical studies attempting to quantify the radiated energy in Ly over a large flare sample, particularly when using multiple instruments as part of those observations. In this work, it has not been possible to compute the nonthermal electron energies for each flare due to a lack of uniform HXR observations from a single observing instrument. Introducing variation in HXR observations will add unnecessary excess uncertainty in calculated energies that may distract from the discrepancies in the Ly observations. Under the assumption of a single nonthermal energy for each flare, the discrepancies in the calculated Ly energy could substantially alter estimates of the percentage contribution of Ly emission to the radiated energy budget of the chromosphere.
Data driven models such as FISM2 depend on observations to form statistics, from which approximations can be made for emission spectra from solar flares. These models have application in the study of atmospheric responses to solar flares (Qian et al. 2010, 2011, 2012; Lollo et al. 2012), as well as in the development of models designed to aid in the analysis of observations from missions such as MAVEN (Thiemann et al. 2017; Chaffin et al. 2015; Chaufray et al. 2015; Jain et al. 2015; Sakai et al. 2016). The interpretation of the results from studies employing these models is thus reliant on the precision and credibility of the underlying observations.
Significant disagreement in the observed Ly peak times between GOES/EUVS–E and SDO/EVE-MEGS-P were presented by Milligan and Chamberlin (2016). They found a delay in peak times between instruments of 5–10 minutes, which was eventually attributed to the Kalman filter used to smooth data in SDO/EVE processing; this filter was subsequently replaced with a Fourier transform filter, which ultimately prevented the recurrence of this issue. The time discrepancies presented in this work are not as substantial as those presented in Milligan and Chamberlin (2016); the differences in peak times between instruments could be attributed to the variability in cadences, or in the case of imagers, the assumptions of constant flux between exposure, which may be an oversimplification of the true behaviour of the Ly flux. While temporal discrepancies between observations may not have a substantial impact on calculations flare energetics, they may affect the understanding of energy transport processes in flares as well as the derived relationships between solar flares and associated atmospheric responses in the unique sub-regions of the ionosphere (Berdermann et al. 2018; Raulin et al. 2013; Hayes et al. 2021; Milligan et al. 2020; Chakraborty et al. 2021; Barta et al. 2022).
The convolution of the FISM2 spectra in Section 3 demonstrates that there is minimal contribution to the total measured Ly irradiance from additional species in the bandpass of each instrument. Minor variations between instruments are present in the wings of the Ly profile as well as in the blueward and redward wavelengths surrounding the Ly line. However, the core emission significantly dominates the measured flux in all cases by at least two orders of magnitude, therefore the total measured irradiance may be considered to be predominantly from the Ly line.
Given the standardisation of the observations carried out in this work, it is implicit that the observed discrepancies found between instruments are unlikely to be attributable to the observation field of view or observing techniques of the instruments. Instead, the discrepancies in the measured flux between instruments may be driven by inherent properties of the instrument itself or the calibration process carried out on the raw data. Absorption from the goecorona may be able to account for differences in observed flux between instruments at different orbital heights. Specifically, satellites in Low-Earth Orbit may measure lower levels of Ly irradiance compared to those with more extended orbits due to the absorption of Ly photons by Hydrogen in the Earth’s geocorona. Wauters et al. (2022) suggested that geocornal absorption may be a potential explanation for a factor of 20 difference between GOES-15/EUVS-E and PROBA2/LYRA observations of a solar flare in Ly. Additionally, the spectral assumptions used to scale observations for each instrument may influence the returned flare profiles. For example, GOES-15/EUVS-E data are scaled to the Whole Heliosphere Interval QS reference spectrum and thus systematic uncertainties may be present in the observed flare data (Woods et al. 2009; Milligan 2021).
Ultimately, it is important to acknowledge any discrepancy in observations between instruments, particularly when conducting multi-instrument studies, which are becoming evermore possible with the expanding availability of flare-related Ly observations. Previously, GOES observations in the SXRs have been considered the “industry standard” for flare classifications and timings. It may be of value to establish some form of agreeable standard of observation to scale measurements from dedicated Ly missions to. Analysis of results from upcoming missions with Ly observing capabilities such as Solar-C featuring the Solar Spectral Irradiance Monitor (SoSpIM; Harra et al. 2022), and the The Solar eruptioN Integral Field Spectrograph (SNIFS; Chamberlin et al. 2020) sounding rocket will benefit from recognition of the diversity of conclusions that may be drawn from Ly observations depending on the observing instrument. The findings presented here may guide interpretation of the observations taken by the current and new generation of Ly instruments as part of future studies.
7 Acknowledgements
H.J.G would like to thank the UK’s Science & Technology Facilities Council (ST/W507751/1) for supporting this research. R.O.M would like to thank the UK’s Science & Technologies Facilities Council for the award of an Ernest Rutherford Fellowship (ST/N004981/2). They also thank M. Mathioudakis (QUB) for stimulating discussions on this work. H.J.G would also like to thank the attendees of the 2024 SoSpIM meeting for their feedback on the results presented in this work. The authors would like to thank Y. Li (PMO) and the LST Team for their invaluable assistance with the ASO-S data used for this study. The authors would also like to thank J. Machol (CU-CIRES & NOAA-NCEI) for their useful comments on the discussion of the GOES mission. They also thank M. Dominique (ROB) for their invaluable assistance with the PROBA2 data used in this study. Furthermore, they thank P. Chamberlin, T. Woods, and D. Woodraska (CU-LASP) for their help and advice with both the MAVEN and SDO data incorporated into this work. The ASO-S mission is supported by the Strategic Priority Research Program on Space Science, the Chinese Academy of Sciences (CAS). LYRA is a project of the Centre Spatial de Liege, the Physikalisch-Meteorologisches Observatorium Davos and the Royal Observatory of Belgium funded by the Belgian Federal Science Policy Office (BELSPO) and by the Swiss Bundesamt für Bildung und Wissenschaft. Finally, the authors would like to thank the referee of this article for their useful comments, which have greatly contributed to the overall improvement of this work.
8 Data Availability
No new data was generated as part of this study. Observation and responsivity data are available for GOES-16 from \urlhttps://www.ncei.noaa.gov/products/goes-r-extreme-ultraviolet-xray-irradiance and for GOES-14 and-15 from \urlhttps://www.ncei.noaa.gov/products/goes-1-15/space-weather-instruments. PROBA2 data is available from the LYRA data centre, or directly here: \urlhttps://proba2.sidc.be/data/LYRA. The response function data for LYRA was privately communicated to the authors by M. Dominique and is presented in Dominique et al. (2013). MAVEN/EUVM data can be accessed through the Planetary Data System, or directly here: \urlhttps://pds-ppi.igpp.ucla.edu/mission/MAVEN/Extreme_Ultraviolet_Monitor. SDO/EVE data may be accessed via the CU/LASP EVE data site or directly here: \urlhttps://lasp.colorado.edu/eve/data_access/index.html, the response function for MEGS-P was privately communicated by T. Woods. ASO-S/LST-SDI data is available from the SODC via \urlhttp://aso-s.pmo.ac.cn/sodc/dataArchive.jsp. ASO-S analysis software may be accessed via \urlhttp://aso-s.pmo.ac.cn/sodc/analysisSoftware.jsp. The response function of ASO-S/LST-SDI was privately communicated to the authors by Y. Li and is presented in Chen et al. (2024). The FISM2 data are publicly available on the LISIRD data site on the FISM page, or directly here: \urlhttp://lasp.colorado.edu/lisird/. All observation data in this study may be analysed using SolarSoftware (SSWIDL; \urlhttps://www.lmsal.com/solarsoft/) or SunPy (\urlhttps://sunpy.org/; The SunPy Community et al. 2020).
References
- Barta et al. [2022] Veronika Barta, Randa Natras, Vladimir Srećković, David Koronczay, Michael Schmidt, and Desanka Šulic. Multi-instrumental investigation of the solar flares impact on the ionosphere on 05–06 december 2006. Frontiers in Environmental Science, 10, 2022. ISSN 2296-665X. doi: 10.3389/fenvs.2022.904335. URL \urlhttps://www.frontiersin.org/articles/10.3389/fenvs.2022.904335.
- Bartoe et al. [1977] J. D. F. Bartoe, G. E. Brueckner, J. D. Purcell, and R. Tousey. Extreme ultraviolet spectrograph ATM experiment S082B. American Journal, 16:879–886, April 1977. doi: 10.1364/AO.16.000879.
- BenMoussa et al. [2015] A. BenMoussa, B. Giordanengo, S. Gissot, I. E. Dammasch, M. Dominique, J. F. Hochedez, A. Soltani, N. Bourzgui, T. Saito, U. Schühle, A. Gottwald, U. Kroth, and A. R. Jones. Degradation assessment of LYRA after 5 years on orbit - Technology Demonstration -. Experimental Astronomy, 39(1):29–43, March 2015. doi: 10.1007/s10686-014-9437-7.
- Berdermann et al. [2018] J. Berdermann, M. Kriegel, D. Banyś, F. Heymann, M. M. Hoque, V. Wilken, C. Borries, A. Heßelbarth, and N. Jakowski. Ionospheric response to the x9.3 flare on 6 september 2017 and its implication for navigation services over europe. Space Weather, 16(10):1604–1615, 2018. doi: https://doi.org/10.1029/2018SW001933. URL \urlhttps://agupubs.onlinelibrary.wiley.com/doi/abs/10.1029/2018SW001933.
- Berghmans et al. [2006] D. Berghmans, J. F. Hochedez, J. M. Defise, J. H. Lecat, B. Nicula, V. Slemzin, G. Lawrence, A. C. Katsyiannis, R. van der Linden, A. Zhukov, F. Clette, P. Rochus, E. Mazy, T. Thibert, P. Nicolosi, M. G. Pelizzo, and U. Schühle. SWAP onboard PROBA 2, a new EUV imager for solar monitoring. Advances in Space Research, 38(8):1807–1811, January 2006. doi: 10.1016/j.asr.2005.03.070.
- Boerner et al. [2012] Paul Boerner, Christopher Edwards, James Lemen, Adam Rausch, Carolus Schrijver, Richard Shine, Lawrence Shing, Robert Stern, Theodore Tarbell, Alan Title, C Jacob Wolfson, Regina Soufli, Eberhard Spiller, Eric Gullikson, David McKenzie, David Windt, Leon Golub, William Podgorski, Paola Testa, and Mark Weber. Initial calibration of the atmospheric imaging assembly (AIA) on the solar dynamics observatory (SDO). Solar Physics, 275(1):41–66, January 2012.
- Bonnet et al. [1978] R. M. Bonnet, P. Lemaire, J. C. Vial, G. Artzner, P. Gouttebroze, A. Jouchoux, J. W. Leibacher, A. Skumanich, and A. Vidal-Madjar. The LPSP instrument on OSO 8. II. In-flight performance and preliminary results. Astrophys. J., 221:1032–1053, May 1978. doi: 10.1086/156109.
- Canfield and van Hoosier [1980] R. C. Canfield and M. E. van Hoosier. Observed L profiles for two solar flares: 1412 UT 15 June, 1973 and 2316 UT 21 January, 1974. Sol. Phys., 67(2):339–350, August 1980. doi: 10.1007/BF00149811.
- Chaffin et al. [2015] M. S. Chaffin, J. Y. Chaufray, J. Deighan, N. M. Schneider, W. E. McClintock, A. I. F. Stewart, E. Thiemann, J. T. Clarke, G. M. Holsclaw, S. K. Jain, M. M. J. Crismani, A. Stiepen, F. Montmessin, F. G. Eparvier, P. C. Chamberlain, and B. M. Jakosky. Three-dimensional structure in the Mars H corona revealed by IUVS on MAVEN. Geophys. Res. Lett., 42(21):9001–9008, November 2015. doi: 10.1002/2015GL065287.
- Chakraborty et al. [2021] S. Chakraborty, J. M. Ruohoniemi, J. B. H. Baker, R. A. D. Fiori, S. M. Bailey, and K. A. Zawdie. Ionospheric sluggishness: A characteristic time-lag of the ionospheric response to solar flares. Journal of Geophysical Research: Space Physics, 126(4):e2020JA028813, 2021. doi: https://doi.org/10.1029/2020JA028813. URL \urlhttps://agupubs.onlinelibrary.wiley.com/doi/abs/10.1029/2020JA028813. e2020JA028813 2020JA028813.
- Chamberlin et al. [2020] P. C. Chamberlin, F. G. Eparvier, V. Knoer, H. Leise, A. Pankratz, M. Snow, B. Templeman, E. M. B. Thiemann, D. L. Woodraska, and T. N. Woods. The flare irradiance spectral model-version 2 (fism2). Space Weather, 18(12):e2020SW002588, 2020. doi: https://doi.org/10.1029/2020SW002588. URL \urlhttps://agupubs.onlinelibrary.wiley.com/doi/abs/10.1029/2020SW002588. e2020SW002588 10.1029/2020SW002588.
- Chamberlin et al. [2020] P. C. Chamberlin, D. J. Schmit, A. N. Daw, V. Polito, Q. Gong, and R. O. Milligan. The Solar eruptioN Integral Field Spectrograph (SNIFS) Sounding Rocket. In AGU Fall Meeting Abstracts, volume 2020, pages SH056–03, December 2020.
- Chamberlin et al. [2009] Phillip C. Chamberlin, Thomas N. Woods, Francis G. Eparvier, and Andrew R. Jones. Next generation x-ray sensor (XRS) for the NOAA GOES-R satellite series. In Silvano Fineschi and Judy A. Fennelly, editors, Solar Physics and Space Weather Instrumentation III, volume 7438 of Society of Photo-Optical Instrumentation Engineers (SPIE) Conference Series, page 743802, August 2009. doi: 10.1117/12.826807.
- Chaufray et al. [2015] J. Y. Chaufray, J. Deighan, M. S. Chaffin, N. M. Schneider, W. E. McClintock, A. I. F. Stewart, S. K. Jain, M. Crismani, A. Stiepen, G. M. Holsclaw, J. T. Clarke, F. Montmessin, F. G. Eparvier, E. M. B. Thiemann, P. C. Chamberlin, and B. M. Jakosky. Study of the Martian cold oxygen corona from the O I 130.4 nm by IUVS/MAVEN. Geophys. Res. Lett., 42(21):9031–9039, November 2015. doi: 10.1002/2015GL065341.
- Chen et al. [2024] Bo Chen, Li Feng, Guang Zhang, Hui Li, Lingping He, Kefei Song, Quanfeng Guo, Ying Li, Yu Huang, Jingwei Li, Jie Zhao, Jianchao Xue, Gen Li, Guanglu Shi, Dechao Song, Lei Lu, Beili Ying, Haifeng Wang, Shuang Dai, Xiaodong Wang, Shilei Mao, Peng Wang, Kun Wu, Shuai Ren, Liang Sun, Xianwei Yang, Mingyi Xia, Xiaoxue Zhang, Peng Zhou, Chen Tao, Yang Liu, Sibo Yu, Xinkai Li, Shuting Li, Ping Zhang, Qiao Li, Zhengyuan Tian, Yue Zhou, Jun Tian, Jiahui Shan, Xiaofeng Liu, Zhichen Jing, and Weiqun Gan. Inflight Performance and Calibrations of the Lyman-alpha Solar Telescope on board the Advanced Space-based Solar Observatory. arXiv e-prints, art. arXiv:2408.01937, August 2024. doi: 10.48550/arXiv.2408.01937.
- Curdt et al. [2001] W. Curdt, P. Brekke, U. Feldman, K. Wilhelm, B. N. Dwivedi, U. Schühle, and P. Lemaire. The SUMER spectral atlas of solar-disk features. Astron. Astrophys., 375:591–613, August 2001. doi: 10.1051/0004-6361:20010364.
- da Costa et al. [2009] F. Rubio da Costa, L. Fletcher, N. Labrosse, and F. Zuccarello. Observations of a solar flare and filament eruption in lyman and x-rays. A&A, 507(2):1005–1014, 2009. doi: 10.1051/0004-6361/200912651. URL \urlhttps://doi.org/10.1051/0004-6361/200912651.
- Dominique et al. [2013] M. Dominique, J. F. Hochedez, W. Schmutz, I. E. Dammasch, A. I. Shapiro, M. Kretzschmar, A. N. Zhukov, D. Gillotay, Y. Stockman, and A. BenMoussa. The LYRA Instrument Onboard PROBA2: Description and In-Flight Performance. Sol. Phys., 286(1):21–42, August 2013. doi: 10.1007/s11207-013-0252-5.
- Dominique et al. [2018] Marie Dominique, Andrei N. Zhukov, Petr Heinzel, Ingolf E. Dammasch, Laurence Wauters, Laurent Dolla, Sergei Shestov, Matthieu Kretzschmar, Janet Machol, Giovanni Lapenta, and Werner Schmutz. First Detection of Solar Flare Emission in Mid-ultraviolet Balmer Continuum. Astrophys. J. Lett., 867(2):L24, November 2018. doi: 10.3847/2041-8213/aaeace.
- Eparvier et al. [2015] Francis Eparvier, Phillip Chamberlin, Thomas Woods, and Edward Thiemann. The solar extreme ultraviolet monitor for maven. Space Science Reviews, 195, 09 2015. doi: 10.1007/s11214-015-0195-2.
- Eparvier et al. [2009] Francis G. Eparvier, David Crotser, Andrew R. Jones, William E. McClintock, Martin Snow, and Thomas N. Woods. The Extreme Ultraviolet Sensor (EUVS) for GOES-R. In Silvano Fineschi and Judy A. Fennelly, editors, Solar Physics and Space Weather Instrumentation III, volume 7438 of Society of Photo-Optical Instrumentation Engineers (SPIE) Conference Series, page 743804, August 2009. doi: 10.1117/12.826445.
- Evans et al. [2010] J. S. Evans, D. J. Strickland, W. K. Woo, D. R. McMullin, S. P. Plunkett, R. A. Viereck, S. M. Hill, T. N. Woods, and F. G. Eparvier. Early Observations by the GOES-13 Solar Extreme Ultraviolet Sensor (EUVS). Sol. Phys., 262(1):71–115, March 2010. doi: 10.1007/s11207-009-9491-x.
- Feng et al. [2019] Li Feng, Hui Li, Bo Chen, Ying Li, Roberto Susino, Yu Huang, Lei Lu, Bei-Li Ying, Jing-Wei Li, Jian-Chao Xue, Yu-Tong Yang, Jie Hong, Jian-Ping Li, Jie Zhao, Wei-Qun Gan, and Yan Zhang. The Lyman-alpha Solar Telescope (LST) for the ASO-S mission - III. data and potential diagnostics. Research in Astronomy and Astrophysics, 19(11):162, November 2019. doi: 10.1088/1674-4527/19/11/162.
- Gan et al. [2023] Weiqun Gan, Cheng Zhu, Yuanyong Deng, Zhe Zhang, Bo Chen, Yu Huang, Lei Deng, Haiyan Wu, Haiying Zhang, Hui Li, Yang Su, Jiangtao Su, Li Feng, Jian Wu, Jijun Cui, Chi Wang, Jin Chang, Zengshan Yin, Weiming Xiong, Bin Chen, Jianfeng Yang, Fu Li, Jiaben Lin, Junfeng Hou, Xianyong Bai, Dengyi Chen, Yan Zhang, Yiming Hu, Yaoming Liang, Jianping Wang, Kefei Song, Quanfeng Guo, Lingping He, Guang Zhang, Peng Wang, Haicao Bao, Caixia Cao, Yanping Bai, Binglong Chen, Tao He, Xinyu Li, Ye Zhang, Xing Liao, Hu Jiang, Youping Li, Yingna Su, Shijun Lei, Wei Chen, Ying Li, Jie Zhao, Jingwei Li, Yunyi Ge, Ziming Zou, Tai Hu, Miao Su, Haidong Ji, Mei Gu, Yonghuang Zheng, Dezhen Xu, and Xing Wang. The Advanced Space-Based Solar Observatory (ASO-S). Sol. Phys., 298(5):68, May 2023. doi: 10.1007/s11207-023-02166-x.
- Greatorex et al. [2023] Harry J. Greatorex, Ryan O. Milligan, and Phillip C. Chamberlin. Observational Analysis of Ly Emission in Equivalent-magnitude Solar Flares. Astrophys. J., 954(2):120, September 2023. doi: 10.3847/1538-4357/acea7f.
- Hanser and Sellers [1996] Frederick A. Hanser and Francis Bach Sellers. Design and calibration of the GOES-8 solar x-ray sensor: the XRS. In Edward R. Washwell, editor, GOES-8 and Beyond, volume 2812, pages 344 – 352. International Society for Optics and Photonics, SPIE, 1996. doi: 10.1117/12.254082. URL \urlhttps://doi.org/10.1117/12.254082.
- Harra et al. [2022] Louise K. Harra, Andrea Alberti, David Berghmans, Phillip Chamberlin, Marie Dominique, Francis G. Eparvier, Samuel Gissot, Hirohisa Hara, Margit Haberreiter, Tomoaki Hori, Hidekatsu Jin, Matthieu Kretzschmar, Shinsuke Imada, Tomoko Kawate, Silvio Koller, Samuel Krucker, Patrick Langer, Leandro Meier, Ryan Milligan, Yoshizumi Miyoshi, Nozomu, Nishitani, Dany Pfiffner, Eugene Rozanov, Toshifumi Shimizu, Edward Thiemann, Daniel Tye, Kyoko Watanabe, Thomas Woods, Kok Leng Yeo, Akimasa Ieda, and Krzysztof Barczynski. A spectral solar irradiance monitor (SoSpIM) on the JAXA Solar-C (EUVST) space mission. In 44th COSPAR Scientific Assembly. Held 16-24 July, volume 44, page 834, July 2022.
- Hayes et al. [2021] Laura A. Hayes, Oscar S. D. O’Hara, Sophie A. Murray, and Peter T. Gallagher. Solar flare effects on the earth’s lower ionosphere. Solar Physics, 296(11), Nov 2021. ISSN 1573-093X. doi: 10.1007/s11207-021-01898-y. URL \urlhttp://dx.doi.org/10.1007/s11207-021-01898-y.
- Hochedez et al. [2006] J. F. Hochedez, W. Schmutz, Y. Stockman, U. Schühle, A. Benmoussa, S. Koller, K. Haenen, D. Berghmans, J. M. Defise, J. P. Halain, A. Theissen, V. Delouille, V. Slemzin, D. Gillotay, D. Fussen, M. Dominique, F. Vanhellemont, D. McMullin, M. Kretzschmar, A. Mitrofanov, B. Nicula, L. Wauters, H. Roth, E. Rozanov, I. Rüedi, C. Wehrli, A. Soltani, H. Amano, R. van der Linden, A. Zhukov, F. Clette, S. Koizumi, V. Mortet, Z. Remes, R. Petersen, M. Nesládek, M. D’Olieslaeger, J. Roggen, and P. Rochus. LYRA, a solar UV radiometer on Proba2. Advances in Space Research, 37(2):303–312, January 2006. doi: 10.1016/j.asr.2005.10.041.
- Howard et al. [2008] R. A. Howard, J. D. Moses, A. Vourlidas, J. S. Newmark, D. G. Socker, S. P. Plunkett, C. M. Korendyke, J. W. Cook, A. Hurley, J. M. Davila, W. T. Thompson, O. C. St Cyr, E. Mentzell, K. Mehalick, J. R. Lemen, J. P. Wuelser, D. W. Duncan, T. D. Tarbell, C. J. Wolfson, A. Moore, R. A. Harrison, N. R. Waltham, J. Lang, C. J. Davis, C. J. Eyles, H. Mapson-Menard, G. M. Simnett, J. P. Halain, J. M. Defise, E. Mazy, P. Rochus, R. Mercier, M. F. Ravet, F. Delmotte, F. Auchere, J. P. Delaboudiniere, V. Bothmer, W. Deutsch, D. Wang, N. Rich, S. Cooper, V. Stephens, G. Maahs, R. Baugh, D. McMullin, and T. Carter. Sun Earth Connection Coronal and Heliospheric Investigation (SECCHI). Space Sci. Rev., 136(1-4):67–115, April 2008. doi: 10.1007/s11214-008-9341-4.
- Jain et al. [2015] S. K. Jain, A. I. F. Stewart, N. M. Schneider, J. Deighan, A. Stiepen, J. S. Evans, M. H. Stevens, M. S. Chaffin, M. Crismani, W. E. McClintock, J. T. Clarke, G. M. Holsclaw, D. Y. Lo, F. Lefèvre, F. Montmessin, E. M. B. Thiemann, F. Eparvier, and B. M. Jakosky. The structure and variability of Mars upper atmosphere as seen in MAVEN/IUVS dayglow observations. Geophys. Res. Lett., 42(21):9023–9030, November 2015. doi: 10.1002/2015GL065419.
- Kaiser et al. [2008] M. L. Kaiser, T. A. Kucera, J. M. Davila, O. C. St. Cyr, M. Guhathakurta, and E. Christian. The STEREO Mission: An Introduction. Space Sci. Rev., 136(1-4):5–16, April 2008. doi: 10.1007/s11214-007-9277-0.
- Kretzschmar et al. [2013] M. Kretzschmar, M. Dominique, and I. E. Dammasch. Sun-as-a-Star Observation of Flares in Lyman by the PROBA2/LYRA Radiometer. Sol. Phys., 286(1):221–239, August 2013. doi: 10.1007/s11207-012-0175-6.
- Li et al. [2024] Dong Li, Zhenxiang Hong, Zhenyong Hou, and Yang Su. Localizing Quasiperiodic Pulsations in Hard X-Ray, Microwave, and Ly Emissions of an X6.4 Flare. Astrophys. J., 970(1):77, July 2024. doi: 10.3847/1538-4357/ad566c.
- Li et al. [2019] Hui Li, Bo Chen, Li Feng, Ying Li, Yu Huang, Jing-Wei Li, Lei Lu, Jian-Chao Xue, Bei-Li Ying, Jie Zhao, Yu-Tong Yang, Wei-Qun Gan, Cheng Fang, Ke-Fei Song, Hong Wang, Quan-Feng Guo, Ling-Ping He, Bo Zhu, Cheng Zhu, Lei Deng, Hai-Chao Bao, Cai-Xia Cao, and Zhong-Guang Yang. The Lyman-alpha Solar Telescope (LST) for the ASO-S mission — I. Scientific objectives and overview. Research in Astronomy and Astrophysics, 19(11):158, November 2019. doi: 10.1088/1674-4527/19/11/158.
- Li et al. [2022] Y. Li, Qiao Li, De-Chao Song, Andrea Francesco Battaglia, Hualin Xiao, Säm Krucker, Udo Schühle, Hui Li, Weiqun Gan, and M. D. Ding. The ly emission in a c1.4 solar flare observed by the extreme ultraviolet imager aboard solar orbiter. The Astrophysical Journal, 936(2):142, sep 2022. doi: 10.3847/1538-4357/ac897c. URL \urlhttps://dx.doi.org/10.3847/1538-4357/ac897c.
- Lin et al. [2002] R. P. Lin, B. R. Dennis, G. J. Hurford, D. M. Smith, A. Zehnder, P. R. Harvey, D. W. Curtis, D. Pankow, P. Turin, M. Bester, A. Csillaghy, M. Lewis, N. Madden, H. F. van Beek, M. Appleby, T. Raudorf, J. McTiernan, R. Ramaty, E. Schmahl, R. Schwartz, S. Krucker, R. Abiad, T. Quinn, P. Berg, M. Hashii, R. Sterling, R. Jackson, R. Pratt, R. D. Campbell, D. Malone, D. Landis, C. P. Barrington-Leigh, S. Slassi-Sennou, C. Cork, D. Clark, D. Amato, L. Orwig, R. Boyle, I. S. Banks, K. Shirey, A. K. Tolbert, D. Zarro, F. Snow, K. Thomsen, R. Henneck, A. McHedlishvili, P. Ming, M. Fivian, John Jordan, Richard Wanner, Jerry Crubb, J. Preble, M. Matranga, A. Benz, H. Hudson, R. C. Canfield, G. D. Holman, C. Crannell, T. Kosugi, A. G. Emslie, N. Vilmer, J. C. Brown, C. Johns-Krull, M. Aschwanden, T. Metcalf, and A. Conway. The Reuven Ramaty High-Energy Solar Spectroscopic Imager (RHESSI). Sol. Phys., 210(1):3–32, November 2002. doi: 10.1023/A:1022428818870.
- Lollo et al. [2012] Anthony Lollo, Paul Withers, Kathryn Fallows, Zachary Girazian, Majd Matta, and P. C. Chamberlin. Numerical simulations of the ionosphere of mars during a solar flare. Journal of Geophysical Research: Space Physics, 117(A5), 2012. doi: https://doi.org/10.1029/2011JA017399. URL \urlhttps://agupubs.onlinelibrary.wiley.com/doi/abs/10.1029/2011JA017399.
- McClintock et al. [2005] William E. McClintock, Gary J. Rottman, and Thomas N. Woods. Solar-Stellar Irradiance Comparison Experiment II (Solstice II): Instrument Concept and Design. Sol. Phys., 230(1-2):225–258, August 2005. doi: 10.1007/s11207-005-7432-x.
- Milligan [2021] Ryan O. Milligan. Solar irradiance variability due to solar flares observed in lyman-alpha emission. Solar Physics, 296(3), mar 2021. doi: 10.1007/s11207-021-01796-3. URL \urlhttps://doi.org/10.1007
- Milligan and Chamberlin [2016] Ryan O. Milligan and Phillip C. Chamberlin. Anomalous temporal behaviour of broadband Ly observations during solar flares from SDO/EVE. Astron. Astrophys., 587:A123, March 2016. doi: 10.1051/0004-6361/201526682.
- Milligan et al. [2014] Ryan O. Milligan, Graham S. Kerr, Brian R. Dennis, Hugh S. Hudson, Lyndsay Fletcher, Joel C. Allred, Phillip C. Chamberlin, Jack Ireland, Mihalis Mathioudakis, and Francis P. Keenan. The radiated energy budget of chromospheric plasma in a major solar flare deduced from multi-wavelength observations. Astrophys. J., 793(2):70, Sep 2014. ISSN 1538-4357. doi: 10.1088/0004-637x/793/2/70. URL \urlhttp://dx.doi.org/10.1088/0004-637X/793/2/70.
- Milligan et al. [2017] Ryan O. Milligan, Bernhard Fleck, Jack Ireland, Lyndsay Fletcher, and Brian R. Dennis. Detection of three-minute oscillations in full-disk ly emission during a solar flare. The Astrophysical Journal, 848(1):L8, oct 2017. doi: 10.3847/2041-8213/aa8f3a. URL \urlhttps://doi.org/10.3847/2041-8213/aa8f3a.
- Milligan et al. [2020] Ryan O. Milligan, Hugh S. Hudson, Phillip C. Chamberlin, Iain G. Hannah, and Laura A. Hayes. Lyman‐alpha variability during solar flares over solar cycle 24 using goes‐15/euvs‐e. Space Weather, 18(7), Jul 2020. ISSN 1542-7390. doi: 10.1029/2019sw002331. URL \urlhttp://dx.doi.org/10.1029/2019SW002331.
- Müller et al. [2020] D. Müller, St. Cyr, O. C., Zouganelis, I., Gilbert, H. R., Marsden, R., Nieves-Chinchilla, T., Antonucci, E., Auchère, F., Berghmans, D., Horbury, T. S., Howard, R. A., Krucker, S., Maksimovic, M., Owen, C. J., Rochus, P., Rodriguez-Pacheco, J., Romoli, M., Solanki, S. K., Bruno, R., Carlsson, M., Fludra, A., Harra, L., Hassler, D. M., Livi, S., Louarn, P., Peter, H., Schühle, U., Teriaca, L., del Toro Iniesta, J. C., Wimmer-Schweingruber, R. F., Marsch, E., Velli, M., De Groof, A., Walsh, A., and Williams, D. The solar orbiter mission - science overview. A&A, 642:A1, 2020. doi: 10.1051/0004-6361/202038467. URL \urlhttps://doi.org/10.1051/0004-6361/202038467.
- Neupert [1968] Werner M. Neupert. Comparison of Solar X-Ray Line Emission with Microwave Emission during Flares. Astrophys. J. Lett., 153:L59, July 1968. doi: 10.1086/180220.
- Nusinov et al. [2006] A. A. Nusinov, T. V. Kazachevskaya, S. N. Kuznetsov, I. N. Myagkova, and B. Yu. Yushkov. Ultraviolet, hard X-ray, and gamma-ray emission of solar flares recorded by VUSS-L and SONG instruments in 2001 2003. Solar System Research, 40(4):282–285, July 2006. doi: 10.1134/S0038094606040034.
- Pesnell et al. [2012] W. Dean Pesnell, B. J. Thompson, and P. C. Chamberlin. The Solar Dynamics Observatory (SDO). Sol. Phys., 275(1-2):3–15, January 2012. doi: 10.1007/s11207-011-9841-3.
- Qian et al. [2010] Liying Qian, Alan G. Burns, Phillip C. Chamberlin, and Stanley C. Solomon. Flare location on the solar disk: Modeling the thermosphere and ionosphere response. Journal of Geophysical Research: Space Physics, 115(A9), 2010. doi: https://doi.org/10.1029/2009JA015225. URL \urlhttps://agupubs.onlinelibrary.wiley.com/doi/abs/10.1029/2009JA015225.
- Qian et al. [2011] Liying Qian, Alan G. Burns, Phillip C. Chamberlin, and Stanley C. Solomon. Variability of thermosphere and ionosphere responses to solar flares. Journal of Geophysical Research: Space Physics, 116(A10), 2011. doi: https://doi.org/10.1029/2011JA016777. URL \urlhttps://agupubs.onlinelibrary.wiley.com/doi/abs/10.1029/2011JA016777.
- Qian et al. [2012] Liying Qian, Alan G. Burns, Stanley C. Solomon, and Phillip C. Chamberlin. Solar flare impacts on ionospheric electrodyamics. Geophysical Research Letters, 39(6), 2012. doi: https://doi.org/10.1029/2012GL051102. URL \urlhttps://agupubs.onlinelibrary.wiley.com/doi/abs/10.1029/2012GL051102.
- Raulin et al. [2013] Jean-Pierre Raulin, Gérard Trottet, Matthieu Kretzschmar, Edith L. Macotela, Alessandra Pacini, Fernando C. P. Bertoni, and Ingolf E. Dammasch. Response of the low ionosphere to x-ray and lyman- solar flare emissions. Journal of Geophysical Research: Space Physics, 118(1):570–575, 2013. doi: https://doi.org/10.1029/2012JA017916. URL \urlhttps://agupubs.onlinelibrary.wiley.com/doi/abs/10.1029/2012JA017916.
- Rochus et al. [2020] P. Rochus, Auchère, F., Berghmans, D., Harra, L., Schmutz, W., Schühle, U., Addison, P., Appourchaux, T., Aznar Cuadrado, R., Baker, D., Barbay, J., Bates, D., BenMoussa, A., Bergmann, M., Beurthe, C., Borgo, B., Bonte, K., Bouzit, M., Bradley, L., Büchel, V., Buchlin, E., Büchner, J., Cabé, F., Cadiergues, L., Chaigneau, M., Chares, B., Choque Cortez, C., Coker, P., Condamin, M., Coumar, S., Curdt, W., Cutler, J., Davies, D., Davison, G., Defise, J.-M., Del Zanna, G., Delmotte, F., Delouille, V., Dolla, L., Dumesnil, C., Dürig, F., Enge, R., François, S., Fourmond, J.-J., Gillis, J.-M., Giordanengo, B., Gissot, S., Green, L. M., Guerreiro, N., Guilbaud, A., Gyo, M., Haberreiter, M., Hafiz, A., Hailey, M., Halain, J.-P., Hansotte, J., Hecquet, C., Heerlein, K., Hellin, M.-L., Hemsley, S., Hermans, A., Hervier, V., Hochedez, J.-F., Houbrechts, Y., Ihsan, K., Jacques, L., Jérôme, A., Jones, J., Kahle, M., Kennedy, T., Klaproth, M., Kolleck, M., Koller, S., Kotsialos, E., Kraaikamp, E., Langer, P., Lawrenson, A., Le Clech´, J.-C., Lenaerts, C., Liebecq, S., Linder, D., Long, D. M., Mampaey, B., Markiewicz-Innes, D., Marquet, B., Marsch, E., Matthews, S., Mazy, E., Mazzoli, A., Meining, S., Meltchakov, E., Mercier, R., Meyer, S., Monecke, M., Monfort, F., Morinaud, G., Moron, F., Mountney, L., Müller, R., Nicula, B., Parenti, S., Peter, H., Pfiffner, D., Philippon, A., Phillips, I., Plesseria, J.-Y., Pylyser, E., Rabecki, F., Ravet-Krill, M.-F., Rebellato, J., Renotte, E., Rodriguez, L., Roose, S., Rosin, J., Rossi, L., Roth, P., Rouesnel, F., Roulliay, M., Rousseau, A., Ruane, K., Scanlan, J., Schlatter, P., Seaton, D. B., Silliman, K., Smit, S., Smith, P. J., Solanki, S. K., Spescha, M., Spencer, A., Stegen, K., Stockman, Y., Szwec, N., Tamiatto, C., Tandy, J., Teriaca, L., Theobald, C., Tychon, I., van Driel-Gesztelyi, L., Verbeeck, C., Vial, J.-C., Werner, S., West, M. J., Westwood, D., Wiegelmann, T., Willis, G., Winter, B., Zerr, A., Zhang, X., and Zhukov, A. N. The solar orbiter eui instrument: The extreme ultraviolet imager. A&A, 642:A8, 2020. doi: 10.1051/0004-6361/201936663. URL \urlhttps://doi.org/10.1051/0004-6361/201936663.
- Sakai et al. [2016] Shotaro Sakai, Laila Andersson, Thomas E. Cravens, David L. Mitchell, Christian Mazelle, Ali Rahmati, Christopher M. Fowler, Stephen W. Bougher, Edward M. B. Thiemann, Francis G. Eparvier, Juan M. Fontenla, Paul R. Mahaffy, John E. P. Connerney, and Bruce M. Jakosky. Electron energetics in the Martian dayside ionosphere: Model comparisons with MAVEN data. Journal of Geophysical Research (Space Physics), 121(7):7049–7066, July 2016. doi: 10.1002/2016JA022782.
- Santandrea et al. [2013] S. Santandrea, K. Gantois, K. Strauch, F. Teston, E. Tilmans, C. Baijot, D. Gerrits, A. De Groof, G. Schwehm, and J. Zender. PROBA2: Mission and Spacecraft Overview. Sol. Phys., 286(1):5–19, August 2013. doi: 10.1007/s11207-013-0289-5.
- Skumanich et al. [1978] A. Skumanich, A. Jouchoux, J. Castelli, P. Lemaire, G. Artzner, P. Gouttebroze, J. C. Vial, and R. M. Bonnet. OSO-8 Radio and X-ray observations of the 19 April 1977 flare. In Bulletin of the American Astronomical Society, volume 10, page 441, March 1978.
- The SunPy Community et al. [2020] The SunPy Community, Will T. Barnes, Monica G. Bobra, Steven D. Christe, Nabil Freij, Laura A. Hayes, Jack Ireland, Stuart Mumford, David Perez-Suarez, Daniel F. Ryan, Albert Y. Shih, Prateek Chanda, Kolja Glogowski, Russell Hewett, V. Keith Hughitt, Andrew Hill, Kaustubh Hiware, Andrew Inglis, Michael S. F. Kirk, Sudarshan Konge, James Paul Mason, Shane Anthony Maloney, Sophie A. Murray, Asish Panda, Jongyeob Park, Tiago M. D. Pereira, Kevin Reardon, Sabrina Savage, Brigitta M. Sipőcz, David Stansby, Yash Jain, Garrison Taylor, Tannmay Yadav, Rajul, and Trung Kien Dang. The sunpy project: Open source development and status of the version 1.0 core package. The Astrophysical Journal, 890:68–, 2020. doi: 10.3847/1538-4357/ab4f7a. URL \urlhttps://iopscience.iop.org/article/10.3847/1538-4357/ab4f7a.
- Thiemann et al. [2017] Edward M. B. Thiemann, Phillip C. Chamberlin, Francis G. Eparvier, Brian Templeman, Thomas N. Woods, Stephen W. Bougher, and Bruce M. Jakosky. The maven euvm model of solar spectral irradiance variability at mars: Algorithms and results. Journal of Geophysical Research: Space Physics, 122(3):2748–2767, 2017. doi: https://doi.org/10.1002/2016JA023512. URL \urlhttps://agupubs.onlinelibrary.wiley.com/doi/abs/10.1002/2016JA023512.
- Tian et al. [2023] Zheng-Yuan Tian, Li Feng, Lei Lu, Fan-Xiaoyu Xia, Yang Su, Wei-Qun Gan, Hui Li, and Yue Zhou. Ly Emission Enhancement Associated with Soft X-Ray Microflares. Research in Astronomy and Astrophysics, 23(6):065011, June 2023. doi: 10.1088/1674-4527/accc75.
- van Dokkum et al. [2012] Pieter G. van Dokkum, J. Bloom, and Malte Tewes. L.A.Cosmic: Laplacian Cosmic Ray Identification. Astrophysics Source Code Library, record ascl:1207.005, July 2012.
- Viereck et al. [2007] Rodney Viereck, Fred Hanser, John Wise, Soumyendu Guha, Andrew Jones, Don McMullin, Simon Plunket, Doug Strickland, and Scott Evans. Solar extreme ultraviolet irradiance observations from GOES: design characteristics and initial performance. In Silvano Fineschi and Rodney A. Viereck, editors, Solar Physics and Space Weather Instrumentation II, volume 6689 of Society of Photo-Optical Instrumentation Engineers (SPIE) Conference Series, page 66890K, September 2007. doi: 10.1117/12.734886.
- Watanabe [2014] Tetsuya Watanabe. The Solar-C Mission. In Jacobus M. Oschmann Jr., Mark Clampin, Giovanni G. Fazio, and Howard A. MacEwen, editors, Space Telescopes and Instrumentation 2014: Optical, Infrared, and Millimeter Wave, volume 9143, page 91431O. International Society for Optics and Photonics, SPIE, 2014. doi: 10.1117/12.2055366. URL \urlhttps://doi.org/10.1117/12.2055366.
- Wauters et al. [2022] L. Wauters, M. Dominique, R. Milligan, I. E. Dammasch, M. Kretzschmar, and J. Machol. Observation of a Flare and Filament Eruption in Lyman- on 8 September 2011 by the PRoject for OnBoard Autonomy/Large Yield Radiometer (PROBA2/LYRA). Sol. Phys., 297(3):36, March 2022. doi: 10.1007/s11207-022-01963-0.
- Woods et al. [2012] T. N. Woods, F. G. Eparvier, R. Hock, A. R. Jones, D. Woodraska, D. Judge, L. Didkovsky, J. Lean, J. Mariska, H. Warren, D. McMullin, P. Chamberlin, G. Berthiaume, S. Bailey, T. Fuller-Rowell, J. Sojka, W. K. Tobiska, and R. Viereck. Extreme Ultraviolet Variability Experiment (EVE) on the Solar Dynamics Observatory (SDO): Overview of Science Objectives, Instrument Design, Data Products, and Model Developments. Sol. Phys., 275(1-2):115–143, January 2012. doi: 10.1007/s11207-009-9487-6.
- Woods et al. [1995] Thomas N. Woods, Gary J. Rottman, O. R. White, Juan Fontenla, and E. H. Avrett. The Solar LY alpha Line Profile. Astrophys. J., 442:898, April 1995. doi: 10.1086/175492.
- Woods et al. [2006] Thomas N. Woods, Greg Kopp, and Phillip C. Chamberlin. Contributions of the solar ultraviolet irradiance to the total solar irradiance during large flares. Journal of Geophysical Research: Space Physics, 111(A10), 2006. doi: https://doi.org/10.1029/2005JA011507. URL \urlhttps://agupubs.onlinelibrary.wiley.com/doi/abs/10.1029/2005JA011507.
- Woods et al. [2009] Thomas N. Woods, Phillip C. Chamberlin, Jerald W. Harder, Rachel A. Hock, Martin Snow, Francis G. Eparvier, Juan Fontenla, William E. McClintock, and Erik C. Richard. Solar Irradiance Reference Spectra (SIRS) for the 2008 Whole Heliosphere Interval (WHI). Geophys. Res. Lett., 36(1):L01101, January 2009. doi: 10.1029/2008GL036373.