\tableIconarxivDIGESTables: Synthesizing Scientific Literature into
Tables using Language Models
Abstract
When conducting literature reviews, scientists often create literature review tables—tables whose rows are publications and whose columns constitute a schema, a set of aspects used to compare and contrast the papers. Can we automatically generate these tables using language models (LMs)? In this work, we introduce a framework that leverages LMs to perform this task by decomposing it into separate schema and value generation steps. To enable experimentation, we address two main challenges: First, we overcome a lack of high-quality datasets to benchmark table generation by curating and releasing \tableIconarxivDIGESTables, a new dataset of 2,228 literature review tables extracted from ArXiv papers that synthesize a total of 7,542 research papers. Second, to support scalable evaluation of model generations against human-authored reference tables, we develop DecontextEval, an automatic evaluation method that aligns elements of tables with the same underlying aspects despite differing surface forms. Given these tools, we evaluate LMs’ abilities to reconstruct reference tables, finding this task benefits from additional context to ground the generation (e.g. table captions, in-text references). Finally, through a human evaluation study we find that even when LMs fail to fully reconstruct a reference table, their generated novel aspects can still be useful.
| blnewman/arxivDIGESTables | |
| bnewm0609/arxivDIGESTables |
arxivDIGESTables: Synthesizing Scientific Literature into
Tables using Language Models
Benjamin Newman♠††thanks: Equal contributions. Yoonjoo Lee♡∗ Aakanksha Naik♢ Pao Siangliulue♢ Raymond Fok♠ Juho Kim♡ Daniel S. Weld♠♢ Joseph Chee Chang♢ Kyle Lo♢ ♠University of Washington ♡KAIST ♢Allen Institute for AI blnewman@cs.washington.edu, yoonjoo.lee@kaist.ac.kr
1 Introduction
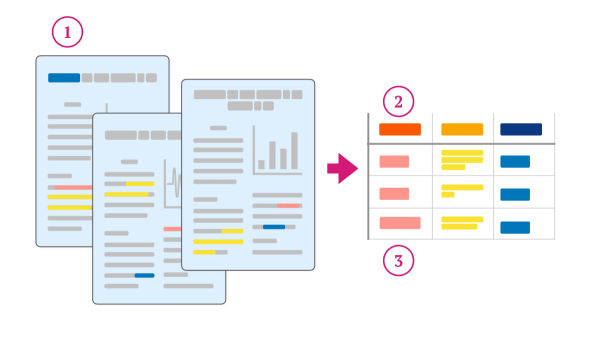
Conducting literature reviews by reading and synthesizing information across a large set of documents is vital for scientists to stay abreast of their fields yet is increasingly laborious as the number of scientific publications grows exponentially Jinha (2010); Bornmann et al. (2021). At the core of this sensemaking process is identifying a schema, a set of important aspects that are useful for comparing and contrasting prior literature Russell et al. (1993). The results of this process are often presented in the form of literature review tables, whose rows are a set of papers and whose columns are a set of aspects that the papers share (Figure 1).
In this work, we conceptualize the task of literature review table generation by decomposing it into two sub-tasks: (1) Schema-generation: Determining a set of relevant shared aspects given a set of input papers, and (2) Value-generation: Determining the value given an aspect and a paper. For example, a table for a set of computer vision papers on video datasets (rows) might have a schema with aspects like “task” or “size” (columns); cell values under the “task” column may say “VQA” or “classification” (values).
Prior work has largely investigated each of the two sub-tasks independently. In particular, the large body of literature on document-grounded question-answering (Kwiatkowski et al., 2019; Dasigi et al., 2021; Lee et al., 2023), information extraction (Luan et al., 2018), and query (Zhong et al., 2021; Xu and Lapata, 2020) or aspect-based summarization (Yang et al., 2023; Ahuja et al., 2022) advances methods that are also suitable for generating values conditioned on an aspect. In our example above, values for aspect “size” can be answers to questions like “How many videos are in this dataset?”.
In contrast, schema generation from a set of documents remains relatively under-explored, even though it is a crucial and effortful part of the manual literature review process. Prior work like Zhang and Balog (2018) infers new schemas from pre-existing ones, while recent work like Wang et al. (2024) assumes users can clearly articulate a schema in a short natural language query to infer aspects directly. This paper studies the use of language models for literature review table generation with a focus on unifying these two sub-tasks. This presents us with two research challenges:
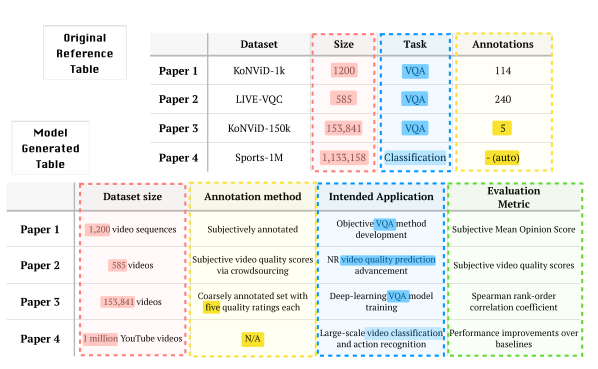
First, we note a lack of large-scale, high-quality datasets of literature review tables to serve as a benchmark for this task. Second, similar to challenges faced in summarization and other grounded generation tasks, semantically similar content can be expressed with different surface forms, which makes automatic evaluation difficult even with a high-quality dataset. An example of these surface form differences is in Figure 2. To address these challenges:
-
•
In §2, we curate and release \tableIconarxivDIGESTables,111DIGESTables stands for Document Information Gathering and Extraction for Scientific Tables a dataset of 2,228 high-quality literature review tables scraped and filtered from 16 years of ArXiv papers uploaded between April 2007 and November 2023. These tables compare and contrast a total of 7,542 unique papers using a total of 7,634 columns and 43,905 values. This is the result of extensive filtering on an initial set of around 2.5 million extracted tables to ensure high quality, based on a strict set of desiderata. Finally, we link every table to rich paper content: (1) every input paper (row) has corresponding full text document, and (2) every table has its caption and in-line textual references extracted from the table’s source paper for contextual information.
-
•
In §5, we present DecontextEval, an automatic evaluation framework for comparing model-generated and human-authored tables. Our approach overcomes the difficulty in matching semantically-similar but lexically-different column names by using a language model to expand column names into descriptions grounded in documents. Combining with a small textual similarity model results in a matcher that is nearly twice more precise than prompting Llama 3 (70B), which often hallucinates matches.
We formalize the literature review table generation task (§3) and introduce our framework for literature review table generation and detail our implementations using open and closed models (§4).
Finally in §6, we evaluate LMs on this generation task, addressing two key questions: (1) what contextual information is needed to steer language models to reconstruct human-authored schemas? and (2) are generated aspects that don’t match gold still useful? For (1), we find that language models have higher recall by conditioning on more context that specifies the purpose of the table (e.g., captions, in-line references, other example tables). For (2), we find that novel aspects not in the reference tables can still be of comparable usefulness, specificity, and insightfulness.
2 Creating \tableIconarxivDIGESTables
Desiderata
To enable research in synthesizing literature review tables, we first collect and curate a set of reference tables to ground our task and enable evaluation. To ensure this data is realistic, high-quality, and focused on supporting literature review, we decide on the following desiderata for including tables in our \tableIconarxivDIGESTables dataset:
-
1.
Tables should be ecologically valid—reflecting real syntheses authored by researchers rather than artificial annotation;
-
2.
Tables should be focused on summarizing multiple aspects of a set of papers as opposed to tables for reporting empirical results;
-
3.
Tables should follow a common structure where each row represents a single document and each column represents a specific aspect.
Based on these goals, we used the procedure below to construct \tableIconarxivDIGESTables:
Data Source
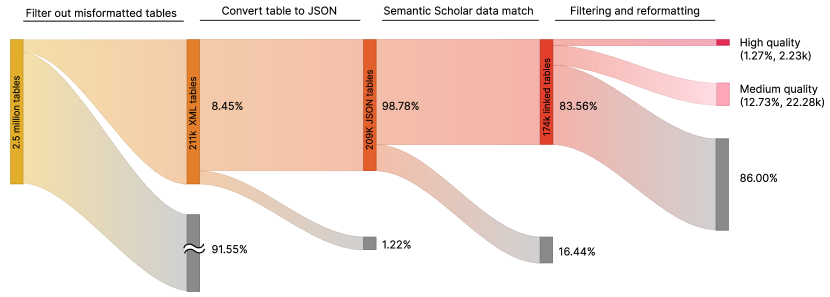
To ensure our task and benchmark are grounded in realistic cases, we collected a dataset real-world literature review tables from open access ArXiv papers from April 2007 until November 2023. We subsequently filter these tables down to a high-quality set of 2,228 tables that meet our desiderata, as seen in Figure 3.
Extracting Tables
The first step in our data collection pipeline is to extract the tables from papers published on the ArXiv preprint server. To start, we consider approximately 800,000 papers that have LaTeX source available. We then use unarXive (Saier et al., 2023) to convert the ArXiv source into XML. From these XML documents, we extract 2.5 million tables.
Filtering Tables
As a first filtering pass, we remove tables that are likely to be misparsed or unusable, filtering those with fewer than 400 or more than 15,000 characters. We also remove tables that have no table cell tags within them. Toward Desiderata 3, we filter out tables that have fewer than two citations, two rows, or two columns. We also remove any tables that have citations in more than one column, as these are often tables where papers are values rather than rows. This leaves approximately 211,000 tables.
Matching Rows to Papers
We use heuristics to convert XML-formatted tables into JSON objects that allow us to directly index the tables by paper and aspect (See §A.1 for details). At this stage, the citation information is usually contained within a cell in a table. For instance, an example cell with the header “Model” might have the value “BERT (Devlin et al., 2019)”. We extract the citations from these cells and place them in their own column called “References”. Rows without citations are assumed to refer to the source paper containing the table. After this step in the process we remove any tables where the algorithm failed and any tables that now have fewer than two rows, leaving 47,876 tables.
Obtaining Table Citation Metadata
unarXive Saier et al. (2023) helpfully links each citation in the table to a bibliography item. We use endpoints from the Semantic Scholar API (Kinney et al., 2023) to obtain titles and abstracts. This occasionally fails for various reasons (e.g., the bibliography text is missing information, the paper is missing from or could not be found in the Semantic Scholar database). We filter out any tables that have fewer than two matched citations, leaving us with 44,617 tables.
Grounding to Paper Texts
To meet Desiderata 2, we want to ensure that the information in the table actually comes from the cited paper. For instance, a common type of table reports experimental results whose values require actual experimentation and cannot be derived from the input papers’ text alone. To filter such columns, we remove any that have math symbols or floating point numbers. Additionally, to make sure the generation task is tractable, we remove any rows whose papers do not have publicly-available full texts.
Final Filter and Manual Verification
Dataset Statistics
We present summary statistics in Table 1 of our high-quality set of \tableIconarxivDIGESTables.222To enable future work to improve on this pipeline, we also release a set of medium-quality tables (see Figure 3) with less strict filtering alongside which filters we ran to produce it along with quality metadata (See §A.3). We are also interested in the types of aspects represented in the tables, the topics of the columns, and the fields the tables come from. To categorize the table aspects, we use simple heuristics (Table 2). We find 40% of the columns are categorical or boolean, which are more suitable for supporting inter-paper comparisons, while the other 60% are more descriptive. To obtain column topics, we manually annotate columns in 50 tables—38% are about datasets, 20% are about methods, and the rest are on other topics such as applications or tasks. Finally, we use the ArXiv API to obtain which archive a table’s paper was submitted to. We find a majority (1,985) of the tables come from computer science publications, with others coming from Physics, Quantitative Biology, Statistics, Math, and other fields (See Appendix A.4).
| Min | Max | Median | Mean | Total | |
|---|---|---|---|---|---|
| Papers | 1 | 35 | 3.0 | 4.944 | 11016 |
| Aspects | 2 | 13 | 3.0 | 3.426 | 7634 |
| Aspect Type | % of Cols | Example Value |
|---|---|---|
| Category | 35.5% | “Open” vs “Proprietary” |
| Entity | 27.3% | “CNN/Daily Mail”, “Reddit” |
| Numeric | 21.7% | “” |
| Text | 9.7% | “…collected via various …” |
| Boolean | 5.8% | “” vs “✗” |
3 Literature Review Table Generation
Equipped with our dataset, we formalize the task of generating literature review tables.
Task Definition
We define our table generation task as follows: Given an input set of documents , generate a table with rows and any number of columns . Each row corresponds to a unique input document. Each column represents a unique aspect. Taken together, the columns constitute a schema. The table then has values, with one value in each cell.333We leave the case where a cell can contain multiple values to future work. The cell values should be derived from the input documents.
Generation
We consider two main approaches to generate a table given a set of input documents. (1) The schema and values could be jointly generated, e.g. in a single call to a language model. This approach is fast, but initial experiments found it more prone to hallucinations and generic column names (e.g., “Title” or “Year”). (2) The generation process can be decomposed into separate schema and value generation steps. This approach is slower but allows us to overcome context window limits and leverage prior work in aspect-based question answering to perform value generation.
Evaluation
We evaluate our approaches by determining whether the generated schemas are useful and values are correct. We consider a generated schema to be useful if its aspects either match those in the corresponding human-authored table in \tableIconarxivDIGESTables or if human evaluators rate them to be useful.444There are many alternative ways to evaluate usefulness. For example, adding constraints on users’ reading time could penalize very detailed tables, while ideation-focused use cases could penalize more generic aspects. These two conditions allow us to measure how well systems reconstruct reference table aspects (§5.1) and evaluate their ability to generate novel aspects (§6.1). Second, we evaluate correctness of values as we would for any information extraction or QA task: for a pair of aligned columns (and rows), we judge whether the predicted cell value is semantically equivalent to the gold cell value (see §5.2).
4 Experiments
We prompt language models to perform either joint or decomposed generation.
4.1 Base Models
We use two language models, one open-weight, Mixtral 8x22 (Mistral AI, 2024), and one closed weight, GPT-3.5-Turbo (Open AI, 2022). To avoid gaming our recall metric, we instruct all models to generate schemas with the same number of aspects as the corresponding reference tables. (More prompting details in Appendix §B.5).
4.2 Joint Table Generation
We represent input papers using their titles and abstracts, which usually have enough information to form useful schemas and are easier to fit in the context window of models. We use a zero-shot table generation prompt (Appendix §B.1). We treat this condition as our baseline.
4.3 Decomposed Table Generation
Step 1: Schema generation
Like in joint generation, we represent input papers using their titles and abstracts. We explore a range of prompts, each including a different piece of additional context (detailed in §4.3.1).
Step 2: Value generation
Similar to extractive QA, for each aspect-paper pair, we prompt the model to generate a cell value based on the aspect name and the full text of the paper. After generating values for each paper given an aspect, we instruct a model to rewrite the values to be shorter and more consistent in style for display in table format. For this step, we use GPT 3.5-Turbo for speed and accuracy (Open AI, 2022) (prompt in Appendix §B.3).
4.3.1 Additional Context
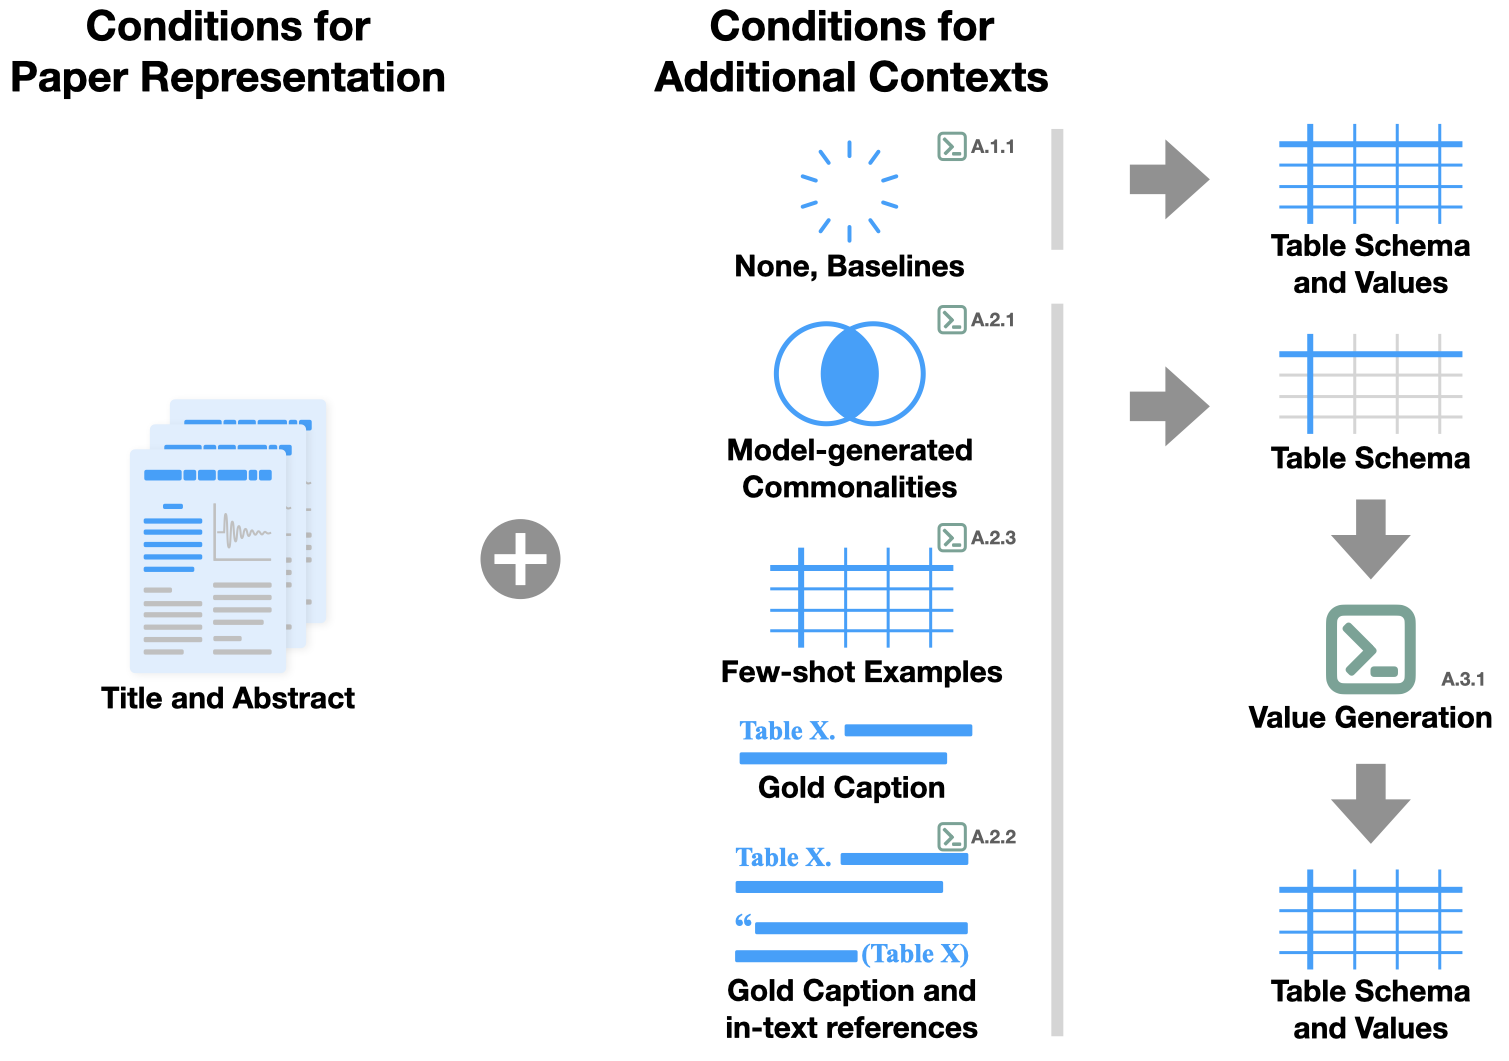
To further investigate what contextual information is needed to steer language models to reconstruct human-authored tables, we test the following additional contexts, which could be added to either schema and/or value generation (see Appendix §B for prompts): (1) a generated caption where GPT-3.5-Turbo generates a short description that is consistent with all input papers; (2) the gold caption from the reference table; (3) the gold caption and in-text references, which include referencing sentences from the table’s source paper; and (4) few-shot in-context examples, consisting of five reference table examples from \tableIconarxivDIGESTables retrieved based on cosine similarity between caption embeddings (Reimers and Gurevych, 2019).
5 Developing an Automatic Metric
Below we describe the design of our automatic evaluation procedure with two components: evaluating the schema and values for a generated table.
5.1 Schema Evaluation
Challenges
The key challenge in assessing how well a generated table reconstructs a reference table lies in determining schema alignments—identifying which columns convey the same information despite different phrasing. Two issues make schema alignment difficult. First, reference tables tend to present information concisely, making column headers and values hard to interpret without additional context (e.g., a column might be named “VQA” instead of “video quality assessment”). Second, information in generated and reference tables might have low lexical overlap despite semantic similarity, a problem also observed in summarization evaluation (Lin, 2004).
Problem Definition
To formalize the schema alignment problem, recall that a table schema is a set of aspects. Given a model-generated table schema, , a reference table schema , and a threshold , our goal is to construct a scoring function to score each pair of aspects, , such that if and only if human raters would agree that and convey the same information.
Alignment Framework
We propose to define as the composition of two functions: a featurizer (), and a scorer (). The goal of the featurizer is to improve aspect interpretability by incorporating additional context, while the goal of the scorer is to account for meaning-preserving lexical diversity, leading to better schema alignments.
Configurations of
We study three featurizers : (1) “name” only takes the column name as-is, (2) “values” concatenates all values under a column to the name, and (3) “decontext” prompts a language model555Mixtral-8x7B-Instruct-v0.1 (Mistral AI, 2024). to generate a stand-alone description (Choi et al., 2021; Newman et al., 2023), given the column name and its values.
We also study four scoring functions :
-
•
Exact Match, which assigns a score of if and otherwise.
-
•
Jaccard, which computes Jaccard similarity of the featurized aspects, with stopwords removed.
-
•
Sentence Transformers, which encodes featurized aspects using all-MiniLM-L6-v2 and computes cosine similarity between them Reimers and Gurevych (2019).
-
•
Llama 3, which prompts Llama 3 (70B) Chat with generated and reference tables, with the column headers replaced by featurized versions, instructions to output aligned columns, and ten in-context examples. All pairs of columns returned by the LLM are assigned a score of , and otherwise. Refer to §B.4 for prompting details.
Calibrating Schema Alignment
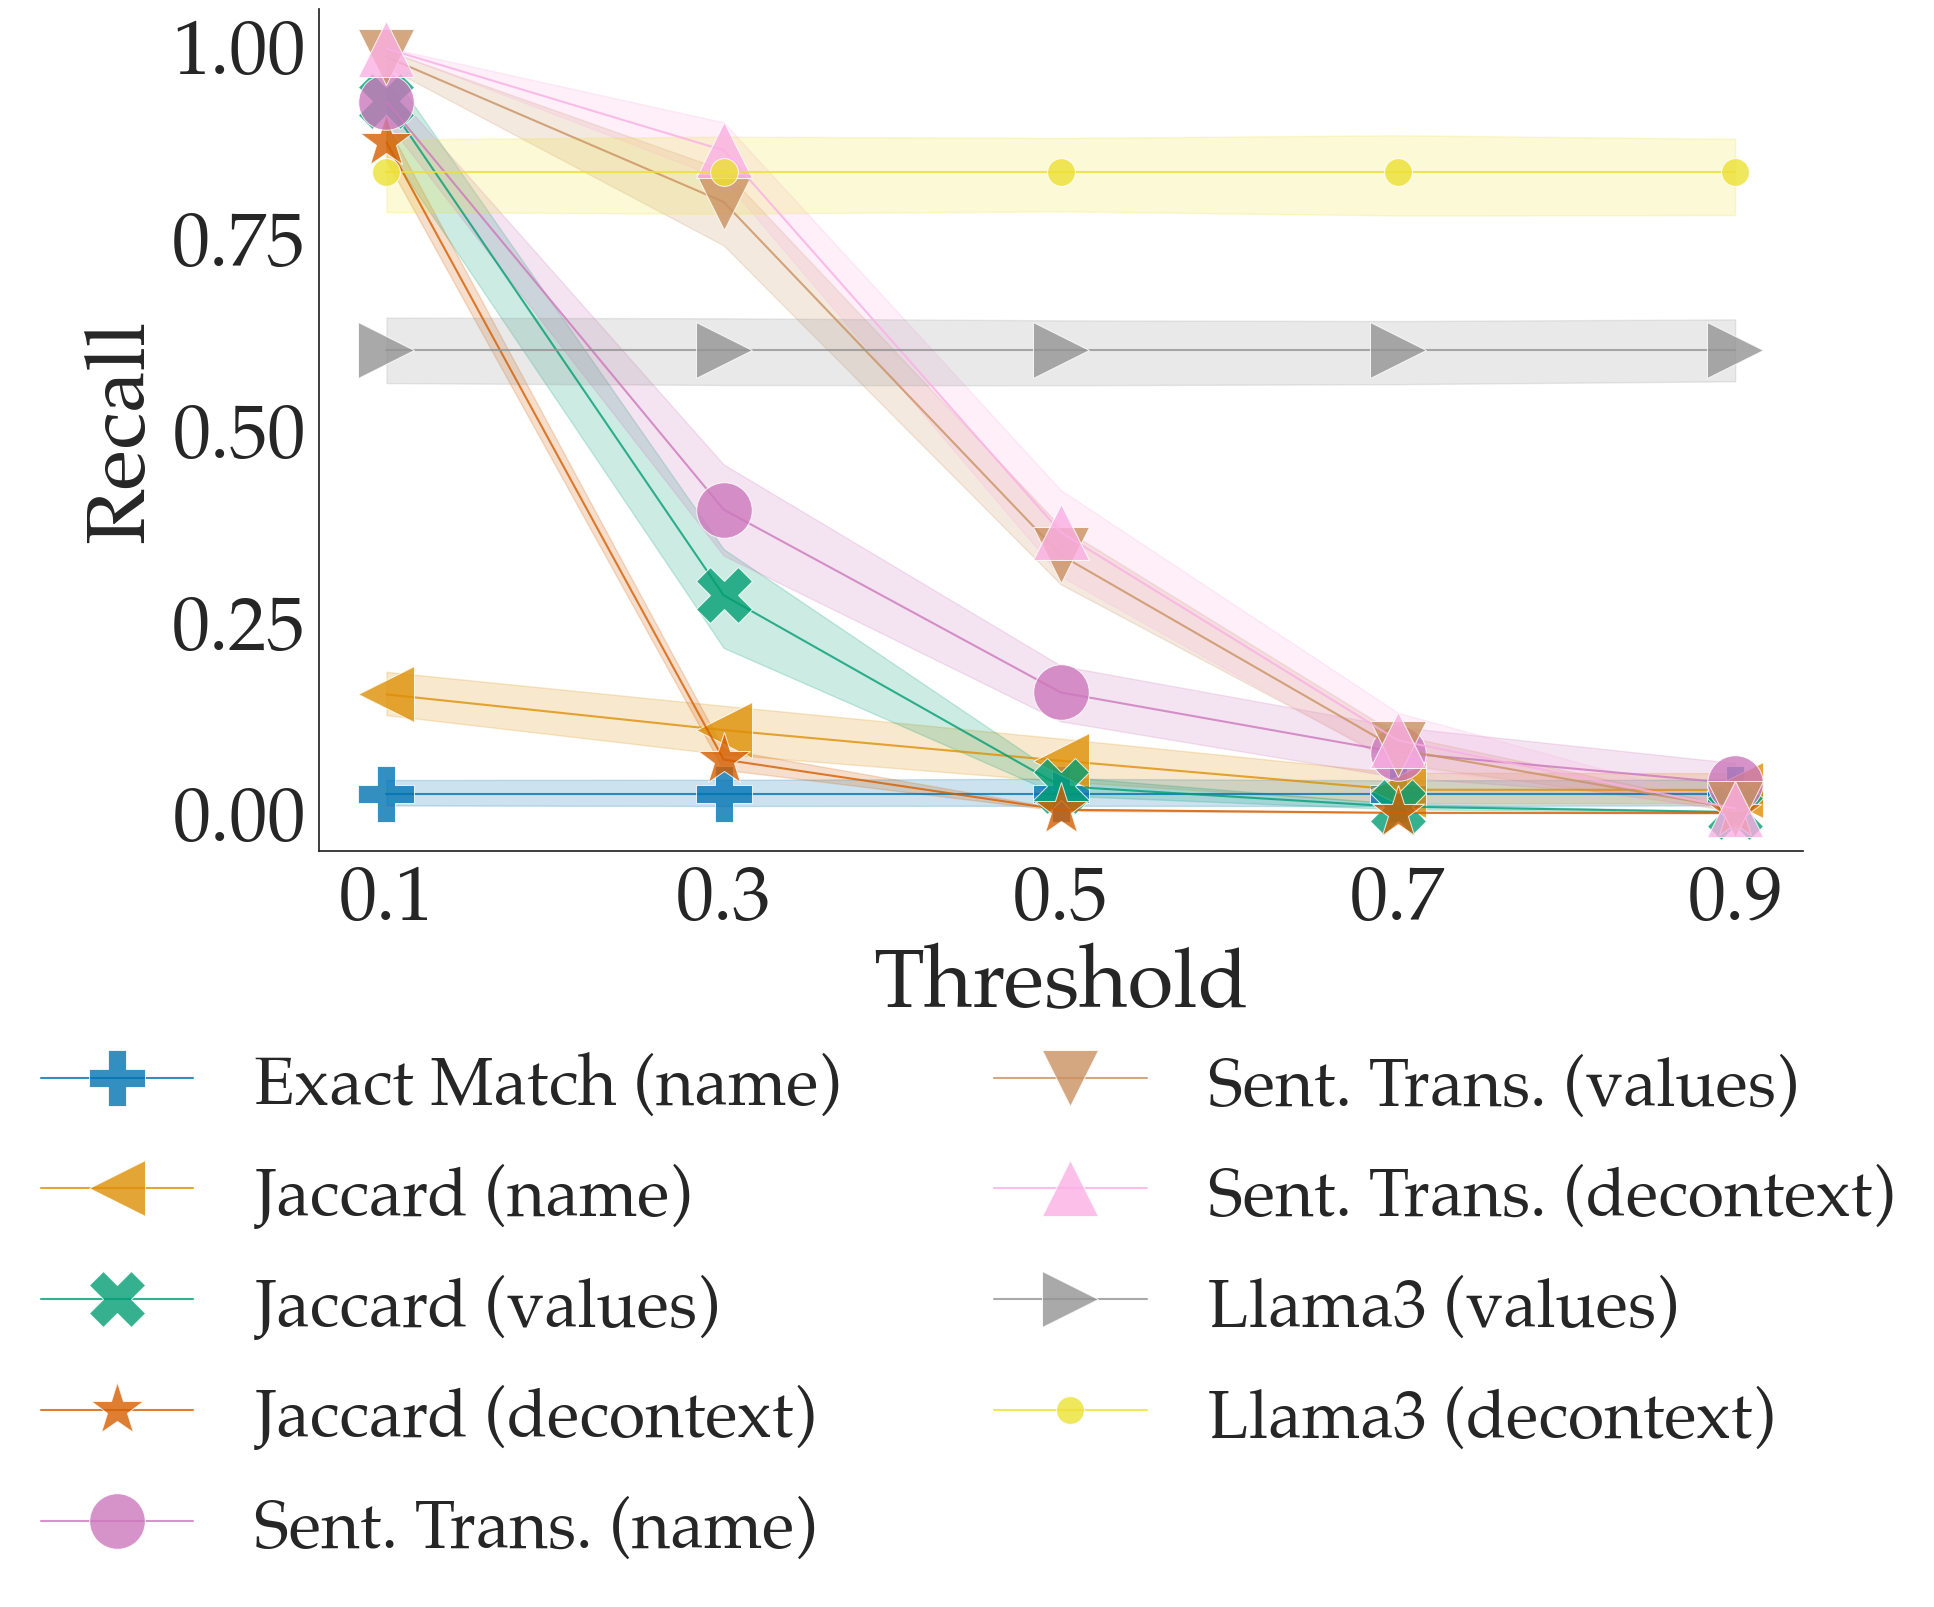
We first run various combinations of and compute schema recall (i.e., proportion of reference table aspects matched to generated table aspects) on 25% of the tables in \tableIconarxivDIGESTables. In Figure 4, we observe a wide range of recall trade-offs: (1) Exact match has very low recall, as expected, serving as our conservative bound. (2) Llama 3 aligners tend to predict many more matches than other configurations despite that half of the in-context examples are tables with no matches. Llama 3 aligners serve as our upper bound. We perform human evaluation on 50 tables and find that Llama 3 aligners have between 37–55% precision on their predicted matches.666Predicted matches are rated either as incorrect, partially, or completely correct. The lower bound only counts complete matches and the upper bound includes partial matches. (3) Focusing our attention on the configurations that yield recall between these two bounds, we evaluate a range of configurations on the same tables and arrive at DecontextEval, our best configuration with using decontext features, using sentence transformers, and ; we find DecontextEval performs at 70–85% precision with acceptable yield.
5.2 Value Evaluation
Automated value evaluation suffers from the same issues that complicate schema evaluation, but one issue specific to value evaluation is reliance on accurate schema alignments. If aspects are incorrectly matched by a schema alignment metric, performance on value evaluation might rise/drop undeservedly. Therefore, we propose evaluating value generation in isolation, instead of an end-to-end table evaluation setting.
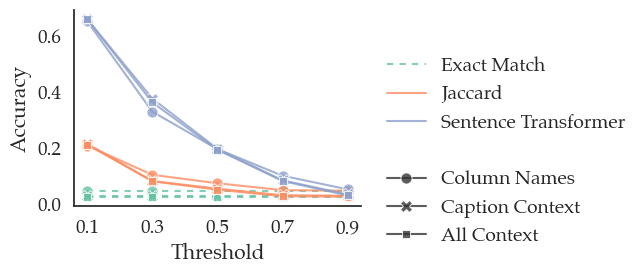
Specifically, we use the reference table’s schemas as input to our value generation module. This ensures that every value in the reference table has a corresponding generated value (barring generation failures), bypassing the need for schema alignment. Following §4.3.1, we consider three settings using different types of contexts: (1) “Column Names” only, (2) “Caption Context” which adds the table caption, and (3) “All Context” which further adds in-text references. Prompts used for each setting are in Appendix §B.3. We then use the same suite of scorers from §5.1 (except Llama 3, which we observed was low-precision) to compute overlap between pairs of generated and reference table’s values.
6 Results
6.1 Schema Evaluation Results
Automated Evaluation
Figure 5 shows the ability of GPT-3.5-Turbo and Mixtral 8x22 to reconstruct schemas (as measured via DecontextEval) using various types of additional contexts described in §4.3.1. Turning back to the question: How does the amount of context provided affect table reconstruction? (1) We see that low context prompts (e.g., a baseline with no additional context, caption-only) perform the worst while high context prompts (e.g., in-text references, in-context examples) perform best. This trend is fairly stable across systems. (2) Interestingly, though adding context improves reconstruction, it does not make the task trivial — even the best performing systems are far from perfect.
One potential concern for this analysis is that the models we use may have seen the older tables during training, which could inflate performance. To address this, we compute recall separately on subsets of newer and older tables (those from before or after January 2023 constituting 30% and 70% of our data respectively) for the high context prompts. We find that there is minimal difference between these two sets (the newer tables have recalls on average 1–3 percentage points lower).

Human Evaluation
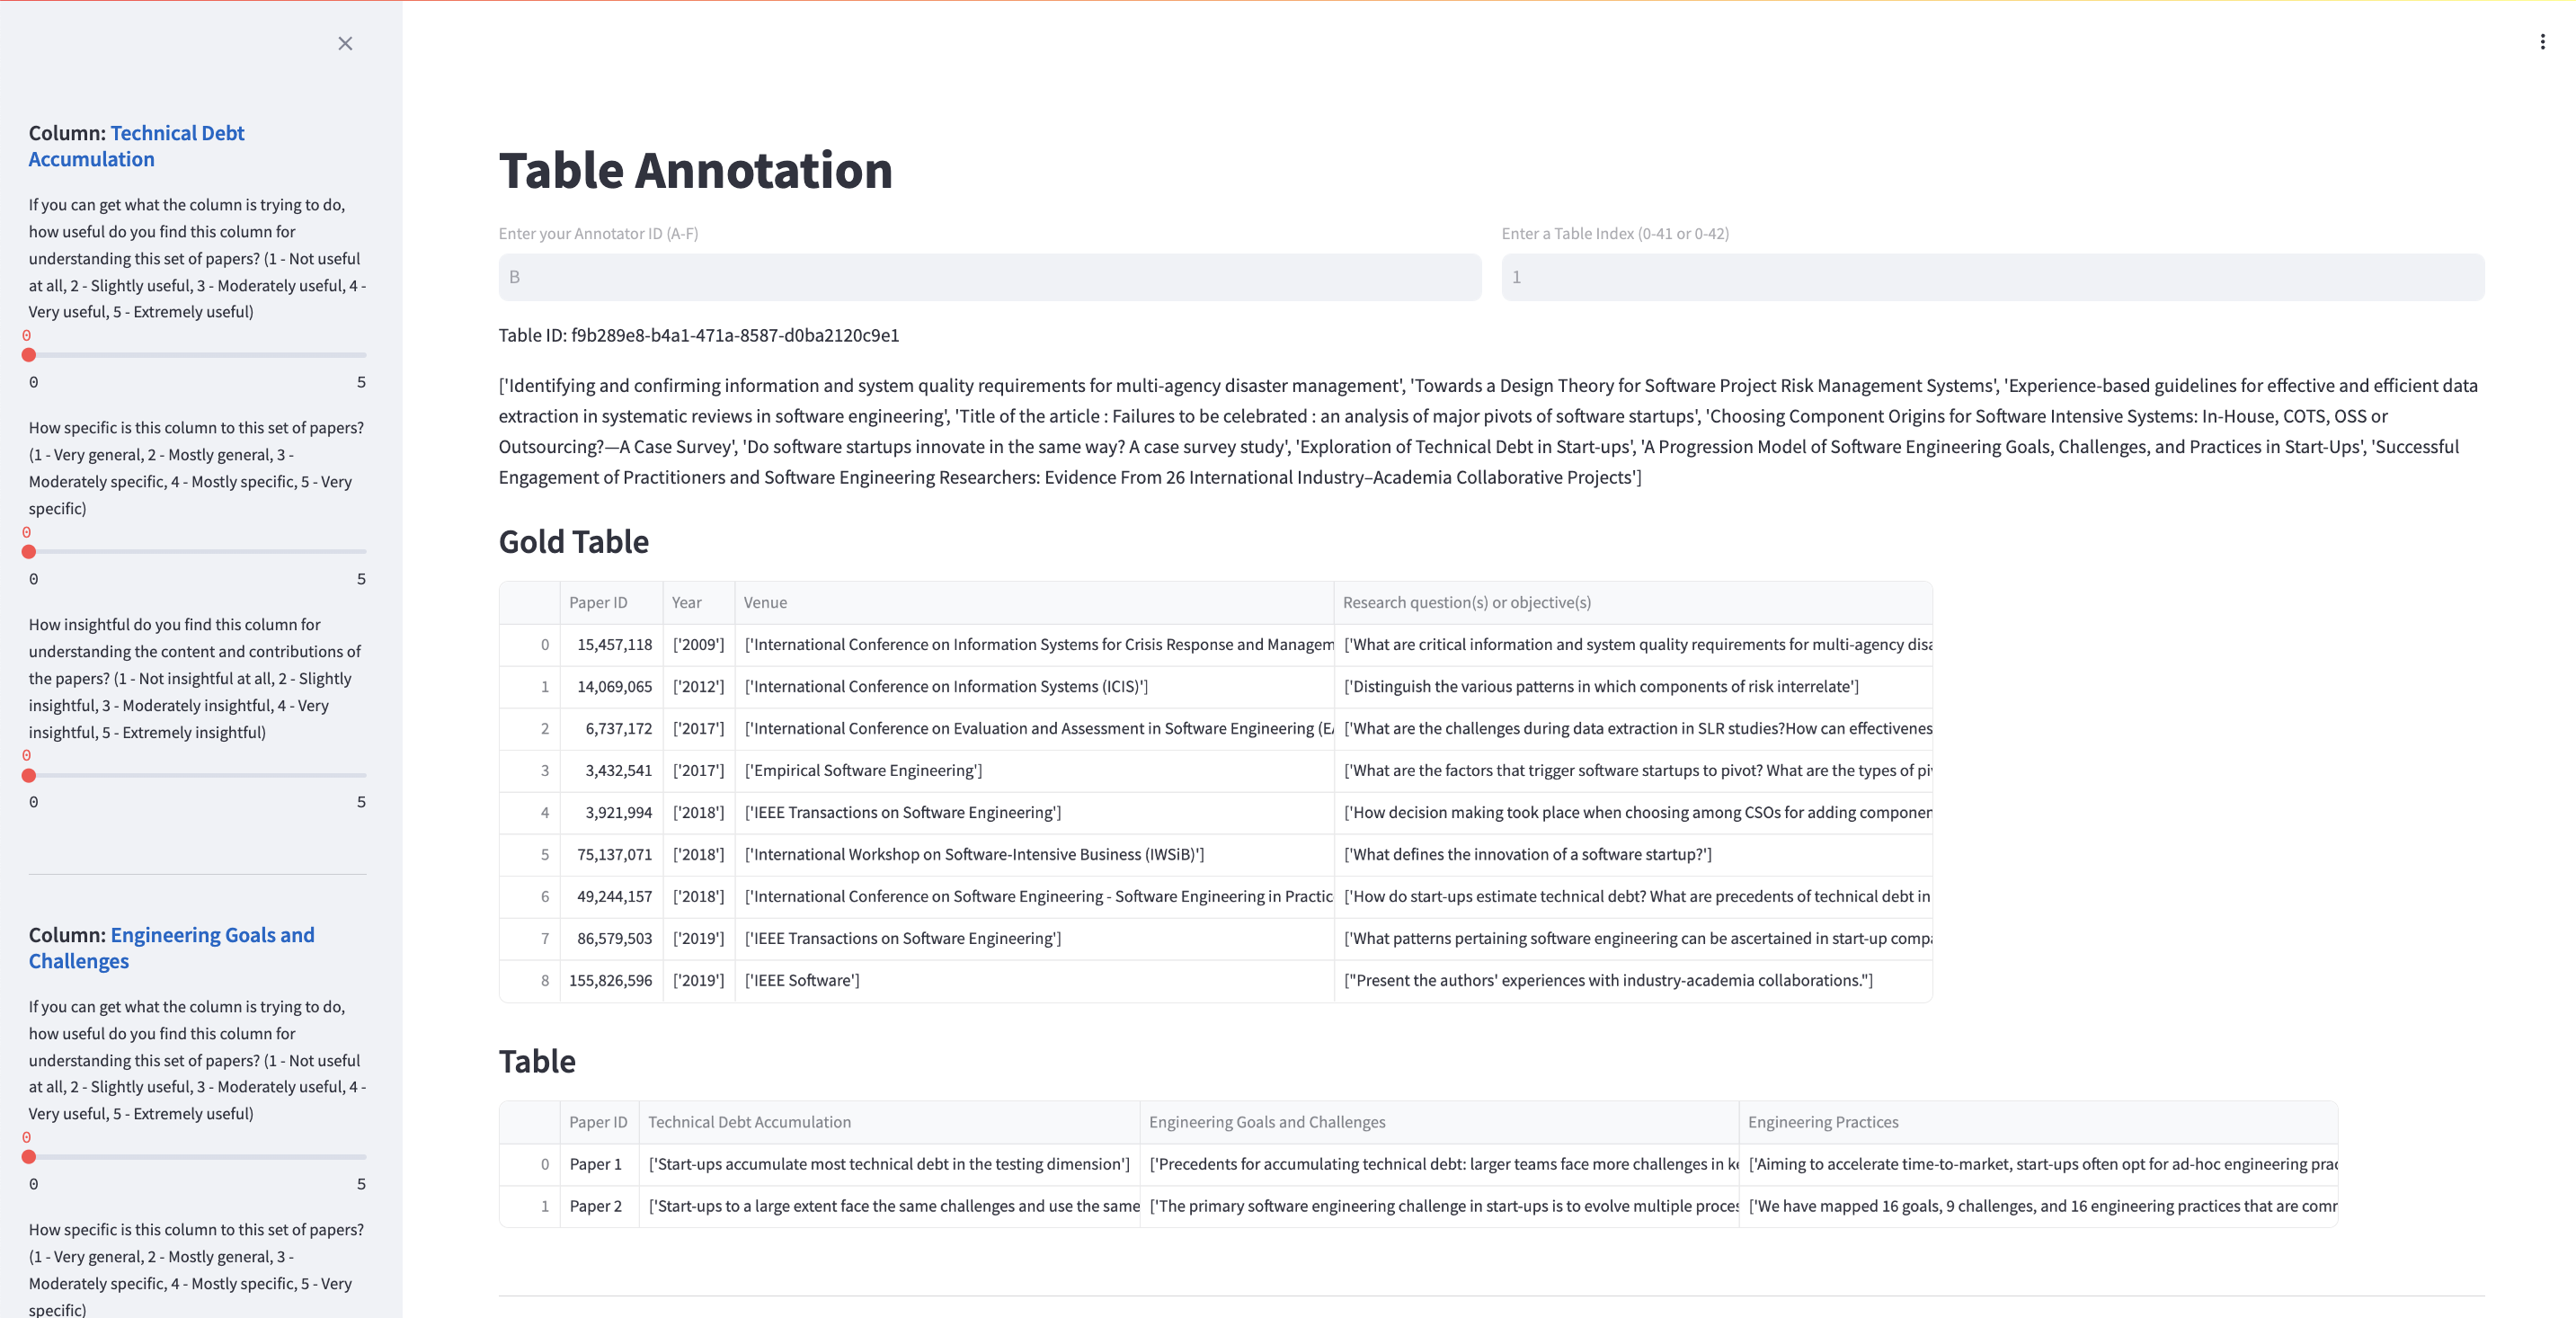
Our automated evaluation measures how well LMs can recover the reference tables’ aspects, but leaves an additional question: Are LM-generated novel aspects which do not match with gold aspects also useful? To investigate this, we collect human assessments of generated aspects. Annotators are provided a generated table and the titles of all input papers. They are then prompted to provide a 5-point Likert scale rating for each of the following aspects: (1) general usefulness for understanding the input papers, (2) specificity to input papers (i.e., would this aspect be applicable to any other set of papers), and (3) insightfulness of the generated aspect (i.e., capturing novelty).777See Appendix §C for the annotation interface and the definitions used. We also instruct annotators to only judge based on the quality of the aspects only, ignoring the values which are evaluated separately. After collecting these ratings, we separated the rated aspects into two groups—ones that matched a gold aspect (M), and ones that did not (NM). The annotators were blind to the conditions when rating the aspects, and inter-annotator agreement was (Krippendorff’s ).
Comparing ratings on matched and unmatched aspects, we did not find aspects that matched to be rated significantly higher than ones that did not (Table 3; Mann-Whitney U tests). This suggests that novel generated aspects are of comparable quality (usefulness, specificity, insightfulness) to gold aspects or even have a higher quality (usefulness of aspects from Caption+In-text References). Moreover, aspects from Caption+In-text Reference are shown to be more useful and specific than the Baseline’s, but were less insightful. This suggests an interesting tradeoff between our reconstruction objective, and possibly a different objective like creativity.
| Caption+In-text Ref | Baseline | ||||
| M | NM | M | NM | ||
| Useful | 3.70 (1.74) | 4.07 (1.06) | 3.92 (0.69) | 3.73 (1.17) | |
| Specific | 2.88 (1.26) | 3.06 (1.34) | 2.85 (1.31) | 2.75 (1.35) | |
| Insightful | 1.86 (1.04) | 1.93 (1.21) | 2.34 (1.25) | 2.27 (1.19) | |
| # Samples | 102 | 208 | 64 | 283 | |
Error Analysis
Finally, we report some qualitative observations of errors in the generated schemas we used for human evaluation. These point to future areas of improvement. Comparing outputs from the baseline to the Caption+In-text References condition, we find that the latter tends to output more specific aspects. For example, for one table, the Mixtral baseline produces aspects “Model Architecture” and “Application”, while the Caption+In-text References Mixtral system generates the more specific aspects “Maximum resolution” and “Training batch size”. We also note a few differences between schemas generated in the Caption+In-text references setting the reference tables’ schemas, as well as categories of aspects that can pose difficulty for generation in Table 5 and additional examples in Appendix §D.
6.2 Value Evaluation Results
Automated Evaluation.
Figure 6 shows the performance of GPT-3.5-Turbo on value generation, using various types of additional contexts (described in §5.2.) We see that scorers continue to follow the same trend observed during schema alignment, with the sentence transformer scorer being fairly permissive while an exact match is overly strict. Interestingly, unlike schema reconstruction, we observe that incorporating additional context does not seem to improve value generation accuracy; we dig deeper into this during human evaluation. Finally, like schema alignment, models are far from perfect in value generation.
Human Evaluation.
We conduct additional human evaluation to investigate whether adding context indeed has no impact on value accuracy, or our automated metrics are not sensitive enough to capture differences. We randomly sample 30 tables and compare gold vs generated values for these tables under all three settings. For each gold-generated value pair, we have two annotators label whether it is a complete match, partial match or unmatched. Partial matches include cases where values are lists of items and the generated value misses or adds some (e.g., “DPO” vs “DPO, PPO”), or cases where the gold and generated values have a hypernymy relationship (e.g., “graph neural networks” vs “GATs”). Inter-annotator agreement is (Cohen’s ). Table 4 presents results from this assessment, showing that adding additional context leads to a significant improvement in partial matches. However, many matches have no lexical overlap (e.g., “X” vs “No”) or require some inference (e.g., “Yes” under a column called “sensors deployed” should match a value like “sensors used to monitor air quality”). This indicates that there is scope for further research in developing more sensitive featurizers and scorers for value evaluation.
| Setting | Complete | Partial | None |
|---|---|---|---|
| Col. Names | 21.13% (75) | 22.54% (80) | 56.34% (200) |
| + Captions | 18.84% (65) | 31.30% (108) | 49.86% (172) |
| + IT-Refs | 22.65% (77) | 31.77% (108) | 45.59% (155) |
| Challenge Type | Description |
|---|---|
| Different Granularity | The generated schema might be a high-level category (e.g. “data types”), while the reference schema includes more specific aspects (e.g. “image”, “text”, “audio”, etc.) |
| Different topics | The generated schema might have a different variety of topics than the reference schema (e.g. {“model architecture”, “dataset used”, “performance metric”} versus just dataset properties {“color”, “context”}) |
| Complex Aspects | Aspects combine information from multiple cells, which can mislead the value generator. E.g. “dataset size” leads to some values pertaining to training data and others to test data. |
| Overly Specific | A predicted aspect might only apply to one paper |
7 Related Work
7.1 Schema Generation for Literature Review
Synthesizing schemas from research papers has been previously studied in contexts like identifying relations between papers Shahaf et al. (2012); Lee et al. (2024), organizing research threads (Kang et al., 2023), discovering papers for ideation (Hope et al., 2022; Kang et al., 2022), or constructing intermediate scaffolds for better multi-document summarization Shah et al. (2021). These works often assume fixed or sparse schemas, focus on a sub-component of schema generation, or do not evaluate intermediate tables. More closely related to our work, SciDaSynth is an interactive interface for creating “data tables” from a set of papers Wang et al. (2024), which infers aspects from users’ questions about the papers. However, identifying and articulating good comparison aspects can be nontrivial for users, motivating our aim of automatically inducing salient aspects. Hashimoto et al. (2017) explore automated aspect extraction for literature review tables and point out that more specific aspects are useful but hard to generate.
7.2 Datasets for Scientific Table Generation
Prior work has also released datasets of tables Bai et al. (2023); Gupta et al. (2023). Bai et al. (2023) build a dataset of numeric result tables, while Gupta et al. (2023) release 4.4k distantly supervised and 1.5k manually annotated tables with material compositions from papers. Unlike \tableIconarxivDIGESTables, these datasets do not necessarily link tables to input papers. Multi-document summarization datasets, like Multi-XScience (Lu et al., 2020) and MS^2 (DeYoung et al., 2021), are related to table generation but yield sparse tables or use fixed schemas. Finally, there are datasets for other table-related tasks such as table extraction from PDFs Gemelli et al. (2023), table retrieval Gao and Callan (2017), column annotation Korini et al. (2022), table-to-text generation Moosavi et al. (2021), table transformation Chen et al. (2021), and table generation Wu et al. (2022). However, these datasets either do not focus on scientific tasks or comparing papers.
7.3 Automated evaluation using LMs
As LMs have improved, they have also increasingly been used for automatic evaluation across NLP tasks, including summarization and QA that our work is similar to Zhang et al. (2020); Wang et al. (2023); Lu et al. (2024); Zheng et al. (2024); Murahari et al. (2024). Some work on table generation has used a combination of automated and human evaluation. Hashimoto et al. (2017) use ROUGE (Lin, 2004) and human evaluation (Nenkova et al., 2007) to evaluate generated summaries of a table. Zhang and Balog (2018) evaluates schema selection via automatic entity ranking using ground truth entities. These works largely focus on measuring content overlap, whereas our automated metric incorporates table structure and context and our human evaluation focuses on downstream utility.
8 Conclusion
Language models have the potential to help scientists organize papers during literature review by synthesizing tables with schemas that aid comparison. In this work, we curate \tableIconarxivDIGESTables, a dataset of such tables and additional contexts that can be used to evaluate systems’ abilities to produce such tables. We present DecontextEval, an automatic evaluation framework for comparing model-generated and human-authored reference tables. We then use this evaluation framework to investigate two research questions: what context is needed to reconstruct human-authored tables, and whether generated aspects that don’t align with references are also useful, specific and insightful. We release our artifacts to help spur development of literature review table generation systems, and seed potential for their role in evaluating systems’ scientific synthesis abilities.
Limitations
We only study scientific papers from ArXiv.
While in theory, scientists in many fields produce literature review tables, we restrict our reference tables to ones that we can scrape from ArXiv. This means many of the papers in our dataset come from fields that are most represented on ArXiv (e.g. computer science) and fewer come from medicine, humanities, or social science publications. Additionally, all of the tables in our high quality set are in English, even though literature review tables may also be used in other languages.
Reconstructing tables is difficult.
While DecontextEval is effective at matching generated and reference table columns, and we test providing different additional context to steer the table generation models, many generated table columns do not match with the reference columns. Though we presented a human evaluation protocol that showed utility for generated columns that do not match the reference columns, such evaluation is costly. Future work should investigate automatic metrics that correlate with human utility evaluations as well.
Ethical Considerations and Broader Impact
Generated literature review tables might misrepresent authors’ work.
Generating literature review tables requires taking aspects of papers out of their original context to show them to users. Similar to summarization, this process has the potential to misrepresent the original work either due to the table cell values not having enough context, or less accurate models introducing hallucinations. Additional checks would have to be implemented if such tables were to be deployed in user-facing situations.
Literature review tables may discourage reading original sources.
The resource we present is meant to encourage the development of methods to construct literature review tables. If the field iterates on this task and develops systems that perform very well, the tables may have all of the information that a given reader wants to see. This could discourage readers from finding the original source of the claims. That said, the rows in the tables in our benchmark do include citations, so readers can trace values back to their sources. However, readers are not guaranteed to follow these citations, so generated tables could encourage poor scholarly practices.
References
- Achiam et al. (2023) OpenAI Josh Achiam, Steven Adler, Sandhini Agarwal, Lama Ahmad, Ilge Akkaya, Florencia Leoni Aleman, Diogo Almeida, Janko Altenschmidt, Sam Altman, Shyamal Anadkat, and Red Avila et al. 2023. Gpt-4 technical report.
- Ahuja et al. (2022) Ojas Ahuja, Jiacheng Xu, Akshay Gupta, Kevin Horecka, and Greg Durrett. 2022. ASPECTNEWS: Aspect-oriented summarization of news documents. In Proceedings of the 60th Annual Meeting of the Association for Computational Linguistics (Volume 1: Long Papers), pages 6494–6506, Dublin, Ireland. Association for Computational Linguistics.
- Bai et al. (2023) Fan Bai, Junmo Kang, Gabriel Stanovsky, Dayne Freitag, and Alan Ritter. 2023. Schema-driven information extraction from heterogeneous tables. ArXiv, abs/2305.14336.
- Bornmann et al. (2021) Lutz Bornmann, Robin Haunschild, and Rüdiger Mutz. 2021. Growth rates of modern science: a latent piecewise growth curve approach to model publication numbers from established and new literature databases. Humanities and Social Sciences Communications, 8(1):1–15.
- Chen et al. (2021) Mingda Chen, Sam Wiseman, and Kevin Gimpel. 2021. WikiTableT: A large-scale data-to-text dataset for generating Wikipedia article sections. In Findings of the Association for Computational Linguistics: ACL-IJCNLP 2021, pages 193–209, Online. Association for Computational Linguistics.
- Choi et al. (2021) Eunsol Choi, Jennimaria Palomaki, Matthew Lamm, Tom Kwiatkowski, Dipanjan Das, and Michael Collins. 2021. Decontextualization: Making sentences stand-alone. Transactions of the Association for Computational Linguistics, 9:447–461.
- Dasigi et al. (2021) Pradeep Dasigi, Kyle Lo, Iz Beltagy, Arman Cohan, Noah A. Smith, and Matt Gardner. 2021. A dataset of information-seeking questions and answers anchored in research papers. In Proceedings of the 2021 Conference of the North American Chapter of the Association for Computational Linguistics: Human Language Technologies, pages 4599–4610, Online. Association for Computational Linguistics.
- DeYoung et al. (2021) Jay DeYoung, Iz Beltagy, Madeleine van Zuylen, Bailey Kuehl, and Lucy Lu Wang. 2021. MS^2: Multi-document summarization of medical studies. In Proceedings of the 2021 Conference on Empirical Methods in Natural Language Processing, pages 7494–7513, Online and Punta Cana, Dominican Republic. Association for Computational Linguistics.
- Gao and Callan (2017) Kyle Yingkai Gao and Jamie Callan. 2017. Scientific table search using keyword queries. ArXiv, abs/1707.03423.
- Gemelli et al. (2023) Andrea Gemelli, Emanuele Vivoli, and Simone Marinai. 2023. CTE: A dataset for contextualized table extraction. Preprint, arXiv:2302.01451.
- Gupta et al. (2023) Tanishq Gupta, Mohd Zaki, Devanshi Khatsuriya, Kausik Hira, N M Anoop Krishnan, and Mausam. 2023. DiSCoMaT: Distantly supervised composition extraction from tables in materials science articles. In Proceedings of the 61st Annual Meeting of the Association for Computational Linguistics (Volume 1: Long Papers), pages 13465–13483, Toronto, Canada. Association for Computational Linguistics.
- Hashimoto et al. (2017) Hayato Hashimoto, Kazutoshi Shinoda, Hikaru Yokono, and Akiko Aizawa. 2017. Automatic generation of review matrices as multi-document summarization of scientific papers. In BIRNDL@SIGIR.
- Hope et al. (2022) Tom Hope, Ronen Tamari, Daniel Hershcovich, Hyeonsu B Kang, Joel Chan, Aniket Kittur, and Dafna Shahaf. 2022. Scaling creative inspiration with fine-grained functional aspects of ideas. In Proceedings of the 2022 CHI Conference on Human Factors in Computing Systems, pages 1–15.
- Jinha (2010) Arif E Jinha. 2010. Article 50 million: an estimate of the number of scholarly articles in existence. Learned publishing, 23(3):258–263.
- Kang et al. (2022) Hyeonsu B Kang, Xin Qian, Tom Hope, Dafna Shahaf, Joel Chan, and Aniket Kittur. 2022. Augmenting scientific creativity with an analogical search engine. ACM Transactions on Computer-Human Interaction, 29(6):1–36.
- Kang et al. (2023) Hyeonsu B Kang, Tongshuang Wu, Joseph Chee Chang, and Aniket Kittur. 2023. Synergi: A mixed-initiative system for scholarly synthesis and sensemaking. In Proceedings of the 36th Annual ACM Symposium on User Interface Software and Technology, pages 1–19.
- Kinney et al. (2023) Rodney Kinney, Chloe Anastasiades, Russell Authur, Iz Beltagy, Jonathan Bragg, Alexandra Buraczynski, Isabel Cachola, Stefan Candra, Yoganand Chandrasekhar, Arman Cohan, et al. 2023. The semantic scholar open data platform. arXiv preprint arXiv:2301.10140.
- Korini et al. (2022) Keti Korini, Ralph Peeters, and Christian Bizer. 2022. Sotab: the wdc schema. org table annotation benchmark. In CEUR Workshop Proceedings, volume 3320, pages 14–19. RWTH Aachen.
- Kwiatkowski et al. (2019) Tom Kwiatkowski, Jennimaria Palomaki, Olivia Redfield, Michael Collins, Ankur Parikh, Chris Alberti, Danielle Epstein, Illia Polosukhin, Jacob Devlin, Kenton Lee, Kristina Toutanova, Llion Jones, Matthew Kelcey, Ming-Wei Chang, Andrew M. Dai, Jakob Uszkoreit, Quoc Le, and Slav Petrov. 2019. Natural questions: A benchmark for question answering research. Transactions of the Association for Computational Linguistics, 7:452–466.
- Lee et al. (2024) Yoonjoo Lee, Hyeonsu B Kang, Matt Latzke, Juho Kim, Jonathan Bragg, Joseph Chee Chang, and Pao Siangliulue. 2024. Paperweaver: Enriching topical paper alerts by contextualizing recommended papers with user-collected papers. In Proceedings of the CHI Conference on Human Factors in Computing Systems, pages 1–19.
- Lee et al. (2023) Yoonjoo Lee, Kyungjae Lee, Sunghyun Park, Dasol Hwang, Jaehyeon Kim, Hong-in Lee, and Moontae Lee. 2023. QASA: advanced question answering on scientific articles. In Proceedings of the 40th International Conference on Machine Learning, ICML’23. JMLR.org.
- Lin (2004) Chin-Yew Lin. 2004. ROUGE: A package for automatic evaluation of summaries. In Text Summarization Branches Out, pages 74–81, Barcelona, Spain. Association for Computational Linguistics.
- Liu et al. (2023) Hongbo Liu, Mingda Wu, Kun Yuan, Ming Sun, Yansong Tang, Chuanchuan Zheng, Xing Wen, and Xiu Li. 2023. Ada-dqa: Adaptive diverse quality-aware feature acquisition for video quality assessment. In Proceedings of the 31st ACM International Conference on Multimedia, MM ’23, page 6695–6704, New York, NY, USA. Association for Computing Machinery.
- Lu et al. (2020) Yao Lu, Yue Dong, and Laurent Charlin. 2020. Multi-XScience: A large-scale dataset for extreme multi-document summarization of scientific articles. In Proceedings of the 2020 Conference on Empirical Methods in Natural Language Processing (EMNLP), pages 8068–8074, Online. Association for Computational Linguistics.
- Lu et al. (2024) Yujie Lu, Xianjun Yang, Xiujun Li, Xin Eric Wang, and William Yang Wang. 2024. Llmscore: Unveiling the power of large language models in text-to-image synthesis evaluation. Advances in Neural Information Processing Systems, 36.
- Luan et al. (2018) Yi Luan, Luheng He, Mari Ostendorf, and Hannaneh Hajishirzi. 2018. Multi-task identification of entities, relations, and coreference for scientific knowledge graph construction. In Proceedings of the 2018 Conference on Empirical Methods in Natural Language Processing, pages 3219–3232, Brussels, Belgium. Association for Computational Linguistics.
- Mistral AI (2024) Mistral AI. 2024. Mixtral of experts. https://mistral.ai/news/mixtral-of-experts/. Accessed on March 25, 2024.
- Moosavi et al. (2021) Nafise Sadat Moosavi, Andreas Rücklé, Dan Roth, and Iryna Gurevych. 2021. SciGen: a dataset for reasoning-aware text generation from scientific tables. In NeurIPS Datasets and Benchmarks.
- Murahari et al. (2024) Vishvak Murahari, Ameet Deshpande, Peter Clark, Tanmay Rajpurohit, Ashish Sabharwal, Karthik Narasimhan, and Ashwin Kalyan. 2024. QualEval: Qualitative evaluation for model improvement. In Proceedings of the 2024 Conference of the North American Chapter of the Association for Computational Linguistics: Human Language Technologies (Volume 1: Long Papers), pages 2093–2111, Mexico City, Mexico. Association for Computational Linguistics.
- Nenkova et al. (2007) Ani Nenkova, Rebecca Passonneau, and Kathleen McKeown. 2007. The pyramid method: Incorporating human content selection variation in summarization evaluation. ACM Transactions on Speech and Language Processing (TSLP), 4(2):4–es.
- Newman et al. (2023) Benjamin Newman, Luca Soldaini, Raymond Fok, Arman Cohan, and Kyle Lo. 2023. A question answering framework for decontextualizing user-facing snippets from scientific documents. In Proceedings of the 2023 Conference on Empirical Methods in Natural Language Processing, pages 3194–3212, Singapore. Association for Computational Linguistics.
- Open AI (2022) Open AI. 2022. Introducing ChatGPT. https://openai.com/index/chatgpt/. Accessed on March 25, 2024.
- Reimers and Gurevych (2019) Nils Reimers and Iryna Gurevych. 2019. Sentence-bert: Sentence embeddings using siamese bert-networks. In Proceedings of the 2019 Conference on Empirical Methods in Natural Language Processing. Association for Computational Linguistics.
- Russell et al. (1993) Daniel M. Russell, Mark J. Stefik, Peter Pirolli, and Stuart K. Card. 1993. The cost structure of sensemaking. In Proceedings of the INTERACT ’93 and CHI ’93 Conference on Human Factors in Computing Systems, CHI ’93, page 269–276, New York, NY, USA. Association for Computing Machinery.
- Saier et al. (2023) Tarek Saier, Johan Krause, and Michael Färber. 2023. unarXive 2022: All arXiv Publications Pre-Processed for NLP, Including Structured Full-Text and Citation Network. In 2023 ACM/IEEE Joint Conference on Digital Libraries (JCDL), pages 66–70, Los Alamitos, CA, USA. IEEE Computer Society.
- Shah et al. (2021) Darsh J. Shah, L. Yu, Tao Lei, and Regina Barzilay. 2021. Nutri-bullets hybrid: Consensual multi-document summarization. In North American Chapter of the Association for Computational Linguistics.
- Shahaf et al. (2012) Dafna Shahaf, Carlos Guestrin, and Eric Horvitz. 2012. Metro maps of science. In Proceedings of the 18th ACM SIGKDD international conference on Knowledge discovery and data mining, pages 1122–1130.
- Wang et al. (2023) Jiaan Wang, Yunlong Liang, Fandong Meng, Zengkui Sun, Haoxiang Shi, Zhixu Li, Jinan Xu, Jianfeng Qu, and Jie Zhou. 2023. Is ChatGPT a good NLG evaluator? a preliminary study. In Proceedings of the 4th New Frontiers in Summarization Workshop, pages 1–11, Singapore. Association for Computational Linguistics.
- Wang et al. (2024) Xingbo Wang, Samantha L Huey, Rui Sheng, Saurabh Mehta, and Fei Wang. 2024. SciDaSynth: Interactive structured knowledge extraction and synthesis from scientific literature with large language model. arXiv preprint arXiv:2404.13765.
- Wu et al. (2022) Xueqing Wu, Jiacheng Zhang, and Hang Li. 2022. Text-to-table: A new way of information extraction. In Proceedings of the 60th Annual Meeting of the Association for Computational Linguistics (Volume 1: Long Papers), pages 2518–2533, Dublin, Ireland. Association for Computational Linguistics.
- Xu and Lapata (2020) Yumo Xu and Mirella Lapata. 2020. Coarse-to-fine query focused multi-document summarization. In Proceedings of the 2020 Conference on Empirical Methods in Natural Language Processing (EMNLP), pages 3632–3645, Online. Association for Computational Linguistics.
- Yang et al. (2023) Xianjun Yang, Kaiqiang Song, Sangwoo Cho, Xiaoyang Wang, Xiaoman Pan, Linda Petzold, and Dong Yu. 2023. OASum: Large-scale open domain aspect-based summarization. In Findings of the Association for Computational Linguistics: ACL 2023, pages 4381–4401, Toronto, Canada. Association for Computational Linguistics.
- Zhang and Balog (2018) Shuo Zhang and Krisztian Balog. 2018. On-the-fly table generation. The 41st International ACM SIGIR Conference on Research & Development in Information Retrieval.
- Zhang et al. (2020) Tianyi Zhang, Varsha Kishore, Felix Wu, Kilian Q. Weinberger, and Yoav Artzi. 2020. Bertscore: Evaluating text generation with bert. In International Conference on Learning Representations.
- Zheng et al. (2024) Lianmin Zheng, Wei-Lin Chiang, Ying Sheng, Siyuan Zhuang, Zhanghao Wu, Yonghao Zhuang, Zi Lin, Zhuohan Li, Dacheng Li, Eric P. Xing, Hao Zhang, Joseph E. Gonzalez, and Ion Stoica. 2024. Judging llm-as-a-judge with mt-bench and chatbot arena. In Proceedings of the 37th International Conference on Neural Information Processing Systems, NIPS ’23, Red Hook, NY, USA. Curran Associates Inc.
- Zhong et al. (2021) Ming Zhong, Da Yin, Tao Yu, Ahmad Zaidi, Mutethia Mutuma, Rahul Jha, Ahmed Hassan Awadallah, Asli Celikyilmaz, Yang Liu, Xipeng Qiu, and Dragomir Radev. 2021. QMSum: A new benchmark for query-based multi-domain meeting summarization. In Proceedings of the 2021 Conference of the North American Chapter of the Association for Computational Linguistics: Human Language Technologies, pages 5905–5921, Online. Association for Computational Linguistics.
Appendix A Data Processing
A.1 XML Parsing
At this point in the pipeline, the tables we are considering are represented in XML format. Unfortunately, sometimes XML-formatted tables have column headers that span multiple rows, rows can have insufficient numbers of columns, cells may span multiple columns rows, etc. This makes it hard to enforce Desiderata 3. To address these difficulties, we design heuristics to parse the XML formatted tables into a JSON object that allows us to directly index the tables by paper and aspect. Our heuristics cannot be completed for all tables—sometimes they fail completely, and other times they fail on particular rows. We also experimented using GPT-4 (Achiam et al., 2023) for these difficult cases, but still found errors due to insufficient layout information being maintained in the conversion from LaTeX source to XML.
A.2 High Quality Data Filters
To achieve our set of tables, we apply a number of stringent filters. We remove any tables whose headers came from merging two rows or that have a row without a citation to avoid misformatted tables. We also deduplicate the tables using an exact string match on all columns minus the references column, and deduplicate individual rows (which includes citations). To meet Desiderata 2, and avoid filtering out tables that have empirical results, we filter out any columns that have floating point numbers, formulas, or figures. After these steps, we remove any tables that have fewer than two citations, rows or columns, leaving us with our final set.
A.3 Medium Quality Data Filters
In addition to our high-quality dataset that is likely to meet our desiderata, we also release a larger set of 22,283 tables with fewer filters. These tables are not manually checked, are filtered less stringently, and do not have linked full-texts. In particular:
-
•
Papers in rows are required to have titles and abstracts, but not required to have full-texts. This potentially makes value generation difficult because all of the values have to come from the title and abstract.
-
•
Tables are not required to have in-text references. This potentially makes schema generation difficult, as any additional context has to come from the caption (if present).
-
•
Tables with at most one row with no citation are allowed, as opposed to all rows having citations.
-
•
Tables with multi-row or hierarchical headers are allowed. These can sometimes lead to misformatted tables.
A.4 Field of Study
A full break-down of the fields of study represented in the high-quality dataset is in Table 6.
| Field | Count |
|---|---|
| Computer Science | 1985 |
| Electrical Engineering and Systems Science | 131 |
| Physics | 51 |
| Quantitative Biology | 24 |
| Statistics | 19 |
| Math | 14 |
| Quantitative Finance | 3 |
| Economics | 1 |
A.5 Example Data Instance
Below is an example instance from \tableIconarxivDIGESTables. (Some of the keys rephrased and values are elided for clarity)
Appendix B Prompts
B.1 Prompt for table generation (Baseline)
B.2 Prompt for schema generation
System prompt is the same as the one from table generation.
B.2.1 Schema generation with generated captions
B.2.2 Schema generation with caption and in-text references
Generation of schemas with captions does not include the in-text references part in the prompt below. This prompt is when the number of in-text references is
B.2.3 Schema generation with few-shot examples
B.3 Prompt for value generation
Using this strategy to generate values for columns requires the creation of questions describing the corresponding columns, for which we follow a two-step generation process. First, we prompt an LLM, specifically GPT-4-Turbo to generate descriptions for every column conditioned on additional context (either reference captions, or reference captions and in-text references). For the setting that does not use any additional context, this step is skipped.
Then, LLMs are prompted to rewrite generated definitions as concise queries. For the no-context setting, we use a simple template to produce queries containing the column name.
Our preliminary experiments show that the value generation module often returns empty values (in cases on average), which motivates us to add a retry policy. Under this policy, we generate four additional queries with minor rephrasing and retry value generation with them. We observe that this reduces the proportion of empty values to . If all retries produce empty values, we return an empty value.
B.4 Prompt for Llama-3 Scorer for Automatic Evaluation
B.5 LM Prompting Details
Truncation and Error Handling.
As our evaluation tests language models’ capabilities of schema rediscovery, we implemented strategies for handling other types of errors from language model generation (e.g., a different number number of schemas between generated and reference tables, or the format of the generated output not matching with a format given in the prompt). We take both preventative as well as fall-back measures to deal with these errors:
-
1.
Preventative: To address the issue of generating tables when context window might be insufficient due to the large number of input papers, we adopted the following approach by: (1) dividing the paper sets into smaller batches to ensure the total length of input papers does not exceed the context window size, (2) dividing the columns that need to be created into smaller batches to ensure the total number of columns from whole batches does not exceed the number of columns in human-authored tables, and (3) subsequently joining these smaller tables together without the need for further generation. The batch size is chosen based on the model and input paper representation. In general, though, we used a threshold of 20 abstracts per batch, determined by using the average length of the top 20% longest abstracts to ensure that even long abstracts could fit within the context along with the in-context examples and prompts. We also set the number of max tokens as high as the model can handle.
-
2.
Fall-back: When encountering an error, we retry querying the model with the same prompt, and due to stochasticity in the generation process, models occasionally recover. The errors we handled with fallback strategies are as follows: (1) when the output doesn’t align with the format specified in the prompt, (2) when the number of schemas, papers, and values don’t match the reference table, and (3) when the entire context exceeds the context window of the base model.
-
3.
Removal: We allow up to five retries before abandoning the input.
Appendix C Human Evaluation
When performing human evaluation for the novel schema, we assessed each column based on the following criteria:
-
•
Usefulness: the degree to which this column helps in understanding and comparing the set of input papers.
-
•
Specificity: the degree to which a column is specific to the particular set of input papers, rather than applying to any generic set of papers.
-
•
Insightfulness: the degree to which a column is about novel and deep aspects. An insightful column goes beyond surface-level information and captures novel or unexpected aspects (e.g., “Method” column may be useful, but it may not be considered highly insightful.)
The annotation interface used was created using Streamlit888https://streamlit.io/ and can be found in Figure 8.
Appendix D Qualitative Error Analysis
For each of the error types listed in Table 5, we include a generated table that illustrates the error and a reference table when appropriate.
| Reference: | |||
|---|---|---|---|
| Tasks | # categories | evaluation metric | |
| 765adbf | fine-grained | 100 | mean accuracy |
| 4fe680c | face | 9,131 | - |
| Generated: | |||
|---|---|---|---|
| Source dataset | Target dataset | Number of images | |
| 765adbf | FGVC-Aircraft | FGVC-Aircraft | 10,000 images of airplanes |
| 4fe680c | VGGFace2 | VGGFace2 | 3.31 million images |
| Reference: | ||||||||||
|---|---|---|---|---|---|---|---|---|---|---|
| Dataset | Year | Data size | Image | Text | Tags | Video | Audio | 3D Model | ||
| 3919117 | Twitter100K | 2018 | 100,000 | - | - | - | - | |||
| 15514398 | Xmedia | 2018 | 12,000 | - |
| Generated: | |||
|---|---|---|---|
| Dataset Name | Dataset Size | Data Types | |
| 3919117 | Twitter100k | 100,000 image-text pairs | LDA, Bag-of-Word (BoW), … |
| 15514398 | XMedia, Wikipedia, … | 12,000 media instances | text, image, video, audio, 3D model |
| Reference: | |||||
|---|---|---|---|---|---|
| Classes | Signer | Videos | Videos per Class | Controlled | |
| 64745485 | 64 | 10 | 3200 | 50 | |
| 54446047 | 1000 | 11-45 | 25513 | 25 | × |
| Generated: | |||||||
|---|---|---|---|---|---|---|---|
| Sign Language | Dataset Size |
|
|||||
| 64745485 |
|
|
10 subjects | ||||
| 54446047 | Large-scale sign language dataset created | over 25,000 annotated videos | 222 subjects |
| Generated: | ||||
|---|---|---|---|---|
| Hate Speech Dataset | Misinformation Dataset | Number of Examples | ||
| 253018764 | Mentions […] Hate Speech Dataset | N/A | multiple hate speech datasets | |
| 10326133 | N/A | Introduces LIAR dataset… | 12,836 |