Representation Learning for Regime Detection in Block Hierarchical Financial Markets
Abstract
We consider financial market regime detection from the perspective of deep representation learning of the causal information geometry underpinning traded asset systems using a hierarchical correlation structure to characterise market evolution. We assess the robustness of three toy models: SPDNet, SPD-NetBN and U-SPDNet whose architectures respect the underlying Riemannian manifold of input block hierarchical SPD correlation matrices. Market phase detection for each model is carried out using three data configurations: randomised JSE Top 60 data, synthetically-generated block hierarchical SPD matrices and block-resampled chronology-preserving JSE Top 60 data 111See block-resampled chronology-preserving data set evaluation at: Orton (2024). We show that using a singular performance metric is misleading in our financial market investment use cases where deep learning models overfit in learning spatio-temporal correlation dynamics.
Keywords: deep manifold representation learning, SPD matrix classification, regime detection, block hierarchical structure
I Introduction
Recent financial crises have made it ever-more important to detect shifts in macroeconomic regimes as underpinned by the hierarchical latent features and non-linear causal relationships driving market evolution (Miori and Cucuringu, 2022; Papenbrock et al., 2021). Novel approaches have been developed to address the key problems related to the assumptions of Guassianity, stationarity, and the need to address robustness and reflexivity (Marti et al., 2016; Polakow et al., 2023).
Here we consider the SPDNet introduced by Huang and Gool (2016) to establish a benchmark for deep representation learning of the SPD manifold of hierarchical correlation matrices for regime detection. We compare this model’s performance to that of the SPDNetBN of Brooks et al. (2019) to determine whether regime classification accuracy improves as a function of the batchnorm respecting the Riemannian manifold upon which the SPD correlation matrices sit. Finally, the U-SPDNet (Wang et al., 2022) is considered to evaluate model capacity for latent block hierarchical feature extraction in conjunction with regime detection accuracy as a result of an augmented Riemannian autoencoder structure and increased information pass-through.
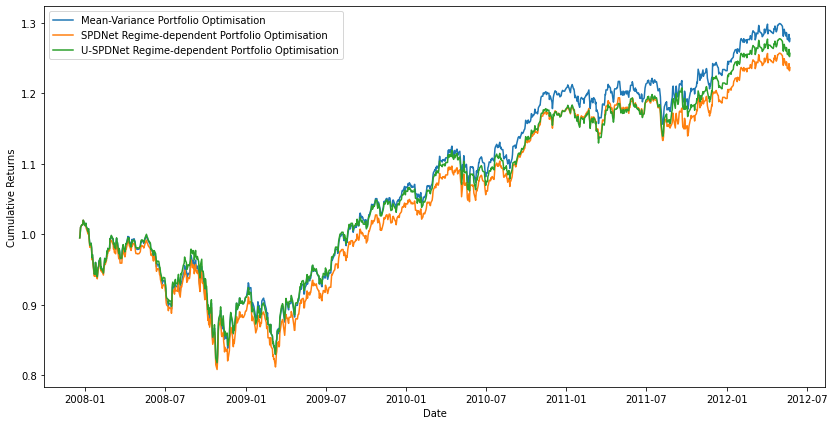
The real-world comparative scenario of Mean-Variance Portfolio Optimisation is then presented in Figure 11 to provide a use-case for using these models for regime-dependent portfolio construction. Backtesting on data adjusted for information leakage using purged and embargo reveals that U-SPDNet provides marginally larger returns than SPDNet, while both under-perform the equally-weighted benchmark portfolio (López de Prado, 2018).
II Data
II-A Empirical Data
To conduct a real-world application of the selected manifold learning techniques for regime classification, the set of daily equity returns of the top 60 high-capitalised stocks traded on the JSE over the period January 2000 - December 2023 is considered. JALSH price data are obtained via Bloomberg (BBG) which are then filtered according to a market capitalisation-determined ranking222See data processing code at: Orton and Gebbie (2024).
The JSE Top 60 stocks comprise an index of the most-traded stocks in the South African financial market. Considered through the lens of market regime detection, it is observed that the market passes through several significantly different structural periods characterised by particular price volatility dynamics. Specifically, stressed periods seen in 2007-2008 (Global Financial Crises), 2015-2016 and March 2020 (Covid-19) which were characterised by market downtrends and correspond with greater volatility periods in average price action.
This conforms with the work of Ang and Bekaert (2004), where bear markets are characterised by increased volatility. It is expected that the SPDNet, SPDNetBN and U-SPDNet models will be capable of detecting the differences between these stressed market states and their normal, or rally, counterparts which feature lower levels of price action volatility. We show that this is indeed the case.
II-B Synthetic Data
Synthetic correlation structures are generated using the method of Yelibi and Gebbie (2021) where multiple factors are incorporated in a nested fashion into the price time series model, or into the benchmark HNFM originally proposed by Tumminello et al. (2007). No time factor is incorporated in the generation of these timeseries or associated correlation matrices. These provide a set of counterfactual scenarios characterised only by a hierarchically nested structure, where no information lead-lag effects are present in determining the market regime.
Price returns processes are modelled with random variation in the factor sensitivity value in conjunction with additive perturbations in and values to construct 18,000 time series for 60 data features in order to mirror the real-world price action data set of BBG JSE top 60 equities for per computation window (Yelibi and Gebbie, 2021; Marti, 2020).
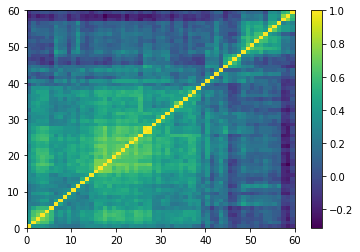
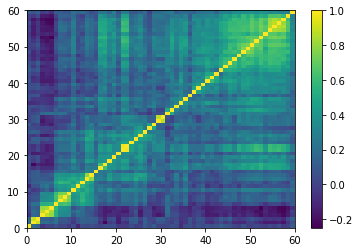
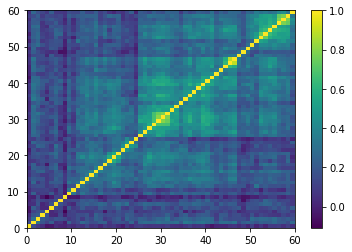
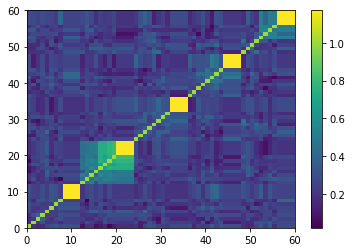
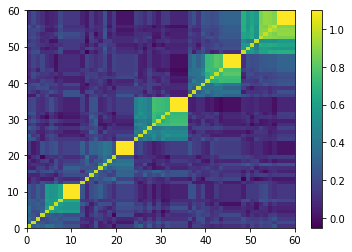
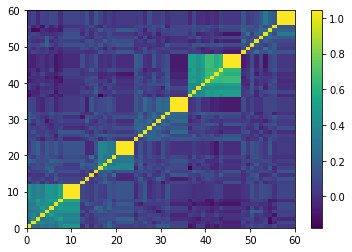
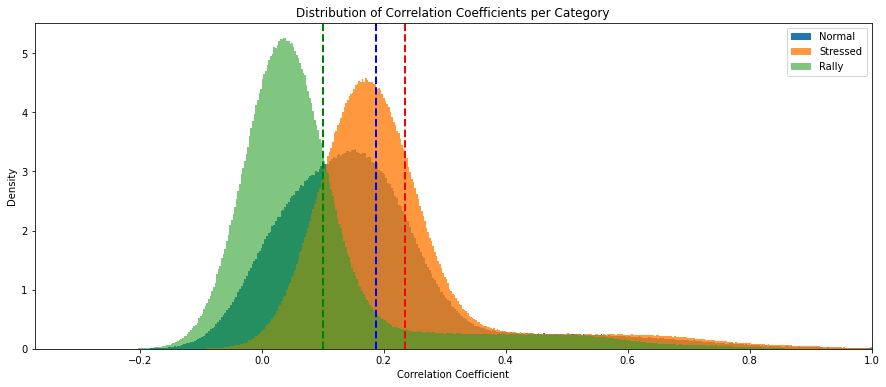
The correlation matrices computed on these synthetic time series preserve the SPD structure, and can then be used via a Cholesky factor decomposition-motivated Monte Carlo simulation to conduct the SR-guided market regime labelling (Papenbrock et al., 2021). In order to respect the empirically-determined and well-documented fat-tailed nature of financial asset returns time series, this simulation uses a Student-t distribution drawing from an -variate distribution with d.o.f such that (Marti et al., 2016). Having generated these time series, the correlation matrices are allocated to their relevant stressed, normal or rally category in accordance with the method of Marti (2021) (as in Figure 1 above) using the contemporaneous stock basket .
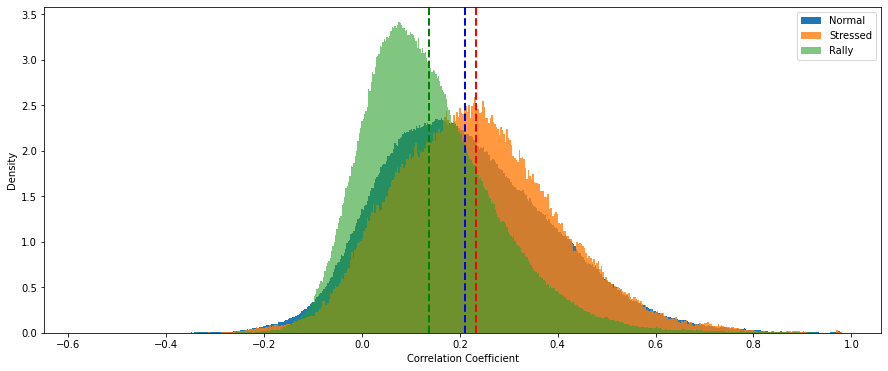
By construction, the synthetic SPD matrix correlation coefficients display distributions in line with the regime switching models introduced by Ang and Bekaert (2004) and identify different macroeconomic regimes being modeled via making draws from two or more possible underlying distributions. This set of distributions is fabricated in the interest of preserving the stylised facts of real-world regime correlation dynamics, and we report that this is evidenced by the closeness in market regime distributional patterns observed between the synthetic data and the empirical data. We note in particular that the synthetic matrices possess a hierarchical structure and their pairwise distributions are positively-shifted (See figures 2 and 4).
III Market Regimes
Market-timing strategies which exploit changing regime-specific underlying data distributions have been shown to add value to portfolio protection products e.g. TIPP and risk-off investment decisions; not only confined to those concerning equities (Ang and Bekaert, 2004; Papenbrock et al., 2021).
Ang and Bekaert (2004) identify two broad market regimes, namely normal and bear markets. Using regime switching (RS) asset returns model for portfolio asset allocation, the regimes are accurately reconstructed by assuming returns data points may be drawn from differing underlying data generation distributions, which supports the empirically-observed asymmetric correlation distribution. Recently, centrality measures computed on correlation coefficients representing evolving equity financial market networks have been employed in matrix clustering, regime detection and risk-diversified portfolio construction by extension (Borghesi et al., 2007).
Miori and Cucuringu (2022) extend these studies to returns correlations across multiple asset classes and establish a purely data-driven technique for distinguishing regimes. Influenced by spectral analysis techniques, cophenetic correlation matrices are constructed as correlations between the distance matrix found as where is Pearson’s linear correlation, sitting on the Euclidean manifold, and the associated dendrogram generated by a hierarchical linkage algorithm. Six regimes are uncovered via KMeans++ clustering using the elbow method for cluster number selection.
Here three classes of correlation matrices are generated by augmenting the original data which correspond to stressed, normal and rally market regimes. This marries the findings of Miori and Cucuringu (2022) and Ang and Bekaert (2004), and emulates the ’rule-of-thumb’ technique used by Marti (2021). By virtue of considering that three broad market regime categories have been detected in equity markets, and that the annualised of indices belonging to multiple asset classes differs significantly amongst six data-informed regimes, a categorisation system emerges for correlation matrix labelling.
IV Learning Accuracy
We evaluate the SPDNet-based models using both the ordered JSE top 60 correlation matrices and their block hierarchical synthetic data counterpart. Much is revealed by these initial experiments which provide a baseline specifically for market regime detection given the information contained in these datasets alone.
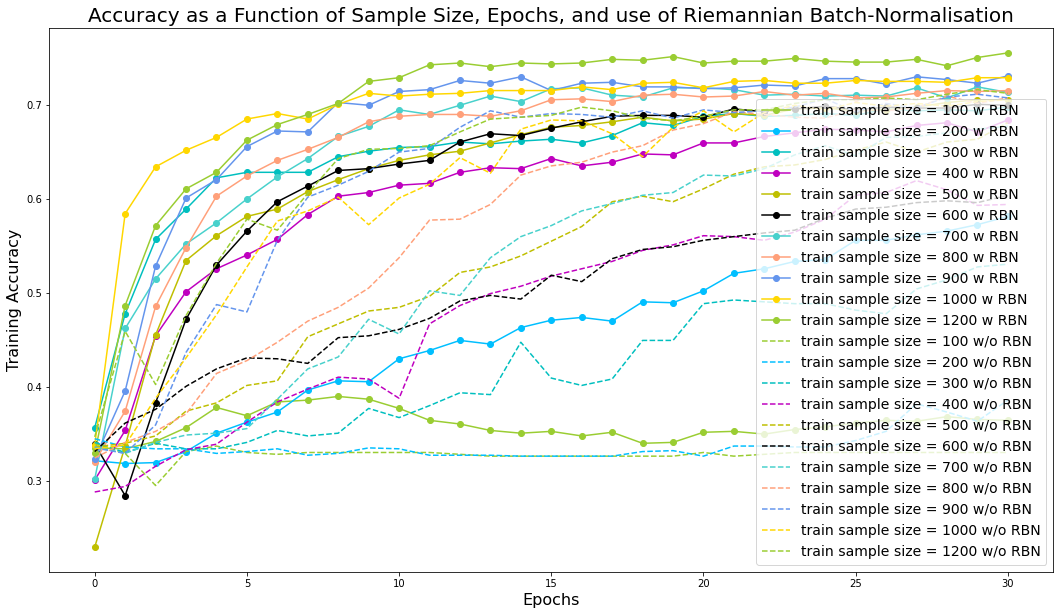
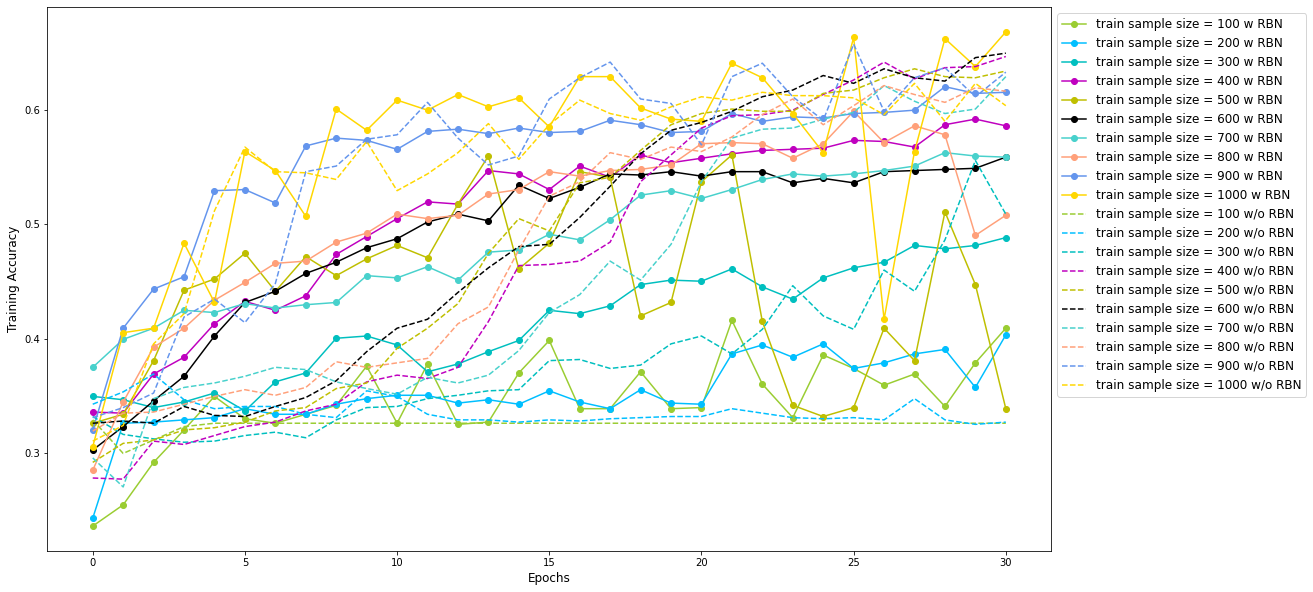
Firstly, in comparing the 2-layer 60, 20, 3 and 4-layer 60, 40, 20, 10, 3 configurations, it is clear that the introduction of Riemannian batchnorm layers improves the market state classification accuracy, irrespective of the dataset used for training, which confirms the findings of Brooks et al. (2019) where the integration of Riemannian batchnorm layers with the original SPDNet yielded greater radar image classification accuracy.
Furthermore, as identified by Wang et al. (2022), increased depth holds no relationship with improved classification accuracy since the performance measure convergence occurs within a narrow band around 71% and 66% for the real-world and synthetic data scenarios, respectively, irrespective of model depth. Model performance is weaker when the synthetic block hierarchical correlation matrices are used as training input when compared to average validation accuracies achieved for their real-world counterparts.
All SPDNet benchmark models converging on training accuracy values nearing 70% which resemble, and even improve on, those achieved when the self-same models are applied in the context of allocating correlation matrices computed from S&P 500 stock price returns to the stressed, normal and rally categories - as in the work of Marti (2021).
| Model | TMD | |
|---|---|---|
| SPDNet | {60, 20, 3} | |
| SPDNetBN | {60, 20, 3} | |
| SPDNet-3BiRe | {60, 40, 20, 10, 3} | |
| SPDNetBN-3BiRe | {60, 40, 20, 10, 3} | |
| U-SPDNet-6BiRe | {60, 40, 20, 10, 3} (**) |
| Model | Configs. | Emp. | Synth. |
|---|---|---|---|
| SPDNet | {60, 20, 3} | 68.95% | 66.80% |
| SPDNetBN | {60, 20, 3} | 72.46% | 65.92% |
| SPDNet-3BiRe | {60, 40, 20, 10, 3} | 69.50% | 64.94% |
| SPDNetBN-3BiRe | {60, 40, 20, 10, 3} | 70.71% | 66.20% |
| U-SPDNet-6BiRe | {60, 40, 20, 10, 3} (**) | 98.90% | 65.11% |


V Results
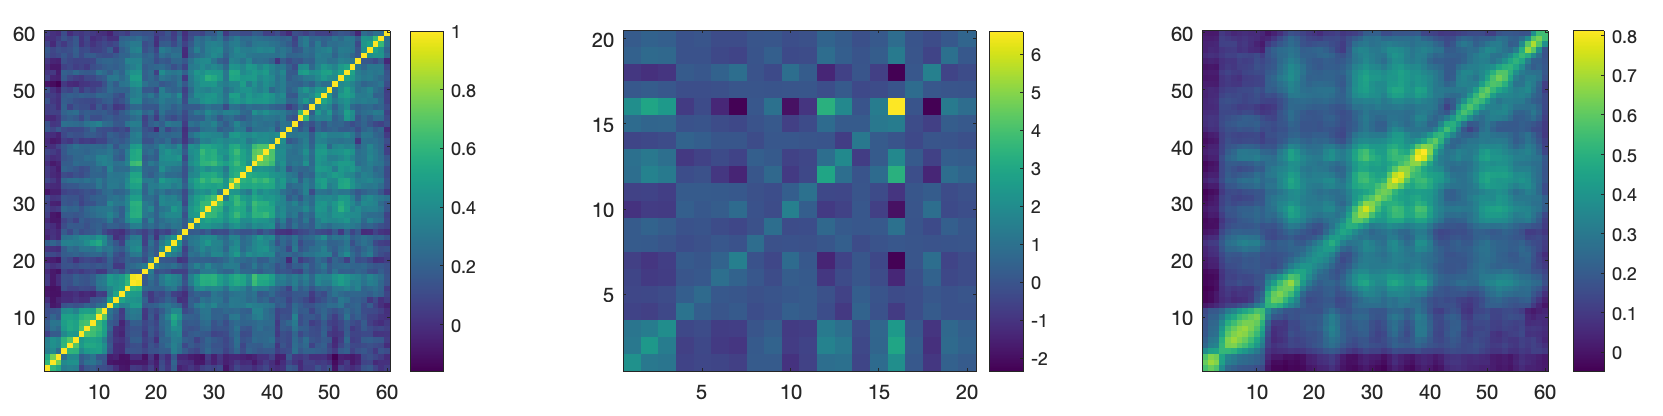
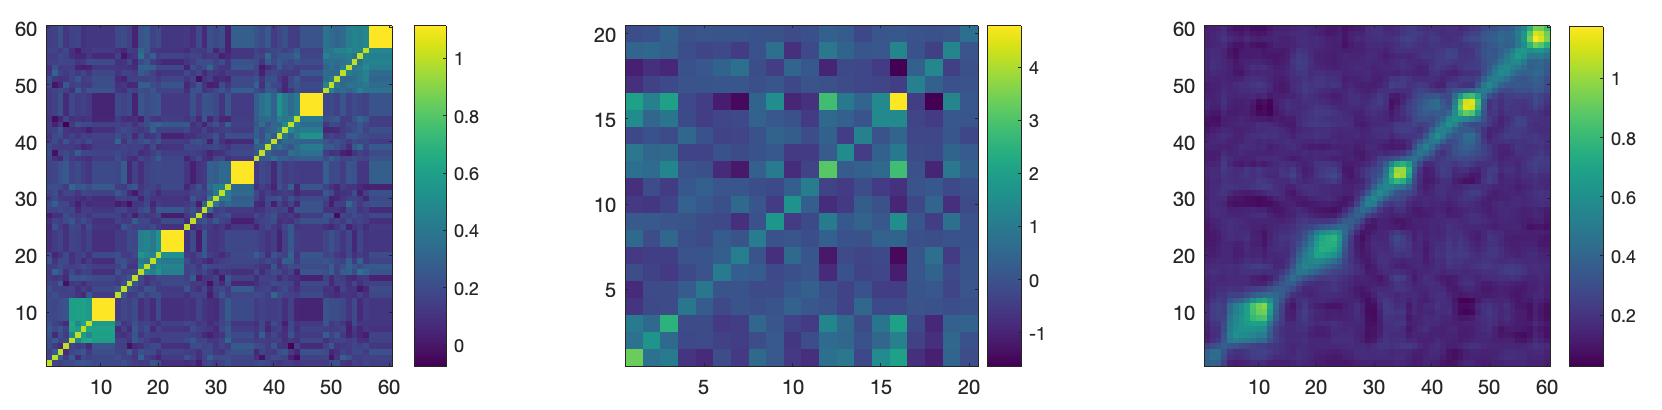
Figure 5 shows how the block hierarchical structure is maintained in the latent layer in both cases. In the JSE Top 60 data case, the reconstructed matrix preserves the block hierarchical structure, but a one-to-one information mapping is not perfectly achieved OOS. The extracted latent 20-feature layers show preservation of the block-hierarchical structure and meaningful statistical factor identification. The latent space matrices have similar structures with subtle differences, pointing to the U-SPDNet model as capturing a tractable underlying correlation information set on the SPD manifold which incorporates the temporal feature of the real world data in comparison to their synthetic counterparts.
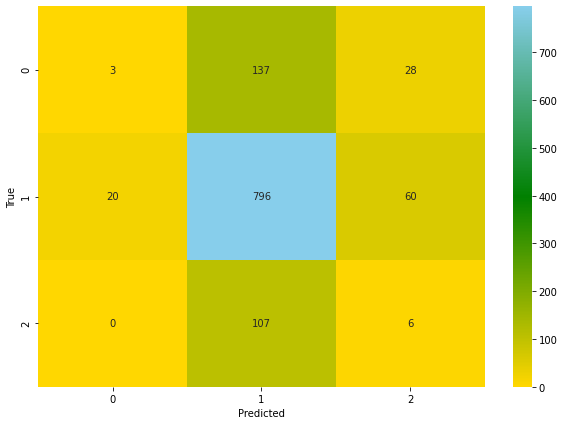
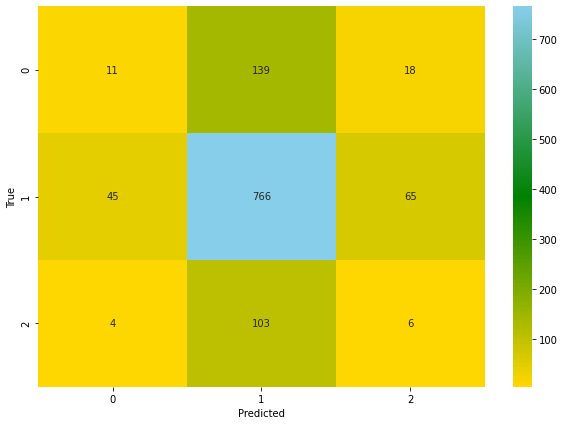
The confusion matrices in Figure 10 show that the superior prediction accuracy of the SPDNet OOS is a product of simply converging on a corner solution. This, despite generating many additional training samples to mitigate class imbalance, results in inaccurate predictions; the SPDNet fails in learning a representation of the hierarchical structure underpinning market evolution in different regimes as evidenced by it learning to place most test observations into the normal market regime. Thus, despite achieving lower regime detection accuracy,the U-SPDNet is more likely to have learned an improved information-geometric representation of the market’s hierarchical structure, which leads to marginally-greater state detection accuracy in stressed and rally classes.
VI Conclusion
[h!]
U-SPDNet performs improved latent feature extraction with better classification performance in stressed and rally market phases, but achieves lower OOS backtest scenario accuracy than that of the benchmark SPDNet. The SPDNet-based models fail in capturing the latent spatio-temporal block hierarchical correlation dynamics and deliver corner solutions across all input data sets. However, U-SPDNet is promising in terms of its utility in regime-dependent portfolio optimisation strategy generation as a model better-suited to capturing latent block hierarchical correlation structures arising from lead-lag causal feedback information loops that often drive the evolution of market regimes. Here we highlight the importance of avoiding reliance on accuracy as a robust model performance measure in the context of complex financial markets data.
Figure 11 shows the cumulative performance of the three portfolio optimisation strategies on the real-world JSE Top 60 dataset. Initially, the U-SPDNet delivers greatest returns; this regime-dependent daily rebalancing approach marginally outperforms the Mean-Variance portfolio until 2010. Thereafter, the Mean-Variance benchmark optimisation consistently outperforms both regime-dependent strategies. The SPDNet-informed regime-dependent optimisation performs worse particularly during market rally periods, which corresponds to this category being significantly under-detected by the model in the OOS period as shown in Figure 10.
VI-A Research Reproducibility
All code written in support of this research may be found at the Orton and Gebbie (2024) GitHub repository BH-SPD-CorrMat-Nets, or on the Deep Learning Block Hierarchical SPD Correlation Matrices for Regime Detection OSF project page https://osf.io/msrgc/ where data for both SPDNet, SPDNetBH and U-SPDNet model evaluation on both real world and synthetic data is stored. Required repositories:
- 1.
- 2.
- 3.
References
- Ang and Bekaert [2004] A. Ang and G. Bekaert. How regimes affect asset allocation. Financial analysts journal, 60(2):86–99, 2004. ISSN 0015-198X.
- Borghesi et al. [2007] C. Borghesi, M. Marsili, and S. Miccichè. Emergence of time-horizon invariant correlation structure in financial returns by subtraction of the market mode. Phys. Rev. E, 76:026104, Aug 2007. doi: 10.1103/PhysRevE.76.026104. URL https://link.aps.org/doi/10.1103/PhysRevE.76.026104.
- Brooks et al. [2019] D. A. Brooks, O. Schwander, F. Barbaresco, J. Schneider, and M. Cord. Riemannian batch normalization for SPD neural networks. CoRR, abs/1909.02414, 2019. URL http://arxiv.org/abs/1909.02414.
- Huang and Gool [2016] Z. Huang and L. V. Gool. A Riemannian Network for SPD Matrix Learning. CoRR, abs/1608.04233, 2016. URL http://arxiv.org/abs/1608.04233.
- López de Prado [2018] M. López de Prado. Advances in financial machine learning, volume 33. Wiley, New York, 2018. URL http://dx.doi.org/10.2139/ssrn.3257420.
- Marti [2020] G. Marti. Can we predict a market regime from correlation matrix features?, 2020. URL https://gmarti.gitlab.io/qfin/2020/09/04/correlation-matrix-features-market-regimes.html. Accessed on: May 20, 2024.
- Marti [2021] G. Marti. Classification of correlation matrices using spdnet with riemannian batch normalization, 2021. URL https://marti.ai/ml/2021/01/22/spdtorchnet.html. Accessed on Month Day, Year.
- Marti et al. [2016] G. Marti, F. Nielsen, P. Donnat, and S. Andler. On clustering financial time series: a need for distances between dependent random variables, 2016.
- Miori and Cucuringu [2022] D. Miori and M. Cucuringu. Returns-driven macro regimes and characteristic lead-lag behaviour between asset classes, 2022.
- Orton [2024] A. Orton. Representation Learning for Regime Detection in Block Hierarchical Financial Markets. Master’s thesis, Department of Statistical Sciences, University of Cape Town, 2024.
- Orton and Gebbie [2024] A. Orton and T. Gebbie. BH-SPD-CorrMat-Nets. GitHub, 2024. URL https://github.com/AlexaOrton/BH-SPD-CorrMat-Nets. Accessed on July 3, 2024.
- Papenbrock et al. [2021] J. Papenbrock, P. Schwendner, M. Jaeger, and S. Krügel. Matrix evolutions: Synthetic correlations and explainable machine learning for constructing robust investment portfolios. The journal of financial data science, 3(2):51–69, 2021. ISSN 2640-3943.
- Polakow et al. [2023] D. Polakow, T. Gebbie, and E. Flint. Epistemic limits of empirical finance: Causal reductionism and self-reference. SSRN, 33, 2023. doi: http://dx.doi.org/10.2139/ssrn.4646664. URL https://ssrn.com/abstract=4646664.
- Tumminello et al. [2007] M. Tumminello, F. Lillo, and R. N. Mantegna. Hierarchically nested factor model from multivariate data. Europhysics Letters (EPL), 78(3):30006, apr 2007. doi: 10.1209/0295-5075/78/30006. URL https://doi.org/10.1209/0295-5075/78/30006.
- Wang et al. [2022] R. Wang, X.-J. Wu, T. Xu, C. Hu, and J. Kittler. U-SPDNet: An SPD manifold learning-based neural network for visual classification. Neural Networks, 161:382–396, 2022. ISSN 0893-6080. doi: https://doi.org/10.1016/j.neunet.2022.11.030. URL https://www.sciencedirect.com/science/article/pii/S0893608022004713.
- Yelibi and Gebbie [2021] L. Yelibi and T. Gebbie. Agglomerative likelihood clustering. Journal of Statistical Mechanics: Theory and Experiment, 2021(11):113408, nov 2021. doi: 10.1088/1742-5468/ac3661. URL https://doi.org/10.1088/1742-5468/ac3661.