Tracking Outflow using Line-Locking (TOLL). I. The case study of Quasar J221531-174408
Abstract
Investigating line-locked phenomena within quasars is crucial for understanding the dynamics of quasar outflows, the role of radiation pressure in astrophysical flows, and the star formation history and metallicity of the early universe. We have initiated the Tracking Outflow by Line-Locking (TOLL) project to study quasar outflow by studying line-locking signatures using high-resolution high signal-to-noise ratio quasar spectra. In this paper, we present a case study of the line-locking signatures from QSO J221531-174408. The spectrum was obtained using the Very Large Telescope-UV Visual Echelle Spectrograph. We first identify associated absorbers in the spectrum using C iv, N v, and Si iv doublets and measure their velocity shifts, covering fractions, and column densities through line profile fitting technique. Then we compare the velocity separations between different absorbers, and detect nine pairs of line-locked C iv doublets, three pairs of line-locked N v doublets, and one pair of line-locked Si iv doublets. This is one of the four quasars known to possess line-locked signatures in C iv, Si iv, and N v at the same time. We also find three complex line-locked systems, where three to five absorbers are locked together through multi-ion doublets. Our study suggests that line-locking is a common phenomenon in the quasar outflows, and theoretical models involving more than two clouds and one ionic doublet are needed in the future to explain the formation of these complex line-locking signatures.
1 Introduction
Quasar outflows play a pivotal role in the evolution of galaxies as they supply kinetic-energy feedback from supermassive black holes to their respective host galaxies (Silk & Rees, 1998; Kauffmann & Haehnelt, 2000; King, 2003; Scannapieco & Oh, 2004; Di Matteo et al., 2005; Hopkins et al., 2008; Ostriker et al., 2010; Debuhr et al., 2012; Rupke & Veilleux, 2013; Rupke et al., 2017; Cicone et al., 2014; Weinberger et al., 2017; Giustini & Proga, 2019; He et al., 2022; Chen et al., 2022; Ayubinia et al., 2023; Naddaf et al., 2023; Hall et al., 2024). Line-locking describes a state where the observed velocity difference between distinct kinematic absorption components equals the velocity separation of known atomic transitions. This phenomenon, observed within these outflows, provides evidence that radiation pressure significantly influences the dynamics of the clumpy outflow clouds (Goldreich & Sargent, 1976). For example, Hamann et al. (2011) reported the detection of multiple narrow absorption line (NAL) systems toward a quasar, which are separated by the velocity separation of the C iv doublet (see also Lin & Lu, 2020a, b; Lu & Lin, 2020; Chen et al., 2021a; Yi et al., 2024). Line-locking corresponding to other transitions, such as O vi (Ganguly et al., 2003, 2013; Mas-Ribas, 2019; Mas-Ribas & Mauland, 2019) and N v (Srianand et al., 2002; Ganguly et al., 2003; Mas-Ribas, 2019; Mas-Ribas & Mauland, 2019; Veilleux et al., 2022; Juráňová et al., 2024), has also been reported. The comprehensive investigation conducted by Bowler et al. (2014) revealed that about two-thirds of quasars possessing multiple CIV absorption line systems show characteristics of line-locking, suggesting that such signatures are quite common in quasar outflows. However, a more recent examination by Chen et al. (2021a), utilizing high-resolution spectral data, indicated that this proportion is as low as 20 to 30 percent. Despite this discrepancy, the consensus remains that line-locking is a prevalent phenomenon. These findings are of great significance as they aid in understanding of the mechanisms propelling these outflows and their impact on galaxy evolution.
To explain the formation of line-locked signature within active galaxies and the underlying physics, Lewis & Chelouche (2023) have studied a simple two-clouds-one doublet model. They found that a fine-tuning between the parameters (e.g., column density, ionization parameter) of the two clouds is needed for line-locking to form. They emphasized that line-locking serves as a definitive indicator of the dynamical significance of radiation pressure in propelling astrophysical flows. Consequently, investigation these systems provides valuable insights into the role of radiation pressure in the acceleration and dynamics of outflows, which is essential for refining models related to quasar feedback and galaxy formation.
One obstacle to studying line-locking phenomena is that the intermediate widths and often shallow depths of the lines make them difficult to detect (and correctly identify) in spectroscopic surveys using moderate resolution and moderate-to-low signal-to-noise ratios (SNRs), such as those in the Baryon Oscillation Spectroscopic Survey in SDSS-III (Eisenstein et al., 2011; Dawson et al., 2013; Pâris et al., 2017). Thus, higher resolution spectra from large ground-based telescopes are crucial for studying line-locked absorption systems from quasars. This is indeed can be seen from Fig.3 in Yi et al. (2024), where the shallow C iv line-locking signatures are only detected in the higher-resolution HET/LRS-2 spectra. We have initiated the Tracking Outflow by Line-Locking (TOLL) project to analyze line-locked absorption systems using high-resolution, high-quality AGN spectra. The TOLL project will both analyze detailed properties of line-locked absorbers of individual quasar and conduct statistical distribution of line-locked absorbers for a large sample of quasars. In contrast to the study of Bowler et al. (2014), TOLL mainly utilize archived high-resolution, high-quality spectral observations of 700 quasars from Keck and VLT. Some of the spectra are reduced by our group, and the others are taken from Murphy et al. (2019) and O’Meara et al. (2015). The goal of TOLL is to study the quasar outflows from a microscopic point of view, i.e., focus on individual clumpy cloud, and investigate the gaseous environments of quasars. Here, we present our first case study of the TOLL project, where we simultaneously detected line-locking systems in C iv, N v, and Si iv doublets from the high-resolution spectrum of quasar J221531-174408.
The structure of this paper is outlined as follows: Section 2 introduces the UVES spectrum of J221531-174408 and the method employed for fitting the line profiles of associated absorption lines (AALs; Weymann et al., 1979; Foltz et al., 1986; Anderson et al., 1987; Weymann et al., 1991; Hamann, 1997) to measure the Doppler parameter, column densities, velocity shifts, and covering fractions of each absorber. In Section 3, we present the line-locking pairs detected in this paper and discuss the implications of our results concerning the study of the line-locking phenomenon. Section 4 concludes the paper with a summary. Throughout this paper, we utilize a cosmological model characterized by km s-1 Mpc -1, , and .
2 QUASAR SPECTRA and DATA ANALYSIS
2.1 Quasar Spectra
The parent sample of quasars for the TOLL project comes from the catalog presented in Chen et al. (2021b), which are originally obtained with VLT-UVES (Murphy et al., 2019) and Keck-HIRES (O’Meara et al., 2015). The spectral resolutions are in the range of for VLT-UVES. In the study of Chen et al. (2021b), every candidate mini-broad absorption line (mini-BAL) system has been checked for the contamination caused by an unrelated intervening absorption line system, such as the damped Ly (DLA) or Lyman limit systems (LLSs) formed in intervening galaxies or extended halos (e.g., Prochaska et al., 2015; Berg et al., 2015; Prochaska et al., 2008). We visually inspected both the normalized and un-normalized spectra of every quasar in the catalog, ultimately selecting J221531-174408 for this study due to its potential capability to reveal line-locked systems. Our primary objective is to investigate these line-locked systems to better understand the outflow dynamics in quasars.
Quasar J221531-174408 (also named QSO 2212-179, LBQS 2212-1759) is optically bright () and has a redshift of measured by (Morris et al., 1991). It was detected in the survey carried out by Savage & Bolton (1979) and was classified as a broad absorption line (BAL) quasar in the Hewitt and Burbidge catalog (Hewitt & Burbidge, 1987). The Large Bright QSO Survey Morris et al. (LBQS, 1991) measured the redshift and confirmed its quasar nature. Korista et al. (1993) studied the shape of its C iv BALs using the Double Spectrograph on the Hale 5m telescope on Mount Palomar. Quasar J221531-174408 was found to be X-ray weak after examining the survey data from ROSAT (Green et al., 1995) and the long exposure from XMM-Newton (Clavel et al., 2006). Gallagher et al. (2007) examined its mid-infrared and optical properties by constructing a radio through X-ray spectral energy distribution.
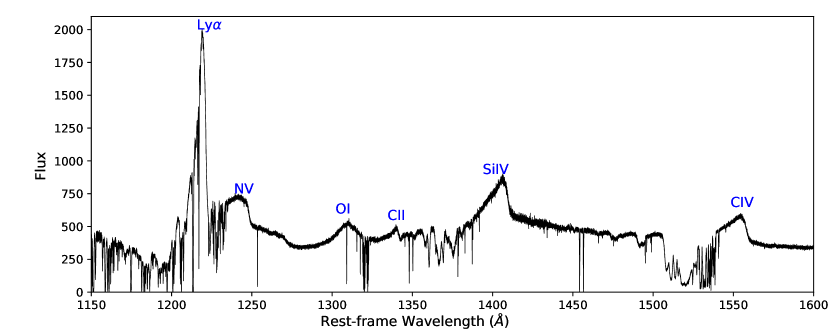
UVES is a dual-arm, grating cross-dispersed high-resolution optical echelle spectrograph mounted on the Nasmyth B focus of Unit Telescope 2 of the VLT (Dekker et al., 2000). The UVES observations of quasar J221531-174408 (PI: Petitjean; Program ID: 079.A-0251A, 381.A-0634B) were conducted in 2007 and 2008 under a medium seeing of 1.19 arcsec, with a total on-target exposure time of 47784 seconds (see also Murphy et al., 2019). Fourteen exposures were taken in the UVES standard configuration using the 1” slit, providing a spectral resolution of 40,000 (corresponding to a velocity resolution of 6.6 km s-1 FWHM) and wavelength coverage of 32839467 Å. Murphy et al. (2019) reduced the data using a modified version of the UVES reduction pipeline based on the optimally extracted method (Horne, 1986; Piskunov & Valenti, 2002; Zechmeister et al., 2014; Ma & Ge, 2019). We show the spectrum at the rest-frame wavelengths in Figure 1. We did not detect time-variable absorption lines from the fourteen exposures taken more than a year apart. Different observations then were combined to form a single spectrum with a dispersion of 2.5 km s-1 per pixel. The wavelength calibration is done using the ThAr technique (Murphy et al., 2007). The final continuum-normalized spectrum has a count-to-noise ratio of 21, 52, 51, 67, and 43 per per 2.5 km s-1 pixel at 3500, 4500, 5500, 6500, and 7500 Å.
2.2 Line Component Fits
To detect possible line-locked signatures in the AAL complexes of J221531-174408, we need to identify all possible absorption lines from the UVES spectrum and fit their line profiles. Before we identify AALs, we first examine the continuum placement provided in the UVES archive spectra around each line we intend to fit. When deemed necessary, we re-fit the continuum using a locally constrained simple power law near the line. We then identify individual velocity components in the AAL complexes starting with the C iv 1548, 1551 doublet. Finally, we search for other lines at these same redshifts, such as Si iv 1394, 1403, N v 1239, 1243, O vi 1032, 1038, and Lyman lines. We find AAL complexes of C iv 1548, 1551, Si iv 1394, 1403, and N v 1239, 1243 doublets from the UVES spectra of J221531-174408. Unfortunately, we cannot study O vi 1032, 1038 lines because part of the spectrum is missing due to gaps in wavelength coverage between the echelle orders. The spectrum may show Ly or Si iii 1207 lines, but they are singlets and heavily contaminated in the forest, making them difficult to identify. Conversely, we can also identifying some C iv components using other absorption lines. For example, C iv components 4 and 5 in Figure 2 are determined through Si iv lines. All lines identified in the spectra of quasar J221531-174408 are listed in Table 1.
We follow the exact line-fitting procedures described in Chen et al. (2018, 2019) to fit all the lines identified above. We limit our fitting to NALs only, excluding the first six C iv components due to their association with a much broader C iv BAL. Specifically, we fit every candidate C iv, Si iv, N v NAL using a Gaussian optical depth profile described by:
| (1) |
where is the optical depth at velocity , is the line center optical depth, is the line center velocity, and is the Doppler parameter. The two lines in the doublet are fitted simultaneously with the same velocity shift and values. We account for partial covering in our fitting by assuming a spatially uniform light source and homogeneous absorbing medium, with the same optical depth along every sightline. Thus, the observed intensity at velocity is given by:
| (2) |
where is the continuum intensity, is the measured intensity at velocity , and is the covering fraction of the absorbing medium across the emission source, such that (Ganguly et al., 1999; Hamann et al., 1997; Barlow et al., 1997). We also assume that the covering fraction is constant with velocity across the AAL profiles, i.e., , which is a good approximation for the narrow lines in our study. The fitting of most AALs in the J221531-174408 spectra is generally straightforward. However, the fitting procedure needs to be modified when an AAL system is heavily blended with other AAL systems or unrelated lines. For AALs blended with unrelated absorption lines at different redshifts, we mask the spectral regions containing these unrelated lines before fitting. When two or more doublets are blended together, we fit all these blended doublets simultaneously. These adjustments allows us to obtain consistently reliable fits for all identified AALs.
We then convert the fitted optical depths at the AAL line centroids to the column densities of C iv, Si iv and N v using the following relation:
| (3) |
where is the ion column density, is the oscillator strength of the corresponding doublet, is the line-center wavelength, and is the Doppler parameter. The fitting results and the column densities are presented in Table 1.
3 Results & Discussion
3.1 Line Fitting Parameters
Table 1 provides the fitted parameters and uncertainties of C iv, Si iv, and N v doublets in the quasar spectra of J221531-174408 from VLT-UVES. The table lists the measured quantities, which include the velocity shift, , line identification and rest wavelength, observation wavelength, Doppler parameter , logarithm of column density, and covering fraction for each of the C iv, Si iv, and N v doublet lines separately. Notes in the last column provide information on blends. The line data are organized in the table according to the redshifts, i.e., component numbers in the first column as depicted in Figures 2, 3 and 4. The uncertainties listed for most of the parameters are 1 errors output from the fitting code, which are due mainly to pixel-to-pixel noise fluctuations in the spectra. For extremely blended lines, we follow the same procedures described in Chen et al. (2018, 2019) to obtain direct estimates or limits on the parameter values.
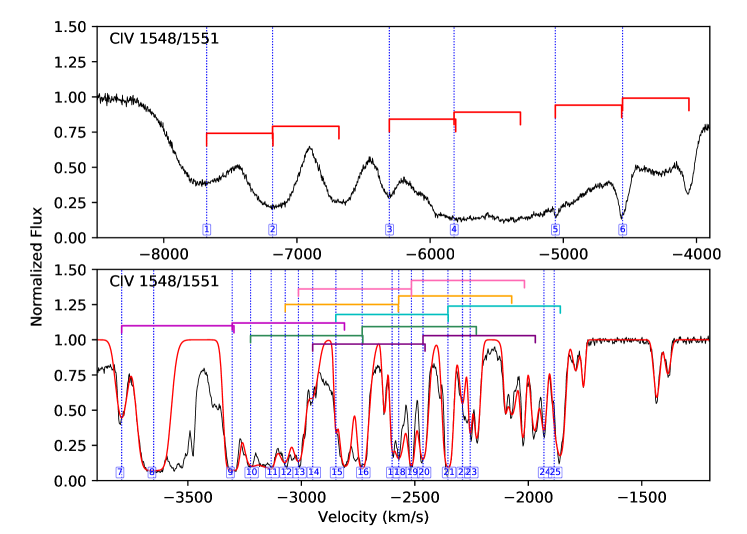
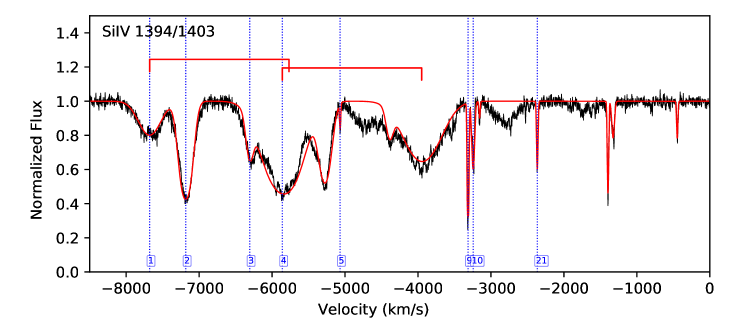
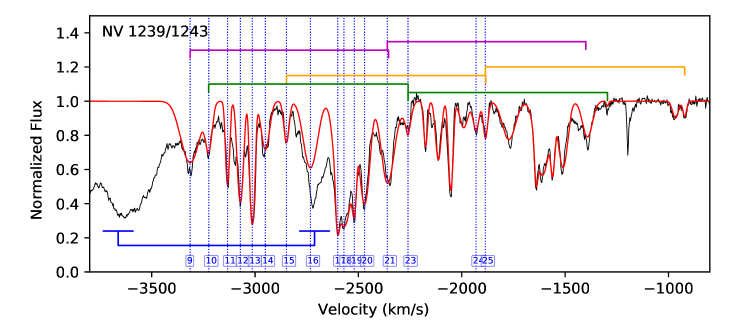
Figure 2 shows our fits to all of the C iv AALs included in our final catalog. We derive , and from Equations 1, 2 and 3 by fitting the C iv doublet line profiles. Additionally, there are C iv mini-BALs in the spectrum, and we have flagged them (component 1 to 6) in the catalog presented in Table 1. We have not performed line profile fitting on these six C iv mini-BALs, as they are part of a blended BAL system. In Figure 3 and Figure 4, we present our fits to all of the Si iv AALs and N v AALs in our final catalog, respectively.
| v (km s-1) | ID1 | (Å) | ID2 | (Å) | (km s-1) | (cm-2) | Notes | |||
|---|---|---|---|---|---|---|---|---|---|---|
| 1 | 2.1347 | -7678 | Si iv 1394 | 4369.14 | Si iv 1403 | 4397.26 | bl-4 | |||
| C iv 1548 | 4853.13 | C iv 1551 | 4861.20 | – | – | – | bl-BAL | |||
| 2 | 2.1400 | -7183 | Si iv 1394 | 4376.53 | Si iv 1403 | 4404.70 | ||||
| C iv 1548 | 4861.33 | C iv 1551 | 4869.42 | – | – | – | bl-BAL | |||
| 3 | 2.1494 | -6306 | Si iv 1394 | 4389.63 | Si iv 1403 | 4417.88 | ||||
| C iv 1548 | 4875.89 | C iv 1551 | 4884.00 | – | – | – | bl-BAL | |||
| 4 | 2.1546 | -5820 | Si iv 1394 | 4396.88 | Si iv 1403 | 4425.18 | bl-1 | |||
| C iv 1548 | 4883.94 | C iv 1551 | 4892.06 | – | – | – | bl-BAL | |||
| 5 | 2.1627 | -5068 | Si iv 1394 | 4408.17 | Si iv 1403 | 4436.54 | ||||
| C iv 1548 | 4896.48 | C iv 1551 | 4904.62 | – | – | – | bl-BAL | |||
| 6 | 2.1682 | -4550 | C iv 1548 | 4904.99 | C iv 1551 | 4913.15 | – | – | – | bl-BAL |
| 7 | 2.1763 | -3799 | C iv 1548 | 4917.53 | C iv 1551 | 4925.71 | bl-9 | |||
| 8 | 2.1778 | -3651 | C iv 1548 | 4919.85 | C iv 1551 | 4928.04 | bl, bl-11 | |||
| 9 | 2.1816 | -3314 | N v 1239 | 3941.43 | N v 1243 | 3954.11 | bl-21 | |||
| Si iv 1394 | 4434.51 | Si iv 1403 | 4463.05 | |||||||
| C iv 1548 | 4925.74 | C iv 1551 | 4933.93 | bl-7,15 | ||||||
| 10 | 2.1824 | -3244 | N v 1239 | 3942.42 | N v 1243 | 3955.10 | bl-23 | |||
| Si iv 1394 | 4435.63 | Si iv 1403 | 4464.18 | |||||||
| C iv 1548 | 4926.98 | C iv 1551 | 4935.17 | bl-16 | ||||||
| 11 | 2.1834 | -3133 | N v 1239 | 3943.66 | N v 1243 | 3956.34 | ||||
| C iv 1548 | 4928.52 | C iv 1551 | 4936.72 | bl-8,12 | ||||||
| 12 | 2.1841 | -3071 | N v 1239 | 3944.53 | N v 1243 | 3957.21 | ||||
| C iv 1548 | 4929.61 | C iv 1551 | 4937.81 | bl-11,13,18 | ||||||
| 13 | 2.1847 | -3013 | N v 1239 | 3945.27 | N v 1243 | 3957.96 | ||||
| C iv 1548 | 4930.54 | C iv 1551 | 4938.74 | bl-12,19 | ||||||
| 14 | 2.1854 | -2950 | N v 1239 | 3946.14 | N v 1243 | 3958.83 | ||||
| C iv 1548 | 4931.62 | C iv 1551 | 4939.82 | bl-20 | ||||||
| 15 | 2.1865 | -2848 | N v 1239 | 3947.50 | N v 1243 | 3960.19 | bl-25 | |||
| C iv 1548 | 4933.32 | C iv 1551 | 4941.53 | bl-9,21 | ||||||
| 16 | 2.1877 | -2732 | N v 1239 | 3948.99 | N v 1243 | 3961.69 | bl | |||
| C iv 1548 | 4935.18 | C iv 1551 | 4943.39 | bl-10 | ||||||
| 17 | 2.1891 | -2600 | N v 1239 | 3950.72 | N v 1243 | 3963.43 | ||||
| C iv 1548 | 4937.35 | C iv 1551 | 4945.56 | |||||||
| 18 | 2.1894 | -2570 | N v 1239 | 3951.10 | N v 1243 | 3963.80 | ||||
| C iv 1548 | 4937.81 | C iv 1551 | 4946.03 | bl-12 | ||||||
| 19 | 2.1900 | -2520 | N v 1239 | 3951.84 | N v 1243 | 3964.54 | ||||
| C iv 1548 | 4938.74 | C iv 1551 | 4946.96 | bl-13 | ||||||
| 20 | 2.1906 | -2470 | N v 1239 | 3952.58 | N v 1243 | 3965.29 | ||||
| C iv 1548 | 4939.67 | C iv 1551 | 4947.89 | bl-14 | ||||||
| 21 | 2.1918 | -2365 | N v 1239 | 3954.07 | N v 1243 | 3966.78 | bl-9 | |||
| Si iv 1394 | 4448.73 | Si iv 1403 | 4477.36 | |||||||
| C iv 1548 | 4941.53 | C iv 1551 | 4949.75 | bl-15,25 | ||||||
| 22 | 2.1924 | -2290 | C iv 1548 | 4942.46 | C iv 1551 | 4950.68 | bl | |||
| 23 | 2.1928 | -2260 | N v 1239 | 3955.31 | N v 1243 | 3968.02 | bl-10 | |||
| C iv 1548 | 4943.08 | C iv 1551 | 4951.30 | bl | ||||||
| 24 | 2.1963 | -1931 | N v 1239 | 3959.64 | N v 1243 | 3972.37 | ||||
| C iv 1548 | 4948.50 | C iv 1551 | 4956.73 | |||||||
| 25 | 2.1968 | -1886 | N v 1239 | 3960.26 | N v 1243 | 3973.00 | bl-15 | |||
| C iv 1548 | 4949.27 | C iv 1551 | 4957.50 | bl-21 |
3.2 Line-locked Signatures
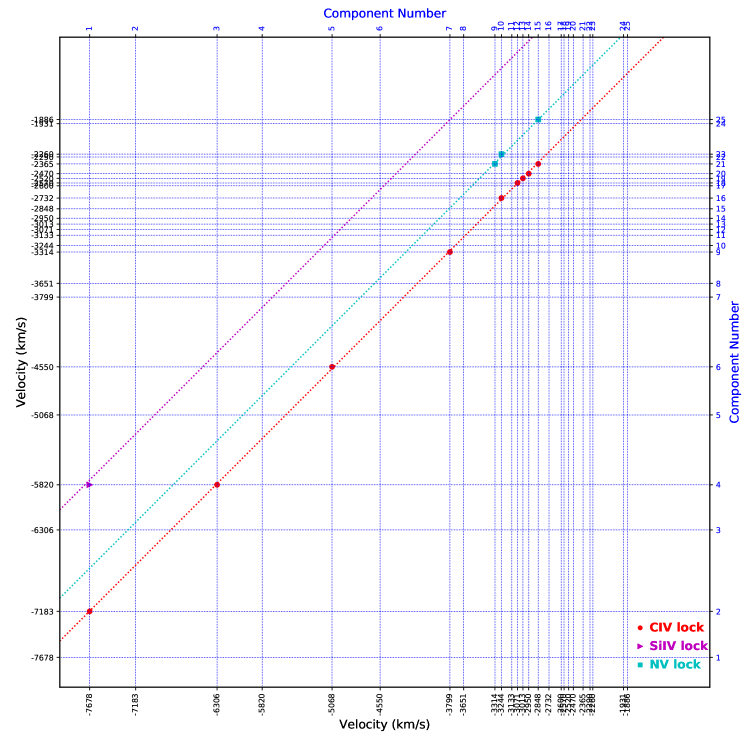
We search for line-locked pairs corresponding to the C iv, N v, or Si iv doublets in the spectrum of J221531-174408 utilizing the component matrix in velocity space shown in Figure 5. We skip the usual O vi doublets search because it is not in the wavelength coverage of the J221531-174408 spectra. Possible line-locked pairs can be identified in the matrix by drawing a straight line with a slope of , and an intercept corresponding to the doublet velocity separation, which is km s-1 for C iv, km s-1 for N v, and km s-1 for Si iv. Two absorbers are considered to be line-locked if the velocity difference between them meets the following criterion:
| (4) |
where is the velocity separation of the two lines in the corresponding doublet, and and are the Doppler parameters of the two overlapping lines from the two doublets, respectively. The confirmed line-locked pairs are marked using brackets in Figures 2, 4 and 3.
In the top panel of Figure 2, we identify three line-locked pairs of C iv absorbers: pairs (1, 2), (3, 4), and (5, 6), with velocity separations corresponding to the C iv 1548, 1551 doublet. These lines are mini-BALs blended with a BAL, which made it impossible to accurately fit the column density. In the bottom panel of Figure 2, we detect six possible line-locked pairs corresponding to the C iv doublets: pairs (7, 9), (10, 16), (12, 18), (13, 19), (14, 20), and (15, 21). At first glance, it appeared that absorbers (7, 9, 15, 21, 25) form the first five successive line-locked C iv doublets. However, after carefully checking the fitting, we do not find sufficient evidence to support this claim. This underscores the significance of high-resolution spectra in the study of line-locking of quasar outflow.
We have also detected line-locks in the doublet lines of other ions, including Si iv 1393, 1403, and N v 1239, 1243. We find three N v NAL pairs, including components (9, 21), (10, 23), and (15, 25), which are marked with brackets in Figure 4. We identify one Si iv NAL pair, comparising absorber components (1, 4), which is marked with red brackets in Figure 3. We find only one P v 1118, 1128 doublet for absorber component 2 and fail to identify any line-locking pairs for P v NALs (see Chen et al. (2021b) for more reference). It is possible that lines appearing at the doublet separation in observed spectra result from chance alignments of physically unrelated absorption-line clouds. However, observations of multiple line-locks in the same spectrum strongly argue for the reality of physical line-locks (e.g., Ganguly & Brotherton, 2008; Hamann et al., 2011).
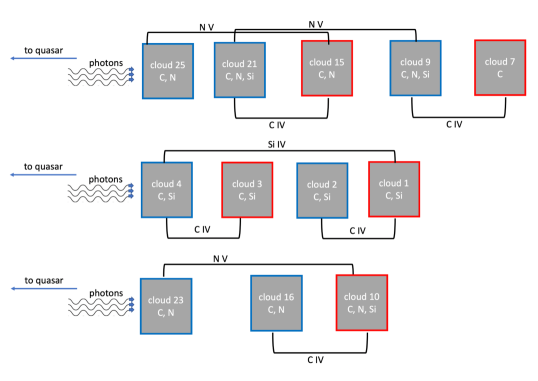
From the matrix shown in Figure 5, we can extract complex line-locking connections involving multiple ionic species. We identify three complex systems with three to five absorbers locked together through multi-ionic doublets, illustrated in the cartoon plot in Figure 6. In the top panel, we show that components 7, 9, 15, 21, and 25 are locked together through two C iv doublets and two N v doublets. In the middle and bottom panels, we show four and three absorbers locked together through C iv and Si iv C iv and N v respectively. Such alignments shown in Figure 6 could be established by chance. In order to estimate the probability that such coincidences occur by chance, we randomly populated the observed velocity range with the number of observed components as done by previous studies (Srianand & Petitjean, 2000; Srianand et al., 2002). We find the probabilities of detecting the three configurations shown from top to bottom in Figure 6 are , , and , respectively. The small chance alignment probability, together with the presence of multiple line-locked doublets in one quasar, suggests that the line-locking is most probably true (Srianand & Petitjean, 2000; Srianand et al., 2002; Juráňová et al., 2024). How these line-locked components influence each other will be an interesting project for future research. Historically, theoretical works have often employed a simple two-clouds-one-doublet configuration to investigate the formation of line-locking (Lewis & Chelouche, 2023). Our findings suggest that future theoretical studies of the underlying mechanisms of line-locking should employ more sophisticated models to capture the complexity observed in these systems.
3.3 Photoionization Model
While a specific column density of an ion can originate in vastly different physical conditions, constraints from several lines can narrow down the range of possible properties of the absorbing gas. Several of the NALs identified (component 9, 10, 17, 21, 24) have column densities measured from at least two ion species, which are shown in Table 1. To provide insights into the ionization states of the absorbing systems from the measured ionic column densities above, we used photoionisation models obtained with the cloudy 2023 release (Chatzikos et al., 2023).
In the cloudy model, we assume the gas is in photoionisation equilibrium with the incident ionising SED, and adopt a solar metallicity. We set a grid of ionisation parameter and total column density (H) with a step of 0.1 dex in each dimension. The model results from cloudy are shown in Figure 7. We can derive the hydrogen column density (H) and the ionisation parameter for these five absorbers from Figure 7. The clouds have (H) from 17.5 to 19.0 and from 0 to -2. Among these five absorbers, only components 9 and 21 are line-locked together. So we use these two absorbers to test the theory of Lewis & Chelouche (2023). We find these two clouds showing similar values of and (H), which seems to support the claim of Lewis & Chelouche (2023) that in order to lock together, absorbers need to have similar physical parameters.
By adopting solar metallicity, cloud size scale of 0.1 to 1 pc, and hydrogen column density of (H) = 18.5 as derived from cloudy, we can estimate the masses of a typical absorber to be in the range of to , which seems to be consistent with the Asymptotic Giant Branch (AGB) ejecta model proposed by Lewis & Chelouche (2023).
Next we estimate the total mass and kinetic energy in the complex line-locked system of J221531-174408 to determine if it can plausibly be important for feedback to the host galaxy’s evolution. Following Hamann et al. (2011) and Chen et al. (2018), we treat the flow geometry approximately like part of a thin spherical shell, and find the total mass of the complex line-locked system as
| (5) |
where cm-2 is the median column density of the five absorbing systems derived above, to pc is a likely radial distance (Hamann et al., 2011; Lewis & Chelouche, 2023; Hall et al., 2024), and Q is the global covering fraction of the outflow, i.e. the fraction of 4 steradians covered by the flow as seen from the central continuum source (Hamann et al., 2000). The value of Q is not constrained by our data, but per cent is a reasonable guess based on the high detection rates of line-locked C iv complex system (Bowler et al., 2014; Chen et al., 2021a). The corresponding kinetic energy, defined by , is in the range ergs if we adopt a typical velocity of km s-1. The characteristic flow time, v, is in the range s. Dividing these energies by the characteristic flow time, yields kinetic energy rates, ergs s-1, that we compare to the near-infrared bolometric luminosity ergs s-1 for J221531-174408 (Gallagher et al., 2007) to derive ratios . The upper limit on these ratios are much too small to be important for feedback to the host galaxy evolution, where to 0.05 is believed to be required (Scannapieco & Oh, 2004; Di Matteo et al., 2005; Prochaska & Hennawi, 2009; Hopkins & Elvis, 2010).

3.4 Origin of Line-locked Systems
Lines formed in different outflow clumps can become locked at these doublet separations due to shadowing effects in radiatively-driven outflows (Lewis & Chelouche, 2023; Dannen et al., 2024). Line-locked systems can therefore be a signature of outflows driven by radiative forces in the vicinity of a quasar (Milne, 1926; Scargle, 1973; Braun & Milgrom, 1989; Lin & Lu, 2020a, b). Stable low-velocity and variable high-velocity line-locking systems may favor large-scale and small-scale origins, respectively (Mas-Ribas, 2019; Mas-Ribas & Mauland, 2019). For example, Lin & Lu (2020a) identified a system with four successive line-locked C iv doublets. Quasar J221531-174408 is one of the four quasars known to possess line-locked signatures in C iv, Si iv, and N v at the same time. The other three quasars are Q1303+308 (Turnshek et al., 1984; Foltz et al., 1987; Braun & Milgrom, 1989), J1513+0855 (Srianand et al., 2002; Chen et al., 2021a), and SDSS J092345+512710 (Lin & Lu, 2020b). For example, Lin & Lu (2020b) have studied the C iv broad absorption line in SDSS J092345+512710 and found 11 NALs showing complex line-locking phenomena. This suggests also that radiation pressure plays an important role in the dynamics of clumpy outflow clouds in quasar. The large statistical study by Bowler et al. (2014) showed that roughly two-thirds of SDSS quasars with multiple C iv NALs at speeds up to km/s have at least one line-locking pair. These results indicate that physical line-locking due to radiative forces is both real and common in quasar outflows.
Although the specific physical mechanism is still under debate (see the discussion in Bowler et al., 2014), it is widely agreed that line-locked systems are related to the physical process of radiative acceleration (Lewis & Chelouche, 2023), where successive shielding of the outflowing clouds locks the clouds one by one in outflow velocity (Milne, 1926; Scargle, 1973; Braun & Milgrom, 1989). The case presented here, involving the line-locking of multiple ions, serves as a valuable example for research on the physical mechanism of radiative acceleration.
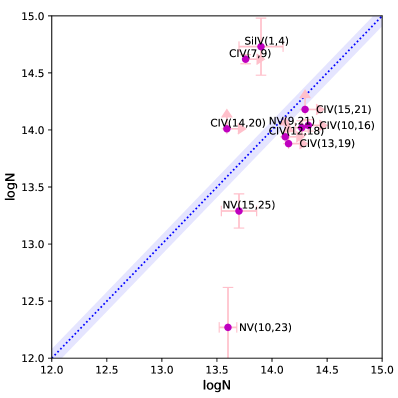
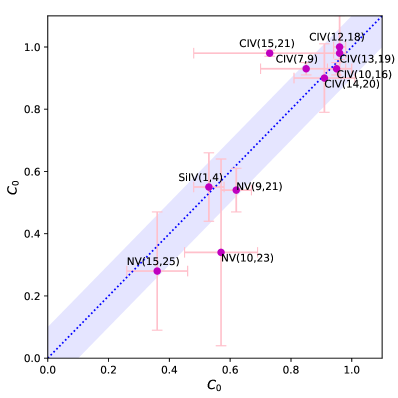
Using simulations, Lewis & Chelouche (2023) suggests the clouds’ properties need to be fine-tuned to within 1% for the clouds to be line-locked. They argue that the prevalence of line-locking in quasar spectra supports the idea that the ejected envelopes of AGB stars are one of the possible origins of the outflowing clouds observed as narrow absorption-line systems. Our findings can be used to test this scenario. We have identified a total of 25 absorption-line systems, including 6 mini-BALs and 19 NALs. All 6 mini-BALs are line-locked, and 12 out of 19 NALs are line-locked, which represents a notably high percentage. This suggests that line-locking should be easily formed. We also compare the derived ion column densities and covering fractions of the line-locked pairs in Figure 8 and Figure 9. We find that the derived column densities are quite similar for most of the the C iv pairs, though this is not the case for every pair. The covering fractions of the locked pairs appear consistent with each other, as shown in Figure 9, where most of the data points fall near the 1:1 ratio line. This generally supports the theoretical study by Lewis & Chelouche (2023), which argues that two absorbers need to have similar physical properties to be locked together.
However, we also find evidence that several clouds can be locked together through different-ion doublets. For example, as shown in Figure 6, there are three complex AALs with three to five absorbers locked together through multi-ionic doublets. The existence of these complex line-locking phenomena indicate that it is not enough to study the line-locking using a simple model of two clouds and one ionic doublet, like the one from Lewis & Chelouche (2023). And this is the reason that why in reality we may not need the 1% fine-tuning derived by Lewis & Chelouche (2023), otherwise we should not see so many line-locking signatures as suggested by Bowler et al. (2014) and Chen et al. (2021a). Further theoretical modeling and detailed simulations are needed to reveal the mechanisms behind these line-locking phenomena.
4 Conclusion
We present a detailed investigation of the line-locking signatures shown in QSO J221531-174408 using the high-resolution and high-signal-to-noise archived VLT-UVES spectra. Our study is much more sensitive to weak and narrow AALs than all previous outflow line-locking surveys using medium-resolution spectra such as from the SDSS. A total of 25 associated absorption line systems were identified, including 6 mini-BALs and 19 NALs. We then fit every C iv, N v, and Si iv NALs to obtain basic line properties like velocity shift, column density and the line-of-sight covering fraction, . We find all 6 mini-BALs are line-locked, and 12 out of the 19 NALs are line-locked, representing a notably high percentage. The covering fractions derived are varying from 0.4 to 1, which supports that a large covering fraction is needed to produce line-locked systems. The presented case study of J221531-174408 indicates the high degree of clumpiness of the outflowing materials from the quasar, and the significance of the radiative forces in driving these outflowing materials.
We also find several clouds can be locked together through multi-doublets, which indicates it is not enough to study the line-locking phenomena using a simple model of 2 clouds and 1 ionic doublet, like the one studied in Lewis & Chelouche (2023). And this is the possible reason that why we do not need the 1% fine-tuning as required by Lewis & Chelouche (2023). Further theoretical modeling and simulation are needed to reveal the mechanisms behind line-locking phenomena. Our findings suggest that high-resolution, high-SNR spectra of quasars are crucial for studying the line-locking mysteries and can increase our understanding of the quasar outflow mechanism.
acknowledgments
We thank the anonymous referee for helpful comments and suggestions. We acknowledge Prof. Michael Murphy for the quasar spectrum. This work was supported by the National Natural Science Foundation of China (12103097, 12073092). CC acknowledges the support of the ”Three Levels” Talent Construction Project of Zhuhai College of Science and Technology. Zhicheng He acknowledges the support of the National Natural Science Foundation of China (nos.12222304, 12192220, and 12192221).
References
- Anderson et al. (1987) Anderson, S. F., Weymann, R. J., Foltz, C. B., & Chaffee, Frederic H., J. 1987, AJ, 94, 278, doi: 10.1086/114468
- Ayubinia et al. (2023) Ayubinia, A., Woo, J.-H., Rakshit, S., & Son, D. 2023, ApJ, 954, 27, doi: 10.3847/1538-4357/ace0ba
- Barlow et al. (1997) Barlow, T. A., Hamann, F., & Sargent, W. L. W. 1997, in Astronomical Society of the Pacific Conference Series, Vol. 128, Mass Ejection from Active Galactic Nuclei, ed. N. Arav, I. Shlosman, & R. J. Weymann, 13
- Berg et al. (2015) Berg, T. A. M., Ellison, S. L., Prochaska, J. X., Venn, K. A., & Dessauges-Zavadsky, M. 2015, MNRAS, 452, 4326, doi: 10.1093/mnras/stv1577
- Bowler et al. (2014) Bowler, R. A. A., Hewett, P. C., Allen, J. T., & Ferland, G. J. 2014, MNRAS, 445, 359, doi: 10.1093/mnras/stu1730
- Braun & Milgrom (1989) Braun, E., & Milgrom, M. 1989, ApJ, 342, 100
- Chatzikos et al. (2023) Chatzikos, M., Bianchi, S., Camilloni, F., et al. 2023, Rev. Mexicana Astron. Astrofis., 59, 327, doi: 10.22201/ia.01851101p.2023.59.02.12
- Chen et al. (2021a) Chen, C., Hamann, F., & Ma, B. 2021a, ApJ, 909, 208, doi: 10.3847/1538-4357/abe307
- Chen et al. (2021b) Chen, C., Hamann, F., Ma, B., & Murphy, M. 2021b, ApJ, 907, 84, doi: 10.3847/1538-4357/abcec5
- Chen et al. (2018) Chen, C., Hamann, F., Simon, L., & Barlow, T. 2018, MNRAS, 481, 3865, doi: 10.1093/mnras/sty2534
- Chen et al. (2019) Chen, C., Hamann, F., Simon, L., & Ma, B. 2019, ApJ, 887, 78, doi: 10.3847/1538-4357/ab53d8
- Chen et al. (2022) Chen, Z., He, Z., Ho, L. C., et al. 2022, Nature Astronomy, 6, 339, doi: 10.1038/s41550-021-01561-3
- Cicone et al. (2014) Cicone, C., Maiolino, R., Sturm, E., et al. 2014, A&A, 562, A21, doi: 10.1051/0004-6361/201322464
- Clavel et al. (2006) Clavel, J., Schartel, N., & Tomas, L. 2006, A&A, 446, 439, doi: 10.1051/0004-6361:20041963
- Dannen et al. (2024) Dannen, R., Proga, D., Waters, T., & Dyda, S. 2024, ApJ, 961, 221, doi: 10.3847/1538-4357/ad0da5
- Dawson et al. (2013) Dawson, K. S., Schlegel, D. J., Ahn, C. P., et al. 2013, AJ, 145, 10, doi: 10.1088/0004-6256/145/1/10
- Debuhr et al. (2012) Debuhr, J., Quataert, E., & Ma, C.-P. 2012, MNRAS, 420, 2221, doi: 10.1111/j.1365-2966.2011.20187.x
- Dekker et al. (2000) Dekker, H., D’Odorico, S., Kaufer, A., Delabre, B., & Kotzlowski, H. 2000, in Society of Photo-Optical Instrumentation Engineers (SPIE) Conference Series, Vol. 4008, Optical and IR Telescope Instrumentation and Detectors, ed. M. Iye & A. F. Moorwood, 534–545, doi: 10.1117/12.395512
- Di Matteo et al. (2005) Di Matteo, T., Springel, V., & Hernquist, L. 2005, Nature, 433, 604
- Eisenstein et al. (2011) Eisenstein, D. J., Weinberg, D. H., Agol, E., et al. 2011, AJ, 142, 72. https://arxiv.org/abs/1101.1529
- Foltz et al. (1987) Foltz, C. B., Weymann, R. J., Morris, S. L., & Turnshek, D. A. 1987, ApJ, 317, 450
- Foltz et al. (1986) Foltz, C. B., Weymann, R. J., Peterson, B. M., et al. 1986, ApJ, 307, 504
- Gallagher et al. (2007) Gallagher, S. C., Hines, D. C., Blaylock, M., et al. 2007, ApJ, 665, 157. https://arxiv.org/abs/0705.0538
- Ganguly & Brotherton (2008) Ganguly, R., & Brotherton, M. S. 2008, ApJ, 672, 102
- Ganguly et al. (1999) Ganguly, R., Eracleous, M., Charlton, J. C., & Churchill, C. W. 1999, AJ, 117, 2594
- Ganguly et al. (2003) Ganguly, R., Masiero, J., Charlton, J. C., & Sembach, K. R. 2003, ApJ, 598, 922, doi: 10.1086/379057
- Ganguly et al. (2013) Ganguly, R., Lynch, R. S., Charlton, J. C., et al. 2013, MNRAS, 435, 1233, doi: 10.1093/mnras/stt1366
- Giustini & Proga (2019) Giustini, M., & Proga, D. 2019, A&A, 630, A94, doi: 10.1051/0004-6361/201833810
- Goldreich & Sargent (1976) Goldreich, P., & Sargent, W. 1976, Comments on Astrophysics, 6, 133
- Green et al. (1995) Green, P. J., Schartel, N., Anderson, S. F., et al. 1995, ApJ, 450, 51, doi: 10.1086/176118
- Hall et al. (2024) Hall, P. B., Weiss, E., Brandt, W. N., & Mulholland, C. J. 2024, MNRAS, 528, 6496, doi: 10.1093/mnras/stae330
- Hamann (1997) Hamann, F. 1997, ApJS, 109, 279
- Hamann et al. (1997) Hamann, F., Barlow, T., Cohen, R. D., Junkkarinen, V., & Burbidge, E. M. 1997, in Astronomical Society of the Pacific Conference Series, Vol. 128, Mass Ejection from Active Galactic Nuclei, ed. N. Arav, I. Shlosman, & R. J. Weymann, 19–+
- Hamann et al. (2011) Hamann, F., Kanekar, N., Prochaska, J. X., et al. 2011, MNRAS, 410, 1957. https://arxiv.org/abs/1008.3728
- Hamann et al. (2000) Hamann, F. W., Netzer, H., & Shields, J. C. 2000, ApJ, 536, 101
- He et al. (2022) He, Z., Liu, G., Wang, T., et al. 2022, Science Advances, 8, eabk3291, doi: 10.1126/sciadv.abk3291
- Hewitt & Burbidge (1987) Hewitt, A., & Burbidge, G. 1987, ApJS, 63, 1, doi: 10.1086/191163
- Hopkins & Elvis (2010) Hopkins, P. F., & Elvis, M. 2010, MNRAS, 401, 7. https://arxiv.org/abs/0904.0649
- Hopkins et al. (2008) Hopkins, P. F., Hernquist, L., Cox, T. J., & Kereš, D. 2008, ApJS, 175, 356. https://arxiv.org/abs/0706.1243
- Horne (1986) Horne, K. 1986, PASP, 98, 609, doi: 10.1086/131801
- Juráňová et al. (2024) Juráňová, A., Costantini, E., Kriss, G. A., et al. 2024, A&A, 686, A99, doi: 10.1051/0004-6361/202449544
- Kauffmann & Haehnelt (2000) Kauffmann, G., & Haehnelt, M. 2000, MNRAS, 311, 576
- King (2003) King, A. 2003, ApJ, 596, L27, doi: 10.1086/379143
- Korista et al. (1993) Korista, K. T., Voit, G. M., Morris, S. L., & Weymann, R. J. 1993, ApJS, 88, 357
- Lewis & Chelouche (2023) Lewis, T. R., & Chelouche, D. 2023, ApJ, 945, 110, doi: 10.3847/1538-4357/acb541
- Lin & Lu (2020a) Lin, Y.-R., & Lu, W.-J. 2020a, MNRAS, 497, 1457, doi: 10.1093/mnras/staa2037
- Lin & Lu (2020b) —. 2020b, ApJ, 899, 155, doi: 10.3847/1538-4357/aba9db
- Lu & Lin (2020) Lu, W.-J., & Lin, Y.-R. 2020, ApJ, 895, L44, doi: 10.3847/2041-8213/ab9303
- Ma & Ge (2019) Ma, B., & Ge, J. 2019, MNRAS, 484, 760, doi: 10.1093/mnras/stz028
- Mas-Ribas (2019) Mas-Ribas, L. 2019, ApJ, 885, 95, doi: 10.3847/1538-4357/ab4181
- Mas-Ribas & Mauland (2019) Mas-Ribas, L., & Mauland, R. 2019, ApJ, 886, 151, doi: 10.3847/1538-4357/ab4efd
- Milne (1926) Milne, E. A. 1926, MNRAS, 86, 459, doi: 10.1093/mnras/86.7.459
- Morris et al. (1991) Morris, S. L., Weymann, R. J., Anderson, S. F., et al. 1991, AJ, 102, 1627, doi: 10.1086/115984
- Murphy et al. (2019) Murphy, M. T., Kacprzak, G. G., Savorgnan, G. A. D., & Carswell, R. F. 2019, MNRAS, 482, 3458, doi: 10.1093/mnras/sty2834
- Murphy et al. (2007) Murphy, M. T., Tzanavaris, P., Webb, J. K., & Lovis, C. 2007, MNRAS, 378, 221, doi: 10.1111/j.1365-2966.2007.11768.x
- Naddaf et al. (2023) Naddaf, M. H., Martinez-Aldama, M. L., Marziani, P., et al. 2023, A&A, 675, A43, doi: 10.1051/0004-6361/202245698
- O’Meara et al. (2015) O’Meara, J. M., Lehner, N., Howk, J. C., et al. 2015, AJ, 150, 111, doi: 10.1088/0004-6256/150/4/111
- Ostriker et al. (2010) Ostriker, J. P., Choi, E., Ciotti, L., Novak, G. S., & Proga, D. 2010, ApJ, 722, 642, doi: 10.1088/0004-637X/722/1/642
- Pâris et al. (2017) Pâris, I., Petitjean, P., Ross, N. P., et al. 2017, A&A, 597, A79, doi: 10.1051/0004-6361/201527999
- Piskunov & Valenti (2002) Piskunov, N. E., & Valenti, J. A. 2002, A&A, 385, 1095, doi: 10.1051/0004-6361:20020175
- Prochaska & Hennawi (2009) Prochaska, J. X., & Hennawi, J. F. 2009, ApJ, 690, 1558. https://arxiv.org/abs/0806.0862
- Prochaska et al. (2008) Prochaska, J. X., Hennawi, J. F., & Herbert-Fort, S. 2008, ApJ, 675, 1002, doi: 10.1086/526508
- Prochaska et al. (2015) Prochaska, J. X., O’Meara, J. M., Fumagalli, M., Bernstein, R. A., & Burles, S. M. 2015, ApJS, 221, 2, doi: 10.1088/0067-0049/221/1/2
- Rupke et al. (2017) Rupke, D. S. N., Gültekin, K., & Veilleux, S. 2017, ApJ, 850, 40, doi: 10.3847/1538-4357/aa94d1
- Rupke & Veilleux (2013) Rupke, D. S. N., & Veilleux, S. 2013, ApJ, 768, 75, doi: 10.1088/0004-637X/768/1/75
- Savage & Bolton (1979) Savage, A., & Bolton, J. G. 1979, MNRAS, 188, 599, doi: 10.1093/mnras/188.3.599
- Scannapieco & Oh (2004) Scannapieco, E., & Oh, S. P. 2004, ApJ, 608, 62
- Scargle (1973) Scargle, J. D. 1973, ApJ, 179, 705, doi: 10.1086/151910
- Silk & Rees (1998) Silk, J., & Rees, M. J. 1998, A&A, 331, L1
- Srianand & Petitjean (2000) Srianand, R., & Petitjean, P. 2000, A&A, 357, 414
- Srianand et al. (2002) Srianand, R., Petitjean, P., Ledoux, C., & Hazard, C. 2002, MNRAS, 336, 753, doi: 10.1046/j.1365-8711.2002.05792.x
- Turnshek et al. (1984) Turnshek, D. A., Weymann, R. J., Carswell, R. F., & Smith, M. G. 1984, ApJ, 277, 51, doi: 10.1086/161670
- Veilleux et al. (2022) Veilleux, S., Rupke, D. S. N., Liu, W., et al. 2022, ApJ, 926, 60, doi: 10.3847/1538-4357/ac3cbb
- Weinberger et al. (2017) Weinberger, R., Springel, V., Hernquist, L., et al. 2017, MNRAS, 465, 3291, doi: 10.1093/mnras/stw2944
- Weymann et al. (1991) Weymann, R. J., Morris, S. L., Foltz, C. B., & Hewett, P. C. 1991, ApJ, 373, 23
- Weymann et al. (1979) Weymann, R. J., Williams, R. E., Peterson, B. M., & Turnshek, D. A. 1979, ApJ, 234, 33
- Yi et al. (2024) Yi, W., Hall, P. B., Yuan, Z., et al. 2024, ApJS, 271, 61, doi: 10.3847/1538-4365/ad2a42
- Zechmeister et al. (2014) Zechmeister, M., Anglada-Escudé, G., & Reiners, A. 2014, A&A, 561, A59, doi: 10.1051/0004-6361/201322746