Data Scaling Laws in Imitation Learning for Robotic Manipulation
Abstract
Data scaling has revolutionized fields like natural language processing and computer vision, providing models with remarkable generalization capabilities. In this paper, we investigate whether similar data scaling laws exist in robotics, particularly in robotic manipulation, and whether appropriate data scaling can yield single-task robot policies that can be deployed zero-shot for any object within the same category in any environment. To this end, we conduct a comprehensive empirical study on data scaling in imitation learning. By collecting data across numerous environments and objects, we study how a policy’s generalization performance changes with the number of training environments, objects, and demonstrations. Throughout our research, we collect over 40,000 demonstrations and execute more than 15,000 real-world robot rollouts under a rigorous evaluation protocol. Our findings reveal several intriguing results: the generalization performance of the policy follows a roughly power-law relationship with the number of environments and objects. The diversity of environments and objects is far more important than the absolute number of demonstrations; once the number of demonstrations per environment or object reaches a certain threshold, additional demonstrations have minimal effect. Based on these insights, we propose an efficient data collection strategy. With four data collectors working for one afternoon, we collect sufficient data to enable the policies for two tasks to achieve approximately 90% success rates in novel environments with unseen objects.
1 Introduction
Scaling has been a key driver behind the rapid advancements in deep learning (Brown et al., 2020; Radford et al., 2021). In natural language processing (NLP) and computer vision (CV), numerous studies have identified scaling laws demonstrating that model performance improves with increases in dataset size, model size, and total training compute (Kaplan et al., 2020; Henighan et al., 2020). However, comprehensive scaling laws have not yet been established in robotics, preventing the field from following a similar trajectory. In this paper, we explore the first dimension of scaling—data—as scaling data is a prerequisite for scaling models and compute. We aim to investigate whether data scaling laws exist in robotics, specifically in the context of robotic manipulation, and if so, what insights and guidance they might offer for building large-scale robotic datasets.
While data scaling has endowed models in NLP and CV with exceptional generalization capabilities Achiam et al. (2023); Kirillov et al. (2023), most of today’s robotic policies still lack comparable zero-shot generalization (Xie et al., 2024). From the outset, we treat generalizable manipulation skills as first-class citizens, emphasizing real-world generalization over evaluations in controlled lab settings. In this context, we aim to investigate the following fundamental question: Can appropriate data scaling produce robot policies capable of operating on nearly any object, in any environment?
To answer this, we present a comprehensive empirical study on data scaling in imitation learning, which is a predominant method for learning real-world manipulation skills (Shafiullah et al., 2024). We categorize generalization into two dimensions: environment generalization and object generalization, which essentially encompass all factors a policy may encounter during real-world deployment. We do not consider task-level generalization at this stage, as we believe it would require collecting vast amounts of data from thousands of tasks (Padalkar et al., 2023; Khazatsky et al., 2024), which is beyond the scope of our work. Instead, we systematically explore how a single-task policy’s performance changes in new environments or with new objects as the number of training environments or objects increases. Additionally, we examine how the number of demonstrations impacts policy generalization when the number of environments and objects is fixed.
We use hand-held grippers (i.e., UMI (Chi et al., 2024)) to collect human demonstrations in various environments and with different objects, modeling this data using a Diffusion Policy (Chi et al., 2023) (Sec. 3). We begin by focusing on two tasks as case studies—Pour Water and Mouse Arrangement—to thoroughly analyze how policy generalization changes with the number of environments, objects, and demonstrations (Sec. 4.1), summarizing data scaling laws (Sec. 4.2). Then, based on these data scaling laws, we propose an efficient data collection strategy to achieve the desired level of generalization (Sec. 4.3). We apply this strategy to two new tasks (Fold Towels and Unplug Charger), and within a single afternoon using four data collectors, we collect sufficient data to train policies that achieve around 90% success rates across 8 new environments and objects for each task (Sec. 5). Lastly, we go beyond data scaling by conducting preliminary explorations of model size scaling (Sec. 6). Throughout our research, we collect over 40,000 demonstrations and conduct all experiments under a rigorous evaluation protocol that included more than 15,000 real-world robot rollouts. Our extensive investigation reveals surprising results and contributions:
-
•
Simple power laws. The policy’s generalization ability to new objects, new environments, or both scales approximately as a power law with the number of training objects, training environments, or training environment-object pairs, respectively.
-
•
Diversity is all you need. Increasing the diversity of environments and objects is far more effective than increasing the absolute number of demonstrations per environment or object.
-
•
Generalization is easier than expected. Collecting data in as many environments as possible (e.g., 32 environments), each with one unique manipulation object and 50 demonstrations, allows training a policy that generalizes well (90% success rate) to any new environment and new object.
2 Related Work
Scaling laws. Scaling laws are first discovered in neural language models (Kaplan et al., 2020), revealing a power-law relationship between dataset size (or model size, computation) and cross-entropy loss. Subsequently, scaling laws have been observed in discriminative image modeling (Zhai et al., 2022), generative image modeling (Peebles & Xie, 2023), video modeling (Henighan et al., 2020), and other domains (Hilton et al., 2023; Liu et al., 2024). These laws not only validate the scalability of neural networks—a key factor in the success of recent foundation models (Bommasani et al., 2021; Brown et al., 2020; Touvron et al., 2023)—but also enable performance prediction for larger models based on their smaller counterparts, thereby guiding more effective resource allocation (Achiam et al., 2023). In this paper, we examine data scaling laws to explore the relationship between the generalization of robot policies and the number of environments, objects, and demonstrations, and to develop efficient data collection strategies based on these insights.
Data scaling in robotic manipulation. Similar to the fields of NLP and CV, robotic manipulation is also experiencing a trend toward scaling up data (Sharma et al., 2018; Kalashnikov et al., 2018; Mandlekar et al., 2018; Dasari et al., 2019; Ebert et al., 2021; Jang et al., 2022; Brohan et al., 2022; Walke et al., 2023; Bharadhwaj et al., 2023; Fang et al., 2023a; Shafiullah et al., 2023; Padalkar et al., 2023; Khazatsky et al., 2024; Zhao et al., 2024). The largest existing dataset, Open X-Embodiment (OXE) (Padalkar et al., 2023), comprises over 1 million robot trajectories from 22 robot embodiments. The primary objective of scaling OXE is to develop a foundational robot model that facilitates positive transfer learning across different robots. However, deploying such models in new environments still requires data collection for fine-tuning. In contrast, our scaling objective focuses on training a policy that can be directly deployed in novel environments and with unseen objects, eliminating the need for fine-tuning. Additionally, we observe that Gao et al. (2024) also explore strategies for efficient data scaling to enhance generalization. However, their work is limited to in-domain compositional generalization, whereas our focus is on out-of-domain generalization.
Generalization in robotic manipulation. Creating a generalizable robot has been a longstanding aspiration within the robotics community. Some research aims to improve generalization to new object instances (Mahler et al., 2017; Mu et al., 2021; Fang et al., 2023b; Zhu et al., 2023a), while other efforts focus on enabling robots to adapt to unseen environments (Hansen et al., 2020; Xing et al., 2021; Teoh et al., 2024; Xie et al., 2024). Recently, significant attention has been paid to developing policies that can generalize to new task instructions (Jang et al., 2022; Bharadhwaj et al., 2023; Brohan et al., 2023; Team et al., 2024). In this paper, we concentrate on the first two dimensions of generalization: creating a single-task policy capable of operating on nearly any object within the same category, in any environment. This kind of single-task policy can serve as a primitive skill for planning algorithms (Ahn et al., 2022; Hu et al., 2023a) and is also the foundation for further research into multi-task generalist policies (Kim et al., 2024). UMI (Chi et al., 2024) demonstrates that training on diverse demonstrations significantly enhances the generalization performance of policies in novel environments and with novel objects. Concurrently with our work, RUMs (Etukuru et al., 2024) develop policies capable of zero-shot deployment in novel environments. However, neither UMI nor RUMs delves into a comprehensive analysis of the relationship between generalization and different data dimensions—a gap our work aims to address.
3 Approach
In this section, we first outline the generalization dimensions we consider and the formal formulation of the data scaling laws. Then, we demonstrate our data source and design choices for policy learning methods. Finally, we introduce our rigorous evaluation protocol.
Generalization dimensions. We use behavior cloning (BC) to train single-task policies, a dominant approach for learning real-world manipulation skills. However, many BC-trained policies exhibit poor generalization performance. This generalization issue manifests across two dimensions: (1) Environment—generalization to previously unseen environments, which may involve variations in lighting conditions, distractor objects, background changes, and more; (2) Object—generalization to new objects within the same category as those in human demonstrations, differing in attributes such as color, size, geometry, and so on.
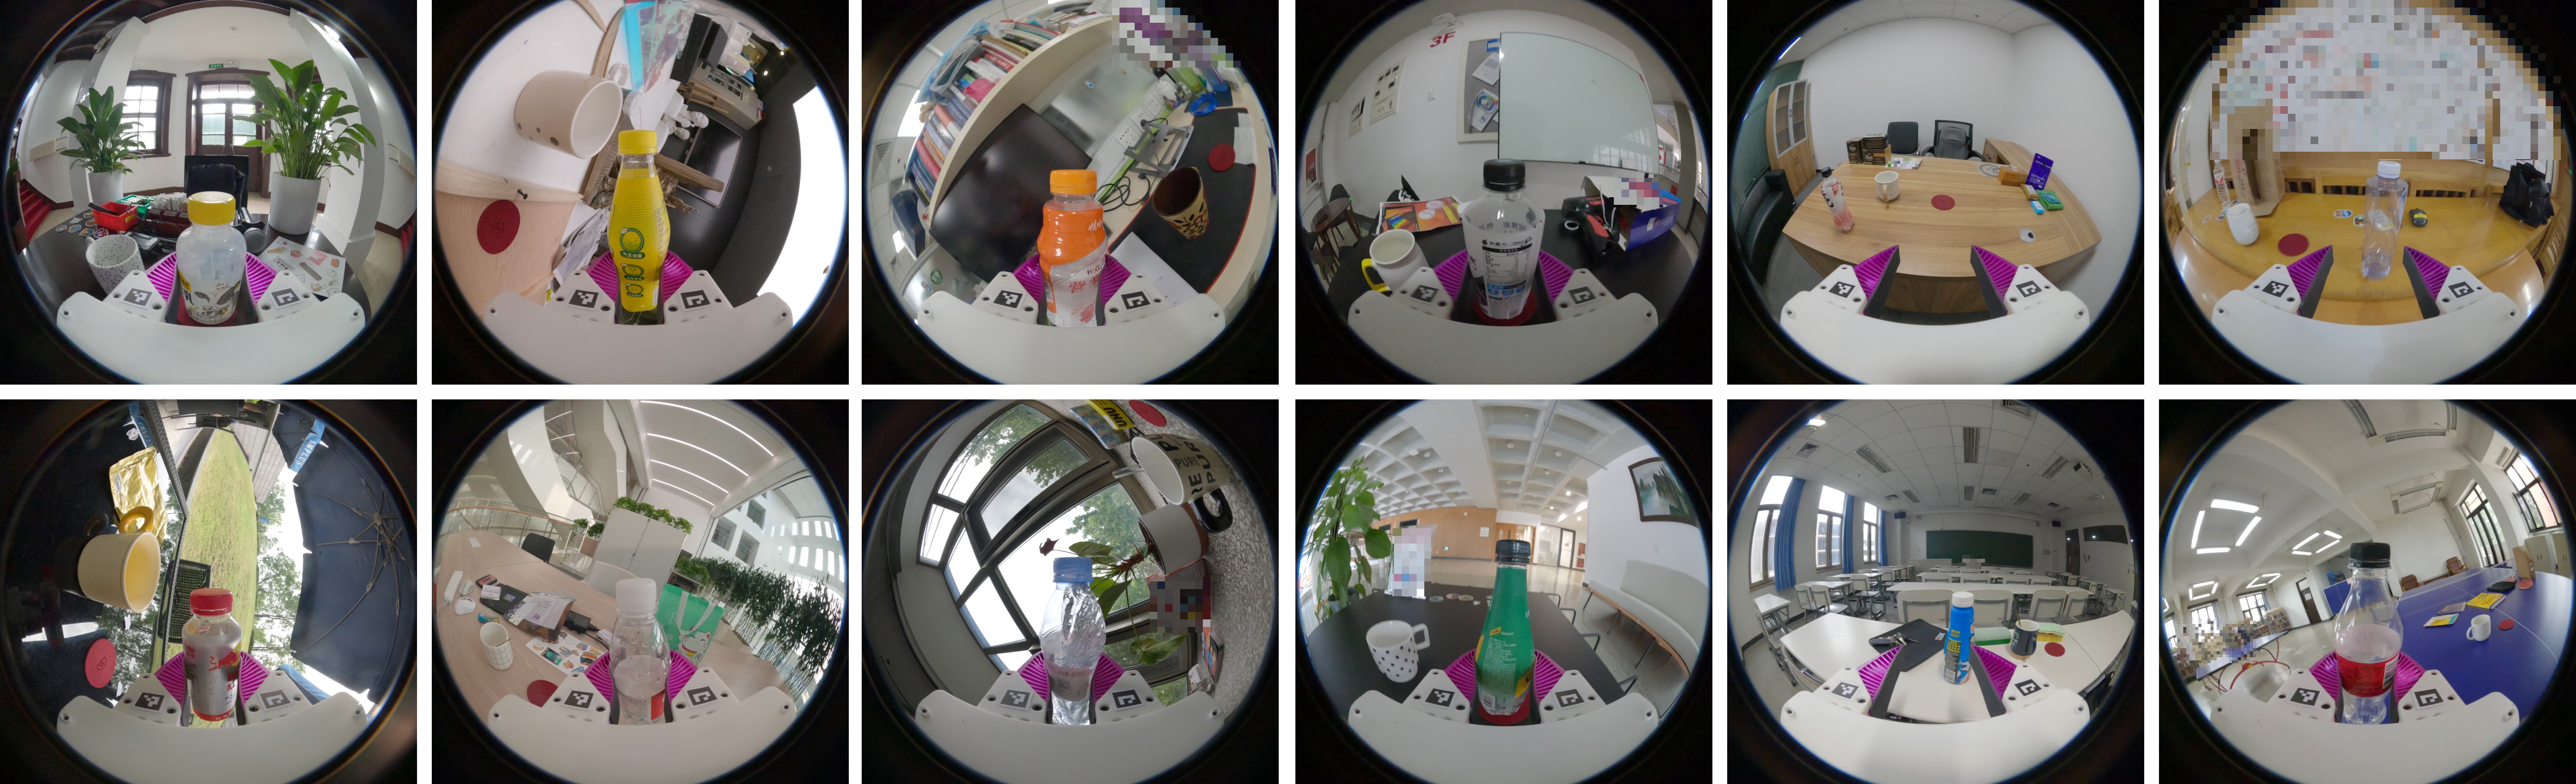
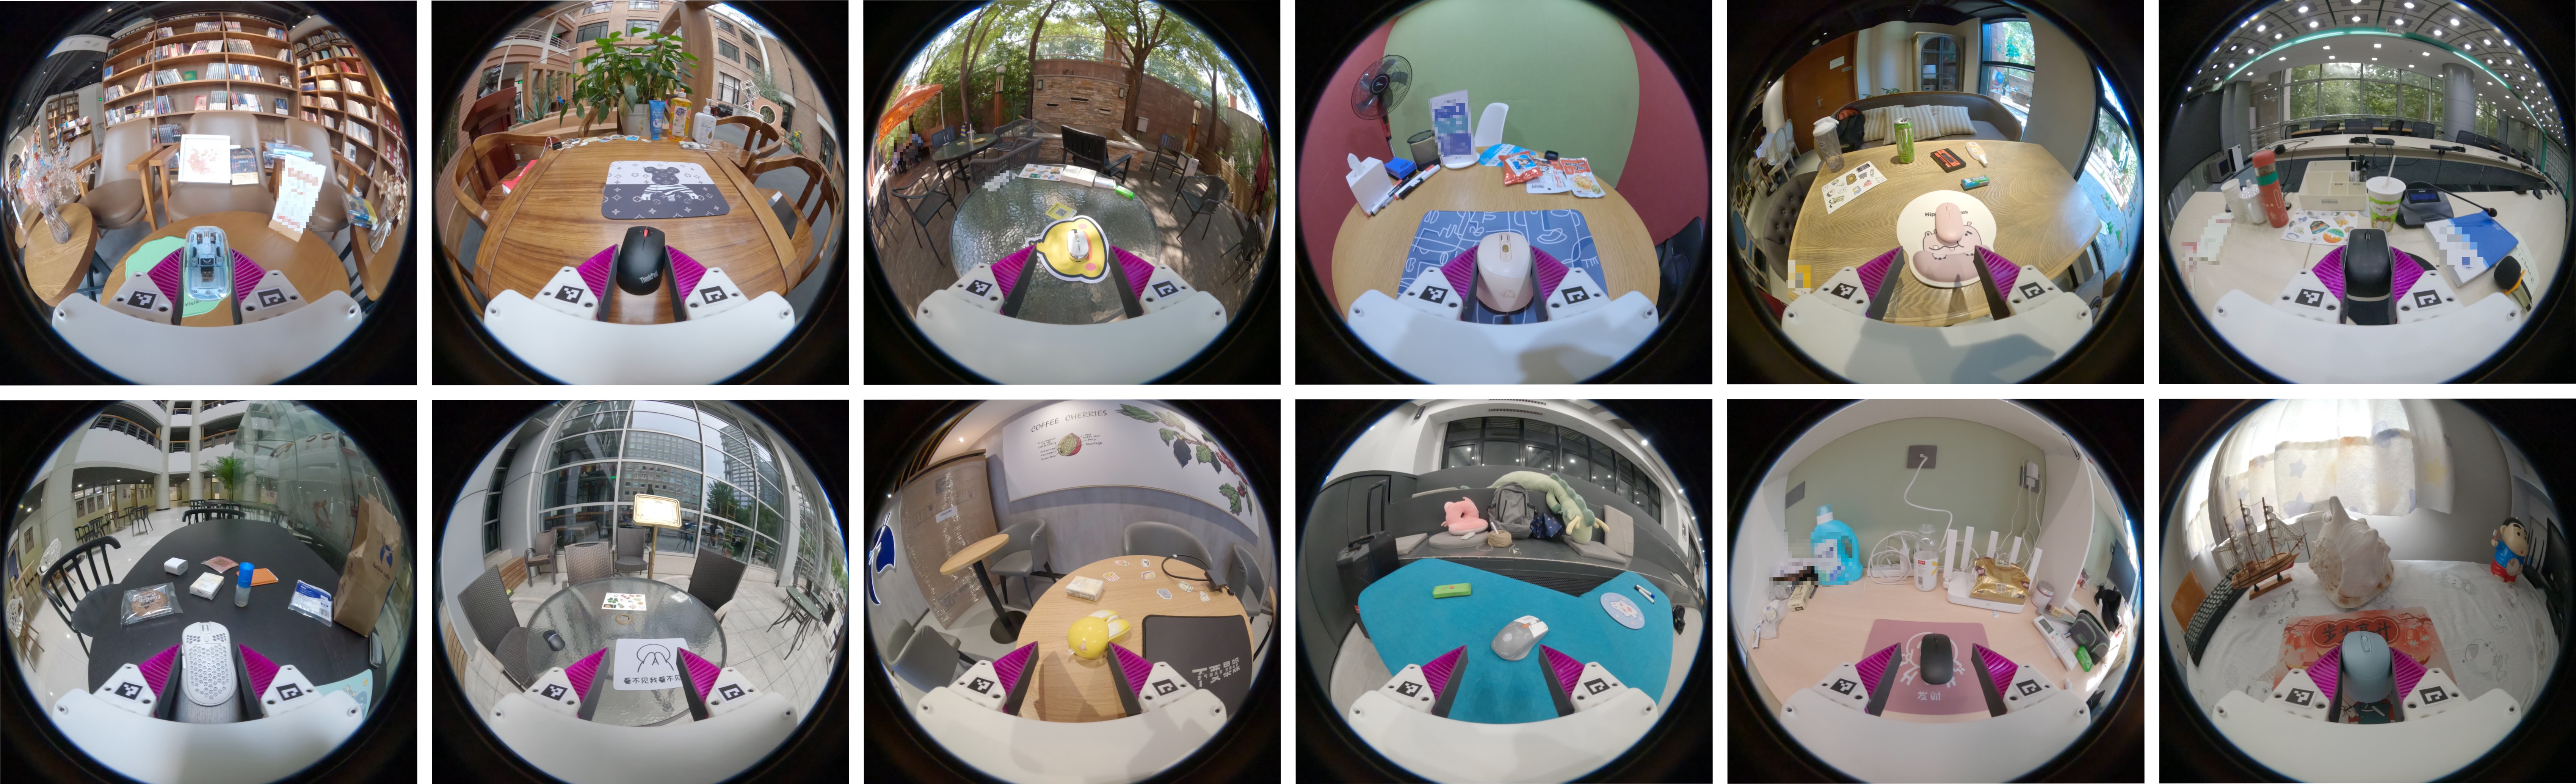
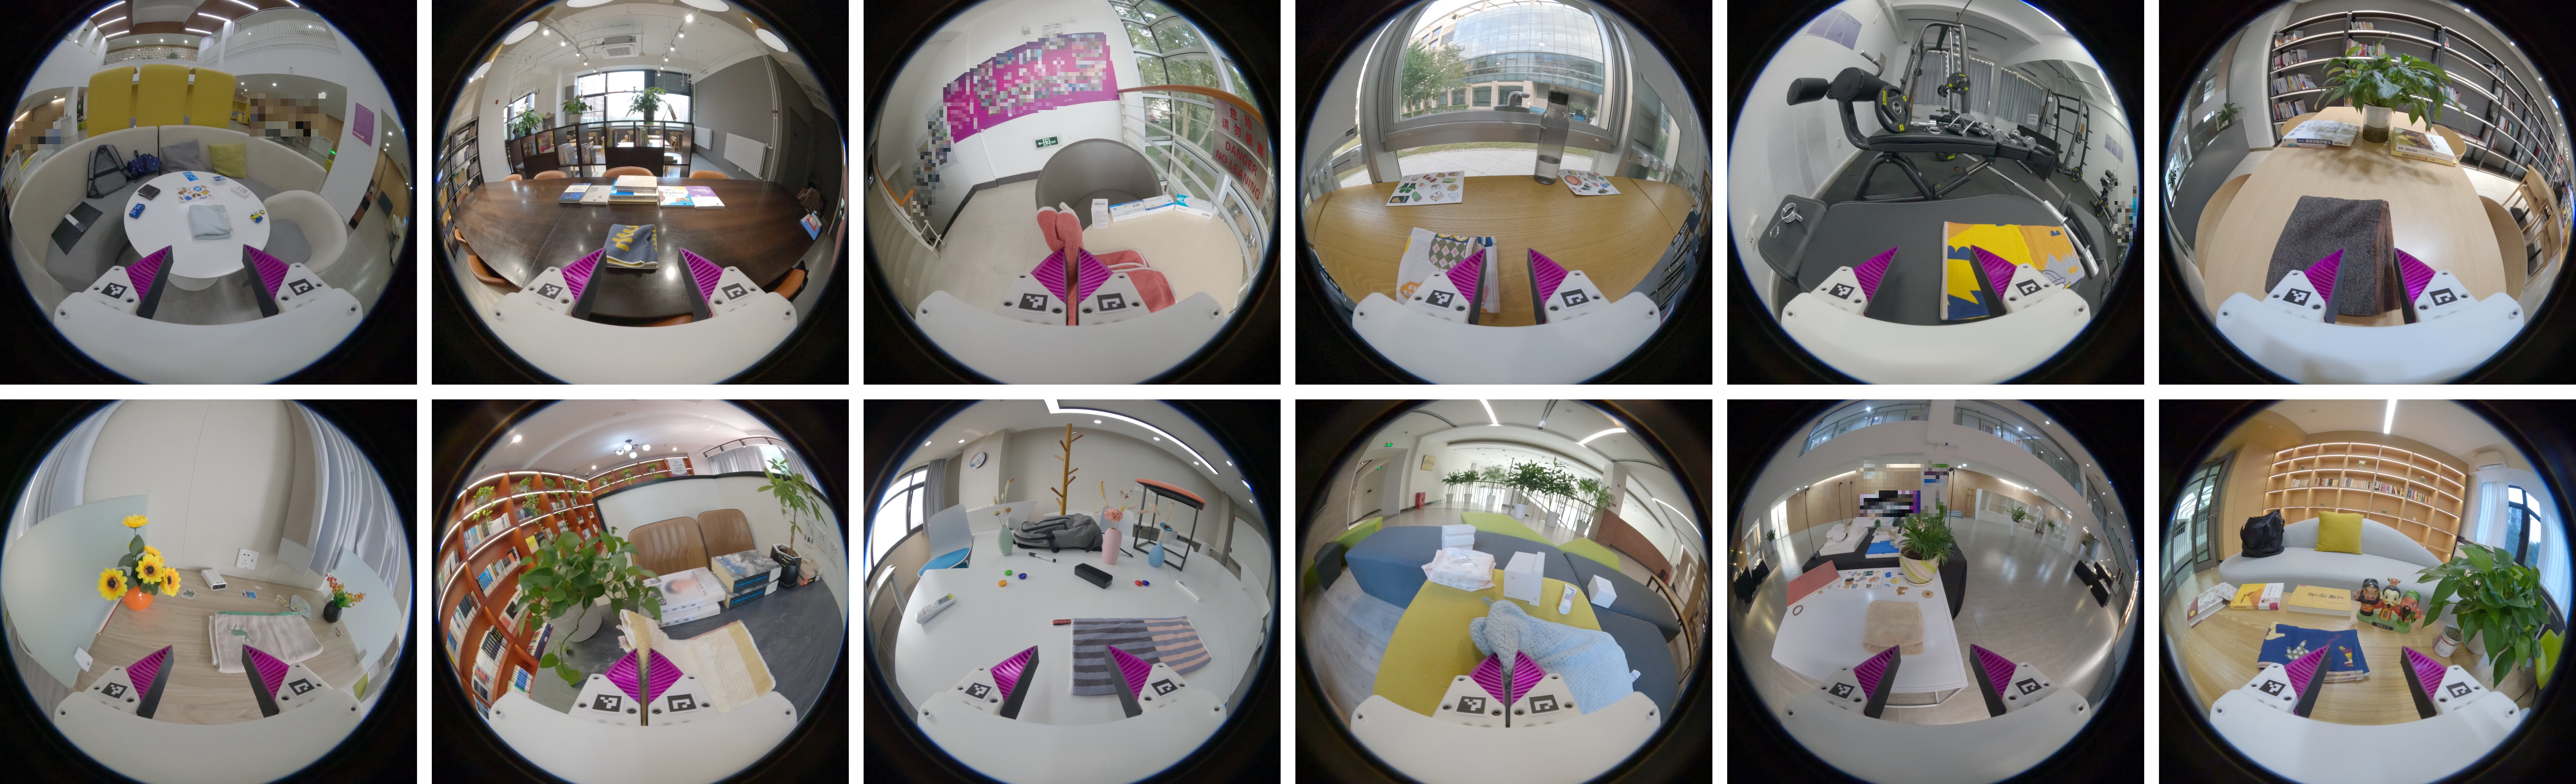
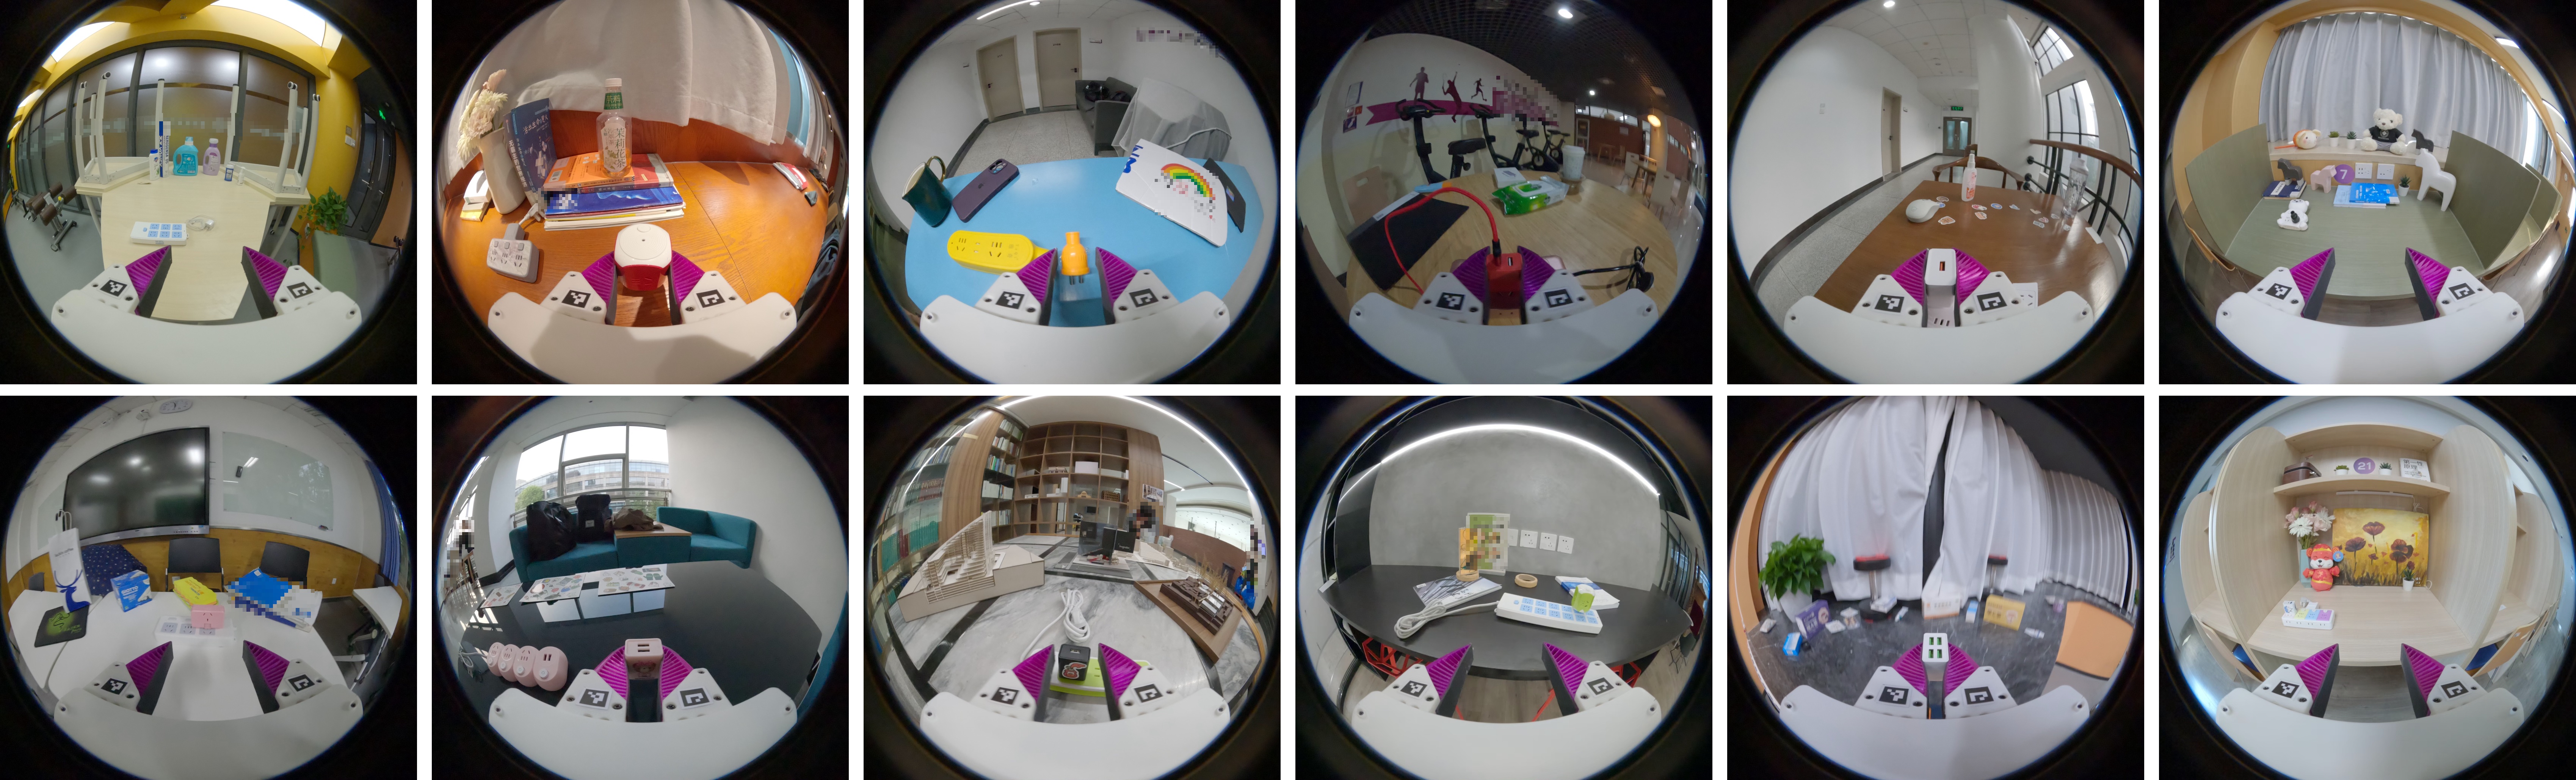
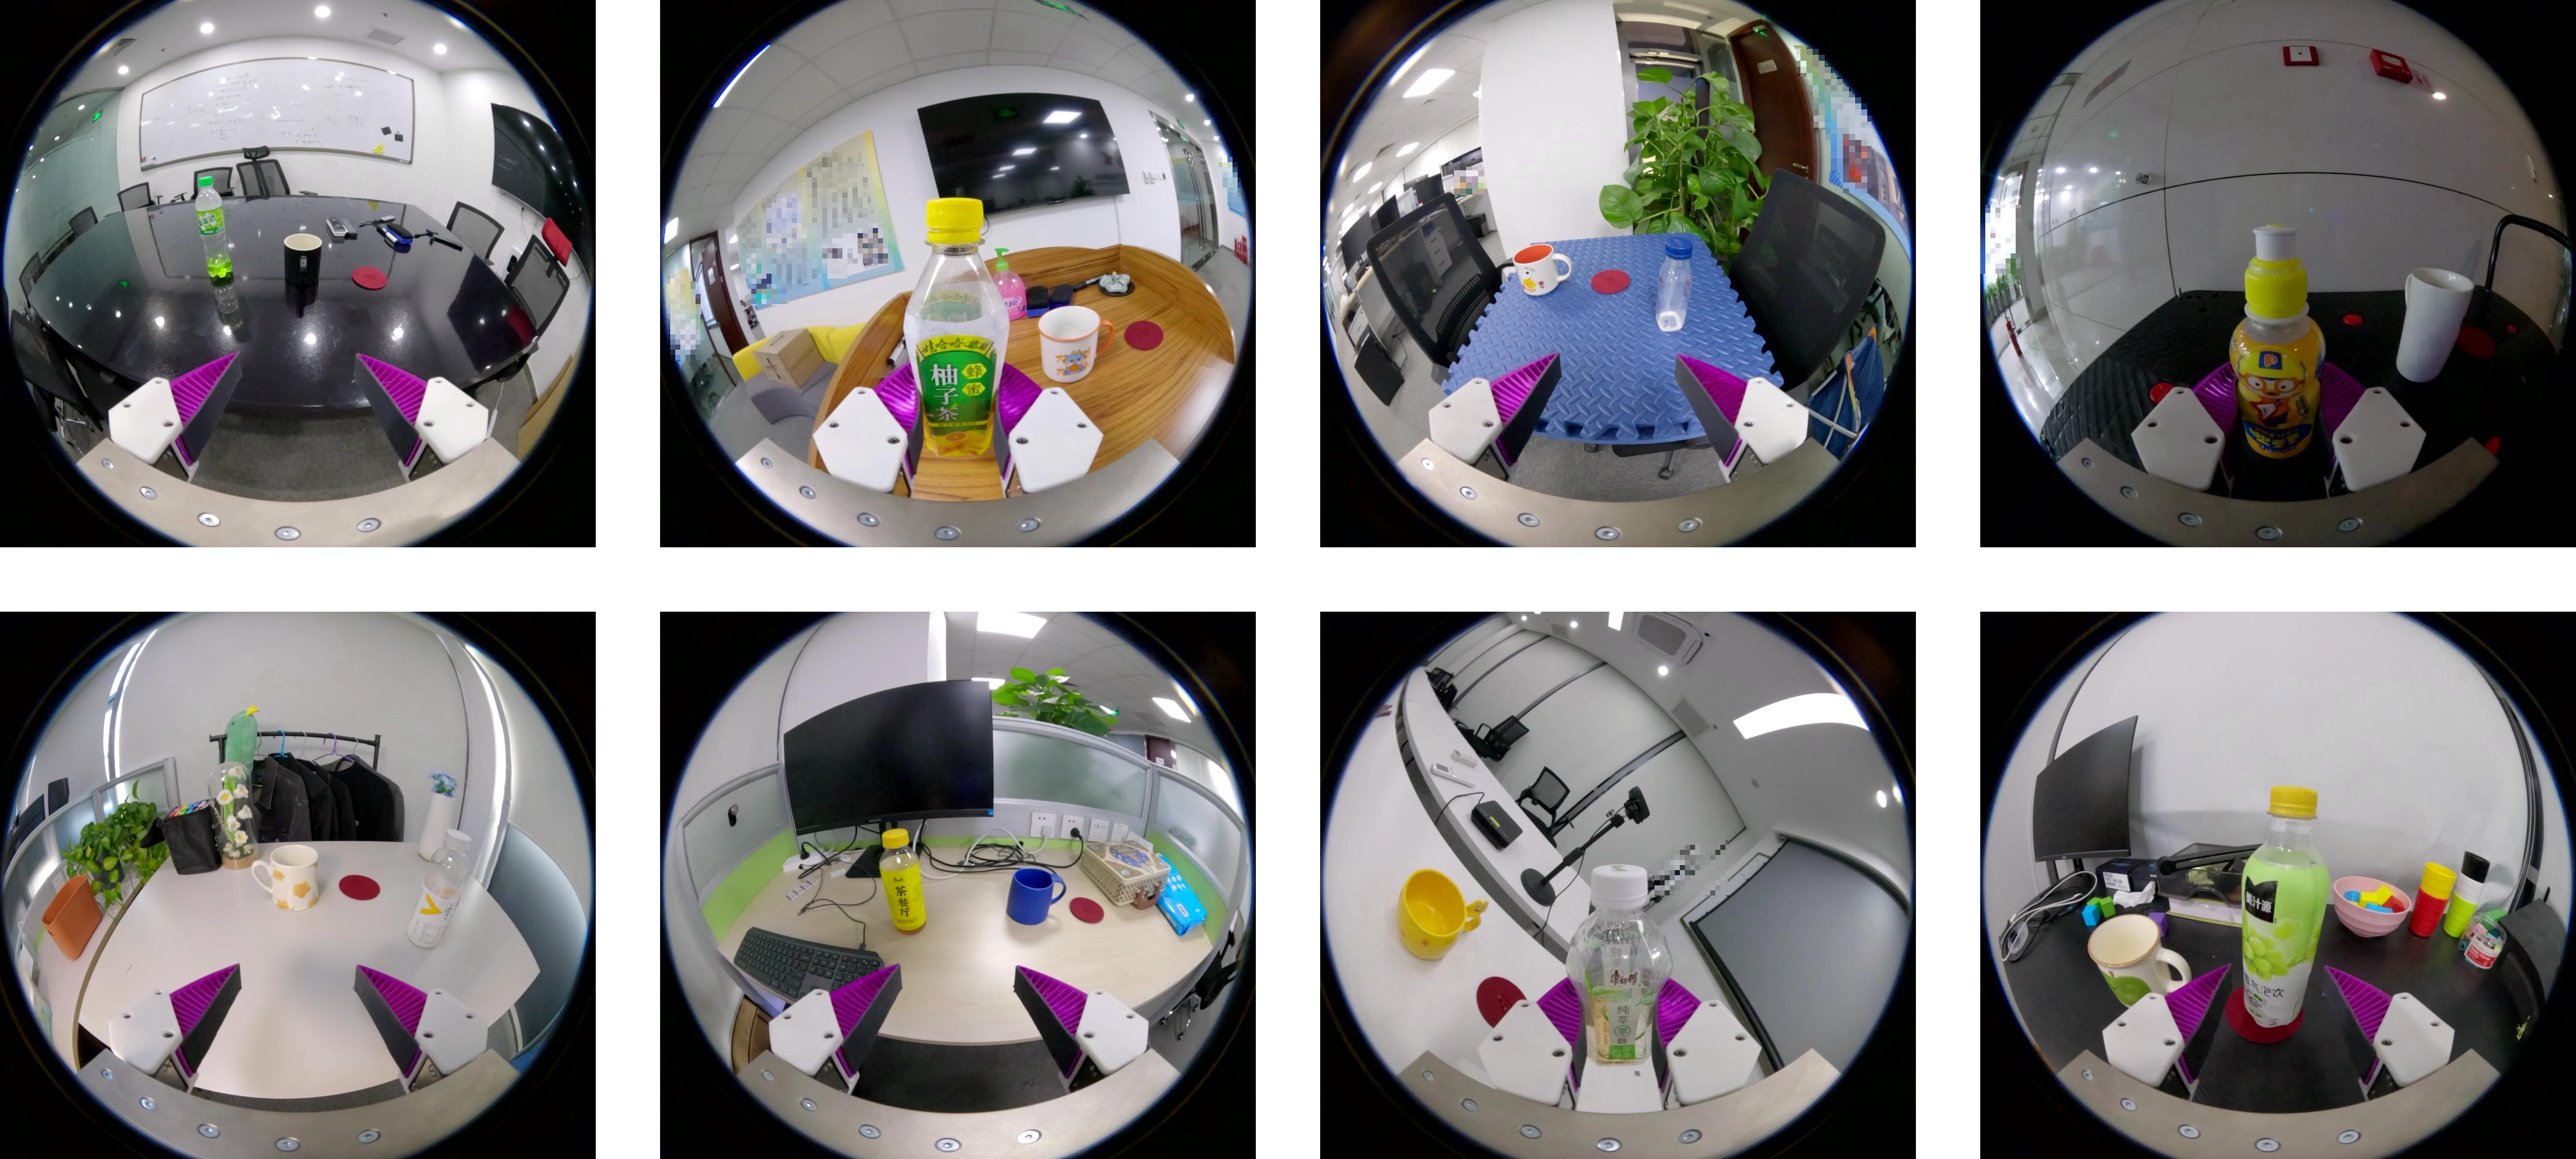
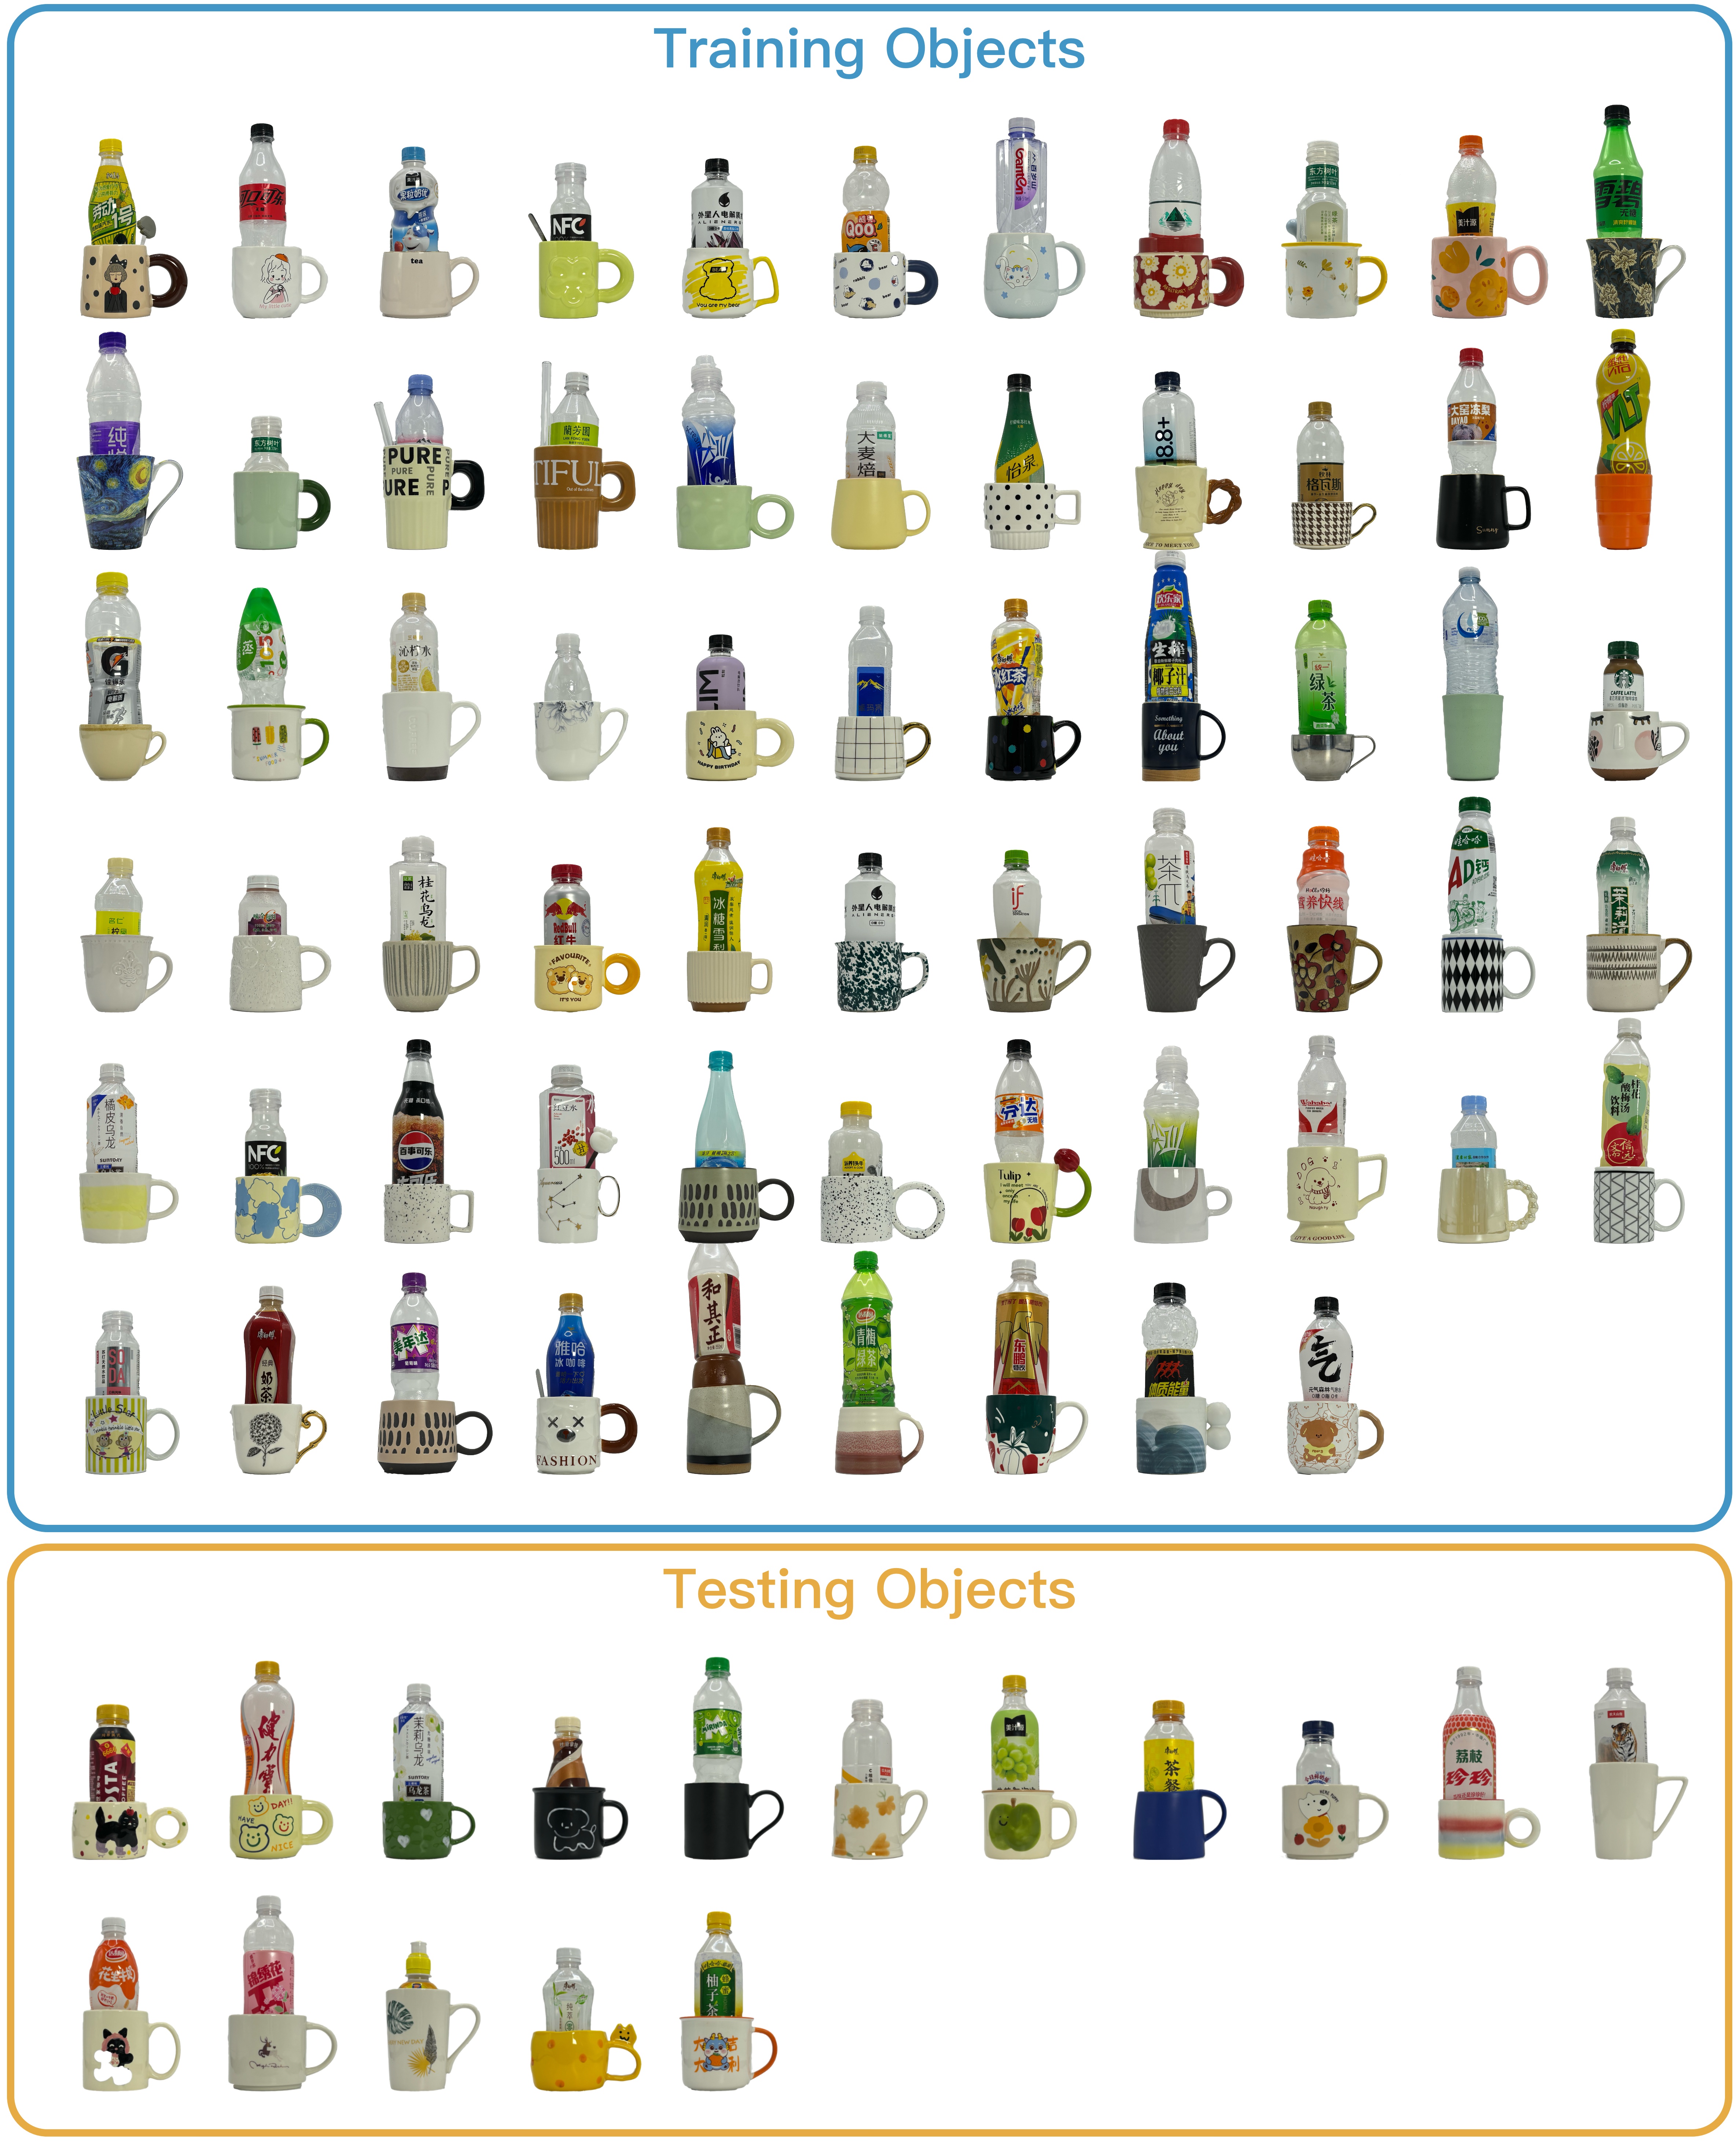
Prior research in this area has attempted to isolate the variations within each dimension by controlling specific factors independently (Xie et al., 2024; Pumacay et al., 2024). For instance, special lighting setups might be used to change only the color of illumination, or 3D-printed objects might be designed to vary only in size without altering their shape or geometry. While this approach allows precise control over individual factors, it cannot account for all possible variation factors. More importantly, real-world performance depends not on generalizing to individual factors but on handling the complex interplay of multiple factors that vary simultaneously. To address this, we focus on generalization across two dimensions—environment and object—which collectively encompass all factors a policy may encounter in natural, real-world scenarios. For environment variations, we scale the number of real scenes by collecting human demonstrations across diverse in-the-wild environments. For object variations, we scale the number of accessible objects by acquiring a large variety of everyday items within the same category. See Appendix A for visualizations of the environments and objects used in our study. We believe that this emphasis on real-world diversity enhances the applicability of our findings to more varied and practical contexts.
Data scaling laws formulation. For simplicity, we consider a scenario where a demonstration dataset for a manipulation task is collected across environments () and manipulation objects of the same category (). Each environment may contain any number of distractor objects, provided they are not in the same category as the manipulation objects. For each object in an environment , demonstrations () are collected. We evaluate the policy’s performance using test scores (described in detail later) on environments and objects not seen during training. The data scaling laws in this paper aim to: (1) characterize the relationship between and the variables , , and , specifically, how the generalization ability depends on the number of environments, objects, and demonstrations; and (2) determine efficient data collection strategies to achieve the desired level of generalization based on this relationship.
Data source. Existing robotic manipulation datasets do not provide enough environments and objects for a single task to meet our requirements. Therefore, we opt to use the Universal Manipulation Interface (UMI) (Chi et al., 2024), a hand-held gripper, to independently collect a substantial number of demonstrations. UMI’s portability, intuitive design, and low cost make it an ideal tool for our data collection needs. It enables highly efficient data collection and allows for seamless switching between different in-the-wild environments with minimal setup time. However, as UMI relies on SLAM for capturing end-effector actions, it may encounter challenges in texture-deficient environments. We observe that approximately 90% of our collected demonstrations are valid. For more details on our data collection and experience with UMI, see Appendix B.
Policy learning. We employ Diffusion Policy to model the extensive data we collect, due to its demonstrated excellence in real-world manipulation tasks and its recent widespread application (Shafiullah et al., 2024; Ze et al., 2024). Following Chi et al. (2023), we utilize a CNN-based U-Net (Ronneberger et al., 2015) as the noise prediction network and employ DDIM (Song et al., 2020a) to reduce inference latency, achieving real-time control. See Appendix C for more training details. To further enhance performance, we make two improvements:
(1) DINOv2 visual encoder: In our experiments, fine-tuning the DINOv2 ViT (Oquab et al., 2023) outperforms both ImageNet pre-trained ResNet (He et al., 2016; Deng et al., 2009) and CLIP ViT (Radford et al., 2021). We attribute this improvement to DINOv2 features’ ability to explicitly capture scene layout and object boundaries within an image (Caron et al., 2021). This information is crucial for enhanced spatial reasoning, which is particularly beneficial for robot control (Hu et al., 2023b; Yang et al., 2023; Kim et al., 2024). To ensure model capacity does not become a bottleneck when scaling data, we utilize a sufficiently large model, ViT-Large/14 (Dosovitskiy et al., 2020).
(2) Temporal ensemble: Diffusion Policy predicts a sequence of actions every steps, with each sequence having a length of (), and only the first steps are executed. We observe that discontinuities between executed action sequences can cause jerky motions during switching. To address this, we implement the temporal ensemble strategy proposed in ACT Zhao et al. (2023). Specifically, the policy predicts at each timestep, resulting in overlapping action sequences. At any given timestep, multiple predicted actions are averaged using an exponential weighting scheme, smoothing transitions and reducing motion discontinuity.
Evaluation. We conduct rigorous evaluations to ensure the reliability of our results. First, to evaluate the generalization performance of the policy, we exclusively test it in unseen environments or with unseen objects. Second, we use tester-assigned scores as the primary evaluation metric. Each manipulation task is divided into several stages or steps (typically 2–3), each with well-defined scoring criteria (see Appendix D). Each step can receive a maximum of 3 points, and we report a normalized score, defined as , with a maximum value of 1. Unlike the commonly used success rate—which is an overly sparse signal lacking the granularity to distinguish between policies—our scoring mechanism captures more nuanced behaviors. While action mean squared error (MSE) on the validation set is another potential metric, we find it often does not correlate with real-world performance (see Appendix E.1 for more details). Finally, to minimize the tester’s subjective bias, we simultaneously evaluate multiple policies trained on datasets of different sizes; each rollout is randomly selected from these multiple policies, while ensuring identical initial conditions for both the objects and the robot arm, enabling a fair comparison across policies. See Appendix E.2 for an example of the evaluation workflow and Appendix F for the hardware setup.
4 Unveiling of Data Scaling Laws
In this section, we first explore how increasing the number of training objects affects object generalization. Next, we analyze how the number of training environments impacts environment generalization. Finally, we study generalization across both dimensions simultaneously. Throughout all experiments, we also analyze the effect of demonstration quantity (Sec. 4.1). From these results, we derive the power-law data scaling laws (Sec. 4.2). Based on these laws, we further demonstrate an efficient data collection strategy to achieve a generalizable policy (Sec. 4.3).
4.1 Results and Qualitative Analysis
Tasks. We first focus on two manipulation tasks: Pour Water and Mouse Arrangement. In Pour Water, the robot performs three steps: first, it grabs a drinking bottle placed randomly on the table; second, it pours water into a mug; and finally, it places the bottle on a red coaster. This task demands precision, especially in aligning the bottle’s mouth with the mug. In Mouse Arrangement, the robot completes two steps: it picks up a mouse and positions it on a mouse pad with its front facing forward. The mouse may be tilted, requiring the robot to employ non-prehensile actions (i.e., pushing) to first align it. Illustrations of all tasks are shown in Fig. 1, with further task details available in Appendix D. Robot rollout videos can be found on our website.
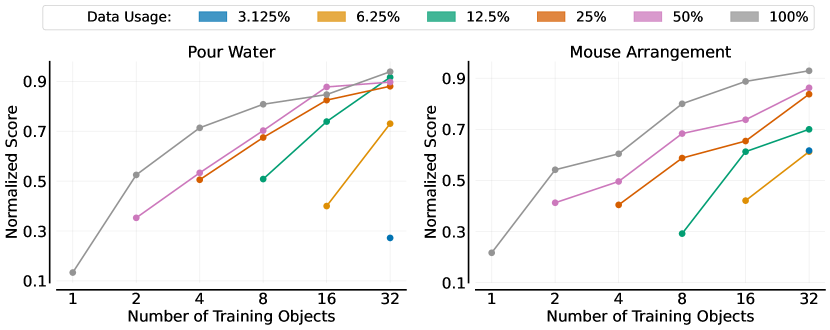
Object generalization. We use 32 distinct objects within the same environment to collect 120 demonstrations per object, yielding a total of 3,840 demonstrations for each task. After SLAM filtering, the number of valid demonstrations for Pour Water and Mouse Arrangement is reduced to 3,765 and 3,820, respectively. To investigate how the number of training objects influences the policy’s ability to generalize to unseen objects, we randomly select objects () from the pool of 32 for training. Furthermore, to examine how policy performance varies with the number of demonstrations, we randomly sample fractions of valid demonstrations () for each selected object. For each combination of , we train a policy if the total number of demonstrations exceeds 100. In total, 21 policies are trained, and each is evaluated using 8 unseen objects in the same environment as the training data, with 5 trials per object. The average normalized score across 40 trials is reported for each policy.
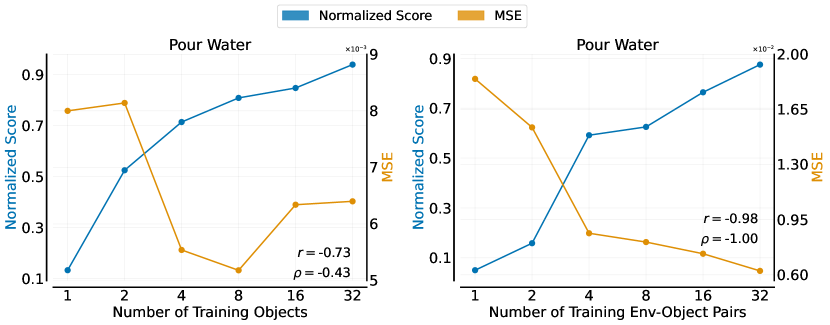
Fig 2 presents the results for the two tasks, leading to several key observations: (1) As the number of training objects increases, the policy’s performance on unseen objects consistently improves across all fractions of demonstrations. (2) With more training objects, fewer demonstrations are required per object. For example, in Pour Water, when training with 8 objects, the performance using 12.5% of the demonstrations significantly lags behind that using 100% of the demonstrations; however, this gap nearly disappears when training with 32 objects. (3) Object generalization is relatively easy to achieve. The initial slope of the performance curve is very steep: with only 8 training objects, the normalized score for both tasks exceeds 0.8. When the number of training objects reaches 32, the score surpasses 0.9. These scores correspond to policies that have already generalized well to any new objects within the same category.
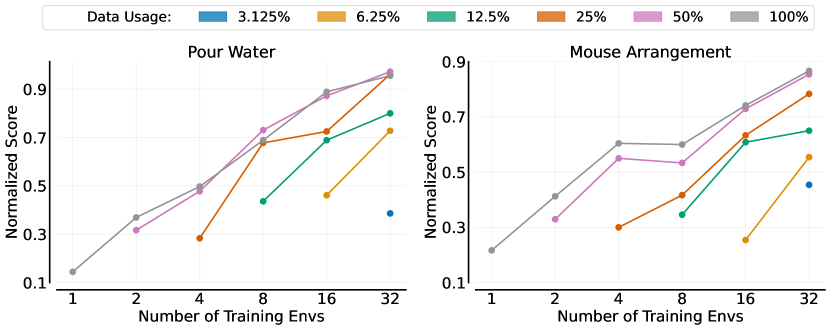
Environment generalization. To explore the effect of the number of training environments on generalization, we use the same manipulation object across 32 distinct environments, collecting 120 demonstrations per environment. For Pour Water and Mouse Arrangement, this result in 3,424 and 3,351 valid demonstrations, respectively. We randomly select environments () from the 32 available for training, and for each selected environment, we randomly select fractions of vaild demonstrations (). Each policy is evaluated in 8 unseen environments using the same object as in training, with 5 trials per environment.
Fig. 3 presents the results, revealing several notable patterns: (1) Increasing the number of training environments enhances the policy’s generalization performance on unseen environments. This trend persists even when the total number of demonstrations is kept constant (see Appendix G.2, Fig. 22). However, while increasing the fraction of demonstrations in each environment initially boosts performance, this improvement quickly diminishes, as indicated by the overlap of the lines representing 50% and 100% demonstration usage. (2) Environment generalization appears to be more challenging than object generalization for these two tasks. Comparing Fig. 2 and Fig. 3, we observe that when the number of environments or objects is small, increasing the number of environments results in smaller performance gains compared to increasing the number of objects. This is reflected in the lower slope of the performance curve for environment generalization.
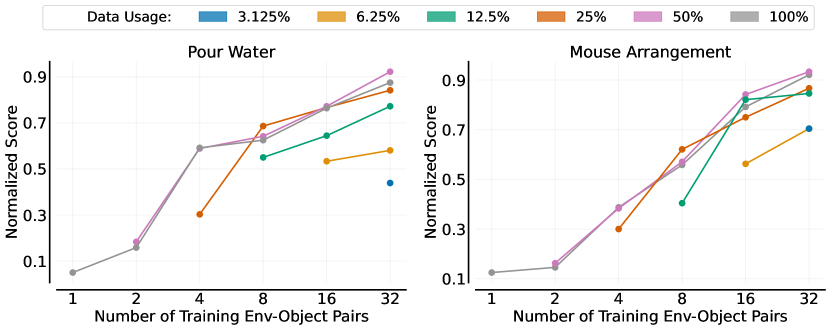
Generalization across both environments and objects. Next, we explore a setting where both the training environments and objects vary simultaneously. Data is collected from 32 environments, each paired with a unique object. For Pour Water and Mouse Arrangement, the number of valid demonstrations is 3,648 and 3,564, respectively. We randomly select environment-object pairs () from the pool of 32 for training and, for each selected pair, we randomly sample fractions of valid demonstrations (). Each policy is evaluated in 8 unseen environments, using two unseen objects per environment, with 5 trials per environment.
Fig. 4 illustrates that (1) increasing the number of training environment-object pairs substantially enhances the policy’s generalization performance, consistent with previous observations. (2) Interestingly, although generalizing across both novel environments and objects is more challenging, the benefit of additional demonstrations saturates faster in such cases (as evidenced by the overlapping lines for 25% and 100% demonstration usage). This indicates that, compared to changing either the environment or the object alone, simultaneously changing both increases data diversity, leading to more efficient policy learning and reducing dependence on the number of demonstrations. This finding further emphasizes that expanding the diversity of environments and objects is more effective than merely increasing the number of demonstrations for each individual environment or object.
4.2 Power-Law Fitting and Quantitative Analysis
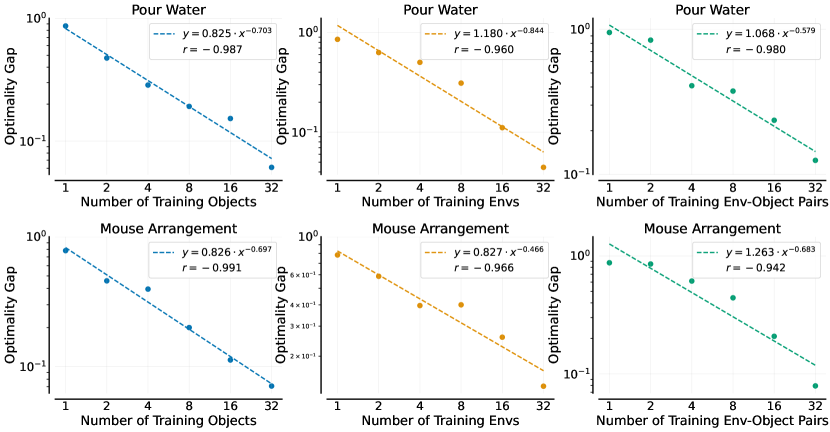
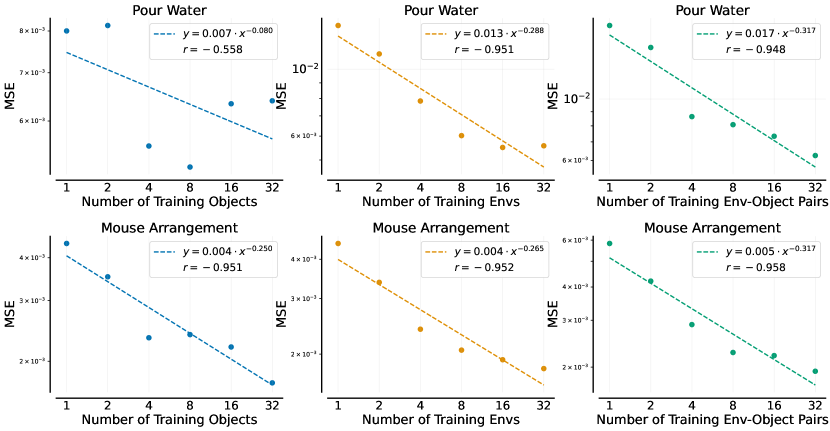
We next explore whether our experimental results follow power-law scaling laws, as seen in other domains. Specifically, if two variables and satisfy the relation 111Although we recognize the irreducible errors associated with scaling the data alone, fitting a three-parameter model does not seem statistically justified given that we have only 6 data points., they exhibit a power-law relationship. Applying a logarithmic transformation to both and reveals a linear relationship: . In our context, represents the optimality gap, defined as the deviation from the maximum score (i.e., ), while can denote the number of environments, objects, or demonstrations. Using data from our previous experiments with a 100% fraction of demonstrations, we fit a linear model to the log-transformed data, as shown in Fig. 5. Based on all the results, we summarize the following data scaling laws:
-
•
The policy’s generalization ability to new objects, new environments, or both scales approximately as a power law with the number of training objects, training environments, or training environment-object pairs, respectively. This is evidenced by the correlation coefficient in Fig. 5.
-
•
When the number of environments and objects is fixed, there is no clear power-law relationship between the number of demonstrations and the policy’s generalization performance. While performance initially increases rapidly with more demonstrations, it eventually plateaus, as most clearly shown in the leftmost plot of Fig. 7 (see caption for details).
These power laws regarding environments and objects can serve as predictive tools for larger-scale data. For example, according to the equation in Fig. 5, we predict that for Mouse Arrangement, achieving a normalized score of 0.99 on novel environments and objects would require 1,191 training environment-object pairs. We leave the verification of this prediction for future work.
4.3 Efficient Data Collection Strategy
In this section, we present an efficient data collection strategy guided by the data scaling law. Recall that our data is collected across environments and manipulation objects, with demonstrations for each object in every environment. The main question we seek to answer is: for a given manipulation task, how can we optimally select , , and to ensure strong generalization of the policy without incurring an excessively laborious data collection process? To explore this, we continue to use the tasks Pour Water and Mouse Arrangement as examples.
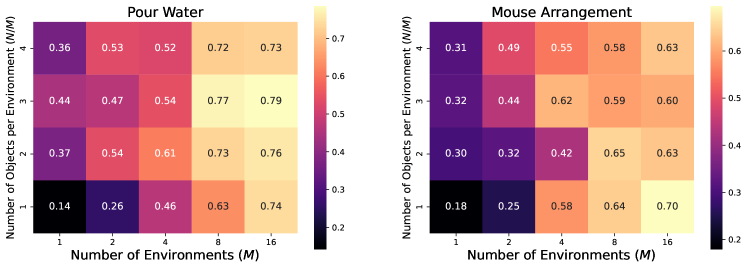
How to select the number of environments and objects? Previously, we consider only the setting where each environment contains a single unique manipulation object. In practical data collection, however, collecting multiple objects per environment might improve performance and thus be a more efficient method. To explore this possibility, we assume that is a multiple of , with each environment containing unique objects. Specifically, we use 16 environments, each containing 4 unique objects, and collect 120 demonstrations for each object (). For Pour Water and Mouse Arrangement, this results in 6,896 and 6,505 valid demonstrations, respectively. We then randomly select environments () from the 16 available environments. For each selected environment, we use all demonstrations of objects () as the training data. In total, we train 20 policies, each evaluated in 8 unseen environments using two novel objects per environment, with 5 trials for each environment.
The heatmap in Fig. 6 shows that when the number of environments is small, collecting multiple objects in each environment boosts performance. However, as the number of environments increases (e.g., to 16), the performance gap between collecting multiple objects per environment and just a single object becomes negligible. For large-scale data collection, where the number of environments typically exceeds 16, adding multiple objects within the same environment does not further enhance policy performance, suggesting that this approach may be unnecessary. Based on our experimental results, we recommend the following: collect data in as many diverse environments as possible, with only one unique object in each environment. When the total number of environment-object pairs reaches 32, it is generally sufficient to train a policy capable of operating in novel environments and interacting with previously unseen objects.
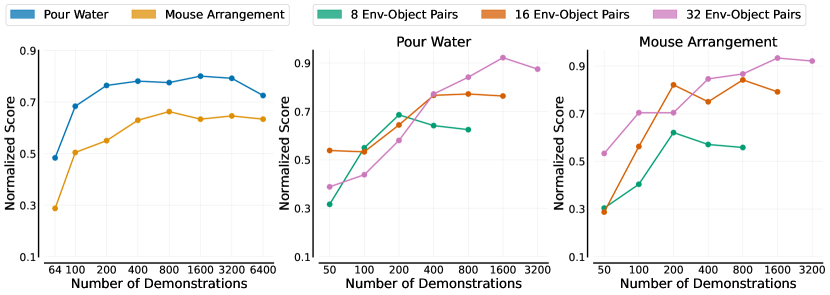
How to select the number of demonstrations? The experimental results in Sec. 4.1 indicate that increasing the number of demonstrations beyond a certain point yields minimal benefits. This section aims to identify that threshold. We first examine the setting where and (as in the previous experiment), representing the scenario with the maximum number of collected demonstrations—over 6400 in total. We vary the total number of demonstrations used for training, ranging from 64 to 6400, and train 8 policies. The results, presented in the leftmost plot of Fig. 7, show that performance for both tasks plateaus when the number of demonstrations reaches 800. Next, we consider our recommended setting of collecting environment-object pairs (i.e., ). The results, depicted in the two rightmost plots of Fig. 7, indicate that when the number of environment-object pairs is smaller, fewer total demonstrations are needed to reach saturation. Specifically, for 8, 16, and 32 pairs, performance plateaus at 400, 800, and 1600 demonstrations, respectively. Based on these findings, we recommend collecting 50 demonstrations per environment-object pair (i.e., ) for tasks of similar difficulty to ours. More challenging dexterous manipulation tasks may require more demonstrations; we leave the exploration of this aspect to future work.
5 Verification of Data Collection Strategy
| Pour Water | Mouse Arrangement | Fold Towels | Unplug Charger | |
|---|---|---|---|---|
| Score | 0.922 0.075 | 0.933 0.088 | 0.95 0.062 | 0.887 0.14 |
| Success Rate | 85.0 19.4% | 92.5 9.7% | 87.5 17.1% | 90.0 14.1% |
To verify the general applicability of our data collection strategy, we apply it to new tasks and assess whether a sufficiently generalizable policy can be trained. We experiment with two new tasks: Fold Towels and Unplug Charger. In Fold Towels, the robot first grasps the left edge of the towel and folds it to the right. In Unplug Charger, the robot grabs the charger plugged into a power strip and swiftly pulls it out. For each task, we collect data from 32 environment–object pairs, with 50 demonstrations per environment. Consistent with previous experiments, we evaluate the policy in 8 unseen environments, each with 2 unseen objects, and perform 5 trials per environment. The results, shown in Table 1, report both the policy’s normalized score and the corresponding success rate (for the definition of success criteria, see Appendix D). As the table indicates, our policies achieve around 90% success rates across all four tasks—the two from previous experiments and the two new ones. Notably, achieving this strong generalization performance on the two new tasks requires only one afternoon of data collection by four data collectors. This highlights the high efficiency of our data collection strategy and suggests that the time and cost required to train a single-task policy capable of zero-shot deployment to new environments and objects are moderate.
Case Score DINOv2 ViT-L/14 0.90 LfS ViT-L/14 0.03 frozen DINOv2 0.00 LoRA DINOv2 0.72 (a) Case Score DINOv2 ViT-S/14 0.66 DINOv2 ViT-B/14 0.81 DINOv2 ViT-L/14 0.90 (b) Case Score small U-Net 0.88 base U-Net 0.90 large U-Net 0.83 (c) Table 2: Model related experiments on Pour Water. The entries marked in gray are the same, which specify the default settings: the visual encoder is a fully fine-tuned ViT-L/14 model pre-trained with DINOv2, while the action diffusion model employs a base-size 1D CNN U-Net.
6 Model Size and Training Strategy: Beyond Data Scaling
Finally, we extend our exploration beyond data scaling to investigate the model side. The Diffusion Policy consists of two components: a visual encoder and an action diffusion model. Our investigation focuses on the importance of the training strategy for the visual encoder and the effects of scaling the parameters of both the visual encoder and the action diffusion model. We conduct experiments on Pour Water, using data collected from 32 environment-object pairs and selecting 50% of all valid demonstrations as the training set. The results, shown in Table 2, lead to several key observations: (1) Both pre-training and full fine-tuning are essential for the visual encoder. As shown in Table LABEL:tab:training_strategy, a Learning-from-Scratch (LfS) ViT-L/14 and the use of frozen DINOv2 pre-trained features achieve scores close to zero. Additionally, parameter-efficient fine-tuning methods like LoRA (rank=8) (Hu et al., 2021) do not match the performance of full fine-tuning. (2) Increasing the size of the visual encoder significantly enhances performance. Table LABEL:tab:visual_encoder_scaling demonstrates that scaling the visual encoder from ViT-Small to ViT-Large leads to a steady improvement in the policy’s generalization performance. (3) Contrary to expectations, scaling the action diffusion U-Net does not yield performance improvements. As shown in Table LABEL:tab:diffusion_model_scaling, despite the increase in maximum feature dimensions—from 512 to 2048—as the network scales from small to large, there is no corresponding improvement in score. In fact, performance slightly declines with the largest U-Net. We hypothesize that the small U-Net’s capacity may already be sufficient for modeling the current action distribution, or that we have yet to identify a scalable architecture or algorithm for action diffusion.
7 Discussion, Limitations, & Future Works
Data scaling is an exciting and ongoing event in robotics. Rather than blindly increasing data quantity, emphasis should be placed on data quality. What types of data should be scaled? How can this data be efficiently obtained? These are the fundamental questions we aim to answer. Specifically, in the context of imitation learning, we uncover the significant value of diversity in environments and objects within human demonstrations, identifying a power-law relationship in the process. Furthermore, we believe that in-the-wild generalization is the ultimate goal of data scaling, and our study aims to demonstrate that this goal is closer than it may appear. We show that, with a relatively modest investment of time and resources, it is possible to learn a single-task policy that can be deployed zero-shot to any environment and object. To further support researchers in this endeavor, we release our code, data, and models, with the hope of inspiring further efforts in this direction and ultimately leading to general-purpose robots capable of solving complex, open-world problems.
Our work has several limitations that future research can address. First, we focus on data scaling for single-task policies and do not explore task-level generalization, as this would require collecting data from thousands of tasks. Future studies could incorporate language-conditioned policies to explore how to scale data to obtain a policy that can follow any new task instructions (Kim et al., 2024). Second, we study data scaling only in imitation learning, while reinforcement learning (RL) likely enhances policy capabilities further; future research can investigate the data scaling laws for RL. Third, our use of UMI for data collection introduces inherent small errors in the demonstrations, and we model the data using only Diffusion Policy algorithm. Future research can investigate how data quality and policy learning algorithms affect data scaling laws. Lastly, due to resource constraints, we explore and validate data scaling laws on only four tasks; we hope that future work will verify our conclusions on a larger and more complex set of tasks.
Acknowledgments
This work is supported by the Ministry of Science and Technology of the People’s Republic of China, the 2030 Innovation Megaprojects “Program on New Generation Artificial Intelligence” (Grant No. 2021AAA0150000). This work is also supported by the National Key R&D Program of China (2022ZD0161700).
The robot hardware is partially supported by Tsinghua ISR Lab. We would like to express our gratitude to Cheng Chi and Chuer Pan for their invaluable advice on UMI. We are also thankful to Linkai Wang for his assistance in setting up the movable platform. Additionally, we appreciate the thoughtful discussions and feedback provided by Tong Zhang, Ruiqian Nai, Geng Chen, Weijun Dong, Shengjie Wang, and Renhao Wang.
References
- Achiam et al. (2023) Josh Achiam, Steven Adler, Sandhini Agarwal, Lama Ahmad, Ilge Akkaya, Florencia Leoni Aleman, Diogo Almeida, Janko Altenschmidt, Sam Altman, Shyamal Anadkat, et al. Gpt-4 technical report. arXiv preprint arXiv:2303.08774, 2023.
- Ahn et al. (2022) Michael Ahn, Anthony Brohan, Noah Brown, Yevgen Chebotar, Omar Cortes, Byron David, Chelsea Finn, Chuyuan Fu, Keerthana Gopalakrishnan, Karol Hausman, et al. Do as i can, not as i say: Grounding language in robotic affordances. arXiv preprint arXiv:2204.01691, 2022.
- Bahl et al. (2022) Shikhar Bahl, Abhinav Gupta, and Deepak Pathak. Human-to-robot imitation in the wild. arXiv preprint arXiv:2207.09450, 2022.
- Bharadhwaj et al. (2023) Homanga Bharadhwaj, Jay Vakil, Mohit Sharma, Abhinav Gupta, Shubham Tulsiani, and Vikash Kumar. Roboagent: Generalization and efficiency in robot manipulation via semantic augmentations and action chunking. arXiv preprint arXiv:2309.01918, 2023.
- Bommasani et al. (2021) Rishi Bommasani, Drew A Hudson, Ehsan Adeli, Russ Altman, Simran Arora, Sydney von Arx, Michael S Bernstein, Jeannette Bohg, Antoine Bosselut, Emma Brunskill, et al. On the opportunities and risks of foundation models. arXiv preprint arXiv:2108.07258, 2021.
- Brohan et al. (2022) Anthony Brohan, Noah Brown, Justice Carbajal, Yevgen Chebotar, Joseph Dabis, Chelsea Finn, Keerthana Gopalakrishnan, Karol Hausman, Alex Herzog, Jasmine Hsu, et al. Rt-1: Robotics transformer for real-world control at scale. arXiv preprint arXiv:2212.06817, 2022.
- Brohan et al. (2023) Anthony Brohan, Noah Brown, Justice Carbajal, Yevgen Chebotar, Xi Chen, Krzysztof Choromanski, Tianli Ding, Danny Driess, Avinava Dubey, Chelsea Finn, et al. Rt-2: Vision-language-action models transfer web knowledge to robotic control. arXiv preprint arXiv:2307.15818, 2023.
- Brown et al. (2020) Tom Brown, Benjamin Mann, Nick Ryder, Melanie Subbiah, Jared D Kaplan, Prafulla Dhariwal, Arvind Neelakantan, Pranav Shyam, Girish Sastry, Amanda Askell, et al. Language models are few-shot learners. Advances in neural information processing systems, 33:1877–1901, 2020.
- Caron et al. (2021) Mathilde Caron, Hugo Touvron, Ishan Misra, Hervé Jégou, Julien Mairal, Piotr Bojanowski, and Armand Joulin. Emerging properties in self-supervised vision transformers. In Proceedings of the IEEE/CVF international conference on computer vision, pp. 9650–9660, 2021.
- Chen et al. (2021) Annie S Chen, Suraj Nair, and Chelsea Finn. Learning generalizable robotic reward functions from” in-the-wild” human videos. arXiv preprint arXiv:2103.16817, 2021.
- Cheng et al. (2024) Xuxin Cheng, Jialong Li, Shiqi Yang, Ge Yang, and Xiaolong Wang. Open-television: Teleoperation with immersive active visual feedback. arXiv preprint arXiv:2407.01512, 2024.
- Chi et al. (2023) Cheng Chi, Siyuan Feng, Yilun Du, Zhenjia Xu, Eric Cousineau, Benjamin Burchfiel, and Shuran Song. Diffusion policy: Visuomotor policy learning via action diffusion. arXiv preprint arXiv:2303.04137, 2023.
- Chi et al. (2024) Cheng Chi, Zhenjia Xu, Chuer Pan, Eric Cousineau, Benjamin Burchfiel, Siyuan Feng, Russ Tedrake, and Shuran Song. Universal manipulation interface: In-the-wild robot teaching without in-the-wild robots. arXiv preprint arXiv:2402.10329, 2024.
- Dasari et al. (2019) Sudeep Dasari, Frederik Ebert, Stephen Tian, Suraj Nair, Bernadette Bucher, Karl Schmeckpeper, Siddharth Singh, Sergey Levine, and Chelsea Finn. Robonet: Large-scale multi-robot learning. arXiv preprint arXiv:1910.11215, 2019.
- Deng et al. (2009) Jia Deng, Wei Dong, Richard Socher, Li-Jia Li, Kai Li, and Li Fei-Fei. Imagenet: A large-scale hierarchical image database. In 2009 IEEE conference on computer vision and pattern recognition, pp. 248–255. Ieee, 2009.
- Dosovitskiy et al. (2020) Alexey Dosovitskiy, Lucas Beyer, Alexander Kolesnikov, Dirk Weissenborn, Xiaohua Zhai, Thomas Unterthiner, Mostafa Dehghani, Matthias Minderer, Georg Heigold, Sylvain Gelly, et al. An image is worth 16x16 words: Transformers for image recognition at scale. arXiv preprint arXiv:2010.11929, 2020.
- Ebert et al. (2021) Frederik Ebert, Yanlai Yang, Karl Schmeckpeper, Bernadette Bucher, Georgios Georgakis, Kostas Daniilidis, Chelsea Finn, and Sergey Levine. Bridge data: Boosting generalization of robotic skills with cross-domain datasets. arXiv preprint arXiv:2109.13396, 2021.
- Etukuru et al. (2024) Haritheja Etukuru, Norihito Naka, Zijin Hu, Julian Mehu, Aaron Edsinger, Chris Paxton, Soumith Chintala, Lerrel Pinto, and Nur Muhammad Mahi Shafiullah. General policies for zero-shot deployment in new environments. 2024.
- Fang et al. (2023a) Hao-Shu Fang, Hongjie Fang, Zhenyu Tang, Jirong Liu, Chenxi Wang, Junbo Wang, Haoyi Zhu, and Cewu Lu. Rh20t: A comprehensive robotic dataset for learning diverse skills in one-shot. In Towards Generalist Robots: Learning Paradigms for Scalable Skill Acquisition@ CoRL2023, 2023a.
- Fang et al. (2023b) Hao-Shu Fang, Chenxi Wang, Hongjie Fang, Minghao Gou, Jirong Liu, Hengxu Yan, Wenhai Liu, Yichen Xie, and Cewu Lu. Anygrasp: Robust and efficient grasp perception in spatial and temporal domains. IEEE Transactions on Robotics, 2023b.
- Fang et al. (2023c) Hongjie Fang, Hao-Shu Fang, Yiming Wang, Jieji Ren, Jingjing Chen, Ruo Zhang, Weiming Wang, and Cewu Lu. Low-cost exoskeletons for learning whole-arm manipulation in the wild. arXiv preprint arXiv:2309.14975, 2023c.
- Fu et al. (2024) Zipeng Fu, Tony Z Zhao, and Chelsea Finn. Mobile aloha: Learning bimanual mobile manipulation with low-cost whole-body teleoperation. arXiv preprint arXiv:2401.02117, 2024.
- Gao et al. (2024) Jensen Gao, Annie Xie, Ted Xiao, Chelsea Finn, and Dorsa Sadigh. Efficient data collection for robotic manipulation via compositional generalization. arXiv preprint arXiv:2403.05110, 2024.
- Hansen et al. (2020) Nicklas Hansen, Rishabh Jangir, Yu Sun, Guillem Alenyà, Pieter Abbeel, Alexei A Efros, Lerrel Pinto, and Xiaolong Wang. Self-supervised policy adaptation during deployment. arXiv preprint arXiv:2007.04309, 2020.
- He et al. (2016) Kaiming He, Xiangyu Zhang, Shaoqing Ren, and Jian Sun. Deep residual learning for image recognition. In Proceedings of the IEEE conference on computer vision and pattern recognition, pp. 770–778, 2016.
- Henighan et al. (2020) Tom Henighan, Jared Kaplan, Mor Katz, Mark Chen, Christopher Hesse, Jacob Jackson, Heewoo Jun, Tom B Brown, Prafulla Dhariwal, Scott Gray, et al. Scaling laws for autoregressive generative modeling. arXiv preprint arXiv:2010.14701, 2020.
- Hilton et al. (2023) Jacob Hilton, Jie Tang, and John Schulman. Scaling laws for single-agent reinforcement learning. arXiv preprint arXiv:2301.13442, 2023.
- Hu et al. (2021) Edward J Hu, Yelong Shen, Phillip Wallis, Zeyuan Allen-Zhu, Yuanzhi Li, Shean Wang, Lu Wang, and Weizhu Chen. Lora: Low-rank adaptation of large language models. arXiv preprint arXiv:2106.09685, 2021.
- Hu et al. (2023a) Yingdong Hu, Fanqi Lin, Tong Zhang, Li Yi, and Yang Gao. Look before you leap: Unveiling the power of gpt-4v in robotic vision-language planning. arXiv preprint arXiv:2311.17842, 2023a.
- Hu et al. (2023b) Yingdong Hu, Renhao Wang, Li Erran Li, and Yang Gao. For pre-trained vision models in motor control, not all policy learning methods are created equal. In International Conference on Machine Learning, pp. 13628–13651. PMLR, 2023b.
- Iyer et al. (2024) Aadhithya Iyer, Zhuoran Peng, Yinlong Dai, Irmak Guzey, Siddhant Haldar, Soumith Chintala, and Lerrel Pinto. Open teach: A versatile teleoperation system for robotic manipulation. arXiv preprint arXiv:2403.07870, 2024.
- Jang et al. (2022) Eric Jang, Alex Irpan, Mohi Khansari, Daniel Kappler, Frederik Ebert, Corey Lynch, Sergey Levine, and Chelsea Finn. Bc-z: Zero-shot task generalization with robotic imitation learning. In Conference on Robot Learning, pp. 991–1002. PMLR, 2022.
- Kalashnikov et al. (2018) Dmitry Kalashnikov, Alex Irpan, Peter Pastor, Julian Ibarz, Alexander Herzog, Eric Jang, Deirdre Quillen, Ethan Holly, Mrinal Kalakrishnan, Vincent Vanhoucke, et al. Scalable deep reinforcement learning for vision-based robotic manipulation. In Conference on robot learning, pp. 651–673. PMLR, 2018.
- Kaplan et al. (2020) Jared Kaplan, Sam McCandlish, Tom Henighan, Tom B Brown, Benjamin Chess, Rewon Child, Scott Gray, Alec Radford, Jeffrey Wu, and Dario Amodei. Scaling laws for neural language models. arXiv preprint arXiv:2001.08361, 2020.
- Khazatsky et al. (2024) Alexander Khazatsky, Karl Pertsch, Suraj Nair, Ashwin Balakrishna, Sudeep Dasari, Siddharth Karamcheti, Soroush Nasiriany, Mohan Kumar Srirama, Lawrence Yunliang Chen, Kirsty Ellis, et al. Droid: A large-scale in-the-wild robot manipulation dataset. arXiv preprint arXiv:2403.12945, 2024.
- Kim et al. (2024) Moo Jin Kim, Karl Pertsch, Siddharth Karamcheti, Ted Xiao, Ashwin Balakrishna, Suraj Nair, Rafael Rafailov, Ethan Foster, Grace Lam, Pannag Sanketi, et al. Openvla: An open-source vision-language-action model. arXiv preprint arXiv:2406.09246, 2024.
- Kirillov et al. (2023) Alexander Kirillov, Eric Mintun, Nikhila Ravi, Hanzi Mao, Chloe Rolland, Laura Gustafson, Tete Xiao, Spencer Whitehead, Alexander C Berg, Wan-Yen Lo, et al. Segment anything. In Proceedings of the IEEE/CVF International Conference on Computer Vision, pp. 4015–4026, 2023.
- Liu et al. (2024) Jingzhe Liu, Haitao Mao, Zhikai Chen, Tong Zhao, Neil Shah, and Jiliang Tang. Neural scaling laws on graphs. arXiv preprint arXiv:2402.02054, 2024.
- (39) Steven Lovegrove. Pangolin: A lightweight portable rapid development library for managing opengl display / interaction and abstracting video input. https://github.com/stevenlovegrove/Pangolin.
- Ma et al. (2022) Yecheng Jason Ma, Shagun Sodhani, Dinesh Jayaraman, Osbert Bastani, Vikash Kumar, and Amy Zhang. Vip: Towards universal visual reward and representation via value-implicit pre-training. arXiv preprint arXiv:2210.00030, 2022.
- Mahler et al. (2017) Jeffrey Mahler, Jacky Liang, Sherdil Niyaz, Michael Laskey, Richard Doan, Xinyu Liu, Juan Aparicio Ojea, and Ken Goldberg. Dex-net 2.0: Deep learning to plan robust grasps with synthetic point clouds and analytic grasp metrics. arXiv preprint arXiv:1703.09312, 2017.
- Mandlekar et al. (2018) Ajay Mandlekar, Yuke Zhu, Animesh Garg, Jonathan Booher, Max Spero, Albert Tung, Julian Gao, John Emmons, Anchit Gupta, Emre Orbay, et al. Roboturk: A crowdsourcing platform for robotic skill learning through imitation. In Conference on Robot Learning, pp. 879–893. PMLR, 2018.
- Mu et al. (2021) Tongzhou Mu, Zhan Ling, Fanbo Xiang, Derek Yang, Xuanlin Li, Stone Tao, Zhiao Huang, Zhiwei Jia, and Hao Su. Maniskill: Generalizable manipulation skill benchmark with large-scale demonstrations. arXiv preprint arXiv:2107.14483, 2021.
- Oquab et al. (2023) Maxime Oquab, Timothée Darcet, Théo Moutakanni, Huy Vo, Marc Szafraniec, Vasil Khalidov, Pierre Fernandez, Daniel Haziza, Francisco Massa, Alaaeldin El-Nouby, et al. Dinov2: Learning robust visual features without supervision. arXiv preprint arXiv:2304.07193, 2023.
- Padalkar et al. (2023) Abhishek Padalkar, Acorn Pooley, Ajinkya Jain, Alex Bewley, Alex Herzog, Alex Irpan, Alexander Khazatsky, Anant Rai, Anikait Singh, Anthony Brohan, et al. Open x-embodiment: Robotic learning datasets and rt-x models. arXiv preprint arXiv:2310.08864, 2023.
- Pari et al. (2021) Jyothish Pari, Nur Muhammad Shafiullah, Sridhar Pandian Arunachalam, and Lerrel Pinto. The surprising effectiveness of representation learning for visual imitation. arXiv preprint arXiv:2112.01511, 2021.
- Peebles & Xie (2023) William Peebles and Saining Xie. Scalable diffusion models with transformers. In Proceedings of the IEEE/CVF International Conference on Computer Vision, pp. 4195–4205, 2023.
- Pumacay et al. (2024) Wilbert Pumacay, Ishika Singh, Jiafei Duan, Ranjay Krishna, Jesse Thomason, and Dieter Fox. The colosseum: A benchmark for evaluating generalization for robotic manipulation. arXiv preprint arXiv:2402.08191, 2024.
- Qin et al. (2022) Yuzhe Qin, Yueh-Hua Wu, Shaowei Liu, Hanwen Jiang, Ruihan Yang, Yang Fu, and Xiaolong Wang. Dexmv: Imitation learning for dexterous manipulation from human videos. In European Conference on Computer Vision, pp. 570–587. Springer, 2022.
- Radford et al. (2021) Alec Radford, Jong Wook Kim, Chris Hallacy, Aditya Ramesh, Gabriel Goh, Sandhini Agarwal, Girish Sastry, Amanda Askell, Pamela Mishkin, Jack Clark, et al. Learning transferable visual models from natural language supervision. In International conference on machine learning, pp. 8748–8763. PMLR, 2021.
- Ronneberger et al. (2015) Olaf Ronneberger, Philipp Fischer, and Thomas Brox. U-net: Convolutional networks for biomedical image segmentation. In Medical image computing and computer-assisted intervention–MICCAI 2015: 18th international conference, Munich, Germany, October 5-9, 2015, proceedings, part III 18, pp. 234–241. Springer, 2015.
- Shafiullah et al. (2023) Nur Muhammad Mahi Shafiullah, Anant Rai, Haritheja Etukuru, Yiqian Liu, Ishan Misra, Soumith Chintala, and Lerrel Pinto. On bringing robots home. arXiv preprint arXiv:2311.16098, 2023.
- Shafiullah et al. (2024) Nur Muhammad Mahi. Shafiullah, Siyuan. Feng, Lerrel. Pinto, and Russ. Tedrake. Supervised policy learning for real robots, July 2024. URL https://supervised-robot-learning.github.io. Tutorial presented at the Robotics: Science and Systems (RSS), Delft.
- Sharma et al. (2018) Pratyusha Sharma, Lekha Mohan, Lerrel Pinto, and Abhinav Gupta. Multiple interactions made easy (mime): Large scale demonstrations data for imitation. In Conference on robot learning, pp. 906–915. PMLR, 2018.
- Song et al. (2020a) Jiaming Song, Chenlin Meng, and Stefano Ermon. Denoising diffusion implicit models. arXiv preprint arXiv:2010.02502, 2020a.
- Song et al. (2020b) Shuran Song, Andy Zeng, Johnny Lee, and Thomas Funkhouser. Grasping in the wild: Learning 6dof closed-loop grasping from low-cost demonstrations. IEEE Robotics and Automation Letters, 5(3):4978–4985, 2020b.
- Team et al. (2024) Octo Model Team, Dibya Ghosh, Homer Walke, Karl Pertsch, Kevin Black, Oier Mees, Sudeep Dasari, Joey Hejna, Tobias Kreiman, Charles Xu, et al. Octo: An open-source generalist robot policy. arXiv preprint arXiv:2405.12213, 2024.
- Teoh et al. (2024) Eugene Teoh, Sumit Patidar, Xiao Ma, and Stephen James. Green screen augmentation enables scene generalisation in robotic manipulation. arXiv preprint arXiv:2407.07868, 2024.
- Touvron et al. (2023) Hugo Touvron, Louis Martin, Kevin Stone, Peter Albert, Amjad Almahairi, Yasmine Babaei, Nikolay Bashlykov, Soumya Batra, Prajjwal Bhargava, Shruti Bhosale, et al. Llama 2: Open foundation and fine-tuned chat models. arXiv preprint arXiv:2307.09288, 2023.
- Walke et al. (2023) Homer Rich Walke, Kevin Black, Tony Z Zhao, Quan Vuong, Chongyi Zheng, Philippe Hansen-Estruch, Andre Wang He, Vivek Myers, Moo Jin Kim, Max Du, et al. Bridgedata v2: A dataset for robot learning at scale. In Conference on Robot Learning, pp. 1723–1736. PMLR, 2023.
- Wang et al. (2023) Chen Wang, Linxi Fan, Jiankai Sun, Ruohan Zhang, Li Fei-Fei, Danfei Xu, Yuke Zhu, and Anima Anandkumar. Mimicplay: Long-horizon imitation learning by watching human play. arXiv preprint arXiv:2302.12422, 2023.
- Wen et al. (2023) Chuan Wen, Xingyu Lin, John So, Kai Chen, Qi Dou, Yang Gao, and Pieter Abbeel. Any-point trajectory modeling for policy learning. arXiv preprint arXiv:2401.00025, 2023.
- Wu et al. (2023) Philipp Wu, Yide Shentu, Zhongke Yi, Xingyu Lin, and Pieter Abbeel. Gello: A general, low-cost, and intuitive teleoperation framework for robot manipulators. arXiv preprint arXiv:2309.13037, 2023.
- Xie et al. (2024) Annie Xie, Lisa Lee, Ted Xiao, and Chelsea Finn. Decomposing the generalization gap in imitation learning for visual robotic manipulation. In 2024 IEEE International Conference on Robotics and Automation (ICRA), pp. 3153–3160. IEEE, 2024.
- Xing et al. (2021) Eliot Xing, Abhinav Gupta, Sam Powers*, and Victoria Dean*. Kitchenshift: Evaluating zero-shot generalization of imitation-based policy learning under domain shifts. In NeurIPS 2021 Workshop on Distribution Shifts: Connecting Methods and Applications, 2021. URL https://openreview.net/forum?id=DdglKo8hBq0.
- Yang et al. (2023) Ruihan Yang, Yejin Kim, Aniruddha Kembhavi, Xiaolong Wang, and Kiana Ehsani. Harmonic mobile manipulation, 2023.
- Young et al. (2021) Sarah Young, Dhiraj Gandhi, Shubham Tulsiani, Abhinav Gupta, Pieter Abbeel, and Lerrel Pinto. Visual imitation made easy. In Conference on Robot Learning, pp. 1992–2005. PMLR, 2021.
- Ze et al. (2024) Yanjie Ze, Gu Zhang, Kangning Zhang, Chenyuan Hu, Muhan Wang, and Huazhe Xu. 3d diffusion policy: Generalizable visuomotor policy learning via simple 3d representations. In Proceedings of Robotics: Science and Systems (RSS), 2024.
- Zhai et al. (2022) Xiaohua Zhai, Alexander Kolesnikov, Neil Houlsby, and Lucas Beyer. Scaling vision transformers. In Proceedings of the IEEE/CVF conference on computer vision and pattern recognition, pp. 12104–12113, 2022.
- Zhang et al. (2018) Tianhao Zhang, Zoe McCarthy, Owen Jow, Dennis Lee, Xi Chen, Ken Goldberg, and Pieter Abbeel. Deep imitation learning for complex manipulation tasks from virtual reality teleoperation. In 2018 IEEE international conference on robotics and automation (ICRA), pp. 5628–5635. IEEE, 2018.
- Zhao et al. (2023) Tony Z Zhao, Vikash Kumar, Sergey Levine, and Chelsea Finn. Learning fine-grained bimanual manipulation with low-cost hardware. arXiv preprint arXiv:2304.13705, 2023.
- Zhao et al. (2024) Tony Z. Zhao, Jonathan Tompson, Danny Driess, Pete Florence, Seyed Kamyar Seyed Ghasemipour, Chelsea Finn, and Ayzaan Wahid. ALOHA unleashed: A simple recipe for robot dexterity. In 8th Annual Conference on Robot Learning, 2024. URL https://openreview.net/forum?id=gvdXE7ikHI.
- Zhu et al. (2023a) Yifeng Zhu, Zhenyu Jiang, Peter Stone, and Yuke Zhu. Learning generalizable manipulation policies with object-centric 3d representations. arXiv preprint arXiv:2310.14386, 2023a.
- Zhu et al. (2023b) Yifeng Zhu, Abhishek Joshi, Peter Stone, and Yuke Zhu. Viola: Imitation learning for vision-based manipulation with object proposal priors. In Conference on Robot Learning, pp. 1199–1210. PMLR, 2023b.
- Zhu et al. (2024) Yifeng Zhu, Arisrei Lim, Peter Stone, and Yuke Zhu. Vision-based manipulation from single human video with open-world object graphs. arXiv preprint arXiv:2405.20321, 2024.
- Zhu et al. (2020) Yuke Zhu, Josiah Wong, Ajay Mandlekar, and Roberto Martín-Martín. robosuite: A modular simulation framework and benchmark for robot learning. arXiv preprint arXiv:2009.12293, 2020.
Appendices
[appendices] \printcontents[appendices]l0
Appendix A Environment and Object Visualizations
A.1 Environment Visualizations
Figure 12 presents the 8 unseen testing environments.
A.2 Object Visualizations
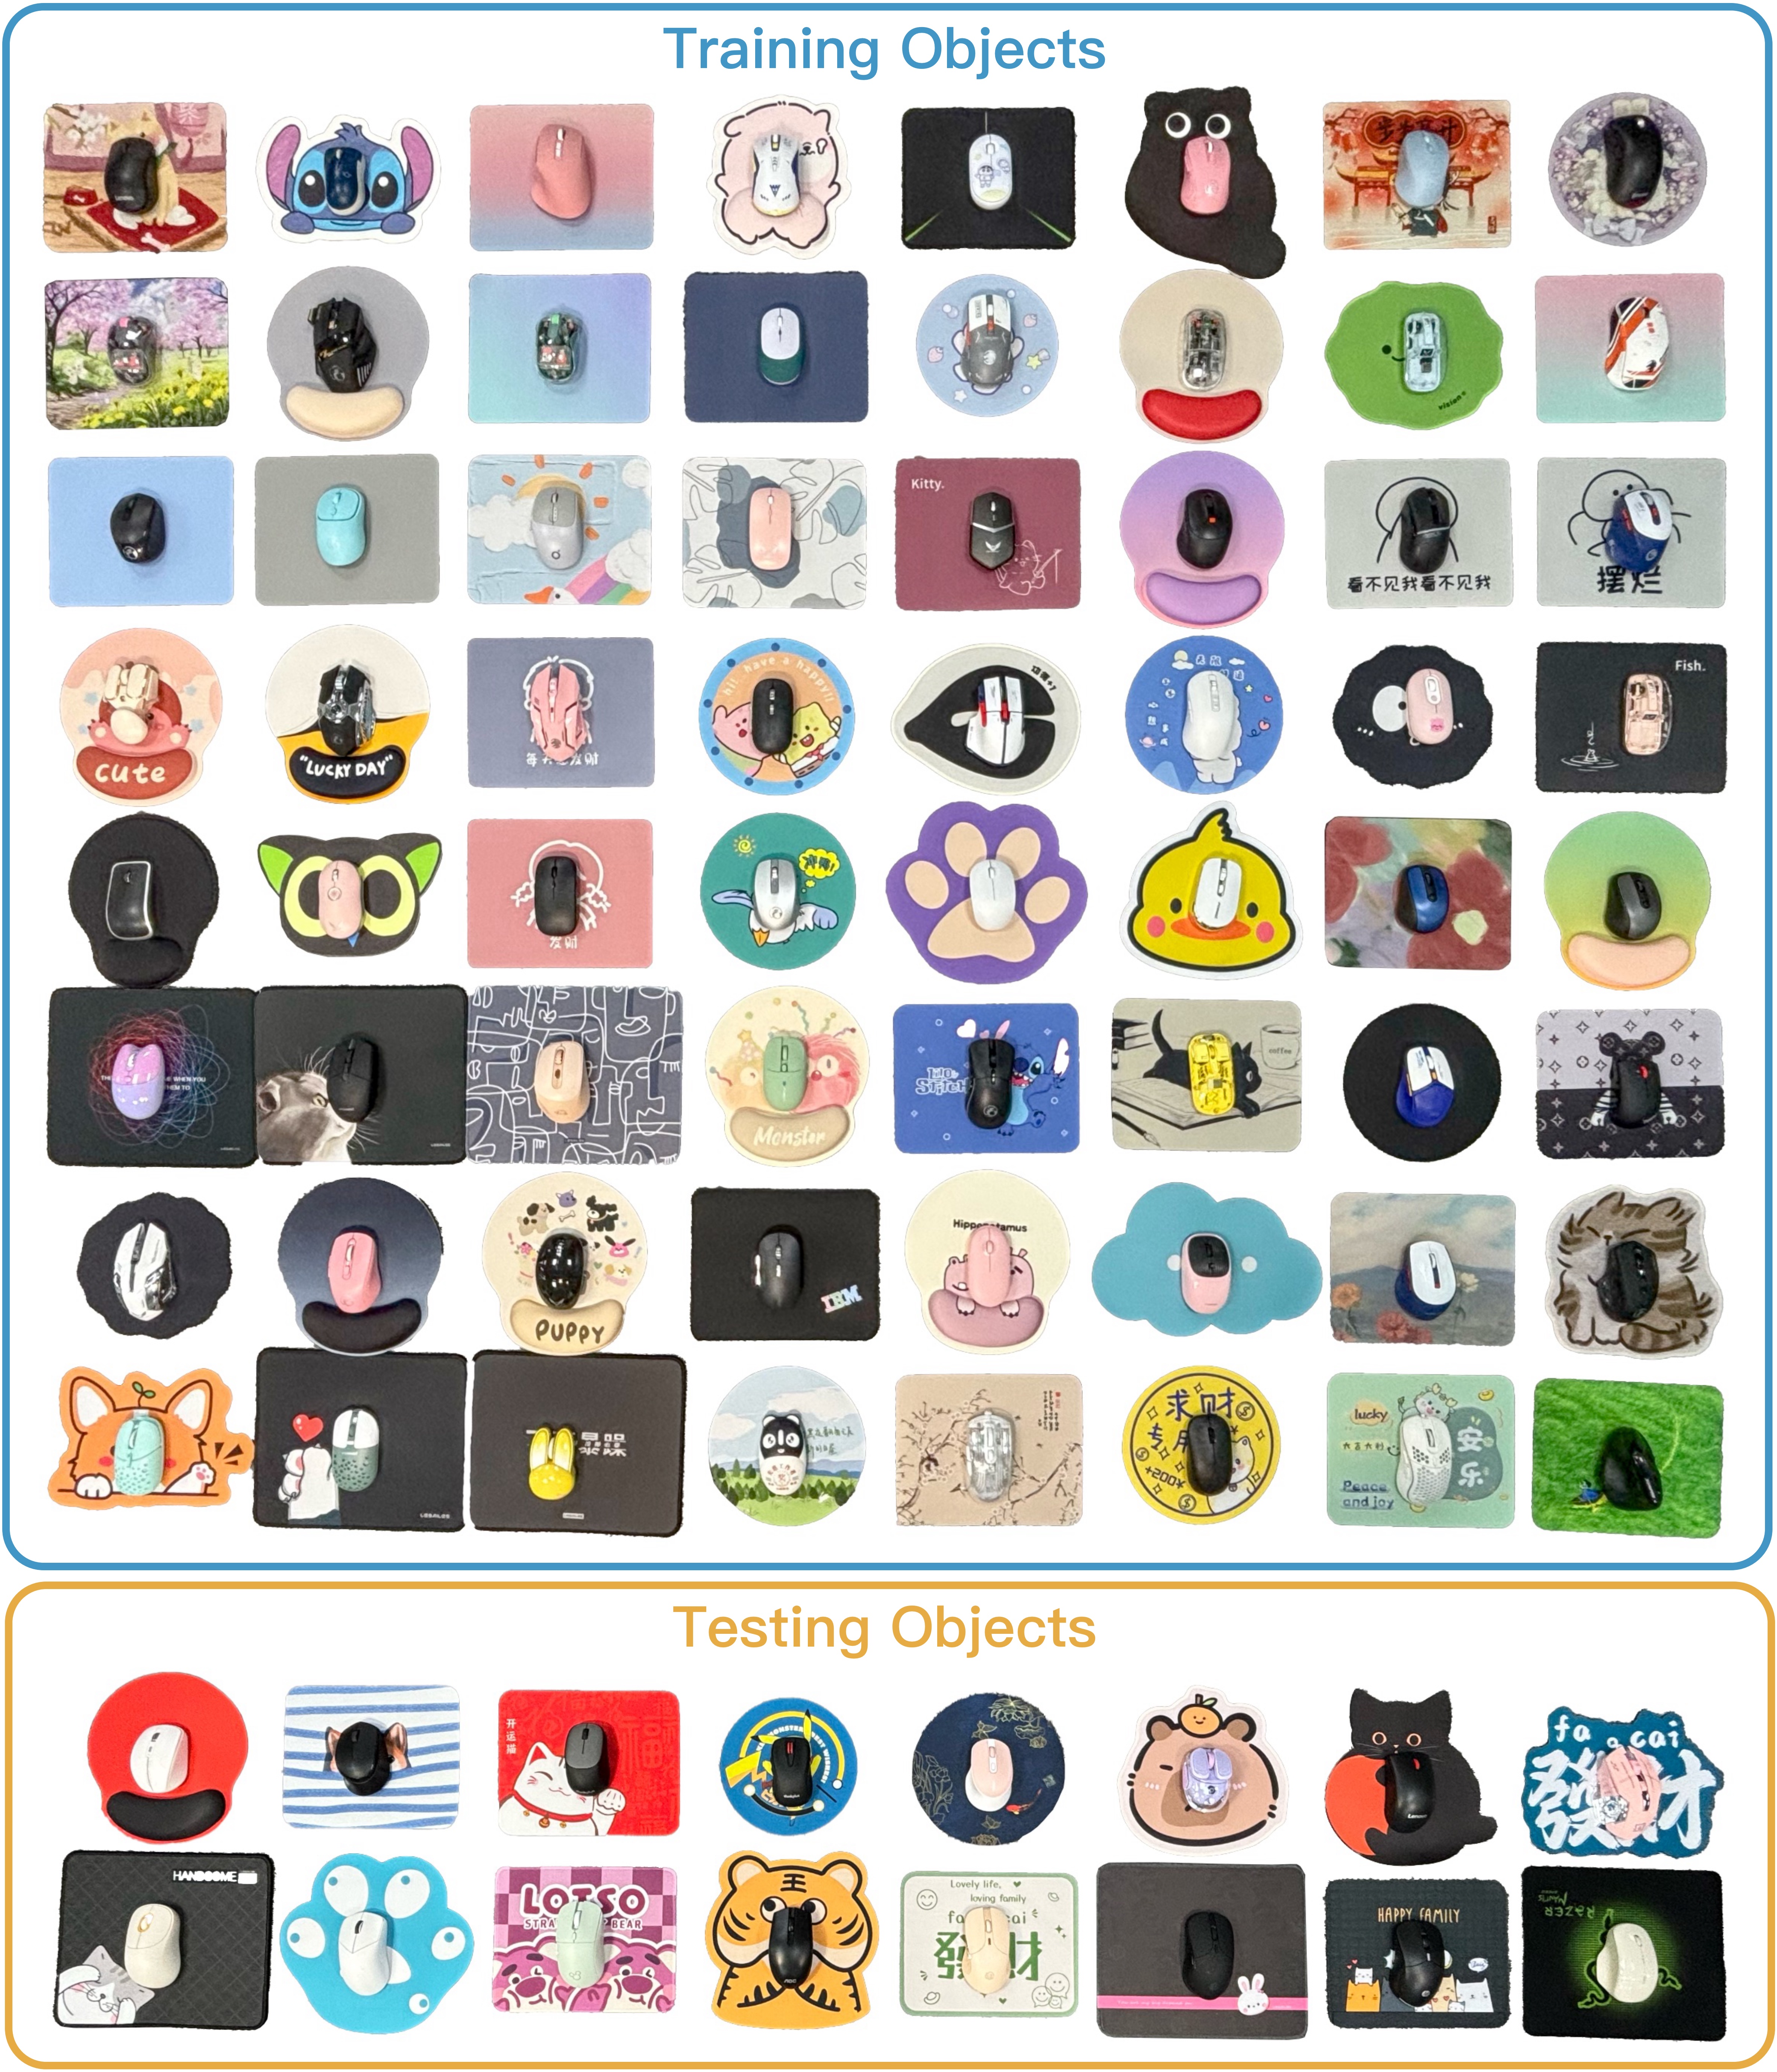
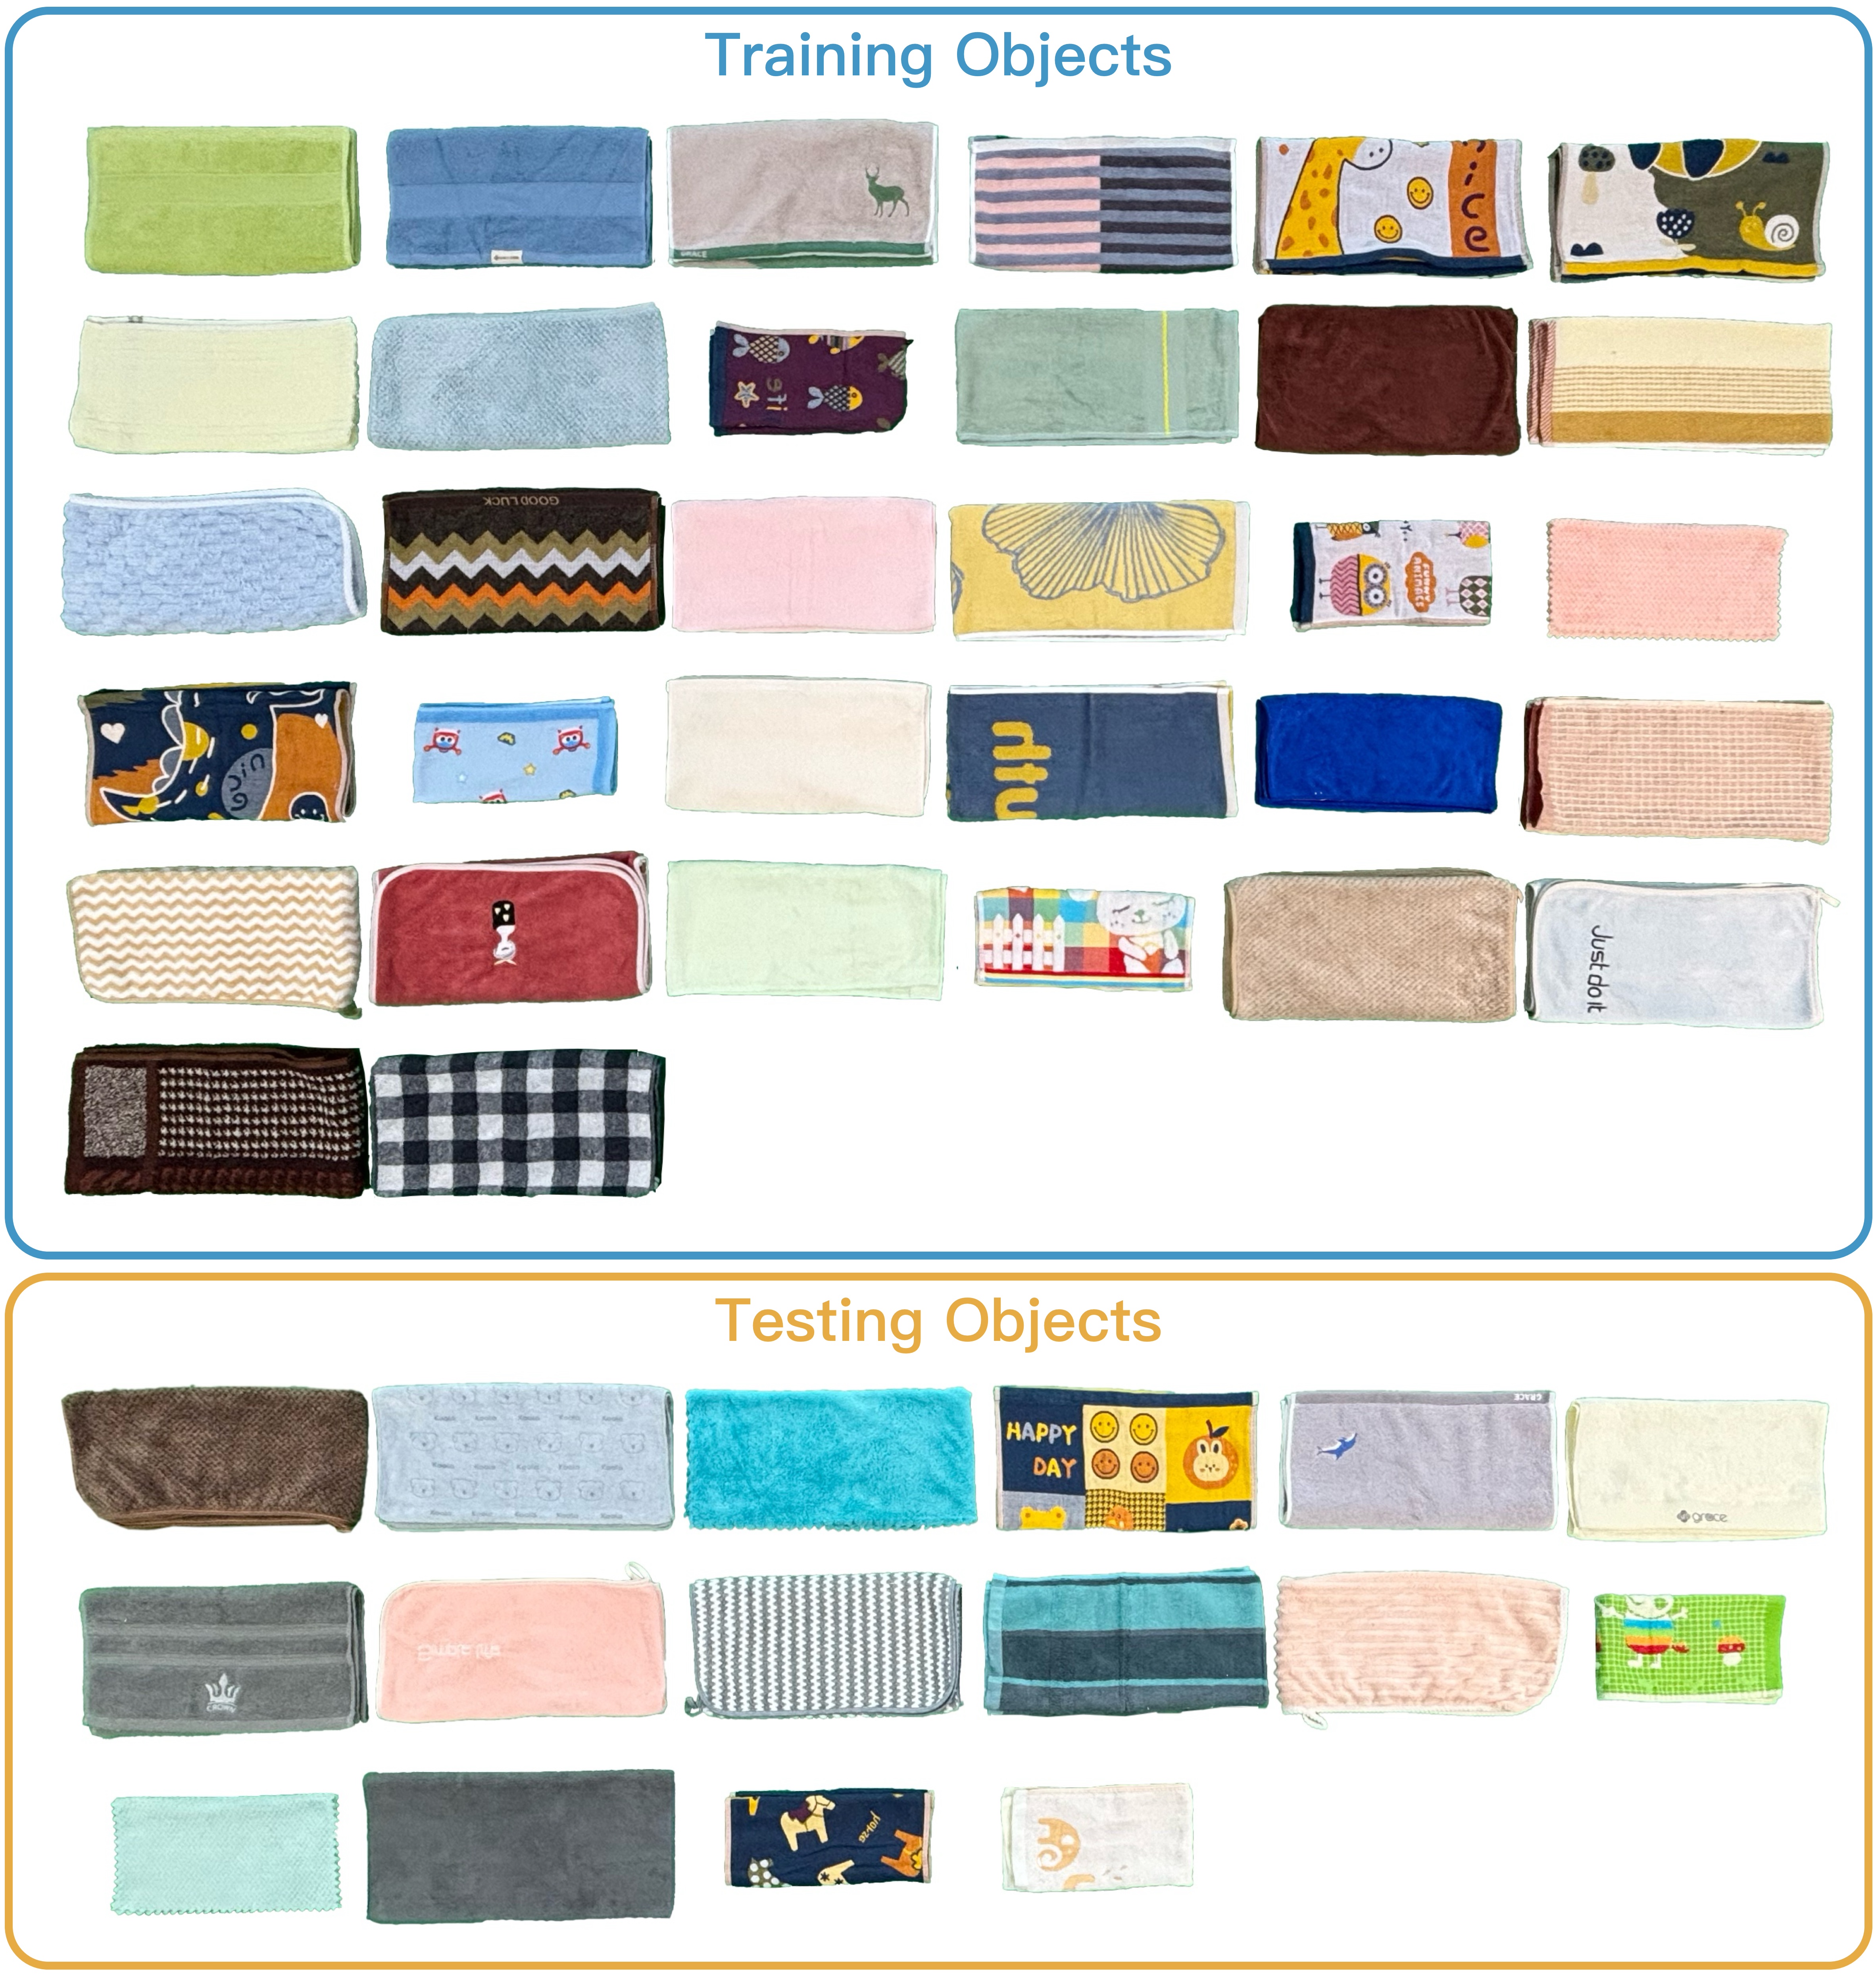
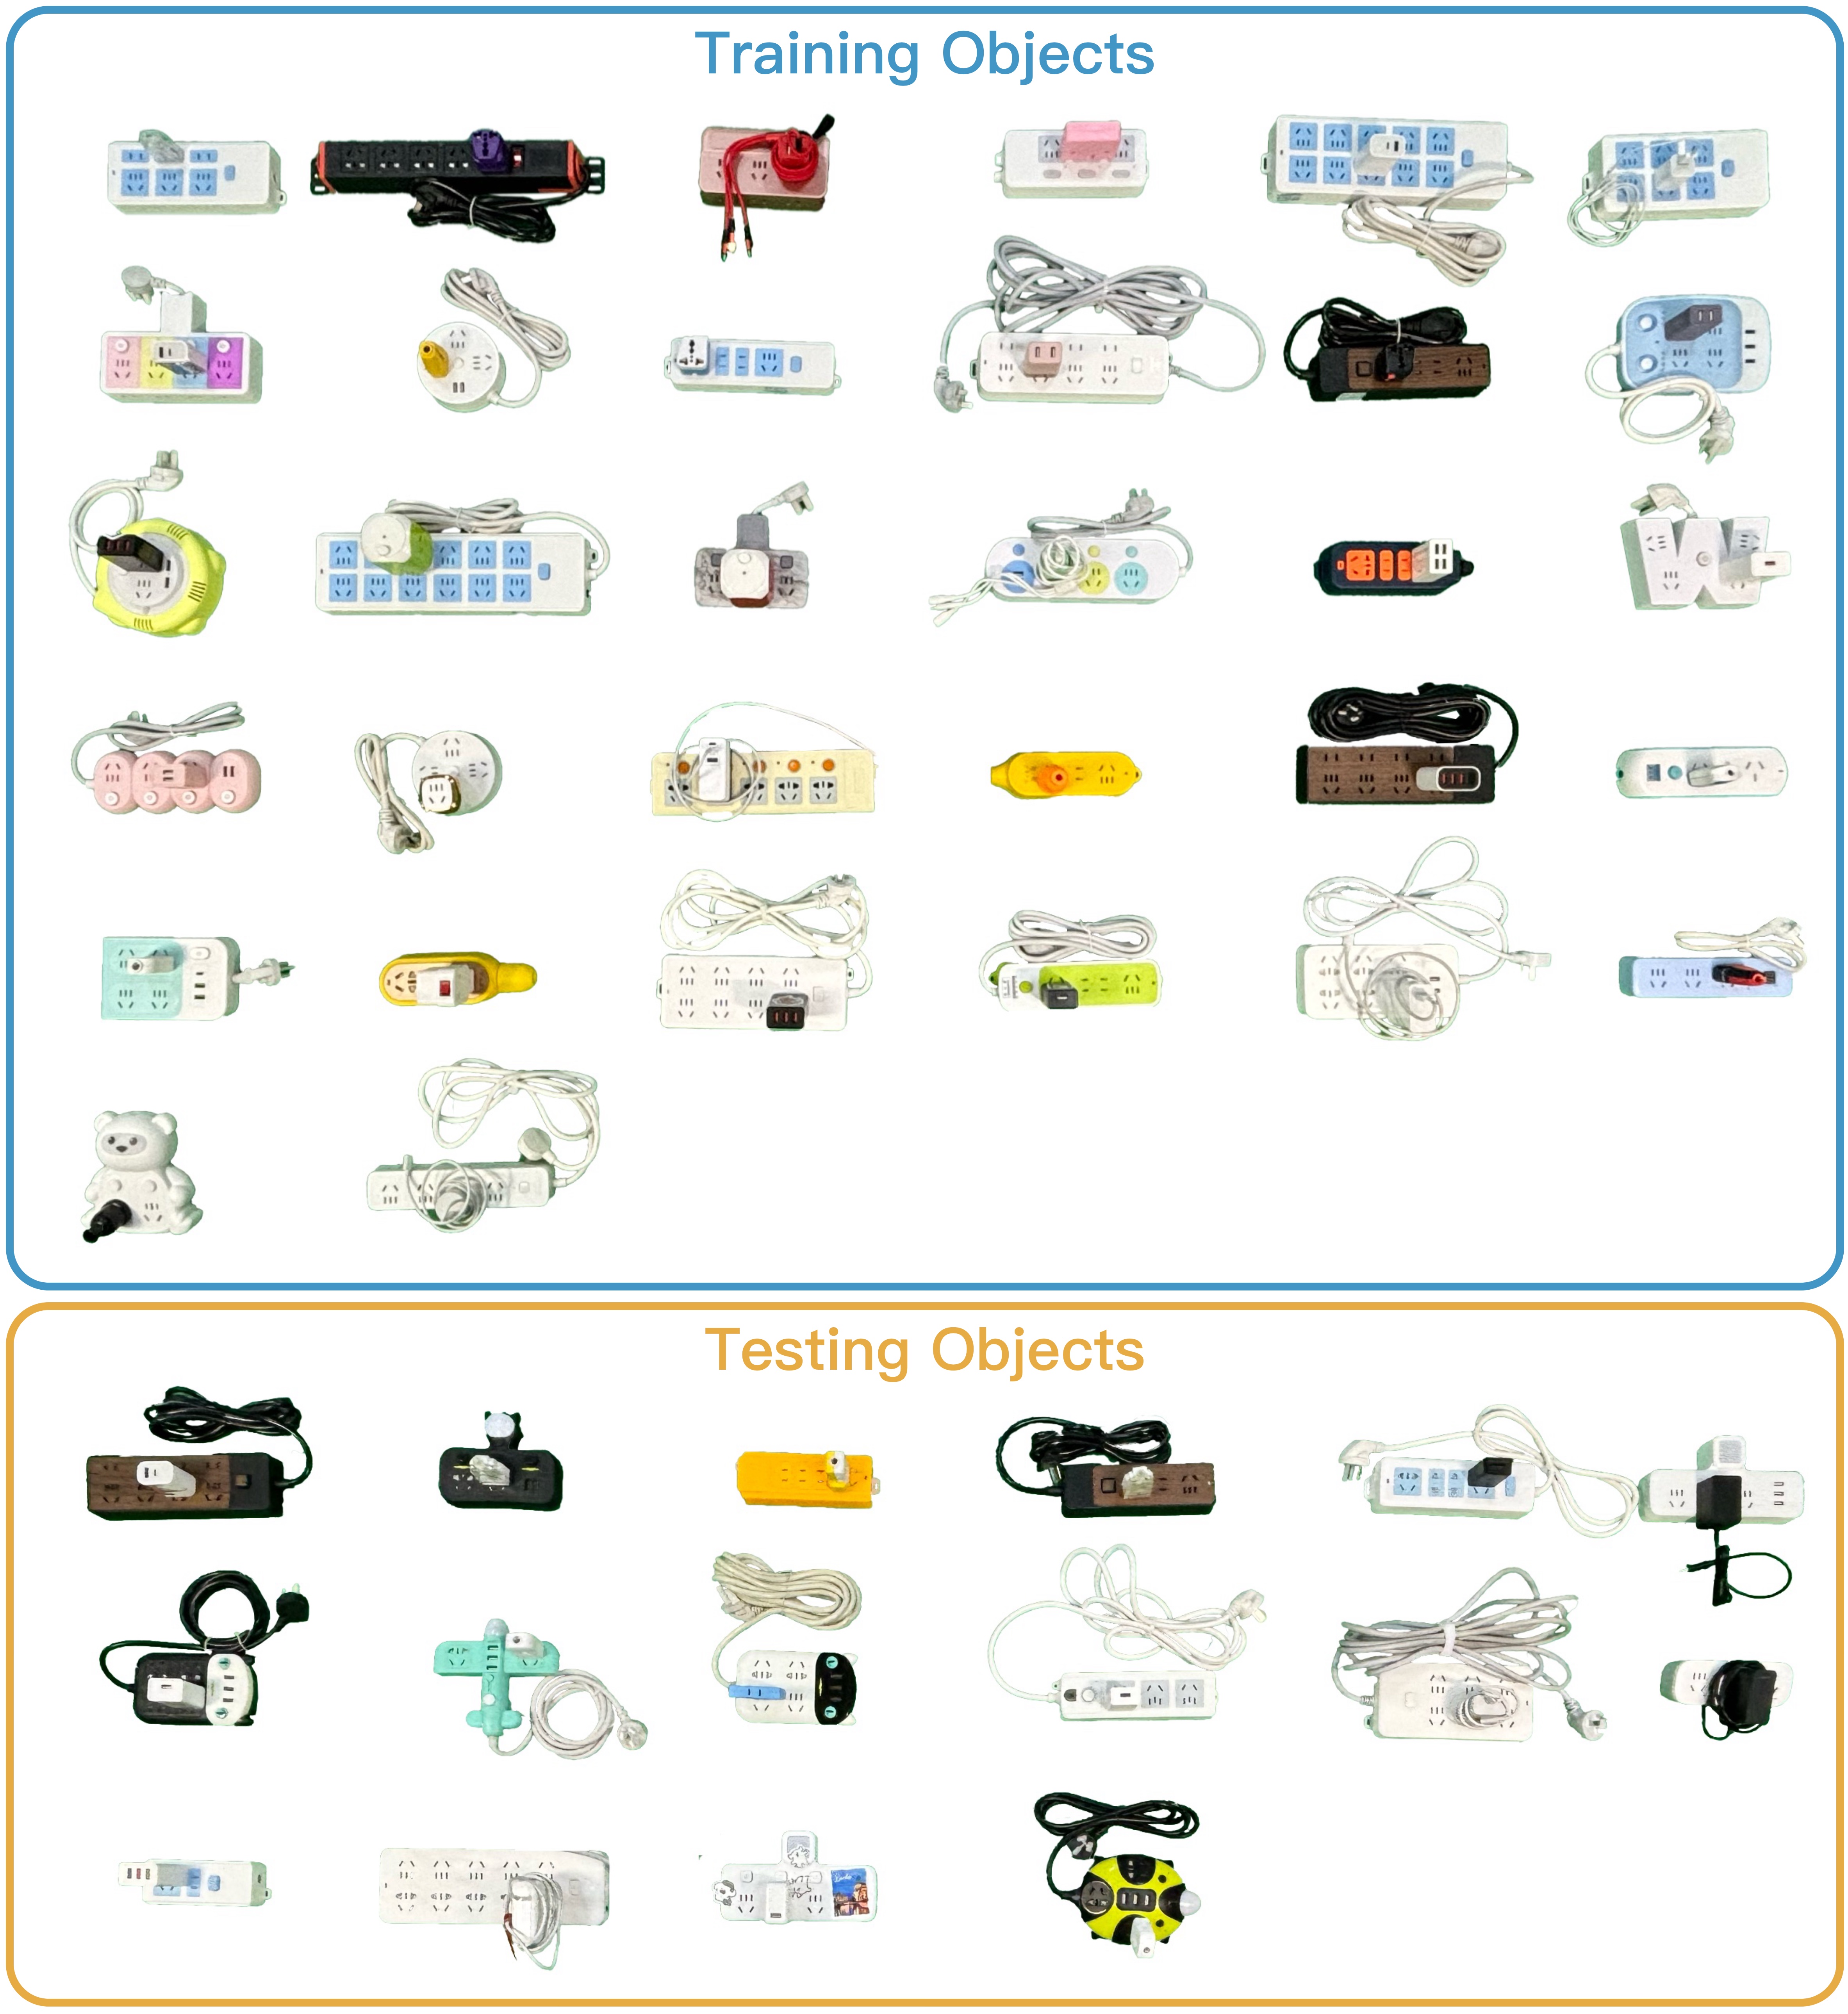
In Figures 13, 14, 15, and 16, we present the training and testing objects for the tasks Pour Water, Mouse Arrangement, Fold Towels, and Unplug Charger, respectively.
Note that when we refer to “one manipulation object” in a task, we are actually referring to all the objects involved in completing that task. For instance, in Pour Water, this includes both the drink bottle and the mug. In Mouse Arrangement, it refers to the mouse and the mouse pad. In Fold Towels, it applies solely to the towel. In Unplug Charger, it encompasses both the charger and the power strip.
Appendix B Data Source
B.1 Related Work
There are three main approaches to collecting human demonstrations for robotic manipulation.
Teleoperation. Common teleoperation systems utilize devices such as 3D spacemouse (Zhu et al., 2020; 2023b), VR controllers (Iyer et al., 2024; Zhang et al., 2018; Cheng et al., 2024), smartphones (Mandlekar et al., 2018; Wang et al., 2023), puppeting devices (Zhao et al., 2023; Fu et al., 2024; Wu et al., 2023), or exoskeletons (Fang et al., 2023c) to allow a human operator to control a robot. This approach requires a real robot during data collection, which is expensive and limits the ability to collect large-scale data.
Learning from human video. This method has the potential to leverage massive Internet-scale video data (Chen et al., 2021; Bahl et al., 2022; Qin et al., 2022; Ma et al., 2022; Hu et al., 2023b; Wen et al., 2023; Zhu et al., 2024). However, these videos lack explicit action information, and there is a significant embodiment gap between humans and robots, posing substantial challenges to algorithm design.
Hand-held grippers. The data collected by hand-held grippers does not suffer from the embodiment gap (Song et al., 2020b; Young et al., 2021; Pari et al., 2021; Shafiullah et al., 2023; Chi et al., 2024). These devices are highly portable and intuitive to use, enabling the proactive collecting of large amounts of data and allowing for more nuanced control over the composition of the data. In this paper, we use UMI (Chi et al., 2024) as the data collection device.
B.2 Experience of Using UMI to Collect Data
We share key insights gained from using UMI (Chi et al., 2024) to collect a large number of demonstrations:
(1) Random initial pose is crucial: For each demonstration, it’s essential to randomize the initial pose of the hand-held gripper, including its height and orientation. This practice helps cover a wider range of starting conditions. Without such variation, the trained policy becomes overly sensitive to specific initial poses, limiting its effectiveness to only certain positions. Similarly, the initial position range of objects should be as extensive as possible, while remaining within the robot’s kinematic and dynamic limits.
(2) Select an environment with rich visual features: Since UMI relies on SLAM for camera pose tracking, environments lacking sufficient visual features—such as dark areas or blank walls—can lead to tracking failures. To address this, we use the visualization tool Pangolin (Lovegrove, ) to verify that the environment has enough features. Introducing more distractor objects or adding textures to surfaces, such as tabletops, can both increase visual features and serve as a form of data augmentation, helping the policy learn to disregard irrelevant changes in the environment. Additionally, performing multiple mapping rounds and using batch SLAM processing can enhance the number of valid demonstrations.
(3) Use appropriately sized manipulation objects: Large objects that obstruct the camera’s view (e.g., doors or drawers) can cause the SLAM algorithm to misinterpret the camera as stationary, leading to tracking failure. This limitation influenced our decision to avoid tasks like opening drawers, highlighting a key drawback of the current UMI. Integrating off-the-shelf pose tracking hardware (e.g., iPhone Pro or VIVE Ultimate Tracker) could potentially improve UMI’s accuracy and robustness.
(4) Additional tips:
-
•
Standardize behavior patterns and task completion times among different data collectors to minimize multimodal behavior in the dataset.
-
•
When collecting data, avoid moving non-manipulation objects (distractors) and ensure that other moving entities do not enter the camera’s field of view.
-
•
Apply slight force when closing the gripper to introduce minor deformation.
Appendix C Policy Training
When constructing the training data, we ensure that larger datasets always contain the smaller ones. For instance, in the environment generalization experiment, if the data used to train two policies are selected from and environments (where ), the environments include all of the environments. This approach ensures a consistent data distribution across different dataset sizes, facilitating a fair comparison of policies.
To guarantee that policies trained on datasets of varying sizes can fully converge, we adjust the number of training epochs based on the total number of demonstrations. This allows policies trained on larger datasets to undergo more training steps. Specifically, the policy trained on the smallest dataset undergoes 800 epochs, totaling training steps. The policy trained on the largest dataset undergoes 75 epochs, totaling training steps, which takes 75 hours to complete on 8 A800 GPUs. We use the final checkpoint of each policy for evaluation. Given the large number of parameters in the model—the visual encoder and the noise prediction network together exceed 396 million—we use BFloat16 precision to accelerate training while maintaining numerical stability.
Our policy implementation largely follows those in Diffusion Policy (Chi et al., 2023) and UMI (Chi et al., 2024), with a minor modification: we increase the observation horizon for certain tasks. For example, in Pour Water, when the bottle is near the mouth of the mug, the policy initially struggles to distinguish whether it is about to start pouring or if pouring has already completed. To address this, we incorporate a more distant history step (0.25 seconds before) into the original 2-step observation horizon (which corresponds to a real-time duration of 0.05 seconds). For the Unplug Charger task, we incorporate a 0.5-second history step. This adjustment significantly improves the performance of Pour Water and Unplug Charger without adding much training or inference cost. For further details on the hyperparameters, refer to Table 3.
| Config | Value |
|---|---|
| Image observation horizon | 3 (Pour Water, Unplug Charger), 2 (other tasks) |
| Proprioception observation horizon | 3 (Pour Water, Unplug Charger), 2 (other tasks) |
| Action horizon | 16 |
| Observation resolution | 224224 |
| Environment frequency | 5 |
| Optimizer | AdamW |
| Optimizer momentum | |
| Learning rate for action diffusion model | 3e-4 |
| Learning rate for visual encoder | 3e-5 |
| Learning rate schedule | cosine decay |
| Batch size | 256 |
| Inference denoising iterations | 16 |
| Temporal ensemble steps | 8 |
| Temporal ensemble adaptation rate | -0.01 |
Appendix D Task Details
In this section, we provide a detailed introduction to four manipulation tasks and the scoring criteria during evaluation.
D.1 Pour Water
Task description. The robot performs three sequential actions: initially, it grasps a drink bottle; subsequently, it pours water into a mug; and finally, it places the bottle on a designated red coaster. The bottle is randomly placed on the table, provided it is within the robot’s kinematic reach. The relative initial position of the bottle and mug is also randomized, ensuring they are spaced variably while keeping the mug visible to the camera after the bottle is grasped. The red coaster, a 9 cm diameter circle, is consistently positioned approximately 10 cm to the right of the mug and is used across all environments. This task challenges the robot’s generalization capabilities due to the variability in the bottle’s color, size, and height, and requires precise alignment of the bottle mouth with the mug for successful completion. The task further requires significant rotational movements, extending beyond basic pick-and-place operations. The successful execution of the pouring and placing actions critically hinges on accurately grasping the bottle initially. For testing, the bottle cap is secured tightly, and no actual water is poured out.
Scoring criteria.
-
•
Step 1: Grasping the drink bottle
-
–
0 points: The gripper does not approach the drink bottle.
-
–
1 point: The gripper touches the drink bottle but does not grasp it due to minor errors, or it initially grasps the bottle, which then slips out during the lifting process.
-
–
2 points: The gripper pushes the drink bottle a significant distance before grasping it.
-
–
3 points: The gripper successfully grasps the drink bottle without any slippage.
-
–
-
•
Step 2: Pouring water into the mug
-
–
0 points: The gripper does not approach the mug.
-
–
1 point: After rotating the drink bottle, its mouth remains outside the mug, making pouring impossible.
-
–
2 points: After rotating the drink bottle, its mouth is positioned just above the rim of the mug, allowing only partial pouring.
-
–
3 points: After rotating the drink bottle, its mouth is completely inside the mug, facilitating complete pouring.
-
–
-
•
Step 3: Placing the bottle on the red coaster
-
–
0 points: The gripper does not approach the red coaster.
-
–
1 point: The drink bottle is placed outside the red coaster, or the placement process disrupts the mug, causing it to topple.
-
–
2 points: Only part of the drink bottle rests on the red coaster.
-
–
3 points: The drink bottle is fully and stably positioned on the red coaster.
-
–
Success criteria. A successful task requires scoring at least 2 points in Step 1, 3 points in Step 2, and at least 2 points in Step 3.
D.2 Mouse Arrangement
Task description. The robot is required to complete two steps: picking up a mouse and placing it on a mouse pad. In the first step, the mouse can be positioned anywhere on the table, as long as it remains within the robot’s kinematic reach. The mouse may be oriented straight ahead, in which case the robot needs to grasp it directly from behind. Alternatively, it might be slightly tilted to the left or right, necessitating the robot to employ non-prehensile actions, such as pushing the mouse into the correct orientation before closing the gripper for picking it up. The mouse’s low thickness significantly restricts the number of feasible grasping poses, leaving little margin for error, as even a slight positional deviation can cause a failed grasp. Additionally, the mouse’s varying geometry and color require the robot’s policy to have strong generalization abilities, allowing it to adapt its grasping strategy based on the specific shape and size of the mouse.
Scoring criteria.
-
•
Step 1: Picking up the mouse
-
–
0 points: The gripper does not move toward the mouse or moves around it without making contact.
-
–
1 point: The gripper approaches the correct grasping pose and touches the mouse but drops it after lifting it slightly.
-
–
2 points: The gripper pushes the mouse a significant distance before grasping it, or the mouse is grasped but falls when lifted to a higher height.
-
–
3 points: The gripper successfully grasps the mouse without any slippage.
-
–
-
•
Step 2: Placing the mouse on the mouse pad
-
–
0 points: The gripper either remains stationary in the air, failing to move toward the mouse pad, or releases the mouse from a high position, causing it to fall onto the table.
-
–
1 point: The mouse is placed outside the mouse pad, or even if the entire mouse lands on the pad, it flips due to being released from a high height.
-
–
2 points: Only part of the mouse is placed on the mouse pad, or even if the entire mouse is on the pad, it bounces and shifts slightly due to being released from a relatively high height.
-
–
3 points: The gripper lowers to an appropriate height before releasing the mouse, ensuring the entire mouse is securely placed on the pad.
-
–
Success criteria. A successful task requires scoring 3 points in Step 1 and at least 2 points in Step 2.
D.3 Fold Towels
Task description. The robot is required to complete two steps: first, grasping the left edge of the towel, and second, folding the towel to the right. The initial position of the towel may vary on the table, provided it remains within the robot’s kinematic reach and its tilt angle relative to the table’s edge does not exceed 15 degrees. We assume the towel has already been folded several times. Manipulating deformable objects like towels presents significant challenges due to their high degrees of freedom and complex dynamics. The robot must account for the towel’s softness and flexibility when selecting appropriate grasping points. Minor errors in manipulation can lead to unexpected outcomes, such as slipping or ineffective grasps. Additionally, the variety of towel styles—including differences in color, material, and texture—poses challenges for policy generalization.
Scoring criteria.
-
•
Step 1: Grasp the left edge of the towel
-
–
0 points: The gripper does not move toward the towel or moves around it without making contact.
-
–
1 point: The gripper moves toward the towel and attempts a grasping motion but fails to grasp any towel layer.
-
–
2 points: The gripper grasps only some of the towel layers, leaving others ungrasped (since the towel has been folded multiple times, it consists of several layers).
-
–
3 points: The gripper successfully grasps all layers of the towel.
-
–
-
•
Step 2: Fold the towel to the right
-
–
0 points: No folding motion toward the right is demonstrated.
-
–
1 point: After folding, the overlapping area is less than one-third of the maximum possible overlap.
-
–
2 points: After folding, the overlapping area is between one-third and two-thirds of the maximum possible overlap.
-
–
3 points: After folding, the overlapping area exceeds two-thirds of the maximum possible overlap.
-
–
Success criteria. A successful task requires scoring 3 points in Step 1 and at least 2 points in Step 2.
D.4 Unplug Charger
Task description. The robot is required to complete two steps: First, it grabs the charger that is plugged into the power strip; second, it pulls out the charger and places it on the right side of the power strip. The charger and power strip can be placed anywhere on the table as long as they remain within the robot’s kinematic reach. The challenge lies in the robot’s ability to accurately grasp the charger, apply sufficient force, and swiftly pull it out. Charger plugs come in different shapes and sizes, so the robot must adapt its grip to securely hold the plug.
Scoring criteria.
-
•
Step 1: Grabbing the charger
-
–
0 points: The gripper does not grab the charger.
-
–
1 point: The gripper grabs the charger but not tightly enough, resulting in failure to pull out the charger.
-
–
2 points: The gripper securely holds the charger, but during the process, there is a collision with the power strip, though the charger is eventually pulled out.
-
–
3 points: The gripper securely holds the charger without colliding with other objects, and the charger is successfully pulled out afterward.
-
–
-
•
Step 2: Pulling out the charger
-
–
0 points: The charger is not pulled out.
-
–
2 points: After pulling out the charger, it slips from the gripper.
-
–
3 points: The charger is successfully pulled out, and the gripper places it to the right side of the power strip.
-
–
Success criteria. A successful task requires scoring at least 2 points in Step 1 and 3 points in Step 2.
Appendix E Evaluation
E.1 Comparison of Evaluation Metrics
We use tester-assigned scores as our primary evaluation metric, acknowledging that this approach inherently introduces some subjectivity from the testers. An alternative metric, the mean squared error (MSE) on the validation set, offers a potential objective measure that does not require human intervention. In this section, we provide a detailed comparison of these two metrics. To calculate MSE, we collect 30 human demonstrations for each evaluation environment or object, forming the validation set. We then compute the MSE by averaging the squared differences between the policy-predicted actions and the human actions at each timestep.
We observe a strong inverse correlation between MSE and normalized scores in certain cases. For example, in the right plot of Figure 17, the experimental setup evaluates the policy’s generalization across both environments and objects on Pour Water. As the number of training environment-object pairs increases, the normalized score gradually rises while the MSE steadily decreases, with Pearson’s and Spearman’s . This suggests that MSE could potentially replace the human scoring method. However, in certain scenarios, MSE does not correlate well with real-world performance. For example, in the left plot of Figure 17, the experiment evaluates the policy’s generalization across objects on Pour Water. When the number of training objects increases to 16, the MSE actually increases, resulting in a Pearson’s of only . Similarly, in experiments exploring model training strategies (Section 6), the MSE for LoRA is significantly lower than for full fine-tuning (0.0049 vs. 0.006). Nevertheless, in real-world tests, LoRA’s policy performs worse than full fine-tuning, with normalized scores of 0.72 and 0.9, respectively.
Overall, the MSE on the validation set often does not correlate with real-world performance, and many anomalies appear unpredictably and without discernible patterns. This leads us to believe that MSE is not a completely reliable evaluation metric. In practice, we use MSE more as a debugging tool to quickly identify policies with obvious problems.
E.2 Evaluation Workflow
We use the environment generalization experiment as a case study to demonstrate our evaluation workflow. Recall that in this experiment, we collect data with the same object across 32 environments, training a total of 21 policies. Each policy is evaluated in 8 unseen environments using the same object, with 5 trials per environment. The average normalized score from these 40 trials is reported for each policy. Operationally, we complete the training of all 21 policies before deploying the entire robotic system (refer to Appendix F) into a new environment for evaluation. To ensure unbiased results, we conduct blind tests: initially, we set an initial position for the object and randomly shuffle the order of the 21 policies. Testing then proceeds at this initial position, with the 21 shuffled policies scored according to the criteria outlined in Appendix D. Subsequently, we select a new initial position for the object and repeat the scoring process for the 21 shuffled policies. This procedure is replicated five times to conclude the testing in one environment. The robot system is then transitioned to another new environment, and the entire process is repeated, completing eight cycles in total for all tests.
Such an evaluation workflow ensures that policies evaluated within the same batch can be directly compared—since they are exposed to the same conditions—but comparisons across different batches are not valid. This restriction arises because the environments and the initial object positions can vary between batches. For instance, despite the data in Fig. 4 and Fig. 6 being evaluated under the same conditions—across eight unseen environments and using two unseen objects per environment, each with five trials—they cannot be directly compared since they originate from separate batches.
Appendix F Hardware Setup
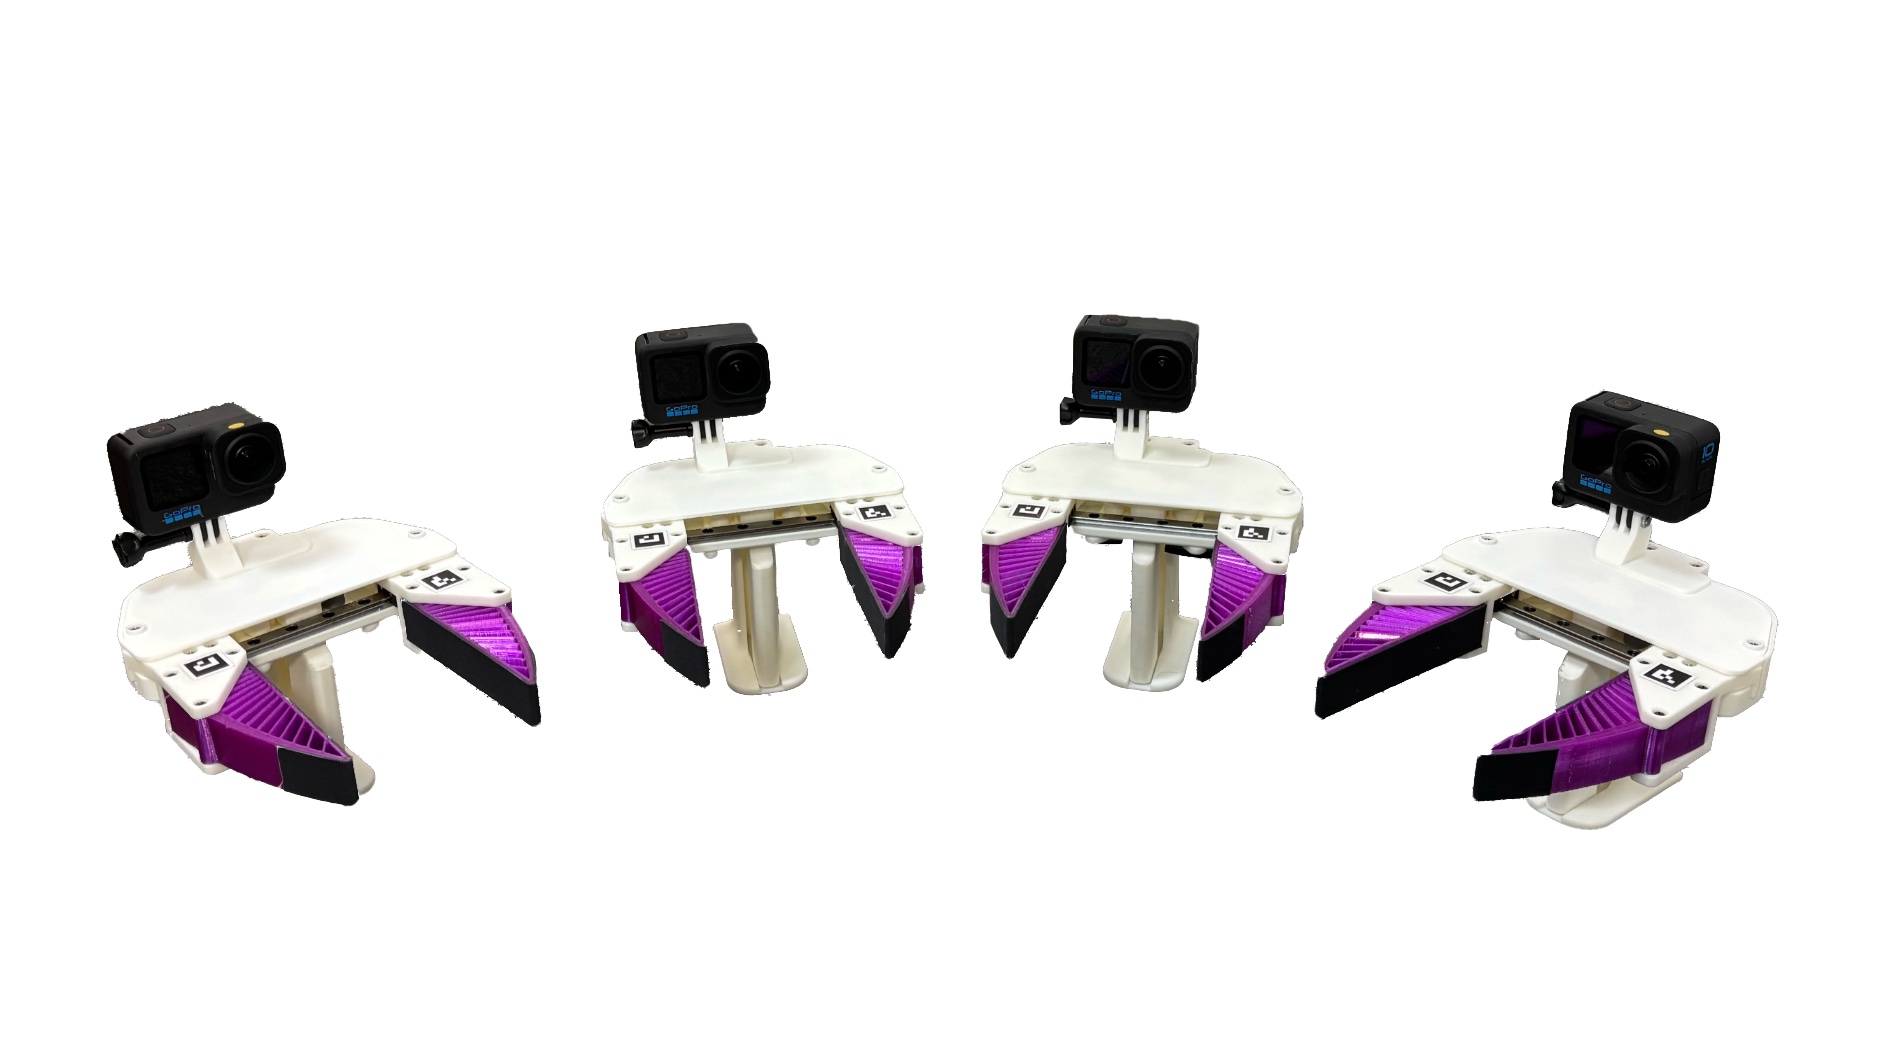
The comprehensive hardware building guide for the hand-held gripper can be found at: https://umi-gripper.github.io/. Figure 19 displays the four hand-held grippers used in our study. Next, we introduce our deployment hardware setup, shown in Figure 19. We use a Franka Emika Panda robot (a 7-DoF arm) equipped with a Weiss WSG-50 gripper (a 1-DoF parallel jaw gripper). To address the robot’s limited end-effector pitch, we utilize a mounting adapter designed by Chi et al. (2024) to rotate the WSG-50 gripper by 90 degrees relative to the robot’s end-effector flange. The gripper is equipped with soft, compliant fingers printed using purple 95A TPU material. For perception, we use a wrist-mounted GoPro Hero 10 camera with a fisheye lens. Real-time video streaming from the GoPro is achieved through a combination of the GoPro Media Mod and the Elgato HD60 X external capture card. Policy inference is performed on a workstation equipped with an NVIDIA 4090 GPU (24 GB VRAM). All components are powered by a mobile power supply (EcoFlow DELTA 2 Max) with a 2048 Wh capacity, which also serves as a 23 kg counterweight to prevent tipping. The system is mounted on a custom movable lifting table. While the table cannot move autonomously, its mobility allows for testing our policies in non-laboratory settings.
Appendix G Additional Experimental Results
G.1 Data Scaling Laws on MSE
In the main text, we present power-law data scaling laws based on tester-assigned scores (Section 4.2). In this section, inspired by the scaling laws on cross-entropy loss observed in large language models (Kaplan et al., 2020), we explore whether our power-law relationships also hold for action mean squared error (MSE). To calculate the MSE, we collect 30 human demonstrations for each evaluation environment or object, forming a validation set. We then compute the MSE by averaging the squared differences between the predicted actions and the human actions at each timestep.
Similar to Fig. 5, we fit a linear model to the log-transformed data and present the results in Fig. 20. As shown in Fig. 20, in most cases the absolute value of the correlation coefficient is relatively large, indicating that power-law data scaling laws generally hold for MSE as well. However, compared to Fig. 5, we observe that all absolute values of in Fig. 20 are smaller, suggesting a weaker scaling trend for MSE. Notably, in certain cases—such as the second column of Fig. 20 (in Pour Water)—the absolute value of is unusually low (only 0.558), primarily due to outliers in the MSE. Such abnormal MSE values are not uncommon, as we discuss in detail in Appendix E.1.
While MSE can serve as a reasonable proxy metric when time-consuming human evaluations are not feasible, it cannot fully capture the true performance of a closed-loop visuomotor policy in the real world. We believe that tester-assigned scores better reflect the policy’s actual performance. Therefore, we choose them as the primary evaluation metric and present the data scaling laws based on this metric in the main text.
G.2 Keeping the Total Number of Demonstrations Constant
In the main text, we observe that as the number of training objects, environments, or environment-object pairs increases, the policy’s generalization ability improves. However, this increase is accompanied by a rise in the total number of demonstrations. In Figures 21, 22, and 23, we redraw the plots to maintain a relatively constant total number of demonstrations while varying the number of objects, environments, or environment-object pairs. This adjustment does not require rerunning the experiments; instead, we connect points from the original plots that correspond to a similar number of demonstrations. Although the points along the same line do not represent exactly the same number of demonstrations, they are approximately equivalent. For instance, “2” denotes around 200 demonstrations. We exclude the “1” line (approximately 100 demonstrations) because the results become unstable and unreliable at that level when dealing with larger numbers of environments or objects. From these plots, we see that even when controlling for the total number of demonstrations, increasing the number of environments or objects still enhances the policy’s generalization performance, as seen most clearly in Figure 23. Additionally, the total number of demonstrations required for the policy’s performance to saturate appears moderate. Once the total reaches around 16 (approximately 1600 demonstrations), further increases offer minimal performance improvements.
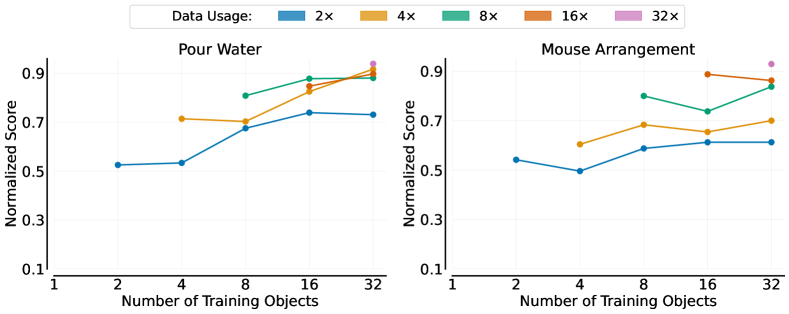
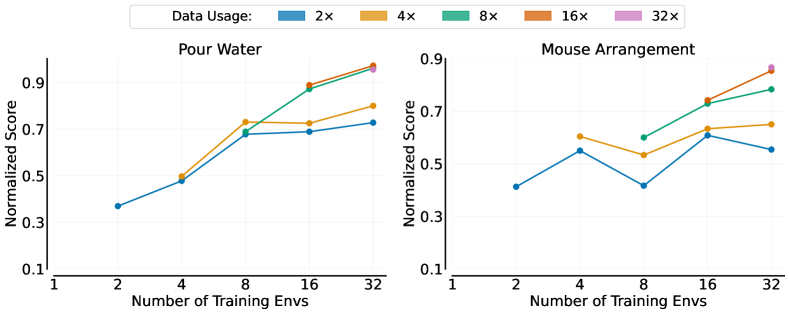
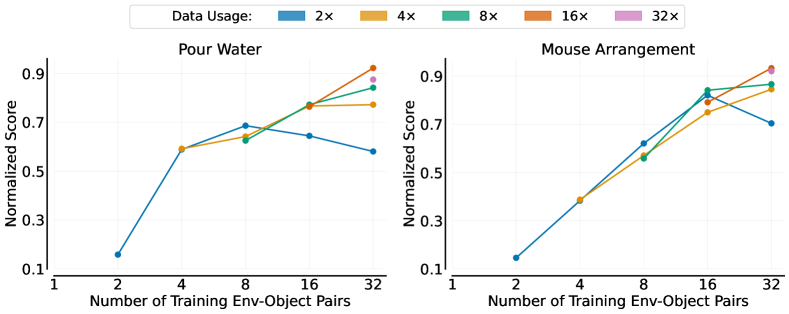
G.3 Raw Test Scores
In this section, we present the raw test scores before normalization. The scores for Pour Water are shown in Table 4, Table 5, Table 6, and Table 7. The scores for Mouse Arrangement are shown in Table 8, Table 9, Table 10, and Table 11.
| 3.125% | 6.25% | 12.5% | 25% | 50% | 100% | |
|---|---|---|---|---|---|---|
| 1 | 1.2 | |||||
| 2 | 3.175 | 4.725 | ||||
| 4 | 4.55 | 4.8 | 6.425 | |||
| 8 | 4.575 | 6.075 | 6.325 | 7.275 | ||
| 16 | 3.6 | 6.65 | 7.425 | 7.9 | 7.625 | |
| 32 | 2.45 | 6.575 | 8.25 | 7.925 | 8.075 | 8.45 |
| 3.125% | 6.25% | 12.5% | 25% | 50% | 100% | |
|---|---|---|---|---|---|---|
| 1 | 1.3 | |||||
| 2 | 2.85 | 3.325 | ||||
| 4 | 2.55 | 4.3 | 4.475 | |||
| 8 | 3.925 | 6.1 | 6.575 | 6.2 | ||
| 16 | 4.15 | 6.2 | 6.525 | 7.85 | 8 | |
| 32 | 3.475 | 6.55 | 7.2 | 8.65 | 8.75 | 8.6 |
| 3.125% | 6.25% | 12.5% | 25% | 50% | 100% | |
|---|---|---|---|---|---|---|
| 1 | 0.45 | |||||
| 2 | 1.65 | 1.425 | ||||
| 4 | 2.725 | 5.3 | 5.325 | |||
| 8 | 4.95 | 6.175 | 5.775 | 5.625 | ||
| 16 | 4.8 | 5.8 | 6.9 | 6.95 | 6.875 | |
| 32 | 3.95 | 5.225 | 6.95 | 7.575 | 8.3 | 7.875 |
| #Demos | 64 | 100 | 200 | 400 | 800 | 1600 | 3200 | 6400 |
|---|---|---|---|---|---|---|---|---|
| Score | 4.35 | 6.15 | 6.875 | 7.025 | 6.975 | 7.2 | 7.125 | 6.525 |
| 3.125% | 6.25% | 12.5% | 25% | 50% | 100% | |
|---|---|---|---|---|---|---|
| 1 | 1.3 | |||||
| 2 | 2.475 | 3.25 | ||||
| 4 | 2.425 | 2.975 | 3.625 | |||
| 8 | 1.75 | 3.525 | 4.1 | 4.8 | ||
| 16 | 2.525 | 3.675 | 3.925 | 4.425 | 5.325 | |
| 32 | 3.7 | 3.675 | 4.2 | 5.025 | 5.175 | 5.575 |
| 3.125% | 6.25% | 12.5% | 25% | 50% | 100% | |
|---|---|---|---|---|---|---|
| 1 | 1.3 | |||||
| 2 | 1.975 | 2.475 | ||||
| 4 | 1.8 | 3.3 | 3.625 | |||
| 8 | 2.075 | 2.5 | 3.2 | 3.6 | ||
| 16 | 1.525 | 3.65 | 3.8 | 4.375 | 4.45 | |
| 32 | 2.725 | 3.325 | 3.9 | 4.7 | 5.125 | 5.2 |
| 3.125% | 6.25% | 12.5% | 25% | 50% | 100% | |
|---|---|---|---|---|---|---|
| 1 | 0.75 | |||||
| 2 | 0.975 | 0.875 | ||||
| 4 | 1.8 | 2.3 | 2.325 | |||
| 8 | 2.425 | 3.725 | 3.425 | 3.35 | ||
| 16 | 3.375 | 4.925 | 4.5 | 5.05 | 4.75 | |
| 32 | 4.225 | 4.225 | 5.075 | 5.2 | 5.6 | 5.525 |
| #Demos | 64 | 100 | 200 | 400 | 800 | 1600 | 3200 | 6400 |
|---|---|---|---|---|---|---|---|---|
| Score | 1.725 | 3.025 | 3.3 | 3.775 | 3.975 | 3.8 | 3.875 | 3.8 |
G.4 Success Rate
Table 12 presents the success rates of the policy trained across 32 environment-object pairs for each task. The detailed criteria for task success are provided in Appendix D.
| Environment ID | |||||||||
|---|---|---|---|---|---|---|---|---|---|
| Task | 1 | 2 | 3 | 4 | 5 | 6 | 7 | 8 | Mean |
| Pour Water | 80% | 40% | 100% | 80% | 100% | 100% | 80% | 100% | 85% |
| Mouse Arrangement | 100% | 80% | 100% | 100% | 80% | 80% | 100% | 100% | 92.5% |
| Fold Towels | 100% | 100% | 60% | 100% | 100% | 60% | 100% | 80% | 87.5% |
| Unplug Charger | 80% | 60% | 100% | 100% | 100% | 80% | 100% | 100% | 90% |