2024
Yilong \fnmHan
\artauthors
Mechanical properties of crystalline–amorphous composites: generalisation of Hall–Petch and inverse Hall–Petch behaviours
Abstract
The strength, , of a polycrystal decreases with mean grain diameter at atoms (i.e. Hall–Petch behaviour) and increases at (i.e. inverse Hall–Petch behaviour). Our simulations generalise to , where is the mean thickness of grain boundaries. For various particle compositions, the maximum strength is reached at particles for single-component face-centred-cubic solids and at for bidispersed or body-centred-cubic solids because of the different activation stresses of dislocation motions. The results explain recent alloy experiments and provide a way to exceed the maximum strength of polycrystals. Ductility and elastic moduli are also measured in the broad space. The regimes without a strength–ductility trade-off, the maximum ductility and ductile–brittle transitions are identified. These results obtained in space are important in solid mechanics and can guide the fabrication of crystalline–amorphous composites with outstanding mechanical properties.
keywords:
Hall–Petch and inverse Hall–Petch behaviours, crystalline–amorphous composite, ductile–brittle transition, elastic moduli, solid mechanicsIntroduction
Polycrystalline materials, such as ceramics, metals and alloys, are ubiquitous in nature and industries. Their strength or yield stress, , increases as mean grain diameter decreases, i.e., the famous Hall–Petch (HP) behaviour discovered in the 1950s hall1951deformation ; petch1953cleavage . This trend reverses at atoms, i.e., inverse Hall-Petch (IHP) behaviour chokshi1989validity ; trelewicz2007hall . HP and IHP behaviours generally hold in all atomic and molecular polycrystals and have been intensively studied pande2009nanomechanics ; armstrong201460 ; cordero2016six ; naik2020hall . Aside from tuning , a polycrystal’s strength can also be enhanced by increasing pressure zhou2020high and decreasing temperature naik2020hall or the initial dislocation density naik2020hall . However, previous studies have focused on solid strengthening instead of generalising HP and IHP behaviours by tuning structural parameters in a broad range. An important simulation study obtained a non-monotonic by adding twin boundaries li2010dislocation ; such is essentially covered by the HP and IHP behaviours because twin boundaries can be viewed as a special type of grain boundaries (GBs). Here we generalise the HP and IHP behaviours of for polycrystals with mean GB thickness particles to by tuning structural parameters and .
Thick-GB polycrystals are difficult to fabricate. Thus, the effect of on material properties remains unclear and poorly explored. In recent years, thick-GB polycrystals have been fabricated in glass-ceramics holand2019glass and alloys which are often called crystalline–amorphous composites li2019amorphous , dual-phase crystal–glass materials gu2024phase , or GB complexions cantwell2014grain . Such materials exhibit ultrahigh strength holand2019glass ; wu2017dual ; ding2019thick , superplasticity su2021high , ultralong fatigue life hua2021nanocomposite , hydrogen storage ability li2019amorphous and wear resistance holand2019glass ; li2019amorphous . They are often fabricated by complex trial-and-error processes, so the size of crystalline and amorphous regions is difficult to control gu2024phase when studying the effect of on mechanical properties. Simulations of the effects of thick-GB on material properties are limited to Cu-based alloys within a narrow range of xiao2021mitigating ; brink2018metallic . A recent simulation measured the strength of 2D polycrystals with thick GBs; such solids only exhibited IHP behaviour, and the maximum strength at HP–IHP transition was not determined xu2023generalization . Here, we systematically measure the strength of 3D solids so that both the HP and IHP behaviours can be generalised to the parameter space. We find that face-centred-cubic (fcc) and body-centred-cubic (bcc) lattices exhibit different behaviours because of their different activation stresses of dislocation motions. Aside from , the fracture behaviours and elastic moduli in broad space are also studied, which has not been done before.
Generalisation of HP and IHP behaviours
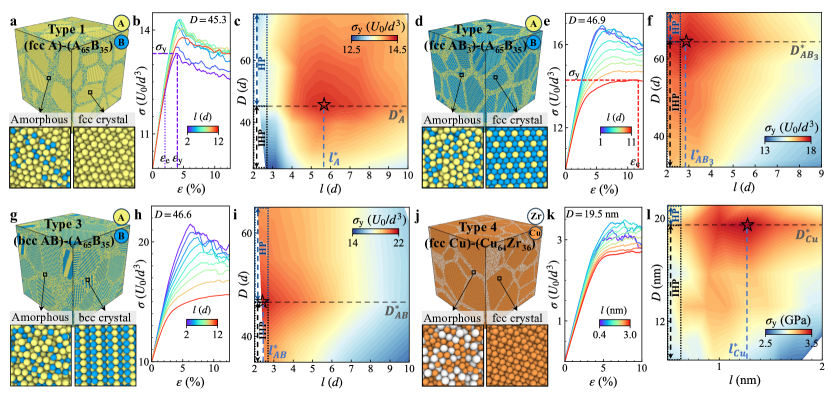
We systematically vary and in four types of systems (Fig. 1a,d,g,j) and measure their by molecular dynamics simulations. Types 1–3 systems are composed of binary-sized particles, with the Lennard–Jones (LJ) pair potential shifted to zero at . for large (A-type) particles; for small (B-type) particles; and following the Kob–Anderson binary LJ mixture model kob1995testing . In amorphous GBs, the number ratio between A and B particles is set as 65:35 because large A and small B particles can mix well without phase separation bruning2008glass . In crystalline grains, they are set as 100:0, 25:75 and 50:50 for Types 1–3 systems, respectively. Type 4 systems comprise pure Cu in crystalline grains and a 64:36 mixture of Cu and Zr atoms in GBs. All the number ratios above commonly exist in real alloys porter2009phase . The Cu-Zr mixture is a prototype of metallic glass schuh2007mechanical . The atomic interactions are described by embedded-atom-method potentials mendelev2019development . Crystalline regions are fcc for Types 1, 2 and 4 systems (Fig. 1a,d,j) and bcc for Type 3 systems (Fig. 1g). Uniaxial compression with a total strain of and is applied on LJ systems and Cu-Zr systems, respectively, all of which exceed their yielding points. Additional simulation details are given in Supplementary Information Section 1.
The stress–strain curves around the HP–IHP crossover are shown in Fig. 1b,e,h,k. Each curve is averaged over three samples compressed along , and directions for sufficient statistics. Both the maximum stress (i.e. yield stress ) and flow stress given by the plateau height of have been commonly used as the material strength, and they exhibit similar HP/IHP behaviours naik2020hall . However, some samples exhibit strain softening without a plateau in . Thus, we show HP/IHP behaviours in terms of in the main text and in terms of the ambiguous in Supplementary Information Fig. S5.
The contour maps of in Fig. 1c,f,i,l can be viewed as the generalisation of the HP and IHP behaviours of . Conventional HP and IHP behaviours of are well reproduced in thin-GB polycrystals (). The presence of triple junctions increases to about 2 for polycrystals. The maximum of is observed at particles in Fig. 1c,f,i,l which agrees well with the conventional HP–IHP crossover regimes of atomic polycrystals naik2020hall . remains at about 50 particles on the generalised HP–IHP boundary under different values (horizontal dashed lines in Fig. 1c,f,i,l). Similar to , is also non-monotonic for Types 1 and 4 systems. The maximum is at for Type 1 systems ( in Fig. 1c) and at Cu atoms for type 4 systems ( in Fig. 1l), indicating that slightly depends on particle interaction.
The deformations of polycrystals in conventional HP and IHP regimes occur via dislocation motions in crystalline grains and via deformations in GBs, respectively pande2009nanomechanics . Small grains produce few dislocation pile-ups on GBs, thus requiring high applied stress to initiate plastic flow in crystalline grains; meanwhile, the presence of many GBs results in low required stress for GB deformation armstrong201460 ; naik2020hall . The competition between the required stresses for the two deformation mechanisms leads to non-monotonic pande2009nanomechanics .
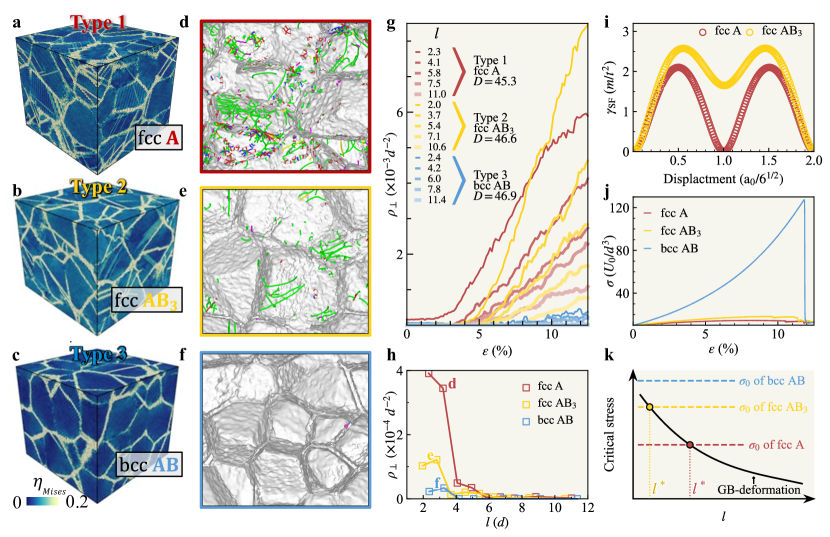
The above conventional mechanisms of the HP and IHP behaviours of for polycrystals with can similarly explain in Fig. 1c,f,i,l. In the regime, thick GBs reduce the generation and motion of dislocations ding2019thick , leading to few dislocation pile-ups on GBs (Fig. 2, Supplementary Videos 1,2). Meanwhile, thick GBs act as a strong sink for absorbing dislocations wang2007ductile . Both effects cause a low stress concentration on thick GBs, so high applied stress is required for plastic deformation. Such dislocation-motion-controlled deformation decreases (i.e. strength increases) as increases (Supplementary Information Fig. S11). In the regime, GB deformations dominate plastic deformation (Fig. 2, Supplementary Videos 1,2), which agrees with previous simulations of crystalline–amorphous composites xiao2021mitigating ; xu2023generalization . This increase in GB deformation (i.e. decrease in strength) as increases is consistent with the behaviours of glass nanopillars jang2010transition ; schuh2007mechanical2 . The competition between dislocation-motion-controlled and GB-deformation-controlled strengths causes a peak in , as sketched in Supplementary Information Fig. S11.
In contrast to the non-monotonic at a fixed in Fig. 1c,l for Types 1 and 4 systems, in Fig. 1f,i decreases almost monotonically with the maxima at for Type 2 systems and at for Type 3 systems. This difference amongst systems indicates that depends on crystal composition and lattice symmetry. We attribute the narrow regime of to the higher friction stress of moving dislocations in binary-composition fcc (Type 2) and bcc (Type 3) systems than in monodispersed-fcc (Types 1 and 4) systems. This mechanism is shown in Fig. 2a-j and summarized in Fig. 2k. As sketched in Fig. 2k, the minimum stress to deform GB monotonically decreases with zhou2020high , whereas the minimum stress required to move a dislocation should be independent of zhu2012deformation . When the applied stress exceeds one of the two minimum required stresses above, one type of plastic deformation occurs and largely pre-empts the other type of deformation. Thus, the intersection of the two stresses in Fig. 2k gives . Given that dislocations require high stress to move in bcc or binary crystalline grains (), their in Fig. 1f,i is smaller than that of monodispersed fcc grains (Fig. 1e,l).
First, we compare Types 1 and 2 fcc systems. Local deformation can be described by von Mises shear strain defined in Supplementary Information Eq. S1. Particles with are set as plastic deformation regions zepeda2017probing , which exist in grains by dislocation motions and in GBs by shear-transformation zones (Fig. 2a,b, Supplementary Video 1) at a small . The dislocation lines in Fig. 2d,e and dislocation density in Fig. 2g show that numerous dislocations are generated in the Type 1 system during yielding. decreases with in Fig. 2g, indicating that thick GBs suppress the formation of dislocations. For Types 1–3 systems, before reaching is nearly zero (Fig. 2h) for samples with in Fig. 1c,f,i, indicating that the plastic deformation is solely from GBs. Moreover, we observe that the dislocations in fcc systems are mainly 1/6 (Shockley) partial dislocations (Fig. 2d,e) which require lower stress to move compared with other types of dislocations hull2011introduction . They are often emitted from crystal–amorphous interfaces and propagate into crystalline regions (Supplementary Video 1). For fcc crystals, the minimum shear stress for creating partial dislocation, , linearly increases with stacking fault energy zhu2012deformation . We measure by the generated stacking fault method van2004stacking (Supplementary Information Fig. S10) and obtain (Fig. 2i). Thus, , and Type 2 (fcc-AB3) systems have fewer dislocations than Type 1 (fcc-A) systems, which is in accordance with Fig. 2d,e and Supplementary Videos 1, 2. Moreover, unlike in Type 1 systems whose dislocations appear immediately after the onset of plastic deformation (i.e. in Fig. 1b), of Type 2 systems is nearly zero (Fig. 2g) during the strain hardening stage ( in Fig. 1e, Supplementary Video 2). Thus, dislocations barely contribute to the yield at (Fig. 2g).
Bcc crystals have much higher friction stresses for dislocation motions than fcc crystals because of their low packing density, high activation energy of vacancy formation, and asymmetric dislocation cores hull2011introduction . We compress fcc-A, fcc-AB3 and bcc-AB single crystals and confirm that (Fig. 2j). Thus, dislocation density , which is in accordance with Fig. 2a–f, Supplementary Videos 1–3, and literature hull2011introduction .
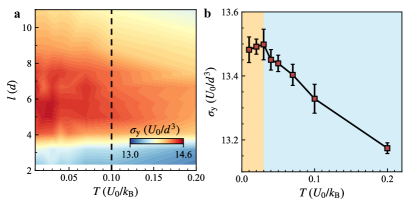
The conventional HP and IHP behaviours of hold at different temperatures, and polycrystals are soft with low at high temperatures naik2020hall . Here, we extend these temperature effects on to thick-GB composites for the first time. As temperature increases, still peaks at for Type 1 systems (Fig. 3a) and monotonically decreases for Types 2 and 3 systems (Supplementary Information Fig. S10). Thus, the generalised HP and IHP behaviours of hold similarly at different temperatures. The expected thermal softening is observed in the whole temperature range for Type 1 systems with (Fig. 3a) and all Types 2 and 3 systems (Supplementary Information Fig. S7). However, the of Type 1 systems with exhibits normal thermal softening at and anomalous strengthening at (Fig. 3b). This anomalous thermal strengthening was experimentally discovered very recently in pure metals at high strain rates and is attributed to the competition amongst thermal, athermal and drag strengthening mechanisms dowding2024metals . These complex competitions depend on lattice symmetry and composition, which may explain why anomalous thermal strengthening exists in Type 1 polycrystals, but not in other systems.
Fracture behaviours of composites with different
Fracture behaviours determine if a solid is ductile or brittle. High ductility is desirable for engineering materials to prevent catastrophic failure during service ovid2018review . Ductility can be enhanced by introducing twin boundaries, stacking faults, or second-phase precipitates because they can block dislocation motions zhu2018ductility and thus expand the strain hardening regime and delay the onset of fracture zhu2004retaining ; pineau2016failure1 . However, introducing defects or precipitates usually weakens the material, which is undesirable zhu2004retaining . Minimising the strength–ductility trade-off is an important challenge in solid mechanics ritchie2011conflicts . Expanding can enhance ductility because thick GBs act as high-capacity sinks for dislocations and thus expand the strain hardening regime caused by deformations in crystalline grains wang2007ductile . Strength decreases with in most regimes (Fig. 1c,f,i,l), so the strength-ductility trade-off remains. However, increases in (Fig. 1c,l), thus the trade-off is absent in this regime.
Ductility and the related fracture behaviours of crystalline–amorphous composites have not been studied before. Here, we perform simulations on samples with free surfaces in the direction and with periodic boundary conditions in the and directions under tensile deformation along the direction. The simulation details are given in Supplementary Information Section 1.2. The abrupt decrease of represents a fracture, that is the appearance of a crack. Note that fracture can also refer to the complete separation of the sample into two or more parts knott1973fundamentals . If no strong plastic deformation occurs before the fracture, the solid is brittle; otherwise, it is ductile knott1973fundamentals . Ductility can be characterized qualitatively by the fracture morphology and quantitatively by tensile strain at the fracture zhu2018ductility .
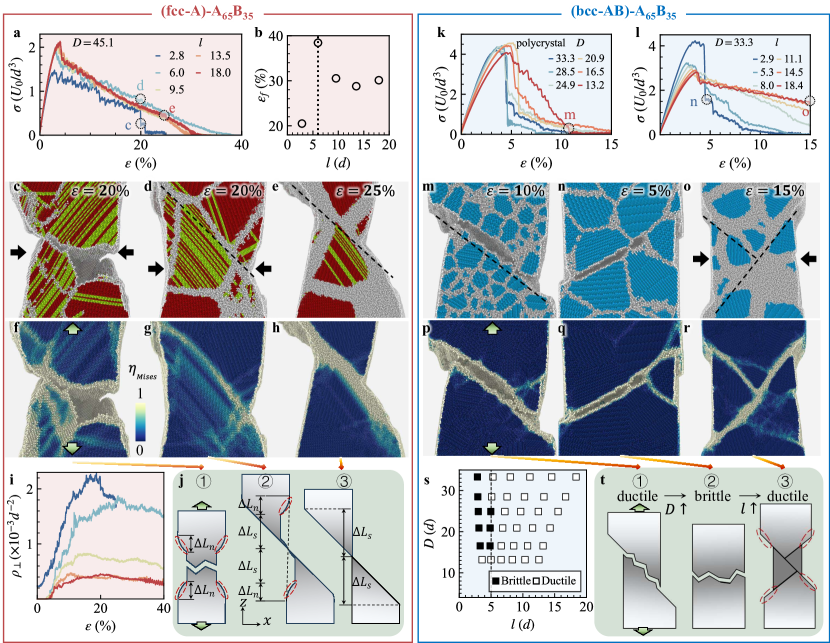
Type 1 fcc systems are ductile because their stress–strain curves in Fig. 4a decrease after the peak and reach 0 at large . in Fig. 4b peaks at . We attribute this maximum ductility at to the fact that the sample has both types of deformation, whereas small- and large- samples only have one type of deformation, as shown in Fig. 4j. In small- samples (), such as those in Fig. 4c,f, the plastic elongation along the direction is because of necking (Fig. 4j①). Necking is a type of plastic deformation with a prominent decrease in the local cross-sectional area, as shown in Fig. 4c and by the ellipses in Fig. 4j①. Necking arises from deformations via considerable dislocation motions and twin-boundary generations in crystalline grains knott1973fundamentals . This result is confirmed by the proliferation of hexagonal close-packed (hcp) lattices (green regions in Fig. 4c–e) which can be viewed as twin boundaries in fcc lattice. At the end of the necking process, a crack initiates on a free surface then propagates along the shortest GBs that cross the two free surfaces (Supplementary Information Fig. S13a,b, Supplementary Video 4). In large- samples (), many dislocations are absorbed into GBs (Fig. 4i), making the crystalline grains less stretchable. Thus, deformations within GBs pre-empt deformations in crystalline grains (i.e. necking). Plastic deformations mostly occur via shear deformation within thick GBs (Fig. 4e,h, Supplementary Information Fig. S13e,f, and Supplementary Video 6), which produce elongation (Fig. 4j③). The 45∘ shear plane relative to the tensile elongation direction endures the maximum shear stress greer2013shear , so the shear deformation is along the GBs whose orientations are close to 45∘ (dashed lines in Fig. 4d,e). In the samples with , both the necking at the early stage and the 45∘ shear deformation at the late stage (Fig. 4d,g, Supplementary Information Fig. S13c,d and Supplementary Video 5) contribute to the elongation. Thus, the total elongation is (Fig. 4j②), which is greater than those of samples with and . This explains the maximum ductility at in Fig. 4b. Whether the occurrence of the maximum ductility and strength at is a coincidence deserves future studies.
Unlike the Type 1 fcc samples that are all ductile (Fig. 4a), the Type 3 bcc samples with different can be ductile with large or brittle with an abrupt decrease in right after the peak (Fig. 4k,l,s). For brittle samples in Fig. 4k,l, although is non-zero after the abrupt drop, a large crack has already formed (Supplementary Video 7), that is, fracture has occurred. The brittle and ductile behaviours of the bcc samples are summarised in Fig. 4s, with the ductile–brittle transitions occurring at for and at for . Ductile–brittle transition occurs in many polycrystals by increasing grain size petch1958ductile ; li2005ductile ; wei2021grain . Fig. 4s not only confirms the above conventional effect, but also shows the effect on ductile–brittle transition. The fracture morphology is a crack along the GBs with a rough surface for brittle solids (Fig. 4n,q,t②; Supplementary Information Fig. S14c,d; and Supplementary Video 8) and shear deformation with a rough (Fig. 4m,p,t①; Supplementary Information Fig. S14a,b; and Supplementary Video 7) or smooth (Fig. 4o,r,t③, Supplementary Information Fig. S14e,f; and Supplementary Video 9) surface for ductile solids. The crack initiates from a free surface in the ductile samples and from a triple junction inside the bulk in the brittle samples. When the crack on the shear band produces voids (Supplementary Information Fig. S14a,b), the subsequent fracture surface becomes rough knott1973fundamentals . A void-free fracture exhibits a smooth surface (e.g. Fig. 4e,h,o,r). Ductile deformation occurs via a single 45∘ shear plane along GBs for small- polycrystals (Fig. 4m,p,t①) and via two shear planes with for large- composites (Fig. 4o,r,t③).
Elastic properties in the space
The elastic properties are also studied in broad space. We measure elastic stiffness tensor by using the explicit deformation method clavier2017computation and obtain bulk modulus , shear moduli and and Young’s modulus . The two shear moduli are very close (Supplementary Information Fig. S3), indicating that the sample contains a sufficient number of grains to be regarded as isotropic.
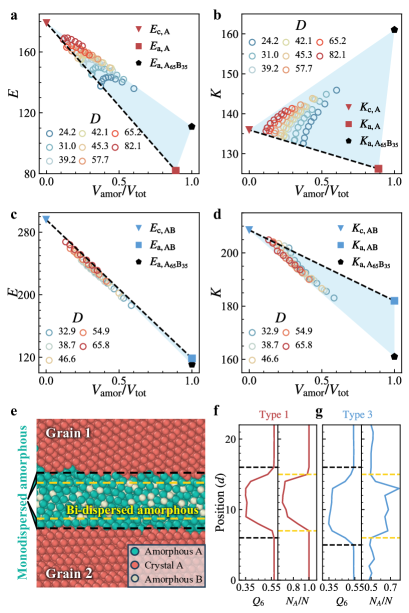
For polycrystals, the elastic modulus is a linear summation of the crystalline and amorphous parts weighted by their volume fractions, i.e., following the simple rule of mixture: askeland2003science , where is the elastic modulus and is the volume fraction of the th phase. This linear relationship is confirmed in our polycrystal samples: the data point with the lowest amorphous fraction at each , i.e. the polycrystal with the lowest , lies on the dashed line between the triangle (pure crystal) and square (pure amorphous) in Fig. 5a–d. However, the other data points deviate from the dashed line in Fig. 5a,b,d. To restore the rule of mixture, we find that the crystalline–amorphous interfaces need to be regarded as the third phase because the interfacial layers have amorphous structures but the same composition as crystalline regions. The crystalline order can be characterized by bond-orientational order parameter (Supplementary Information Eq. S2) steinhardt1983bond . Fig. 5f,g shows that and composition change sharply in the normal direction of GB, i.e. sharp crystalline–amorphous and particle composition interfaces. However, the two interfaces are off by one layer of particles, resulting in one layer of the third phase (Fig. 5f,g). The moduli of the three pure phases measured in separate simulations form a blue triangular area in Fig. 5a-d that covers all the data points, and each data point is a linear combination of these three phases following the rule of mixture.
Discussion
We measure stress–strain relation (e.g. Fig. 1b,e,h,k) for four types of samples (Fig. 1a,d,g,j) with various and study the initial elastic regime at small strains (elastic moduli in Fig. 5), the plastic regime at medium strains (HP and IHP behaviours of in Fig. 1c,f,i,l and their mechanisms in Fig. 2) and fracture behaviours at large strains (Fig. 4). These behaviours have been studied as a function of pande2009nanomechanics ; armstrong201460 ; cordero2016six ; naik2020hall ; schuh2007mechanical ; ovid2018review ; askeland2003science , but not as a function of .
The HP and IHP behaviours are generalised from to (Fig. 1c,f,i,l). under a fixed is non-monotonic (i.e. with HP and IHP behaviours), with the maximum at a fixed particles for different . under a fixed is non-monotonic for fcc composites and monotonic for bcc composites. Maximum strength is at particles for fcc composites with monodispersed crystalline regions, and at particles for fcc composites with bidispersed crystalline regions and bcc compositions (Fig. 1c,f,i,l). These results can explain the recent experimental results on crystalline–amorphous composites. For example, the maximum strength of conventional polycrystals can be exceeded in fcc Ni–Mo crystalline–amorphous composites with 3 nm (i.e. around 10 Mo atoms) GBs ding2019thick , but cannot be exceeded in the bcc Co–Al alloys with 2–10 nm thick GBs su2021high . We suggest that reducing to 2 nm (i.e. atoms) in fcc Ni–Mo composites can further enhance strength.
We find that increasing and decreasing have similar effects on because they both increase the volume fraction of amorphous structures. However, is not solely controlled by the amorphous fraction (Supplementary Information Fig. S12). The maximum is at an amorphous fraction of 28% in Type 1 systems and 15% in Types 2–4 systems (Supplementary Information Fig. S12). At large and small , plastic deformations primarily arise from dislocation motions inside grains. At small or large , i.e. high amorphous fraction, plastic deformations mainly occur in GBs via shear deformation (Fig. 2). Aside from these common features shared by all systems, peaks at for fcc composites and monotonically decreases for bcc composites, which is explained as follows. Expanding up to 6 particles can reduce dislocation motions and thus enhance in fcc composites, but it is not effective in bcc composites because dislocations barely move due to their high friction stress (Fig. 2g).
The temperature dependence of (Fig. 3) shows that conventional thermal softening in polycrystals also exists in crystalline–amorphous composites, and reveals an abnormal increasing regime at low (Fig. 3), which was discovered recently in metals dowding2024metals .
For fcc composites, increasing up to 6 particles enhances strength (Fig. 1c) and ductility (Fig. 4b), so the strength–ductility trade-off is avoided. Ductility mainly arises from necking caused by grain deformation in small- samples and from shear deformation in GBs in large- samples. Both deformation mechanisms exist in intermediate- samples, resulting in the maximum ductility at (Fig. 4b,j). For bcc composites, however, increasing improves ductility but entails the trade-off of reduced strength. All fcc composites are ductile, and bcc composites exhibit a ductile–brittle transition at for samples and at for samples (Fig. 4s).
We find that the rule of mixture for elastic moduli holds well for thick-GB composites. However, when crystalline and amorphous regions have different compositions, their interfaces should be regarded as the third phase to recover the rule of mixture (Fig. 5).
The results show that poorly explored structural parameter has similar importance for mechanical properties as . The results for space can guide the fabrication of ultra-strong solids and the optimization of ductility-strength trade-off. Experimentally testing these simulation results is feasible because thick-GB composites can be fabricated in some alloys gu2024phase ; wu2017dual ; ding2019thick ; su2021high , glass–ceramics holand2019glass and polymer crystals galeski2003strength . In addition, tuning provides a new platform to study ductile–brittle transition and the poorly explored polycrystalline–amorphous transition.
Supplementary information Supplementary Information: Sections 1–5, Figs. S1–14, Videos 1–9.
Acknowledgments
We thank Huijun Zhang for the insightful discussion. This work is supported by RGC grant C6016-20G.
Declarations
-
•
Competing interests. The authors declare no competing interests.
-
•
Availability of data and materials. The data that support the findings of this study are available from the corresponding author upon reasonable request.
-
•
Code availability. All simulation codes are available from the corresponding author upon reasonable request.
-
•
Authors’ contributions. Y.H. and Z.X. conceived and designed the research. Z.X. performed the simulations and data analysis with help from Y.H. and M.L. Z.X. and Y.H. wrote the paper. Y.H. supervised the work. All authors discussed the results.
References
- (1) Hall, E. The deformation and ageing of mild steel: III discussion of results. Proceedings of the Physical Society. Section B 64, 747 (1951).
- (2) Petch, N. The cleavage strength of polycrystals. Journal of the Iron and Steel Institute 174, 25–28 (1953).
- (3) Chokshi, A. H., Rosen, A., Karch, J. & Gleiter, H. On the validity of the Hall-Petch relationship in nanocrystalline materials. Scripta Metallurgica 23, 1679–1683 (1989).
- (4) Trelewicz, J. R. & Schuh, C. A. The Hall-Petch breakdown in nanocrystalline metals: a crossover to glass-like deformation. Acta Materialia 55, 5948–5958 (2007).
- (5) Pande, C. & Cooper, K. Nanomechanics of Hall-Petch relationship in nanocrystalline materials. Progress in Materials Science 54, 689–706 (2009).
- (6) Armstrong, R. W. 60 years of Hall-Petch: past to present nano-scale connections. Materials Transactions 55, 2–12 (2014).
- (7) Cordero, Z. C. & Knight, B. E. & Schuh, C. A. Six decades of the Hall-Petch effect-a survey of grain-size strengthening studies on pure metals. International Materials Reviews 61, 495–512 (2016).
- (8) Naik, S. N. & Walley, S. M. The Hall-Petch and inverse Hall-Petch relations and the hardness of nanocrystalline metals. Journal of Materials Science 55, 2661–2681 (2020).
- (9) Zhou, X. et al. High-pressure strengthening in ultrafine-grained metals. Nature 579, 67–72 (2020).
- (10) Li, X., Wei, Y., Lu, L., Lu, K. & Gao, H. Dislocation nucleation governed softening and maximum strength in nano-twinned metals. Nature 464, 877–880 (2010).
- (11) Holand, W. & Beall, G. H. Glass-Ceramic Technology (John Wiley & Sons, 2019).
- (12) Li, F. et al. Amorphous-nanocrystalline alloys: fabrication, properties, and applications. Materials Today Advances 4, 100027 (2019).
- (13) Gu, J., Duan, F., Liu, S., Cha, W. & Lu, J. Phase engineering of nanostructural metallic materials: classification, structures, and applications. Chemical Reviews 124, 1247–1287 (2024).
- (14) Cantwell, P. R. et al. Grain boundary complexions. Acta Materialia 62, 1–48 (2014).
- (15) Wu, G., Chan, K. C., Zhu, L., Sun, L. & Lu, J. Dual-phase nanostructuring as a route to high-strength magnesium alloys. Nature 545, 80–83 (2017).
- (16) Ding, J. et al. Thick grain boundary induced strengthening in nanocrystalline Ni alloy. Nanoscale 11, 23449–23458 (2019).
- (17) Su, R. et al. High-strength nanocrystalline intermetallics with room temperature deformability enabled by nanometer thick grain boundaries. Science Advances 7, eabc8288 (2021).
- (18) Hua, P., Xia, M., Onuki, Y. & Sun, Q. Nanocomposite NiTi shape memory alloy with high strength and fatigue resistance. Nature Nanotechnology 16, 409–413 (2021).
- (19) Xiao, J. & Deng, C. Mitigating the Hall-Petch breakdown in nanotwinned Cu by amorphous intergranular films. Scripta Materialia 194, 113682 (2021).
- (20) Brink, T. & Albe, K. From metallic glasses to nanocrystals: Molecular dynamics simulations on the crossover from glass-like to grain-boundary-mediated deformation behaviour. Acta Materialia 156, 205–214 (2018).
- (21) Xu, Z., Li, M., Zhang, H. & Han, Y. Generalization of the Hall-Petch and inverse Hall-Petch behaviors by tuning amorphous regions in 2D solids. National Science Open 2, 20220058 (2023).
- (22) Kob, W. & Andersen, H. C. Testing mode-coupling theory for a supercooled binary Lennard-Jones mixture I: the van Hove correlation function. Physical Review E 51, 4626 (1995).
- (23) Brüning, R., St-Onge, D. A., Patterson, S. & Kob, W. Glass transitions in one-, two-, three-, and four-dimensional binary Lennard-Jones systems. Journal of Physics: Condensed Matter 21, 035117 (2008).
- (24) Porter, D. A. & Easterling, K. E. Phase Transformations in Metals and Alloys (CRC, Boca Raton, 2009).
- (25) Schuh, C. A., Hufnagel, T. C. & Ramamurty, U. Mechanical behavior of amorphous alloys. Acta Materialia 55, 4067–4109 (2007).
- (26) Mendelev, M., Sun, Y., Zhang, F., Wang, C.-Z. & Ho, K.-M. Development of a semi-empirical potential suitable for molecular dynamics simulation of vitrification in Cu-Zr alloys. The Journal of Chemical Physics 151, 214502 (2019).
- (27) Wang, Y., Li, J., Hamza, A. V. & Barbee Jr, T. W. Ductile crystalline-amorphous nanolaminates. Proceedings of the National Academy of Sciences 104, 11155–11160 (2007).
- (28) Jang, D. & Greer, J. R. Transition from a strong-yet-brittle to a stronger-and-ductile state by size reduction of metallic glasses. Nature Materials 9, 215–219 (2010).
- (29) Schuh, C, Hufnagel, T. & Ramamurty, U. Mechanical behavior of amorphous alloys. Acta Materialia 55, 4067–4109 (2007).
- (30) Zhu, Y., Liao, X. & Wu, X. Deformation twinning in nanocrystalline materials. Progress in Materials Science 57, 1–62 (2012).
- (31) Van Swygenhoven, H., Derlet, P. M. & Frøseth, A. Stacking fault energies and slip in nanocrystalline metals. Nature Materials 3, 399–403 (2004).
- (32) Salehinia, I. & Bahr, D. Crystal orientation effect on dislocation nucleation and multiplication in fcc single crystal under uniaxial loading. International Journal of Plasticity 52, 133–146 (2014).
- (33) Zepeda-Ruiz, L. A., Stukowski, A., Oppelstrup, T. & Bulatov, V. V. Probing the limits of metal plasticity with molecular dynamics simulations. Nature 550, 492–495 (2017).
- (34) Hull, D. & Bacon, D. J. Introduction to Dislocations (Butterworth-Heinemann, Oxford, 2011).
- (35) Dowding, I. & Schuh, C. A. Metals strengthen with increasing temperature at extreme strain rates. Nature 630, 91–95 (2024)
- (36) Ovid’Ko, I., Valiev, R. & Zhu, Y. Review on superior strength and enhanced ductility of metallic nanomaterials. Progress in Materials Science 94, 462–540 (2018).
- (37) Zhu, Y. & Wu, X. Ductility and plasticity of nanostructured metals: differences and issues. Materials Today Nano 2, 15–20 (2018).
- (38) Zhu, Y. T. & Liao, X. Retaining ductility. Nature Materials 3, 351–352 (2004).
- (39) Pineau, A., Benzerga, A. A. & Pardoen, T. Failure of metals I: brittle and ductile fracture. Acta Materialia 107, 424–483 (2016).
- (40) Ritchie, R. O. The conflicts between strength and toughness. Nature Materials 10, 817–822 (2011).
- (41) Knott, J. F. Fundamentals of Fracture Mechanics (Gruppo Italiano Frattura, Butterworth & Co., London, 1973).
- (42) Greer, A., Cheng, Y. & Ma, E. Shear bands in metallic glasses. Materials Science and Engineering: R: Reports 74, 71–132 (2013).
- (43) Petch, N. The ductile-brittle transition in the fracture of -iron: I. Philosophical Magazine 3, 1089–1097 (1958).
- (44) Li, H. & Ebrahimi, F. Ductile-to-brittle transition in nanocrystalline metals. Advanced Materials 17, 1969–1972 (2005).
- (45) Wei, K. et al. Grain size effect on tensile properties and slip systems of pure magnesium. Acta Materialia 206, 116604 (2021).
- (46) Clavier, G. et al. Computation of elastic constants of solids using molecular simulation: comparison of constant volume and constant pressure ensemble methods. Molecular Simulation 43, 1413–1422 (2017).
- (47) Askeland, D. R., Phulé, P. P., Wright, W. J. & Bhattacharya, D. The Science and Engineering of Materials (Springer, 2003).
- (48) Steinhardt, P. J., Nelson, D. R. & Ronchetti, M. Bond-orientational order in liquids and glasses. Physical Review B 28, 784 (1983).
- (49) Galeski, A. Strength and toughness of crystalline polymer systems. Progress in Polymer Science 28, 1643–1699 (2003).