Detection of very high-energy gamma-ray emission from the radio galaxy M87 with LHAASO
Abstract
The nearby radio galaxy M87 is a very-high-energy (VHE) gamma-ray emitter established by observations with ground-based gamma-ray detectors. Here we report the long-term monitoring of M87 from 2021 to 2024 with Large High Altitude Air Shower Observatory (LHAASO). M87 has been detected by LHAASO with a statistical significance . The observed energy spectrum extends to 20 TeV, with a possible hardening at TeV and then a clear softening at higher energies. Assuming that the intrinsic spectrum is described by a single power law up to 20 TeV, a tight upper bound on the extragalactic background light (EBL) intensity is obtained. A strong VHE flare lasting eight days, with the rise time of days and decay time of days, was found in early 2022. A possible GeV flare is seen also in the Fermi-LAT data during the VHE flare period. The variability time as short as one day seen in the LHAASO data suggests a compact emission region with a size of ( being the Doppler factor of the emitting region), corresponding to a few Schwarzschild radii of the central supermassive black hole in M87. The continuous monitoring of the source reveals a duty cycle of for VHE flares with a flux above .
1 Introduction
The radio galaxy M87 is one of the nearest active galactic nuclei (AGN) located in the Virgo Cluster at a distance of approximately Mpc (Blakeslee et al., 2009). It hosts a super massive black hole (SMBH), known as M87⋆, with a mass of (Event Horizon Telescope Collaboration et al., 2019). M87 has been a subject of extensive studies across the entire electromagnetic spectrum (see EHT MWL Science Working Group et al. (2021) for a review of recent observations).
The first evidence for very-high-energy (VHE) gamma-ray emission from M87 was reported by the High Energy Gamma Ray Astronomy during 1998-1999 (Aharonian et al., 2003). It was later confirmed by the next-generation imaging air Cherenkov telescopes (IACTs), including H.E.S.S. (Aharonian et al., 2006), VERITAS (Acciari et al., 2009, 2010), MAGIC (Albert et al., 2008), as well as by the High Altitude Water Cherenkov Observatory (HAWC) at a marginal statistical level (Albert et al., 2021). M87 has also been detected by Fermi-LAT in the high-energy (HE, ) band (Abdo et al., 2009).
The exact location of the VHE gamma-ray emitting region in M87 remains unknown. The angular resolution of ground-based VHE instruments is of the order of 0.1 degree (corresponding to 30 kpc projected size) and, therefore, does not allow to locate the emitting region. The suggested sites of TeV gamma-ray production range from the immediate environment (e.g., the magnetosphere) of the supermassive black hole(Aharonian et al., 2006; Neronov & Aharonian, 2007; Rieger & Aharonian, 2012) to inner (subparsec) parts of the jet (Reimer et al., 2004; Georganopoulos et al., 2005), a compact hot spot (the so-called HST-1 knot) at a distance of 100 pc along the jet (Stawarz et al., 2006), and large-scale structures in the kiloparsec jet (Stawarz et al., 2005). To further investigate the location of the VHE gamma-ray emission site, variability studies and the search for correlations with other wavelengths have usually been used (e.g., Acciari et al., 2009).
Four major VHE flares from M87 have been reported before the current observations, in 2005 (Aharonian et al., 2006), 2008 (Albert et al., 2008; Acciari et al., 2009), 2010 (Abramowski et al., 2012) and 2018 (H. E. S. S. Collaboration et al., 2024; The Event Horizon Telescope-Multi-wavelength science working group et al., 2024). The variability time scales of the these VHE flares is about one day. This points, through the causality argument, to a compact emission region with a size smaller than , where is the Doppler factor of the emitting region. The coincidence of the first VHE flare with a giant X-ray flare from HST-1 (Harris et al., 2006) initially prompted speculations that the observed VHE emission may have originated in HST-1 (e.g., Stawarz et al. (2006)). During the second flaring episode, however, HST-1 was in a low flux state, while radio measurements showed a flux increase in the core region within a few hundred Schwarzschild radii of the SMBH, suggesting the direct vicinity of the SMBH as the site of the VHE gamma-ray emission (Acciari et al., 2009). This conclusion was further supported by the detection of an enhanced X-ray flux from the core by Chandra. Therefore, the potential site of such rapid flares is related to either the core of M87 (Aharonian et al., 2006) or to very compact regions in the jet, for instance, the HST-1 knot (Harris et al., 2006). Note that, however, the location of HST-1, at a distance of 100 pc from the central BH, would require an extremely tight collimation of the jet to account for the observed fast (days-scale) TeV variability (Aharonian et al., 2006). Moreover, the fact that the Chandra X-ray flux from HST-1 did not change much during subsequent VHE flaring episodes (after the one in 2005) has been taken to disfavor HST-1 as a site of the rapid TeV flaring activity (Rieger & Aharonian, 2012).
With a large detector area and excellent gamma-ray/background discrimination power, the sensitivity of Large High Altitude Air Shower Observatory (LHAASO) at VHE are higher than any other extensive air shower (EAS) experiments. Moreover, in contrast to Atmospheric Cherenkov telescopes, LHAASO can monitor M87 continuously, thanks to its wide field of view and high duty cycle. Here we present the three-year continuous observations of M87 from 2021 to 2024 with LHAASO. During the campaign, a major VHE flare was detected in 2022. Characteristics of the VHE flare are investigated and possible correlation with the GeV band measured by Fermi-LAT is discussed. This paper is organized as follows. In Section 2, we present the LHAASO observations of M87 and the analysis methods. In Section 3, the results of Fermi-LAT during the same observation period are presented. In Section 4, we discuss the implications of our findings, and summarize the results in Section 5.
2 LHAASO observations
LHAASO is a multifaceted and comprehensive EAS detector array. The facility consists of three sub-arrays, including the Water Cherenkov Detector Array (WCDA, sensitive to VHE gamma-rays at energy from a few hundreds of GeV to tens of TeV), the 1.3 km2 ground array (KM2A, sensitive to VHE gamma-rays at energy above 20 TeV) and the Wide Field-of-view Air Cherenkov/Fluorescence Telescope Array (WFCTA), designed for cosmic ray studies from 10 TeV to 1 EeV. The detailed information about the performance of these sub-arrays and data reconstruction algorithms can be seen in Cao et al. (2019, 2024). The details of data analysis are summarized in Appendix A. The first source catalog of Large High Altitude Air Shower Observatory reported the detection of a very-high-energy gamma ray source, 1LHAASO J1219+2915 (Cao et al., 2024), which is identified as the counterpart of a low-luminosity AGN (NGC 4278 Cao et al., 2024b).
The data utilized for M87 in this work is collected by full array of LHAASO-WCDA from 8 March, 2021 to 16 March 2024 and full array of LHAASO-KM2A from 20 July, 2021 to 31 January, 2024. The effective live time is 1026 days and 884 days, respectively. The number of fired hit () is selected as the estimator of primary energy for WCDA (Aharonian et al., 2021a). The events are binned into seven segments with value of [60, 100), [100, 200), [200, 300), [300, 500), [500, 700), [700, 1000) and [1000, 2000]. The KM2A events are divided into bins with reconstructed energy width of 0.2 in log scale (Aharonian et al., 2021b). The “direct integral method” is adopted here to estimated cosmic ray background (Fleysher et al., 2004). A binned maximum likelihood analysis based on the forward folding method ( i.e., convolving the assumed spectrum model with the detector response) is performed to estimate best-fit values of position and spectrum parameters. The test statistic (TS) is used to calculate significance of the target source, , where and are the likelihood values for the background without (null hypothesis) and with the target signal model, respectively.
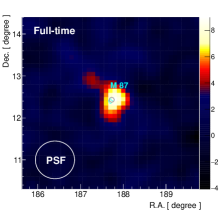
The LHAASO-WCDA full-time significance map of the M87 region is shown in the left panel of Figure 1. The gamma-ray spatial distribution is well described by a point-like source model with a TS of 87.4 (corresponding to ). The value between the point-like model and 2-D Gaussian model is smaller than 0.1. The best-fit position of the source is (R.A. = , Decl. = ). This position is only 0.03∘ away from the radio position of the core of M87, suggesting that the source is spatially associated with M87.
2.1 The full-time average spectrum
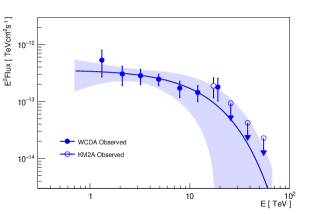
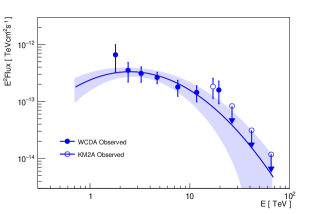
We combined the WCDA and KM2A data using a joint forward folded fit to determine the observed spectral energy distribution (SED) of M87, shown in Figure 2, assuming a power-law with exponential cutoff (denoted as PLEC) function or a log-parabola (LP) function (denoted as LP). The PLEC function is defined as
| (1) |
and the LP function is defined as
| (2) |
where is the cutoff energy, is the photon index of the spectrum and is the coefficient reflecting the spectral curvature. WCDA covers the energy range from 1 to 20 TeV, and KM2A has one detection at about 20 TeV with the upper limits extending to about 50 TeV. The two measurements are consistent with each other at 20 TeV. Fitting the LP function, the yielded is 5.7/3, where is the number of degrees of freedom. If fitting with the PLEC function, the yielded is 4.2/3.
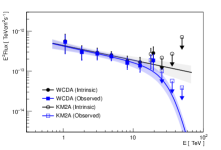
The cutoff shape at the high energy in the observed SED could be partly or fully caused by the extra-galactic background light (EBL) absorption. The intrinsic spectrum can be obtained by correcting for the absorption due to EBL. The simplest assumption for the intrinsic spectrum is that it is described by a power-law function . To incorporate the EBL absorption into our spectral models, we select three models that represent the uncertain range of the EBL intensity, the kneiske model (Kneiske & Dole, 2010) for the lower boundary of the EBL flux, the franceschini model for the medium intensity (Franceschini et al., 2008), and dominguez-upper model reflecting upper bounds of the EBL flux (Domínguez et al., 2011). As demonstrated in Table 1, these PLxEBL models all yield good fit to the observed spectral data with slightly improved compared with the PLEC and LP fit. A higher EBL flux results in a harder intrinsic spectrum, although the statistical error in the photon index is still large. For subsequent analysis, we adopt the medium-intensity EBL model (the franceschini model) as the baseline EBL model. The photon attenuation derived from the EBL model as a function of energy at the distance of M87 (z = 0.0042) is applied to correct the detection efficiency. With EBL-corrected detection efficiency, the photon index of the intrinsic spectrum is 2.370.14 for the full-time period. The best-fit parameters for the power-law intrinsic spectrum are summarized in Table 2. As shown in the left panel of Figure 3, the intrinsic spectrum for the full time data extends to tens of TeV without a visible softening. Interestingly, a possible spectral hardening is seen at 20 TeV.
It is possible that the intrinsic spectrum is not a simple power law, but has a steepening at the high-energy end. We assume that the intrinsic spectrum is described by a power law with an exponential cutoff or a log-parabola function and test the goodness of the fitting. We find that the results do not improve compared to the simple power law model and the fitting parameters ( or ) are not well constrained (the details are shown in Table 4 in the Appendix), which could be due to the low statistics of the data.
2.2 The light curve
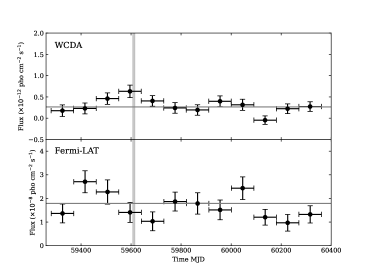
To ensure that the TS value of each bin is greater than 4, we show the light curve of M87 during the three-year continuous observations with LHAASO-WCDA in Figure 4 (the upper-left panel). As the reported variability time scale of M87 could be as short as one day, we also extract the light curve of M87 binned on two-days and one-day using three years of LHAASO-WCDA data, assuming a spectral index equal to the value obtained in the full time analysis.
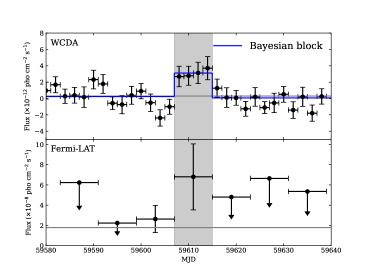
For the two-day binning light curve, the likelihood variability test (Abeysekara et al., 2017) of a constant flux (set to the average flux of full time) gives a p-value of (), indicating the possible existence of variability. In order to quantify the fluctuations of temporal profiles, we employ the Bayesian block method (Scargle et al., 2013) on the two-day binning light curve with a prior false positive probability of 5%. Only one clear block from MJD 59607 to MJD 59615 is found, which is shown in the upper-right panel of Figure 4 (the blue line). We identify this period as a flare, whose details will be discussed in section 2.2.1. Four time window widths of 1 day, 2 days, 4 days, and 8 days were used to search the 1026-day LHAASO-WCDA data, resulting in 2071 searches. A conservative way is adopted to calculate the post-trial significance of the flare by setting the trial number equal to 2071, which yields a post-trial significance of .
2.2.1 The 2022 VHE flare
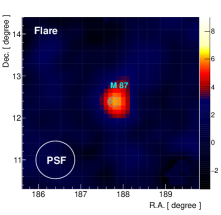
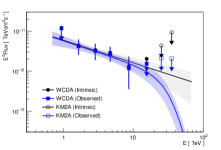
The best-fit position of the emission detected during the flare period is (R.A. =, Decl. = ), which is 0.07∘ away from radio position of core of M87, as shown in the middle panel of Figure 1. The TS value and photon index of the intrinsic spectrum for this flare are 40.1 and (see Table 2), respectively. The spectrum of the flare is also shown in Figure 3 (the middle panel).
The VHE flare detected by LHAASO has an average flux of , corresponding to an energy flux of in 1-20 TeV assuming a photon index . With a distance of , the corresponding isotropic VHE luminosity is . This is a non-negligible amount compared to the bolometric luminosity () of the M87 nucleus (Kharb & Shastri, 2004) and the total kinetic luminosity () of the jet (Owen et al., 2000).
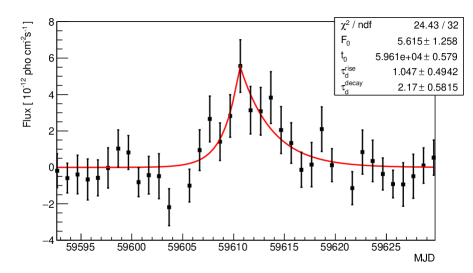
To derive the variability timescale of M87, the one-day time-bin light curve of the flare is fitted with a two-sided exponential function,
| (3) |
The peak time is set to be free, and the resulting flux doubling time of the rising part is days and that of the decaying part is days. The variability time scale is similar to that of the 2010 flare (Abramowski et al., 2012), but the 2022 flare reported in this work rises faster and decays slower. The fitting result is shown in Figure 5. This obtained variability time scale days corresponds to the size of a spherical emission region of , where is the Doppler factor to describe the relativistic beaming.
2.2.2 The low-state emission
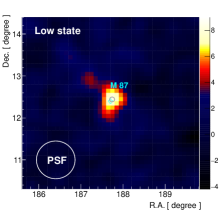
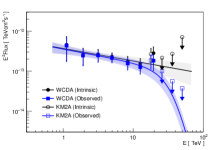
We consider the non-flare period (i.e., excluding the flare period from MJD 59607 to MJD 59615) as the low-state. The significance map of this low-state emission is shown in the right panel of Figure 1 and the best-fit position, marked by the cyan open cross, is consistent with the radio position of the core of M87. The TS value of the low-state emission is 76.0. The photon index of the low-state emission, 2.310.17, is similar to the one obtained with fitting the entire data set. This photon index is consistent with that of the low state emission of M87 measured by H.E.S.S. (H. E. S. S. Collaboration et al., 2023). The spectral data for the low-state emission is shown in Figure 3 (the right panel).
3 Fermi-LAT observations
We searched for multi-wavelength (radio to GeV) data of M87 during the 2022 VHE flare period, and found that only Fermi Large Area Telescope (LAT) had the simultaneous observations in this flare period.
The Fermi-LAT data (Atwood et al., 2009) of M87 are extracted from Fermi Science Support Center111https://fermi.gsfc.nasa.gov/ssc/data/access/. The data cover about 15.5 years from August 4, 2008 to March 16, 2024, in an energy range between 100 MeV and 100 GeV. The details of analysis are summarized in Appendix B. For the 15.5-year observation of M87, the source is detected with TS=2434.31 (corresponding to a significance of ). The average flux is , with a photon index of . The average flux is shown by the gray lines in the bottom panels of Figure 4.
We also analyzed three-year data of M87 with the same observation period as LHAASO, i.e., from 8 March, 2021 to 16 March 2024 (MJD 59281–60385). Firstly, we use three-month time bin (the same time bin as used for LHAASO light curve) to obtain the light curves, and the results are shown in the bottom-left panel of Figure 4. Compared to the average flux, there are no significant variations in the light curve, suggesting no significant evidence of variability on timescales of several months over the three-year period. Considering that the VHE flare measured by LHAASO lasts eight days, we also use 8-day time bin (centred on the VHE flare) to obtain the GeV light curves, shown in the bottom-right panel of Figure 4. Interestingly, we find that two time bins have TS values greater than 9, i.e., one before the VHE flare period with TS=10.7 ( significance) and the other one during the same period as the VHE flare with TS=9.5 ( significance). The GeV flux during the VHE flare period is , a factor of 3.8 higher than the average flux. Given the weakness of the GeV source, shorter-term variations are difficult to probe. The Fermi-LAT results are summarized in Table 3.
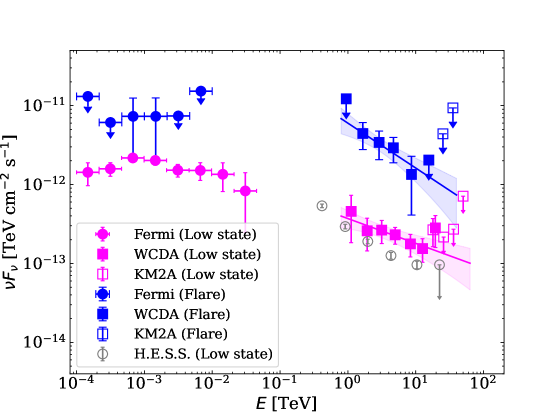
We compare the GeV spectrum with the VHE spectrum during the flare period and the low-state period in Figure 6. For the low-state period, the VHE emission is consistent with the extrapolation of the GeV spectrum, indicating possibly a single spectral component for both GeV and VHE emissions. For the flare period, it is possible that the GeV emission can smoothly connect to the VHE emission. However, since the error of the GeV flux during the flare period is large, one cannot reach a reliable conclusion.
4 Discussions
4.1 VHE flare emission
For the variability time of days of the current VHE flare, the size of the emission region should be smaller than , where is the Doppler factor of the emitting region. The jet of M87 is observed at a large angle degrees (Biretta et al., 1999), making M87 a “misaligned” BL Lacertae object that most jet emission is characterized by rather weak Doppler factors , where is the jet Lorentz factor. Since the mass of the SMBH in M87 is well established, , the Schwarzschild radius is estimated quite accurately: . Therefore, the size of the emission region of the VHE flare is only a few Schwarzschild radii of the SMBH.
The small size of the TeV emission region, together with the correlated variability between the X-ray emission (and radio emission) of the core and the TeV emission in some previous VHE flares, suggest that the relevant non-thermal particle acceleration and emission processes could take place in the core of M87. One scenario involves inner sub-pc jets that produce VHE emission like blazars (Georganopoulos et al., 2005; Tavecchio & Ghisellini, 2008). Georganopoulos et al. (2005) considered the case of a relativistic jet decelerating substantially on sub-parsec distances from the core, and showed that the velocity difference between a faster and a slower portion of the outflow could lead to the enhanced inverse-Compton emission of the former one in the TeV range.
Magnetospheric particle acceleration and emission models have also been invoked to explain the observed VHE emission in M87 (Neronov & Aharonian, 2007; Rieger & Aharonian, 2008). Such a mechanism of gamma-ray emission from the vicinity of a BH is a close analog of the mechanism of pulsed gamma-ray emission from the vicinity of neutron stars in pulsars. Usually, efficient particle acceleration in these scenarios is related either to gap-type (Neronov & Aharonian, 2007; Levinson & Rieger, 2011) or centrifugal-type processes occurring in the magnetosphere around a rotating black hole (Rieger & Aharonian, 2008). Because of its low infrared luminosity, the nucleus of M87 can be effectively transparent for gamma-rays up to an energy of TeV.
Other types of models have been also put forward to explain the observed rapid variability of the VHE -ray emission from M87. Recent high-resolution general-relativistic magnetohydrodynamic simulations show the occurrence of episodic magnetic reconnection events that can power flares near the black hole event horizon (Ripperda et al., 2020; Hakobyan et al., 2023). It was also argued that interactions of a relativistic magnetized outflow around the jet formation zone with a star partially tidally disrupted by the interaction with the SMBH can lead to an efficient production of VHE photons via hadronic processes (Barkov et al., 2010; Aharonian et al., 2017).
It is worth to mention that that, unlike IACTs, LHAASO data provide continuous and uniform TeV measurements of M87. While IACTs observations have a better sensitivity for short-time exposure, LHAASO observations provide a comprehensive study of the TeV light curve on the months and years time scales. The measurements presented in this work can be used to estimate the duty cycle of VHE flares in M87. The duty cycle of astrophysical sources is defined as the fraction of time during which the sources are in a flaring state. This can be used to estimate the active time of the central engine and the total energy release during the flaring state, in comparison with that in the low-state. Previous IACT observations of M87 found that the respective duty cycle of VHE flares are , and for a threshold flux of , and (Abramowski et al., 2012). However, due to the observing strategy for M87, i.e., observations have been intensified after the detection of a high state, the data set could be biased. The derived duty cycle is, therefore, likely overestimated and should be considered an upper limit(Abramowski et al., 2012). During the three-year continuous monitoring of M87, LHAASO detected one strong flare over a period of 8 days with an energy flux reaching in 1–20 TeV, revealing a duty cycle of for such bright flares. As the flux during the flaring state is one order of magnitude of higher, the total energy release during the flaring state is about 10% of the energy release in the low state. This may be useful to constrain the underlying physical process for VHE flares.
4.2 Long-term low-state VHE emission
The LHAASO observations revealed a long-term VHE emission with a flux level of . The intrinsic spectrum can be described by a power law, with a possible hardening at 20 TeV. Although for the episodes of rapid TeV flaring activity an origin in the sub-parsec scale jet and below is preferred, it could well be that larger scale structures (such as HST-1, the kpc-scale jet and the knot A) contribute to the overall, low-state VHE emission. The nuclear environment of M87 does not show evidence of significant sources of soft photons (e.g., from the torus or star formation sites) and therefore the inverse Compton emission is likely dominated by the synchrotron self-Compton (SSC) component from the same population of relativistic electrons that produce the synchrotron photons. However, a simple one-zone synchrotron and SSC model cannot describe the observed SED easily (Tavecchio & Ghisellini, 2008). The reason for that is the following, in order to have the synchrotron component peaking in the infrared (IR) region and the SSC component close to the TeV band (as required by the relatively flat TeV spectra), one has to assume an unreasonably large Doppler factor, . The hard TeV spectrum also challenges the one-zone SSC model, since the Klein-Nishina effect leads to a spectral steepening towards the highest energy end. Indeed, previous detailed modelings of the low-state emission have found that the SSC model provides a good fit to the SED up to GeV gamma-rays, but it underestimates the VHE emission (e.g. Ait Benkhali et al., 2019; Alfaro et al., 2022).
To overcome this problem, one should “decouple” the synchrotron and IC components, assuming that the two components are produced in two different regions, as in the “decelerating jet” model (Georganopoulos et al., 2005) or in the “spine-layer” model (Tavecchio & Ghisellini, 2008). Other possibility includes several randomly oriented active regions resulting from reconnection events in the jet (the so-called “jets-in-the-jet” scenario Giannios et al., 2009, 2010). An alternative model is a lepto-hadronic emission model (Reimer et al., 2004; Fraija & Marinelli, 2016; Boughelilba et al., 2022), in which three spectral components are involved: a synchrotron-dominated component from radio to X-rays, an inverse Compton-dominated component from X-rays to GeV gamma-rays, and a photohadronic-dominated component in the VHE band.
A spectral hardening seen at 20 TeV (see Figures 2 and 3) is statistically insignificant in the currently available data set. With continuous monitoring by LHAASO for several more years, the source significance will increase continuously and we may be able to test whether the spectral hardening is a statistical fluctuation or a true feature. If the feature is real, it may indicate the presence of an additional component at the high energy, which could be a hadronic component. To explain the spectral hardening with hadronic models, the process would need a proton spectrum harder than , while the process can more easily produce a spectral bump if the target photons peak at a suitable energy. To produce a bump at TeV via process, one would need protons of energy TeV and the target photons peaking at keV.
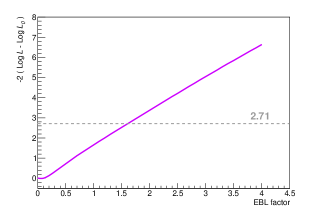
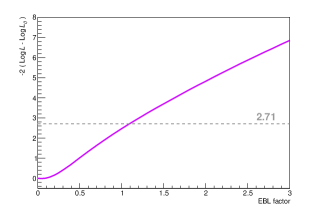
4.3 Constraining the upper bound of the EBL intensity with the VHE data
The EBL is not well established with large uncertainties in the flux. Our results allow us to put a constraint on the upper bound of the EBL intensity, assuming that the intrinsic spectrum is described by a single power law extending to the maximum energy at 20 TeV. We adopt a model for the observed spectrum that incorporates a power-law multiplied by the scaled EBL absorption: , where is the absorption depth due to EBL for a gamma-ray photon with energy and is the scaling factor. We use from the Franceschini et al. (2008) as reference values. Since the absorption for low energy photons below 10 TeV is negligible (), the relevant wavelength range222This wavelength range is obtained from the peak of the pair production cross section at the wavelength for a specific gamma-ray photon of energy E: . for EBL constraint is . To obtain the upper limit of , we estimate the likelihood values by varying the parameter in fitting the spectral data observed by LHAASO. The result is shown in Figure 7. We find that the upper limit of at a 95% confidence level is about 1.6. This means that the upper bound of the EBL intensity is a factor of 1.6 larger than the intensity given by Franceschini et al. (2008) for the wavelength range . We also study the constraint on the dominguez-upper model that reflects maximum EBL flux (Domínguez et al., 2011). We find that the upper limit of at a 95% confidence level is only 1.09. This means that the upper limit allowed by our TeV data is very close to the maximum EBL flux model.
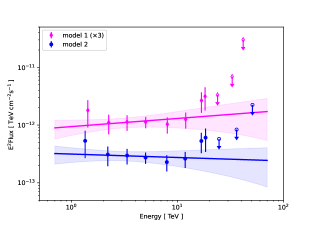
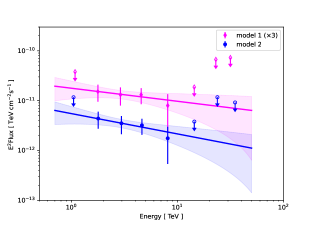
4.4 Influence of the possible internal absorption on the spectrum
TeV gamma-rays could be absorbed by the radiation fields in the central region of M87. The observed infrared luminosity of the nucleus of M87 is about (Perlman et al., 2001; Whysong & Antonucci, 2004). Although there are no direct measurements of the size of the infrared source, observations in the microwave band at 43 GHz suggest that its size at millimeter wavelengths is limited by , corresponding to 25 for a BH mass of . Neronov & Aharonian (2007) calculated the optical depth for gamma-rays produced by the infrared source assuming that the size of the infrared source is comparable to that of the microwave source, finding that the nucleus of M87 is effectively transparent for gamma-rays up to an energy of 10 TeV. Brodatzki et al. (2011) consider the temperature distribution of the disk photons of M87 and calculate the optical depth of gamma-rays for different inclination angle between the jet and our line of sight. They find that, for , the optical depth exceeds unity only for photons with energy above 20 TeV.
We perform a re-analysis of the VHE spectra of M87 assuming internal absorption based on the above two models, i.e., model 1 for Neronov & Aharonian (2007) and model 2 for Brodatzki et al. (2011). The intrinsic VHE spectra of M87 during the full-time period and the flare period after considering the internal absorption are shown in Figure 8. It is found that the spectra become harder with a spectral index being for model 1 and for model 2 during the full-time period. During the flare period, the spectral index is for model 1 and for model 2. The excess at 20 TeV becomes more pronounced in the VHE spectra during the full-time period. Note that, in the calculation, we have assumed that the emitting region of the VHE emission during the low state is also close the AGN core, similar to the case during the flare state.
5 Summary
We conducted three-year continuous observations of M87 from 2021 to 2024 with LHAASO, which yield a detection of a signal with a statistical significance of . The LHAASO observations revealed a long-term VHE emission with a flux level of . The observed energy spectrum extends to 20 TeV, showing a cutoff shape at higher energies. Assuming that the intrinsic spectrum is described by a single power law up to 20 TeV, we obtained a stringent upper bound on the EBL intensity.
No clear variability is observed in the long-term light curve on three-month time bins of the LHAASO data. A strong flare, lasting eight days, is found in early 2022 on a two-day time bin analysis. The flux during the flare is higher than the long-term average flux by one order of magnitude. The light curve of the flare is described by a two-sided exponential function with a rise time of days and a decay time of days. Unlike the previous flares, the 2022 flare rises faster and decays slower. The rapid variability suggest that the VHE emission arises from a compact emission region with a size of (), corresponding to only a few Schwarzschild radii of the central supermassive black hole. This suggests that the relevant non-thermal particle acceleration and emission processes could take place in the vicinity of the central black hole. We also found a possible GeV flare in the Fermi-LAT data during the TeV flare period.
The continuously monitoring of M87 with LHAASO makes it possible, for the first time, to give an unbiased estimate of the duty cycle of bright VHE flares. One strong flare observed during the three-year observations indicates a duty cycle of for VHE flares with a flux reaching .
References
- Abdo et al. (2009) Abdo, A. A., Ackermann, M., Ajello, M., et al. 2009, ApJ, 707, 55, doi: 10.1088/0004-637X/707/1/55
- Abdollahi et al. (2020) Abdollahi, S., Acero, F., Ackermann, M., et al. 2020, The Astrophysical Journal Supplement Series, 247, 33
- Abeysekara et al. (2017) Abeysekara, A. U., Albert, A., Alfaro, R., et al. 2017, The Astrophysical Journal, 841, 100, doi: 10.3847/1538-4357/aa729e
- Abramowski et al. (2012) Abramowski, A., Acero, F., Aharonian, F., et al. 2012, ApJ, 746, 151, doi: 10.1088/0004-637X/746/2/151
- Acciari et al. (2009) Acciari, V. A., Aliu, E., Arlen, T., et al. 2009, Science, 325, 444, doi: 10.1126/science.1175406
- Acciari et al. (2010) —. 2010, ApJ, 716, 819, doi: 10.1088/0004-637X/716/1/819
- Aharonian et al. (2003) Aharonian, F., Akhperjanian, A., Beilicke, M., et al. 2003, A&A, 403, L1, doi: 10.1051/0004-6361:20030372
- Aharonian et al. (2006) Aharonian, F., Akhperjanian, A. G., Bazer-Bachi, A. R., et al. 2006, Science, 314, 1424, doi: 10.1126/science.1134408
- Aharonian et al. (2021a) Aharonian, F., An, Q., Axikegu, et al. 2021a, Chinese Physics C, 45, 085002, doi: 10.1088/1674-1137/ac041b
- Aharonian et al. (2021b) —. 2021b, Chinese Physics C, 45, 025002, doi: 10.1088/1674-1137/abd01b
- Aharonian et al. (2017) Aharonian, F. A., Barkov, M. V., & Khangulyan, D. 2017, ApJ, 841, 61, doi: 10.3847/1538-4357/aa7049
- Ait Benkhali et al. (2019) Ait Benkhali, F., Chakraborty, N., & Rieger, F. M. 2019, A&A, 623, A2, doi: 10.1051/0004-6361/201732334
- Albert et al. (2021) Albert, A., Alvarez, C., Angeles Camacho, J. R., et al. 2021, ApJ, 907, 67, doi: 10.3847/1538-4357/abca9a
- Albert et al. (2008) Albert, J., Aliu, E., Anderhub, H., et al. 2008, ApJ, 685, L23, doi: 10.1086/592348
- Alfaro et al. (2022) Alfaro, R., Alvarez, C., Arteaga-Velázquez, J. C., et al. 2022, ApJ, 934, 158, doi: 10.3847/1538-4357/ac7b78
- Atwood et al. (2009) Atwood, W. B., Abdo, A. A., Ackermann, M., et al. 2009, ApJ, 697, 1071, doi: 10.1088/0004-637X/697/2/1071
- Barkov et al. (2010) Barkov, M. V., Aharonian, F. A., & Bosch-Ramon, V. 2010, ApJ, 724, 1517, doi: 10.1088/0004-637X/724/2/1517
- Biretta et al. (1999) Biretta, J. A., Sparks, W. B., & Macchetto, F. 1999, ApJ, 520, 621, doi: 10.1086/307499
- Blakeslee et al. (2009) Blakeslee, J. P., Jordán, A., Mei, S., et al. 2009, ApJ, 694, 556, doi: 10.1088/0004-637X/694/1/556
- Boughelilba et al. (2022) Boughelilba, M., Reimer, A., & Merten, L. 2022, ApJ, 938, 79, doi: 10.3847/1538-4357/ac8e64
- Brodatzki et al. (2011) Brodatzki, K. A., Pardy, D. J. S., Becker, J. K., & Schlickeiser, R. 2011, ApJ, 736, 98, doi: 10.1088/0004-637X/736/2/98
- Brodatzki et al. (2011) Brodatzki, K. A., Pardy, D. J. S., Becker, J. K., & Schlickeiser, R. 2011, The Astrophysical Journal, 736, 98, doi: 10.1088/0004-637X/736/2/98
- Cao et al. (2019) Cao, Z., della Volpe, D., Liu, S., et al. 2019, arXiv e-prints, arXiv:1905.02773, doi: 10.48550/arXiv.1905.02773
- Cao et al. (2024) Cao, Z., Aharonian, F., An, Q., et al. 2024, ApJS, 271, 25, doi: 10.3847/1538-4365/acfd29
- Cao et al. (2024b) Cao, Z., Aharonian, F., Axikegu, et al. 2024b, The Astrophysical Journal Letters, 971, L45, doi: 10.3847/2041-8213/ad5e6d
- Domínguez et al. (2011) Domínguez, A., Primack, J. R., Rosario, D. J., et al. 2011, MNRAS, 410, 2556, doi: 10.1111/j.1365-2966.2010.17631.x
- EHT MWL Science Working Group et al. (2021) EHT MWL Science Working Group, Algaba, J. C., Anczarski, J., et al. 2021, ApJ, 911, L11, doi: 10.3847/2041-8213/abef71
- Event Horizon Telescope Collaboration et al. (2019) Event Horizon Telescope Collaboration, Akiyama, K., Alberdi, A., et al. 2019, ApJ, 875, L6, doi: 10.3847/2041-8213/ab1141
- Fermi Science Support Development Team (2019) Fermi Science Support Development Team. 2019, Fermitools: Fermi Science Tools, Astrophysics Source Code Library, record ascl:1905.011. http://ascl.net/1905.011
- Fleysher et al. (2004) Fleysher, R., Fleysher, L., Nemethy, P., Mincer, A. I., & Haines, T. J. 2004, The Astrophysical Journal, 603, 355, doi: 10.1086/381384
- Fraija & Marinelli (2016) Fraija, N., & Marinelli, A. 2016, ApJ, 830, 81, doi: 10.3847/0004-637X/830/2/81
- Franceschini et al. (2008) Franceschini, A., Rodighiero, G., & Vaccari, M. 2008, A&A, 487, 837, doi: 10.1051/0004-6361:200809691
- Georganopoulos et al. (2005) Georganopoulos, M., Perlman, E. S., & Kazanas, D. 2005, ApJ, 634, L33, doi: 10.1086/498714
- Giannios et al. (2009) Giannios, D., Uzdensky, D. A., & Begelman, M. C. 2009, MNRAS, 395, L29, doi: 10.1111/j.1745-3933.2009.00635.x
- Giannios et al. (2010) —. 2010, MNRAS, 402, 1649, doi: 10.1111/j.1365-2966.2009.16045.x
- H. E. S. S. Collaboration et al. (2023) H. E. S. S. Collaboration, Aharonian, F., Ait Benkhali, F., et al. 2023, A&A, 675, A138, doi: 10.1051/0004-6361/202346056
- H. E. S. S. Collaboration et al. (2024) —. 2024, A&A, 685, A96, doi: 10.1051/0004-6361/202348913
- Hakobyan et al. (2023) Hakobyan, H., Ripperda, B., & Philippov, A. A. 2023, ApJ, 943, L29, doi: 10.3847/2041-8213/acb264
- Harris et al. (2006) Harris, D. E., Cheung, C. C., Biretta, J. A., et al. 2006, ApJ, 640, 211, doi: 10.1086/500081
- Kharb & Shastri (2004) Kharb, P., & Shastri, P. 2004, A&A, 425, 825, doi: 10.1051/0004-6361:200400023
- Kneiske & Dole (2010) Kneiske, T. M., & Dole, H. 2010, A&A, 515, A19, doi: 10.1051/0004-6361/200912000
- Levinson & Rieger (2011) Levinson, A., & Rieger, F. 2011, ApJ, 730, 123, doi: 10.1088/0004-637X/730/2/123
- Neronov & Aharonian (2007) Neronov, A., & Aharonian, F. A. 2007, ApJ, 671, 85, doi: 10.1086/522199
- Owen et al. (2000) Owen, F. N., Eilek, J. A., & Kassim, N. E. 2000, ApJ, 543, 611, doi: 10.1086/317151
- Perlman et al. (2001) Perlman, E. S., Biretta, J. A., Sparks, W. B., Macchetto, F. D., & Leahy, J. P. 2001, ApJ, 551, 206, doi: 10.1086/320052
- Reimer et al. (2004) Reimer, A., Protheroe, R. J., & Donea, A. C. 2004, A&A, 419, 89, doi: 10.1051/0004-6361:20034231
- Rieger & Aharonian (2012) Rieger, F. M., & Aharonian, F. 2012, Modern Physics Letters A, 27, 1230030, doi: 10.1142/S0217732312300303
- Rieger & Aharonian (2008) Rieger, F. M., & Aharonian, F. A. 2008, A&A, 479, L5, doi: 10.1051/0004-6361:20078706
- Ripperda et al. (2020) Ripperda, B., Bacchini, F., & Philippov, A. A. 2020, ApJ, 900, 100, doi: 10.3847/1538-4357/ababab
- Scargle et al. (2013) Scargle, J. D., Norris, J. P., Jackson, B., & Chiang, J. 2013, ApJ, 764, 167, doi: 10.1088/0004-637X/764/2/167
- Stawarz et al. (2006) Stawarz, Ł., Aharonian, F., Kataoka, J., et al. 2006, MNRAS, 370, 981, doi: 10.1111/j.1365-2966.2006.10525.x
- Stawarz et al. (2005) Stawarz, Ł., Siemiginowska, A., Ostrowski, M., & Sikora, M. 2005, ApJ, 626, 120, doi: 10.1086/430087
- Tavecchio & Ghisellini (2008) Tavecchio, F., & Ghisellini, G. 2008, MNRAS, 385, L98, doi: 10.1111/j.1745-3933.2008.00441.x
- The Event Horizon Telescope-Multi-wavelength science working group et al. (2024) The Event Horizon Telescope-Multi-wavelength science working group, The Event Horizon Telescope Collaboration, The Fermi Large Area Telescope Collaboration, et al. 2024, arXiv e-prints, arXiv:2404.17623, doi: 10.48550/arXiv.2404.17623
- Whysong & Antonucci (2004) Whysong, D., & Antonucci, R. 2004, ApJ, 602, 116, doi: 10.1086/380828
- Wood et al. (2017) Wood, M., Caputo, R., Charles, E., et al. 2017, in International Cosmic Ray Conference, Vol. 301, 35th International Cosmic Ray Conference (ICRC2017), 824, doi: 10.22323/1.301.0824
| EBL model | TS | ||||
|---|---|---|---|---|---|
| () | (TeV) | ||||
| dominguez-upper | 18.4 | 87.5 | 3.47/4 | ||
| franceschini | 19.4 | 87.4 | 3.00/4 | ||
| kneiske | 20.6 | 84.4 | 3.97/4 |
| Time interval | State | TS | Flux | ||
|---|---|---|---|---|---|
| (MJD) | () | () | |||
| 59281–60385 | Full-time | 87.4 | (3.270.50) | 2.370.14 | (3.170.49) |
| 59607–59615 | Flare | 40.1 | (3.560.67) | 2.570.23 | (3.780.71) |
| 59281–59606 | Low | 76.0 | (2.910.53) | 2.310.17 | (2.760.50) |
| 59616–60385 |
| Time interval | TS | Flux | ||
|---|---|---|---|---|
| (MJD) | () | () | ||
| 54682.65–60385 | 2434.31 | (1.670.05) | 2.050.03 | (1.790.10) |
| 59281–60385 | 505.29 | (1.780.13) | 2.060.05 | (1.930.22) |
| 59607–59615 | 9.50 | (2.751.48) | 2.400.35 | (6.803.26) |
Appendix A LHAASO Data Reduction
The dataset utilized in this analysis was mainly sourced from the WCDA at LHAASO. For this study, we restricted our analysis to the events with a zenith angle of less than 50 degrees to ensure high-quality reconstruction data. The selected events are subsequently categorized into seven groups based on the effective number of triggered PMT units, denoted as , with ranges [60-100), [100-200), [200-300), [300-500), [500-700), [700-1000) and [1000, 2000]. Additionally, a gamma/proton separation parameter is employed to effectively identify gamma-like events. cut of seven segments are 1.02, 0.90, 0.88, 0.88, 0.84, 0.84 and 0.84. Ultimately, the effective live-time for observations of M87 was recorded as 1026 days, with an approximate count of gamma-like events. The event maps are created as histograms of the arrival direction of the reconstructed events, after converting the arrival direction of the shower from local coordinates to equatorial coordinates. The background maps are computed using a direct integration method (Fleysher et al., 2004). For this analysis, a sliding time window of 10 hours was used to estimate the detector acceptance, with an integration time set to 4 hour to estimate the relative back-ground. Events within the region of the Galactic plane and LHAASO 1st catalog gamma-ray sources (with a spatial angle less than 5 degrees) were excluded from the background estimation. The excess map is then obtained by subtracting the background map from the event data map.
For the spectral fitting, we assume a simple power-law function for the intrinsic spectrum. The photon attenuation derived from the three EBL models (e.g., the kneiske model (Kneiske & Dole, 2010), franceschini model (Franceschini et al., 2008), and dominguez-upper model (Domínguez et al., 2011)) as a function of energy at the distance z = 0.0042 is applied to correct the detector effective area, via re-weighting every simulated event with the survival probability from the EBL attenuation, where is the optical depth due to the EBL absorption at the photon energy . The results are summarized in Table 1, indicating that the impact of different EBL models on the maximum energy is not significant.
Appendix B Fermi-LAT Data Reduction
The Pass 8 data of the M87 region, covering 15.5 yr (MJD 54683–60385) are used for our analysis. We select the region of interest (ROI) centered at the radio position of M87 with a radius of 15. The publicly available software Fermipy (version v1.1)(Wood et al., 2017) and Fermitools (version 2.2.0, Fermi Science Support Development Team, 2019) are used to perform the data analysis with the binned maximum-likelihood method. The -ray events in the energy range of 0.1–100 GeV are selected with a standard data quality selection criteria of “(DATA_QUAL>0)&&(LAT_CONFIG==1)”. We binned the data with a pixel size of and twelve energy bins per decade. To reduce the -ray contamination from the Earth limb, a maximum zenith angle of 90 is set. The event class (“evclass=128”), and corresponding instrument response functions (IRFs) P8R3_SOURCE_V3 is used in our analysis. For background model, we include the diffuse Galactic interstellar emission (IEM, ), isotropic emission (“” ) and all sources listed in the fourth Fermi-LAT catalog (Abdollahi et al., 2020). The parameters of all the sources within of the center, IEM and isotropic emission are set free. The spectrum of M87 is modelled with a power-law function i.e., , where is the photon index. The light curves with different intervals are obtained by freeing the normalisation of M87 and fixing all the other spectral parameters to the best-fit values obtained from 15.5-yr analysis.
| SED model | ( | ||||
|---|---|---|---|---|---|
| () | (TeV) | ||||
| PL | – | 19.4 | 0 | ||
| LP | 19.4 | -0.12 | |||
| PLEC | 19.1 | 0.07 |