Orbits and vertical height distribution of 4006 open clusters in the Galactic disk using Gaia DR3
Abstract
Open clusters (OCs) in the Galaxy are excellent probes for tracing the structure and evolution of the Galactic disk. We present an updated catalog of parameters for 1145 OCs, estimated using the Gaia DR3 data earlier listed in Cantat-Gaudin et al. (2020). This sample is complemented by 3677 OCs from the catalog by Hunt & Reffert (2023). Using the Galaxy potential and the space velocities, orbits of 4006 OCs were computed. We provide a catalog with orbital parameters such as eccentricity, perigalactic and apogalactic distance, and the maximum vertical height traced by OCs from the Galactic disk. The OCs were found to be distributed between 5-16 kpc from the Galactic center, with older OCs showing a radially extended distribution. The low number of old OCs in the inner Solar circle region likely suggests their destruction in this area. We derive a quantitative expression for the dependency of the maximum vertical height () OCs can reach with the cluster’s age and Galactocentric radius for the first time. The young and the intermediate age OCs show similar values of till 9 kpc, with the latter group having higher values beyond. OCs older than 1 Gyr show larger values of at all Galactocentric radii and significantly larger values beyond 9 kpc. Higher values of are found in the third Galactic quadrant, suggesting the link between the higher values and the Galactic warp. This sample shows that young OCs are also involved in the diagonal ridge formation in the solar neighborhood.
1 Introduction
Our Galaxy, the Milky Way, has three easily distinguishable major components: bulge, halo, and disk. Again, the Galaxy disk is made up of thin and thick disks. Due to our position in the disk of the Galaxy, it isn’t easy to study the a global picture of the Galaxy, but the precise observations of position and the motion of the stars in the sky by the Gaia mission is transforming our understanding of the Galaxy (Gaia Collaboration et al., 2023). For example, the studies by Helmi et al. (2018); Belokurov et al. (2018); Malhan et al. (2018); Myeong et al. (2019); Helmi (2020); Sestito et al. (2020); Re Fiorentin et al. (2021) showed that the different components of the Galaxy, such as thin disk, thick disk, bulge, and halo are interlinked formation phases of a system that were previously assumed to be distinct.
The well-established phenomenon of star formation states that stars form in groups due to the gravitational collapse of progenitor molecular cloud (Lada & Lada, 2003), resulting in star clusters. Open star clusters (OCs) in the Galaxy are found in a range of age and mass and distributed at various in the Galactic disk, including thin and thick disks. Determination of the fundamental properties like age, distance, and proper motion is more precise for star clusters than for individual stars in the disk. Which made them wonderful laboratories for studying stellar dynamics (Friel, 1995) and the structure of the Galactic disk.
Multiple studies have compiled catalogs of OC parameters (age, distance, and extinction) by combining parallaxes with photometric data from Gaia data releases. Cantat-Gaudin et al. (2018a) obtained mean astrometric parameters (proper motions and parallaxes) for 128 OCs closer than about 2 kpc from the Sun by applying an unsupervised membership assignment procedure to select high probability cluster members from the full astrometric dataset from the first release of Gaia data (Gaia Collaboration et al., 2016) and Tycho-2 (Lindegren et al., 2016). Cantat-Gaudin et al. (2018b), in their study, obtained a list of 1229 OCs from Gaia data alone and derived their mean parameters (particularly distances) by applying an unsupervised membership assignment code (UPMASK) trained on data from thousands of clusters recorded previously in the literature. Bossini et al. (2019) applied an automated Bayesian tool, BASE-9, to fit stellar isochrones on the observed , , magnitudes of the high probability member stars (solely from Gaia). Selecting only the low-reddening objects and discarding the very young OCs (for which isochrone fits do not give the best age estimates), they primarily determined the age of 269 OCs.
Dias et al. (2021) used published membership probability of stars derived from Gaia DR2 data, applied isochrone fitting to Gaia data, and estimated astrophysical parameters for 1743 OCs. Furthermore, they published mean radial velocity values for 831 OCs, of which 198 were new. Hao et al. (2021) considered the list of OC members published from the pre-Gaia era (hence not as precise measurements as from Gaia) and compiled a heterogenous catalog of 3794 OCs. The largest, most homogenous, and most accurate catalog of OCs, compiled solely from Gaia data DR2, was published by Cantat-Gaudin et al. (2020). They used an artificial neural network trained over objects in the literature from the pre-Gaia era and estimated the distance and age of 2017 OCs. Of these 2017 clusters, only 1867 clusters with reliable parameters were used. The remaining 150 OCs were found to either have blurred CMDs or have very few member stars, which were insufficient to estimate their age and distance. Furthermore, these 1867 OCs only contain stars with a membership probability greater than 70 %. With the availability of Gaia DR3, it is crucial to update the parameters of this sample of 1867 OCs.
Recently, Hunt & Reffert (2023) (hereafter, HR23) presented an updated catalog of OCs in the Milky Way using the data from Gaia DR3. They used the Hierarchical Density-Based Spatial Clustering of Applications with Noise (HDBSCAN) algorithm and recovered 7167 star clusters in total. These clusters are significant probes to study various aspects, including star formation history, stellar evolution, properties of the Galaxy, and its kinematics,
In this study, we perform the parameter update of OCs in Cantat-Gaudin et al. (2020), then combine this with OCs of HR23 to derive the orbits of the OCs in the Galaxy. Based on the orbital estimations, some structural properties of the Galactic disk, as delineated by the OCs, are presented as a function of age and Galactic radius. The data used for this study are given in section 2. The method adopted to derive the orbits is discussed in section 3 and its results are illustrated in section 4. We discussed our findings in the section 5 and summarised the results in 6.
2 Data and Sample clusters
2.1 Data
The present study uses the kinematical data from the third installment of the dataset published by the European Space Agency’s Gaia mission. Gaia is an astronomical survey designed to create a precise 3D Milky Way galaxy map, launched in December 2013 (Gaia Collaboration et al., 2016).
Gaia’s third data release (DR3) (Gaia Collaboration et al., 2023) has provided an unprecedented five-parameter astrometric solution - position on the sky (), parallax, and proper motion, and broadband photometry in , , & passbands, for around 1.3 billion sources, with a limiting magnitude of G 21 and a bright limit of G 3. Parallax uncertainties range up to 0.7 mas towards the fainter end. Gaia DR3 has made significant leaps by providing the mean line of sight velocities for more than 33 million objects.
2.2 Catalogs of open clusters in the Galaxy
We aim to use data from Gaia DR3 to update the OC parameters in the catalog by Cantat-Gaudin et al. (2020) based on Gaia DR2. Since the same physical objects have different source-id in different data releases from Gaia, direct one-to-one correspondence between numerical identifiers from Gaia DR2 to Gaia DR3 is not guaranteed. However, Gaia provides a pre-computed cross-match table containing sources between Gaia DR2 and Gaia DR3. First, wherever possible, the sources included in Cantat-Gaudin et al. (2020) are corrected for their linear proper motion from Gaia DR2 to Gaia DR3. Then, a cone search is performed for all objects, and the objects within the neighborhood of a 2” radius are selected as the best suitable cross-match pairs. The angular distance and magnitude difference are simultaneously calculated for every pair.
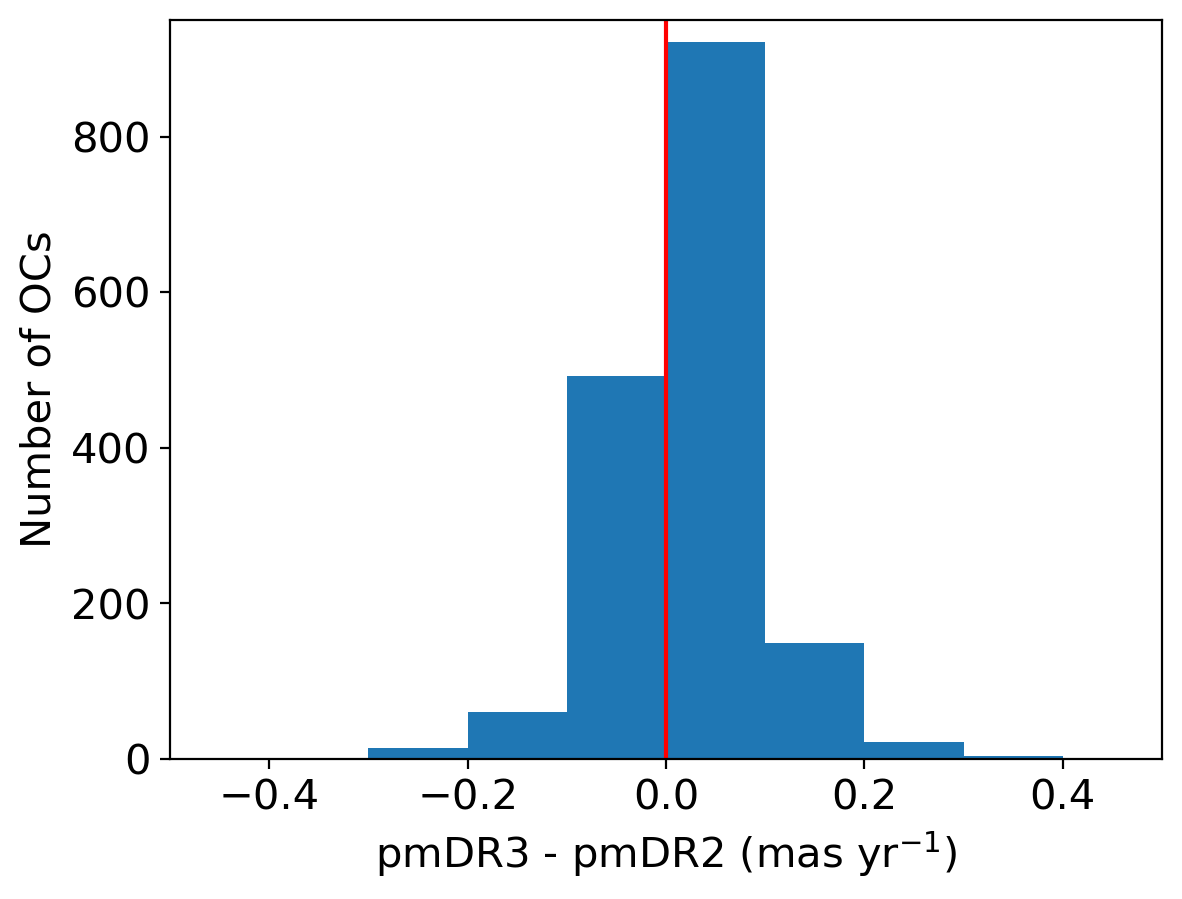
A more accurate proper motion propagation was required from Gaia DR2 to Gaia DR3. Still, the cone search with the same radius for all the stars gave comprehensive results in Gaia DR3 against Gaia DR2, even though there is a slight average epoch difference of half a year between the two catalogs. We note that only a small sample (less than 0.2%) did not find their counterparts in Gaia DR3. Fig. 1 shows the difference of mean proper motions of OCs calculated in the present analysis using Gaia DR3 and from Cantat-Gaudin et al. (2020), which was calculated using the data from Gaia DR2. This plot shows a negligible (yet positive) shift in the proper motions of objects from Gaia DR2 to Gaia DR3 for OCs.
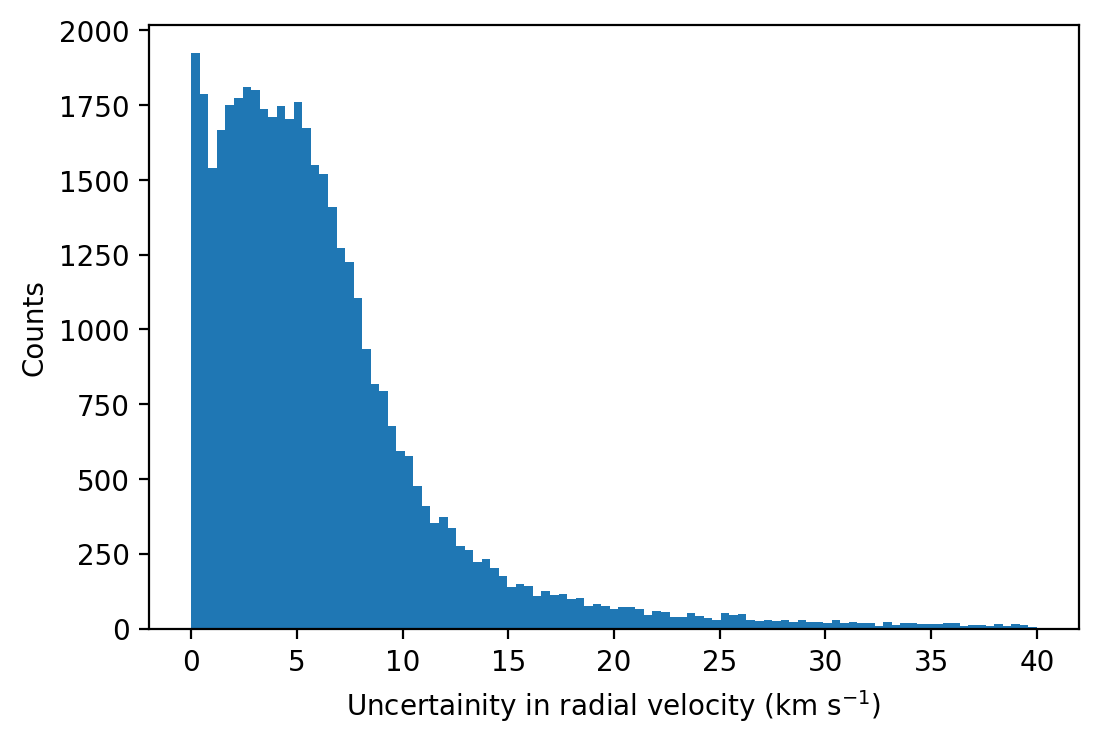
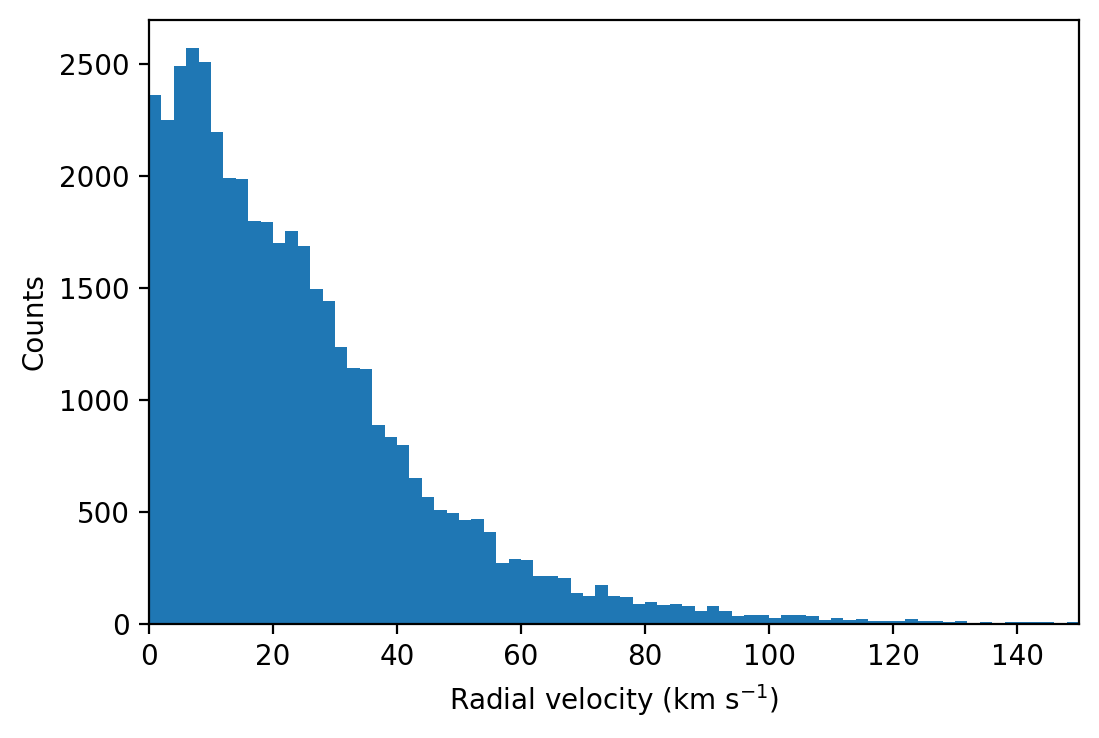
We build an ADQL query to extract the nearest Gaia DR3 neighbor for each Gaia DR2 source. It was noticed that stars within 1.5 kpc from the Sun had multiple matches in DR3 (this could be due to the higher number density in this region of the Galaxy). We chose only the star with the least angular distance as the cross-match for such cases. After updating all the cluster members for their corresponding counterparts in Gaia DR3, parameters for 227,384 stars were updated; 43,101 stars (i.e., of the total sample) contained radial velocity measurements in Gaia DR3. These 43,101 stars belonged to 1,671 OCs. Fig. 2 shows the histogram of radial velocity uncertainties in these 43,101 stars. The maximum radial velocity uncertainty recorded for this sample was 40 kms-1, and of stars had uncertainty less than 15 kms-1. 380 stars out of these 43,101 reported had a radial velocity uncertainty more significant than 20 kms-1. They had significantly higher effective temperatures (median 8500 K), whereas the rest of the sample with reduced uncertainties had comparatively lower effective temperatures (median 5500 K).
From the sample of 43,101 stars belonging to 1,671 OCs, 427 () stars had radial velocity more than 102 kms-1 and are 3 outliers of the sample (refer Fig. 2) distributed in 241 OCs. As these 241 OCs did not homogenously contain higher-velocity stars, the high-velocity stars were not considered for estimating the mean Radial velocity of the OC. The cluster radial velocity is calculated by taking a median of the radial velocities of cluster members. Since the improvement in parallax and magnitude from DR2 to DR3 was not substantial, we adopted the age and distance estimated by Cantat-Gaudin et al. (2020) to our sample. As a result, we have a catalog of OCs and their kinematical and physical parameters. We chose only OCs with at least 10 members with a minimum of 3 stars with recorded radial velocity values. Thus, we were left with a sample of 1145 OCs. A short table for this catalog is given in table LABEL:tab:catalog. The whole table will be uploaded electronically. In this paper, this catalog will be termed as ”updated or current catalog”.
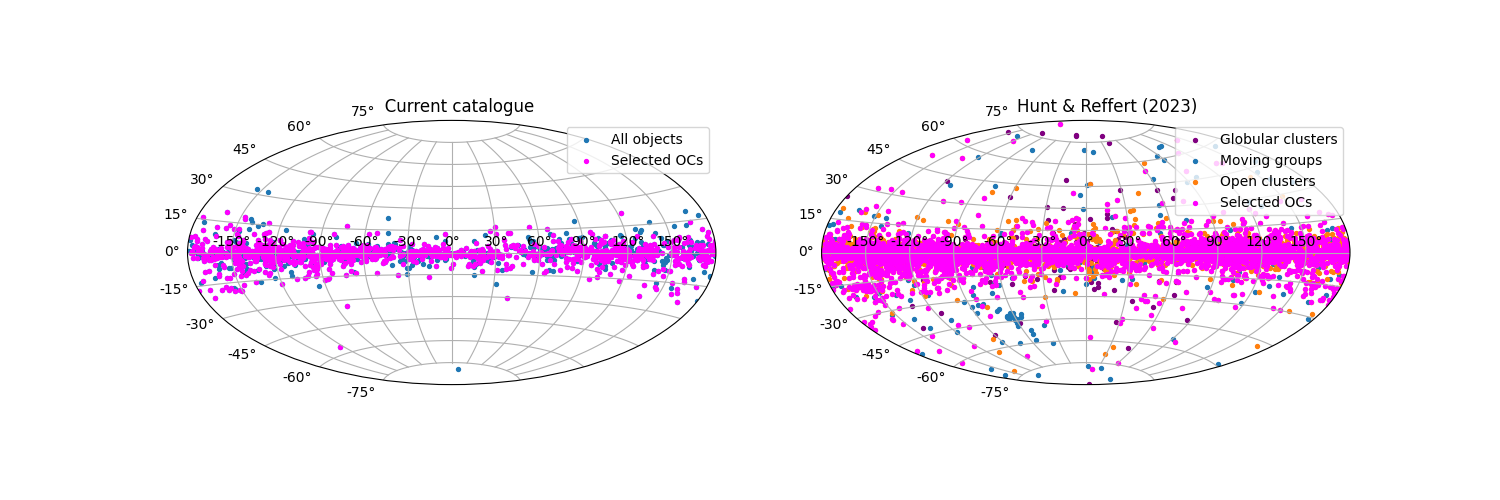
The comprehensive HR23 catalog has 7167 clusters. Among these, 349 objects are flagged as globular clusters or moving groups. We further selected objects with a five-parameter astrometric solution (position, parallax, and proper motion), and the mean radial velocity was calculated using at least three stars. After applying these conditions, we were left with a total of 3708 OCs. We used the distance and age of OCs flagged with a confidence level of 85 in Hunt & Reffert (2023). A short table of HR23, which is similar to LABEL:tab:catalog, is tabulated in LABEL:tab:catalog_hunt. The Galactic distributions of the OCs in both catalogs are shown in Fig. 3. This figure shows that the OCs in the updated catalog are distributed mainly at lower latitudes. In comparison, OCs in HR23 are also present at higher latitudes apart from the dense population near the plane. The OCs selected from both catalogs are generally distributed between 15 to 15 latitude. We found a total of 816 common OCs between the two catalogs and 329 OCs present in current catalog are missing from HR23.
| Name | Distance | log(age) | RA | DEC | pmRA | pmDEC | RV |
|---|---|---|---|---|---|---|---|
| (parsec) | (degree) | (degree) | (mas yr-1) | (mas yr-1) | (kms-1) | ||
| Melotte 22 | 128 | 7.89 | 56.6041 | 24.1127 | 19.88 | -45.45 | 5.48 |
| UBC 19 | 416 | 6.84 | 56.3359 | 29.8666 | 2.59 | -5.21 | 17.15 |
| NGC 1333 | 299 | 7.06 | 52.3280 | 31.3175 | 7.06 | -9.82 | 12.50 |
| UBC 199 | 1233 | 9.06 | 67.4256 | 25.4494 | 2.87 | -1.85 | -13.44 |
| Czernik 19 | 2586 | 8.31 | 74.1522 | 28.7838 | 0.80 | -2.11 | -1.94 |
| Skiff J0507+30.8 | 6088 | 9.39 | 76.7312 | 30.8600 | 0.74 | -0.74 | -6.44 |
| FSR 0771 | 1529 | 8.45 | 75.8975 | 32.1388 | 1.46 | -4.23 | -13.24 |
| UBC 31 | 341 | 7.42 | 61.3404 | 32.7340 | 3.75 | -5.41 | 18.19 |
| Czernik 18 | 1325 | 8.72 | 66.9343 | 30.9196 | 1.64 | -3.13 | -13.18 |
| FSR 0728 | 1876 | 8.21 | 67.5671 | 38.5244 | 1.80 | -2.30 | -9.77 |
| COIN-Gaia 11 | 669 | 8.9 | 68.1154 | 39.5161 | 3.46 | -5.69 | -6.24 |
| COIN-Gaia 10 | 1018 | 7.74 | 68.4593 | 40.8154 | 1.89 | -3.45 | 0.84 |
| COIN-Gaia 20 | 1044 | 7.93 | 78.6551 | 31.6698 | 0.50 | -1.51 | -0.04 |
| Berkeley 69 | 3410 | 8.9 | 81.1115 | 32.6088 | 0.76 | -1.94 | 39.74 |
| Name | Distance | log(age) | RA | DEC | pmRA | pmDEC | RV |
|---|---|---|---|---|---|---|---|
| (parsec) | (degree) | (degree) | (mas yr-1) | (mas yr-1) | (kms-1) | ||
| Melotte 22 | 134.859 | 8.29 | 56.6798 | 24.1085 | 19.96 | -45.46 | 05.34 |
| UBC 19 | 393.509 | 6.59 | 56.3306 | 29.7416 | 02.67 | -05.24 | 18.20 |
| NGC 1333 | 291.099 | 6.95 | 52.3282 | 31.3582 | 06.84 | -09.71 | 21.05 |
| UBC 199 | 1143.070 | 8.95 | 67.4366 | 25.4189 | 02.91 | -01.84 | -11.58 |
| FSR 0771 | 1554.363 | 8.49 | 75.9211 | 32.1453 | 01.50 | -04.26 | -06.51 |
| UBC 31 | 368.515 | 7.05 | 60.5210 | 32.1781 | 03.63 | -05.26 | 24.98 |
| FSR 0728 | 1737.361 | 8.76 | 67.4620 | 38.4982 | 01.92 | -02.27 | 24.89 |
| COIN-Gaia 11 | 643.450 | 8.72 | 68.1497 | 39.5332 | 03.44 | -05.75 | -04.94 |
| COIN-Gaia 10 | 1010.894 | 8.61 | 68.4584 | 40.4996 | 01.97 | -03.45 | 08.09 |
| COIN-Gaia 20 | 1031.823 | 8.06 | 78.6360 | 31.7201 | 00.54 | -01.50 | -00.45 |
| Berkeley 69 | 3212.265 | 8.81 | 81.0909 | 32.6082 | 00.74 | -01.95 | 31.68 |
| Berkeley 70 | 4049.934 | 9.16 | 81.4544 | 41.9501 | 00.83 | -01.87 | -10.82 |
| Berkeley 71 | 3561.109 | 8.78 | 85.2418 | 32.2727 | 00.63 | -01.66 | -08.45 |
| Berkeley 76 | 5325.960 | 9.19 | 106.6595 | -11.7236 | -00.58 | 01.42 | 108.11 |
| Berkeley 78 | 4419.755 | 9.55 | 110.9088 | 05.3713 | -00.06 | -01.20 | 71.54 |
3 Orbits of open clusters
We used the updated/current catalog and OCs selected from HR23 to study the distribution and motion of OCs in the Galactic disk. For this, we first transformed the heliocentric position and velocity components of all the OCs into their Galactocentric counterparts and then traced their trajectory in the Galaxy. For this purpose, we used the Python-based module galpy (Bovy, 2015). It uses Astropy units and performs coordinates transformation internally. galpy contains a general framework depicting various Galactic potentials that can be used as isolated or a mixture of multiple potentials. We used the model MWPotential2014 to estimate the potentials of the Galaxy best. This model is a superposition of power-law spherical potential with an exponential cutoff (Cardone et al., 2005) representing the Galactic Bulge, Miyamoto Nagai potential (Miyamoto & Nagai, 1975) representing the Galactic Disk, and the NFW potential (Navarro et al., 1997) representing the Galactic Halo. The parameters of these three potentials have been obtained after fitting dynamical data from Holmberg & Flynn (2000), Xue et al. (2008), Bovy & Tremaine (2012) and Zhang et al. (2013) to best portray the realistic description of the Milky Way on small and large scales. For this analysis, we assumed the location of the Sun at a distance of 8.178 kpc from the Galactic center with a velocity of 220 kms-1 in the direction of Galactic rotation.
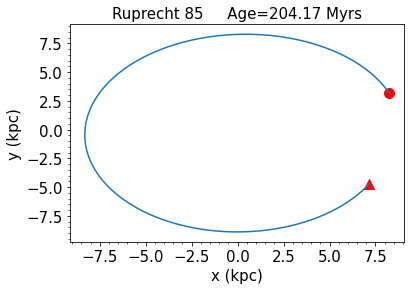
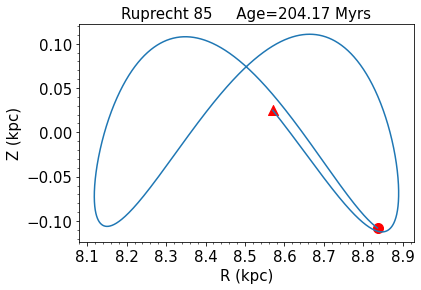
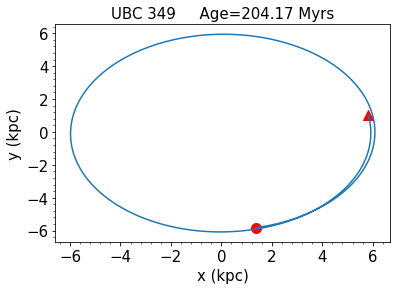
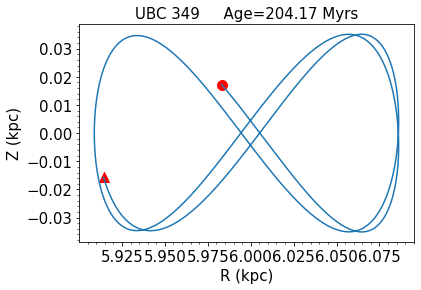
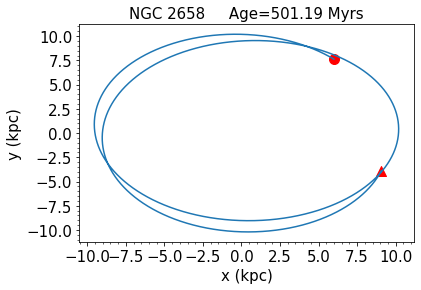
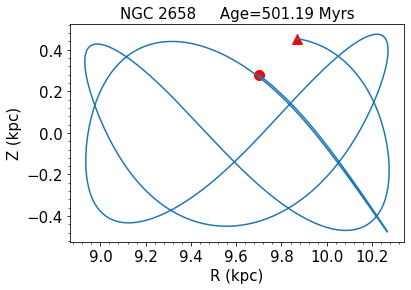
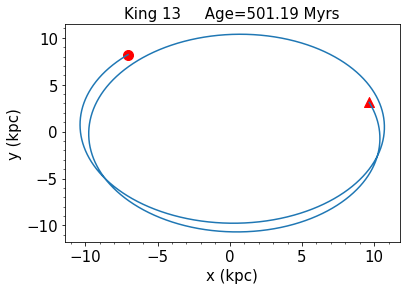
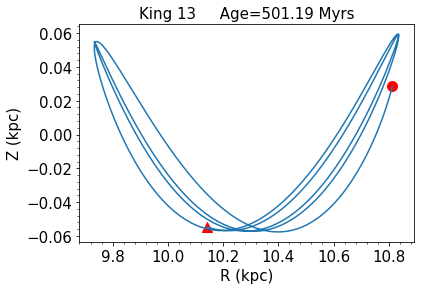
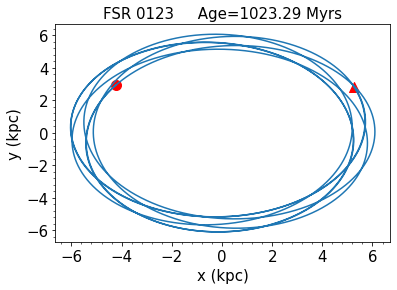
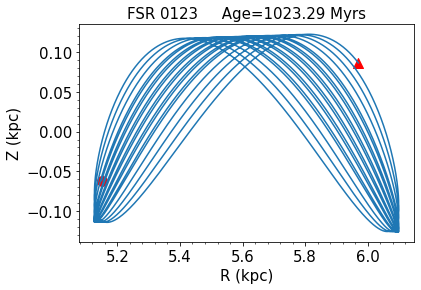
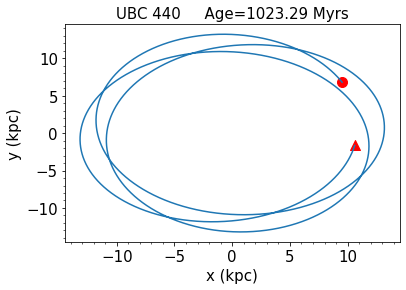
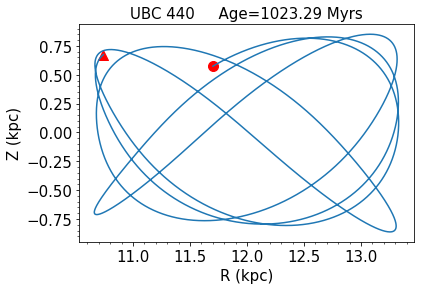
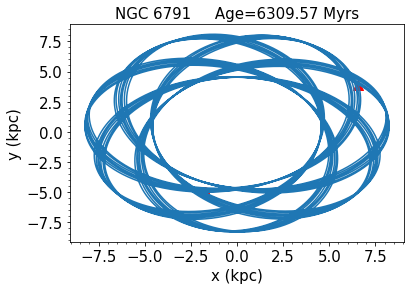
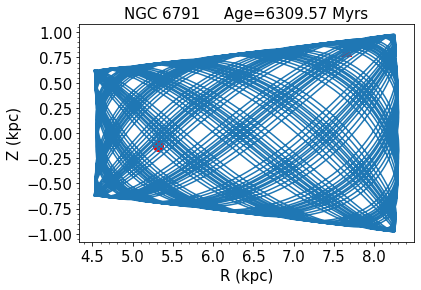
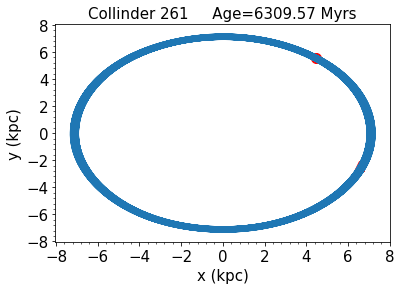
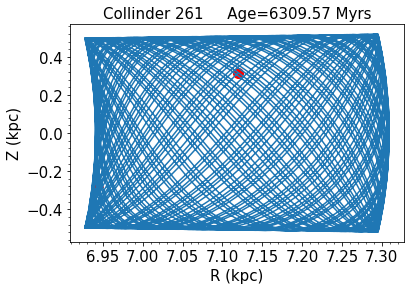
We back-integrated the cluster orbits for our sample using the parameters determined above to a period equal to the respective cluster age at a time step of every 0.1 Myr. The orbits of eight OCs in 200 Myr - 6 Gyr age range are displayed in Fig. 4. The birth and present-day positions of these OCs are denoted by red dot and triangle, respectively. The Galactocentric position, velocity components, and the orbital parameters of 15 OCs mentioned in table LABEL:tab:catalog, from the updated catalog, are listed in LABEL:tab:orbit. The complete table for 1145 OCs will be provided in electronic form.
We also calculated the orbits of 3708 OCs selected from HR23 using the same method, and a short table of the output parameters is tabulated in 4 (a complete table will be made available in the online form). We found that cluster Palomar 12 is flagged as an open cluster in HR23, which is a globular cluster and traces a maximum height from the Galactic mid-plane () 30 kpc. We excluded Palomar 12 and 30 OCs having radial distance from the Galactic center () 5 kpc to avoid the inclusion of False OCs. The remaining 3677 OCs are used for further analysis. The common OCs between the final set catalogs are same as earlier as there are no OCs present in current catalog having kpc and kpc so the final catalog of orbital parameters include a total of 4006 OCs. As there are differences in the parameter values, the two catalogs are not merged. We proceed with analysing both catalogs and comparing the results, as given below.
| Name | e | X | Y | Z | R | ||||||||||
|---|---|---|---|---|---|---|---|---|---|---|---|---|---|---|---|
| (kpc) | (kpc) | (kpc) | (kms-1 kpc) | (kms-1) | (kms-1) | (kms-1) | (kpc) | (kpc) | (kpc) | (kpc) | (kpc) | (kpc) | (kpc) | ||
| Melotte 22 | 0.07 | 8.46 | 7.35 | 0.09 | 1735.96 | -4.56 | 205.57 | -6.23 | 8.44 | 0.03 | -0.03 | -4.09 | -6.11 | -0.06 | 8.44 |
| UBC 19 | 0.00 | 8.71 | 8.65 | 0.12 | 1972.17 | 6.12 | 226.67 | -2.66 | 8.70 | 0.12 | -0.12 | 8.52 | -1.48 | -0.09 | 8.71 |
| NGC 1333 | 0.00 | 8.59 | 8.52 | 0.08 | 1895.32 | 4.20 | 220.68 | -1.82 | 8.59 | 0.10 | -0.08 | 8.16 | -2.45 | -0.04 | 8.59 |
| UBC 199 | 0.06 | 9.94 | 8.78 | 0.46 | 2016.91 | -20.07 | 211.80 | 16.10 | 9.51 | 0.15 | -0.31 | -3.35 | -8.15 | 0.11 | 9.51 |
| Czernik 19 | 0.05 | 10.95 | 10.01 | 0.37 | 2238.05 | -11.49 | 205.58 | -0.50 | 10.87 | 0.27 | -0.37 | -4.62 | 9.65 | 0.36 | 10.88 |
| Skiff J0507+30.8 | 0.03 | 14.49 | 13.78 | 0.78 | 2908.56 | -13.77 | 202.04 | 12.31 | 14.35 | 0.66 | -0.59 | 5.87 | 12.55 | -0.66 | 14.37 |
| FSR 0771 | 0.10 | 10.03 | 8.20 | 0.13 | 1969.73 | -20.97 | 199.78 | -1.52 | 9.84 | 0.21 | -0.13 | 8.13 | -2.95 | -0.06 | 9.84 |
| UBC 31 | 0.01 | 8.65 | 8.53 | 0.06 | 1962.86 | 8.25 | 227.09 | 0.65 | 8.65 | 0.09 | -0.06 | 6.48 | -5.56 | 0.01 | 8.65 |
| Czernik 18 | 0.06 | 9.86 | 8.67 | 0.28 | 2005.25 | -20.52 | 208.36 | 4.49 | 9.60 | 0.26 | -0.26 | 8.63 | 0.83 | -0.04 | 9.60 |
| FSR 0728 | 0.05 | 10.13 | 9.10 | 0.23 | 2075.40 | -13.03 | 204.55 | 6.16 | 10.11 | 0.55 | -0.20 | -7.98 | 5.51 | 0.18 | 10.13 |
| COIN-Gaia 11 | 0.05 | 9.02 | 8.25 | 0.07 | 1889.41 | -11.19 | 210.51 | 3.72 | 8.97 | 0.20 | -0.05 | -0.58 | -8.51 | 0.05 | 8.97 |
| COIN-Gaia 10 | 0.01 | 9.30 | 9.08 | 0.07 | 1998.47 | -4.87 | 214.87 | 2.67 | 9.29 | 0.32 | -0.06 | 2.47 | -8.74 | 0.07 | 9.30 |
| COIN-Gaia 20 | 0.04 | 10.23 | 9.37 | 0.10 | 2106.15 | -10.52 | 224.75 | 4.95 | 9.37 | 0.11 | -0.05 | -3.08 | -9.76 | 0.07 | 9.37 |
| Berkeley 69 | 0.14 | 12.93 | 9.76 | 0.09 | 2372.75 | 31.40 | 203.29 | -1.35 | 11.72 | 0.33 | -0.08 | -8.89 | -4.46 | -0.00 | 11.73 |
| Name | e | X | Y | Z | R | ||||||||||
|---|---|---|---|---|---|---|---|---|---|---|---|---|---|---|---|
| (kpc) | (kpc) | (kpc) | (kms-1 kpc) | (kms-1) | (kms-1) | (kms-1) | (kpc) | (kpc) | (kpc) | (kpc) | (kpc) | (kpc) | (kpc) | ||
| Melotte22 | 0.08 | 56.68 | 8.31 | 0.10 | 1692.93 | -4.58 | 203.99 | -6.73 | 8.30 | 0.03 | -0.03 | 6.31 | 4.74 | 0.06 | 8.30 |
| UBC 19 | 0.00 | 56.33 | 8.53 | 0.11 | 1939.13 | 7.02 | 227.38 | -2.74 | 8.53 | 0.11 | -0.11 | 8.46 | -0.80 | -0.10 | 8.53 |
| NGC 1333 | 0.01 | 52.33 | 8.43 | 0.08 | 1890.59 | 11.37 | 224.36 | -4.71 | 8.43 | 0.10 | -0.08 | 8.09 | -1.94 | -0.02 | 8.43 |
| UBC 199 | 0.06 | 67.44 | 9.69 | 0.42 | 1979.80 | -18.53 | 213.28 | 15.45 | 9.27 | 0.14 | -0.29 | -7.06 | -5.40 | 0.34 | 9.27 |
| FSR 0771 | 0.09 | 75.92 | 9.78 | 0.13 | 1943.84 | -14.23 | 199.86 | -2.19 | 9.71 | 0.21 | -0.13 | 1.90 | -8.01 | -0.02 | 9.71 |
| UBC 31 | 0.01 | 60.52 | 8.52 | 0.08 | 1945.10 | 14.52 | 228.50 | -1.60 | 8.52 | 0.10 | -0.08 | 7.97 | -2.51 | -0.04 | 8.52 |
| FSR 0728 | 0.11 | 67.46 | 10.97 | 0.21 | 2113.40 | 19.58 | 216.06 | 3.14 | 9.83 | 0.51 | -0.18 | 10.56 | -2.85 | -0.21 | 9.84 |
| COIN-Gaia 11 | 0.04 | 68.15 | 8.84 | 0.07 | 1861.34 | -10.17 | 211.56 | 3.60 | 8.79 | 0.19 | -0.04 | 2.22 | -8.45 | -0.02 | 8.79 |
| COIN-Gaia 20 | 0.04 | 78.64 | 10.06 | 0.10 | 2068.99 | -10.90 | 224.72 | 5.17 | 9.20 | 0.11 | -0.05 | -8.17 | -5.53 | -0.08 | 9.20 |
| Berkeley 69 | 0.11 | 81.09 | 12.22 | 0.08 | 2318.71 | 23.19 | 204.50 | -1.10 | 11.37 | 0.31 | -0.07 | 11.30 | -4.08 | 0.02 | 11.38 |
| Berkeley 70 | 0.10 | 81.45 | 12.16 | 0.29 | 2338.46 | -12.36 | 192.11 | -0.22 | 12.11 | 0.92 | 0.29 | -12.10 | 0.97 | -0.28 | 12.15 |
| Berkeley 71 | 0.07 | 85.24 | 12.01 | 0.09 | 2378.78 | -17.71 | 202.44 | 1.33 | 11.73 | 0.21 | 0.09 | 3.95 | 10.38 | -0.05 | 11.73 |
| Berkeley 78 | 0.16 | 110.91 | 12.14 | 0.81 | 2174.14 | 39.13 | 175.44 | 7.05 | 11.88 | -2.30 | 0.77 | -2.75 | 8.55 | 0.61 | 12.10 |
4 Results
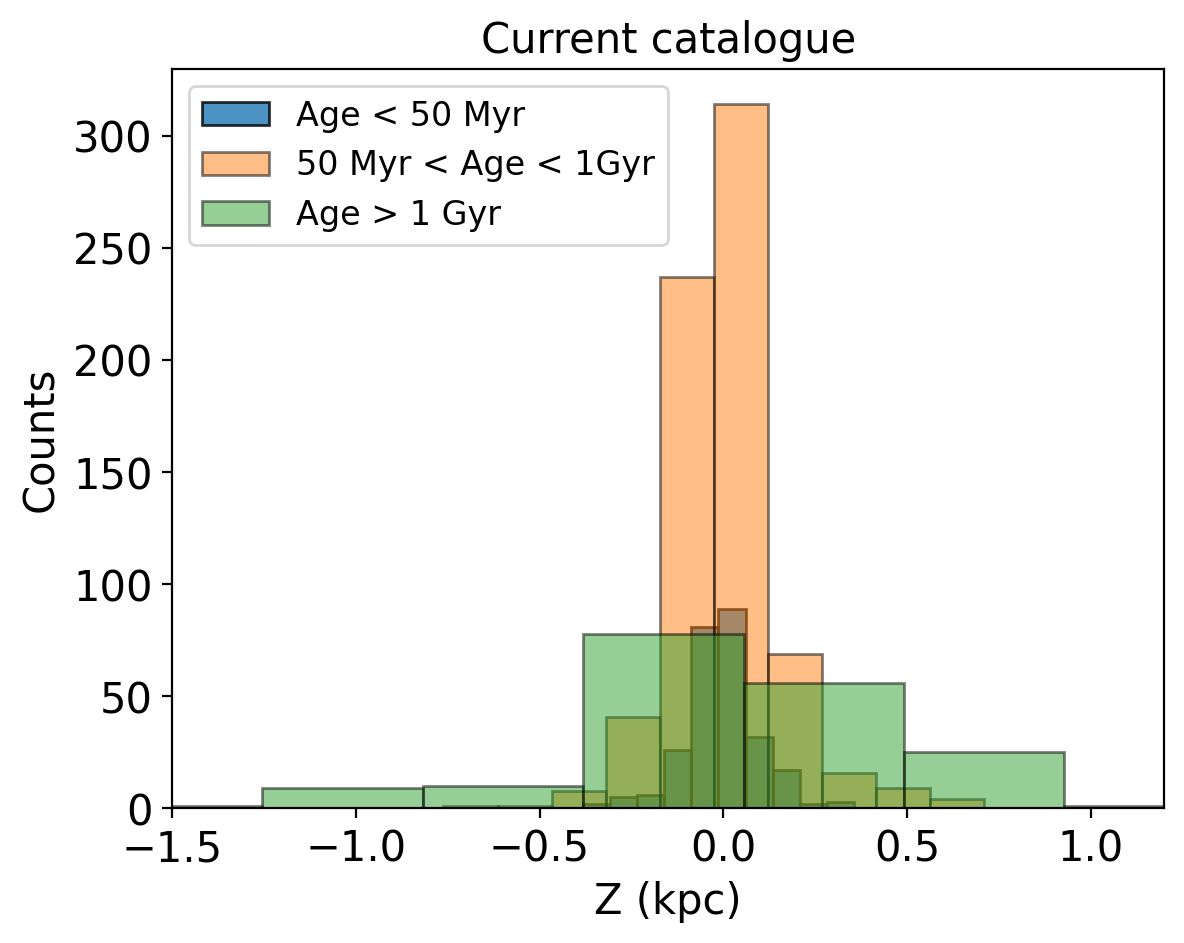
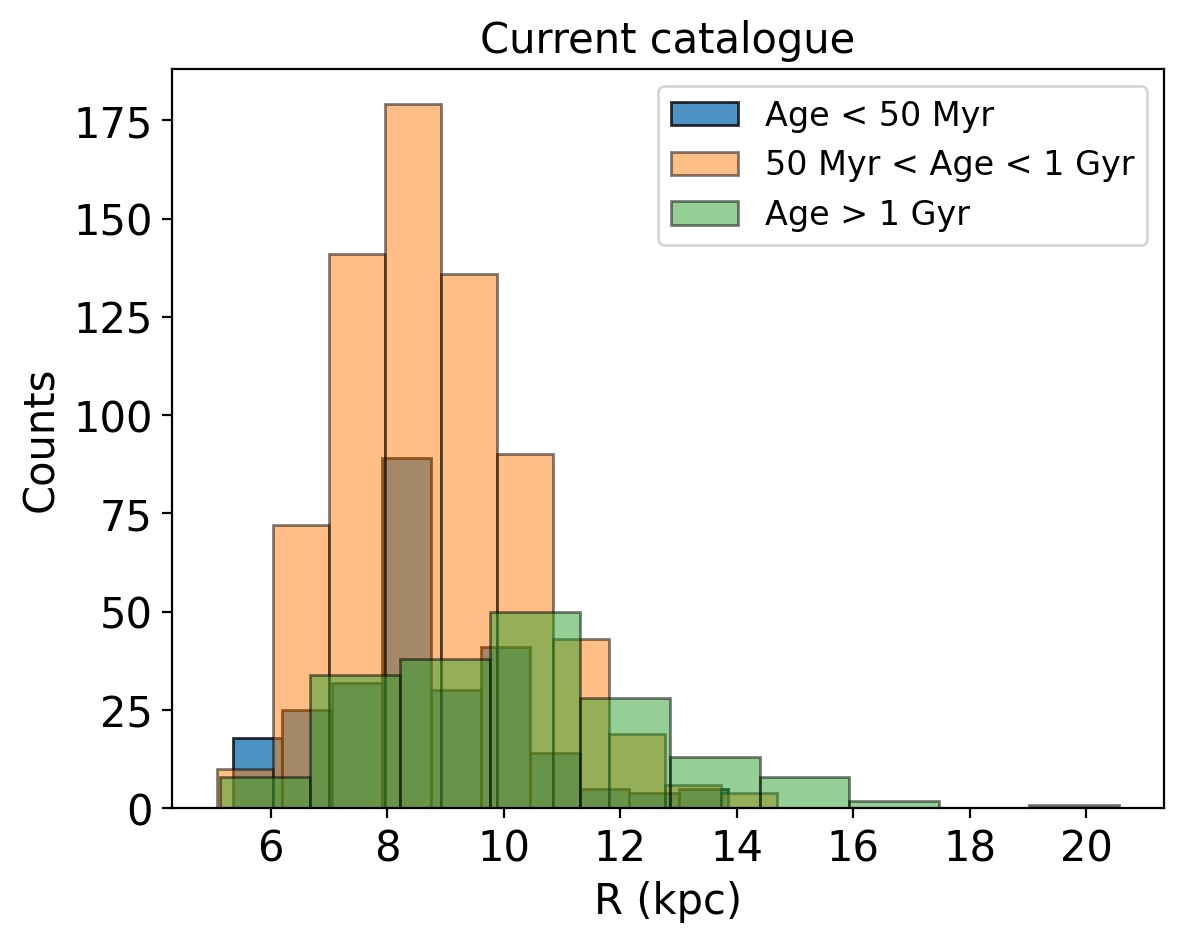
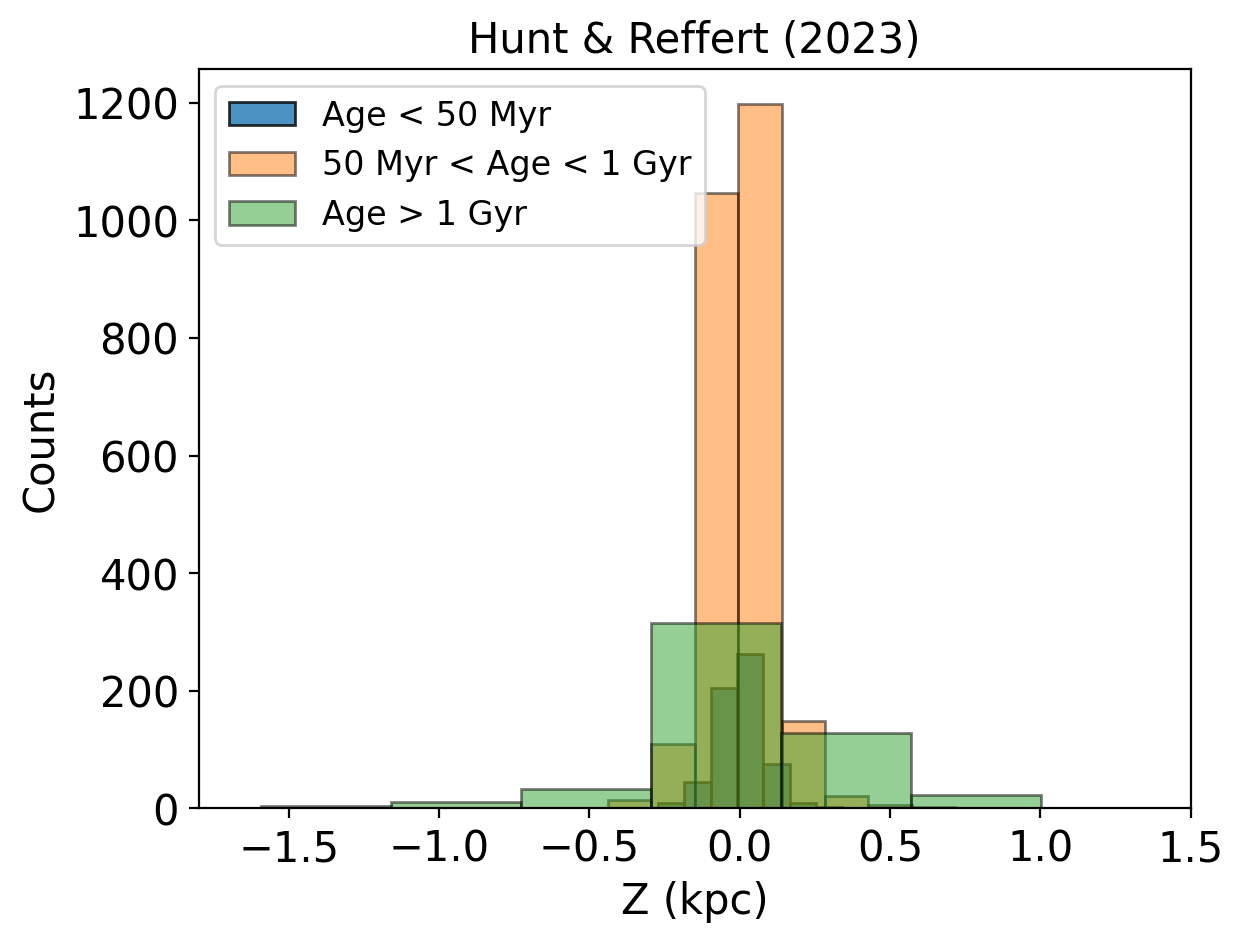
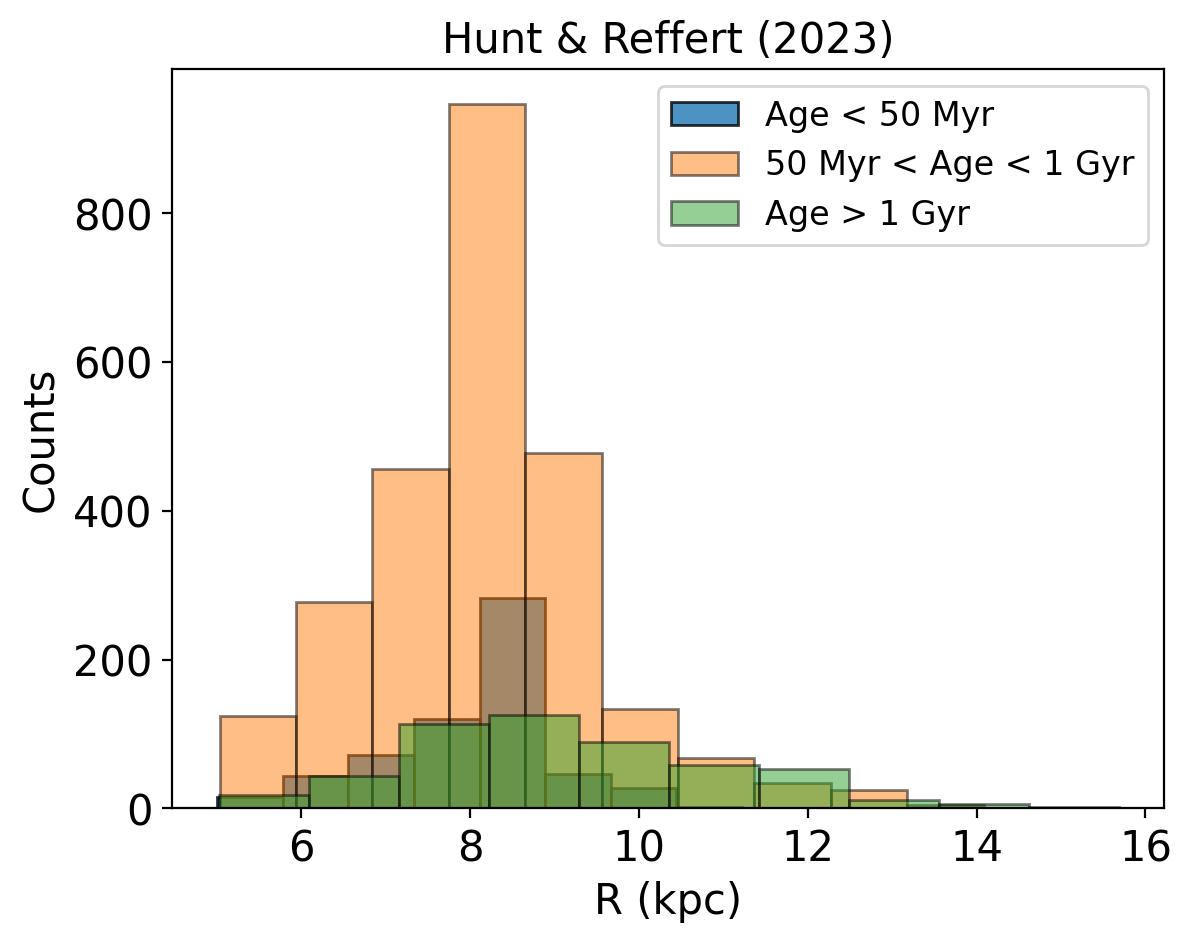
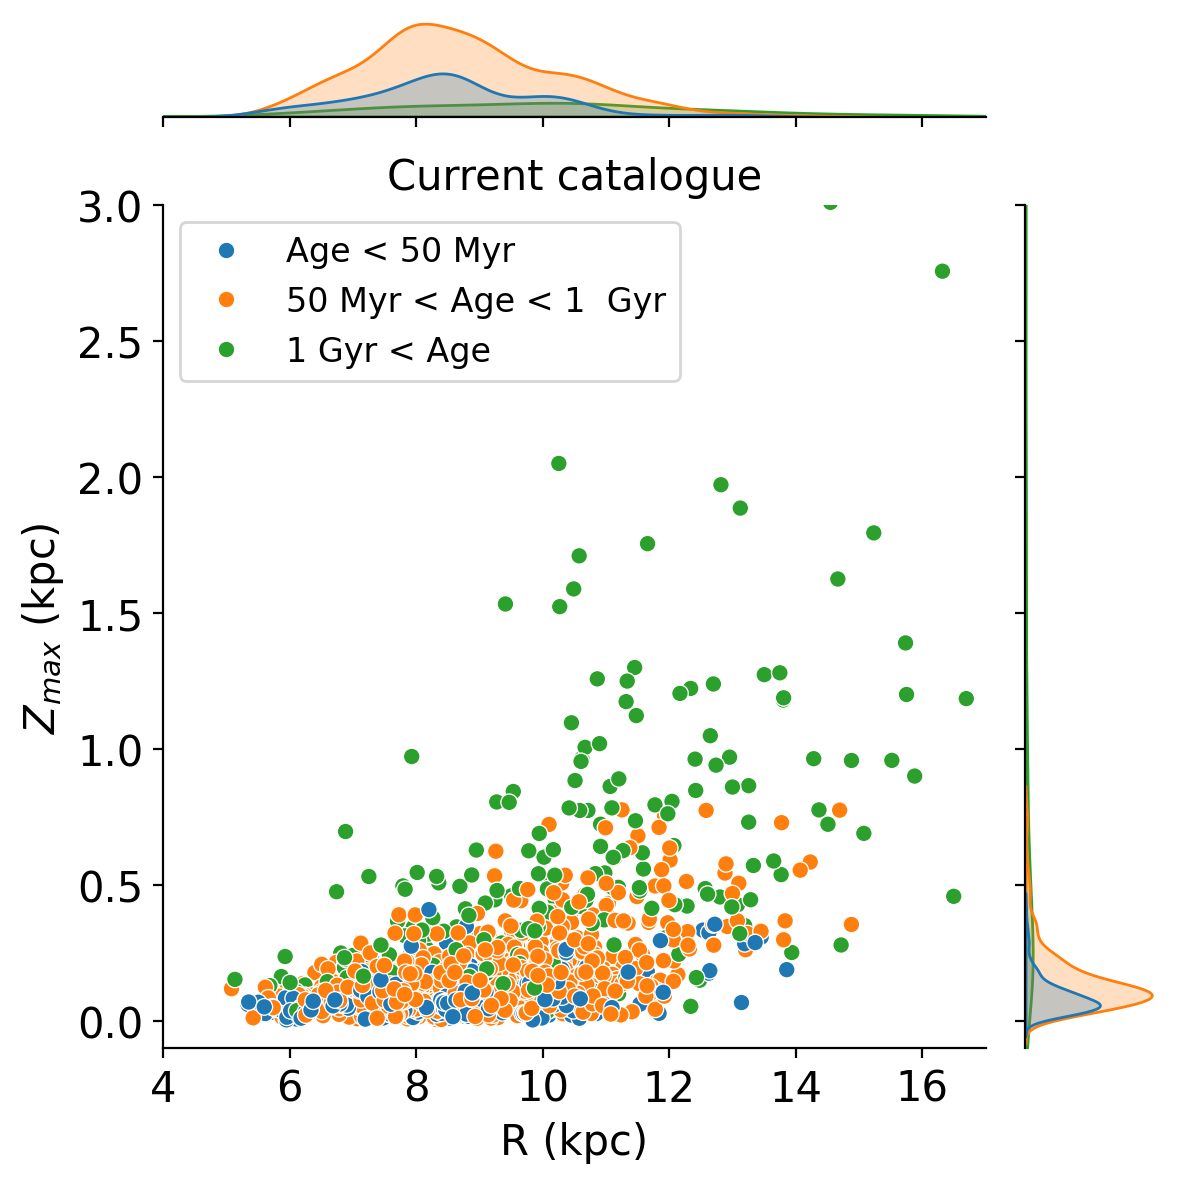
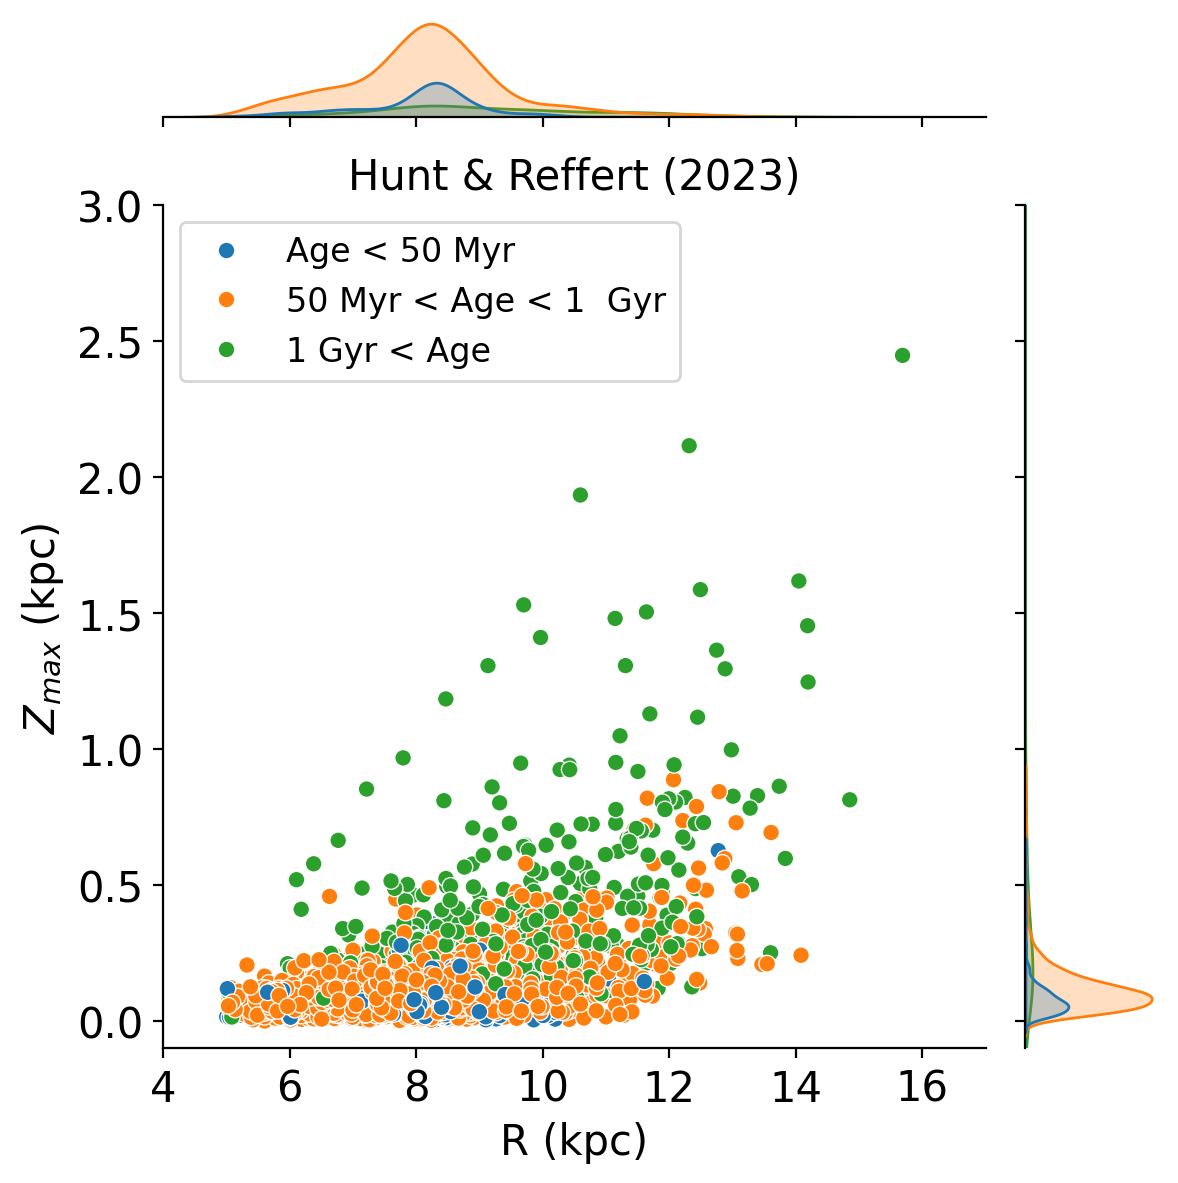
Orbits and corresponding orbital parameters such as eccentricity, perigalactic and apogalactic distance, and Zmax while orbiting the Galactic center were derived for 1145 and 3677 OCs in both catalogs using the above-discussed method. To interpret the results, we divided the sample OCs into three groups: young OCs (younger than 50 Myr), intermediate age OCs (aged from 50 Myr to 1 Gyr), and old OCs (older than 1 Gyr). These three groups consist of 263 (611), 700 (2547), and 182 (519) OCs, respectively, in the updated (HR23) catalog respectively.
Fig. 5 shows a histogram of the present-day vertical heights and of OCs for current catalog, and Fig. 5 shows similar histograms for HR23. These figures give us an idea of the present-day distribution of OCs in the Galaxy and show that most young and intermediate age OCs are located close to the Sun. In contrast, the older OCs are distributed radially from the inner region to the disk’s outer region. Similarly, young and intermediate age OCs are predominantly found closer to the Galactic mid-plane. In contrast, older OCs are distributed with more considerable vertical heights with respect to the Galactic mid-plane.
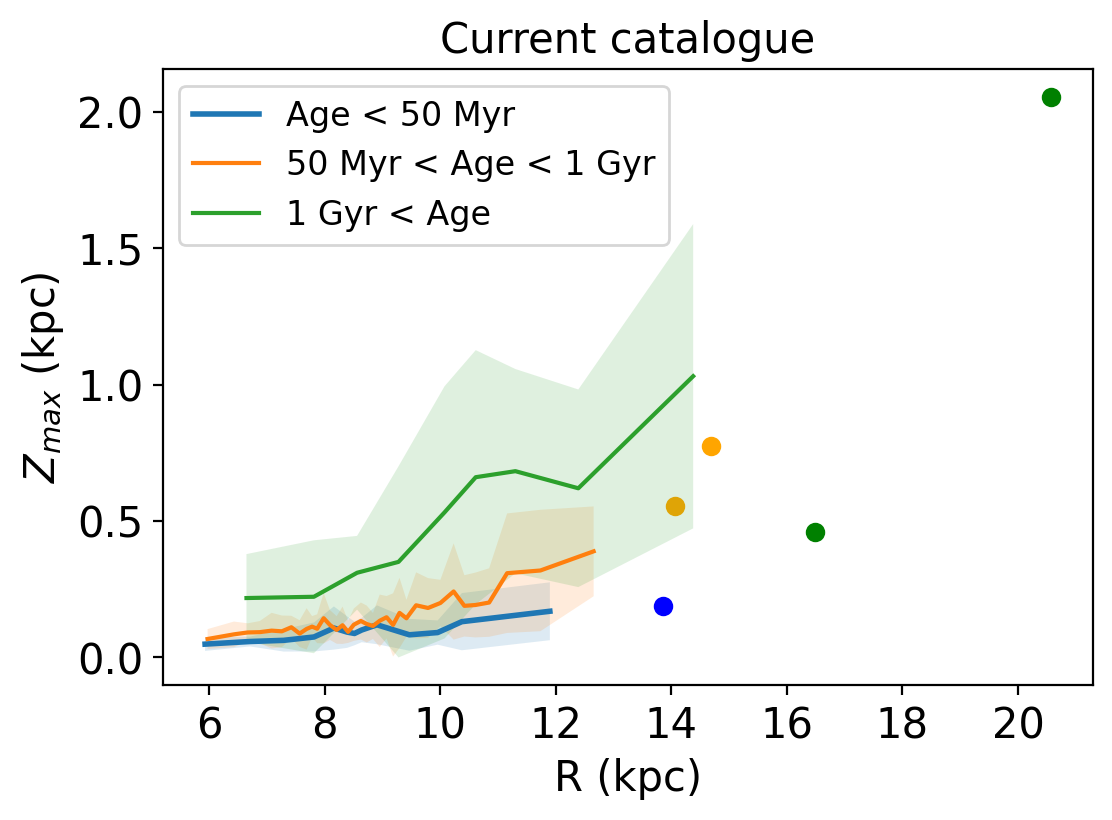
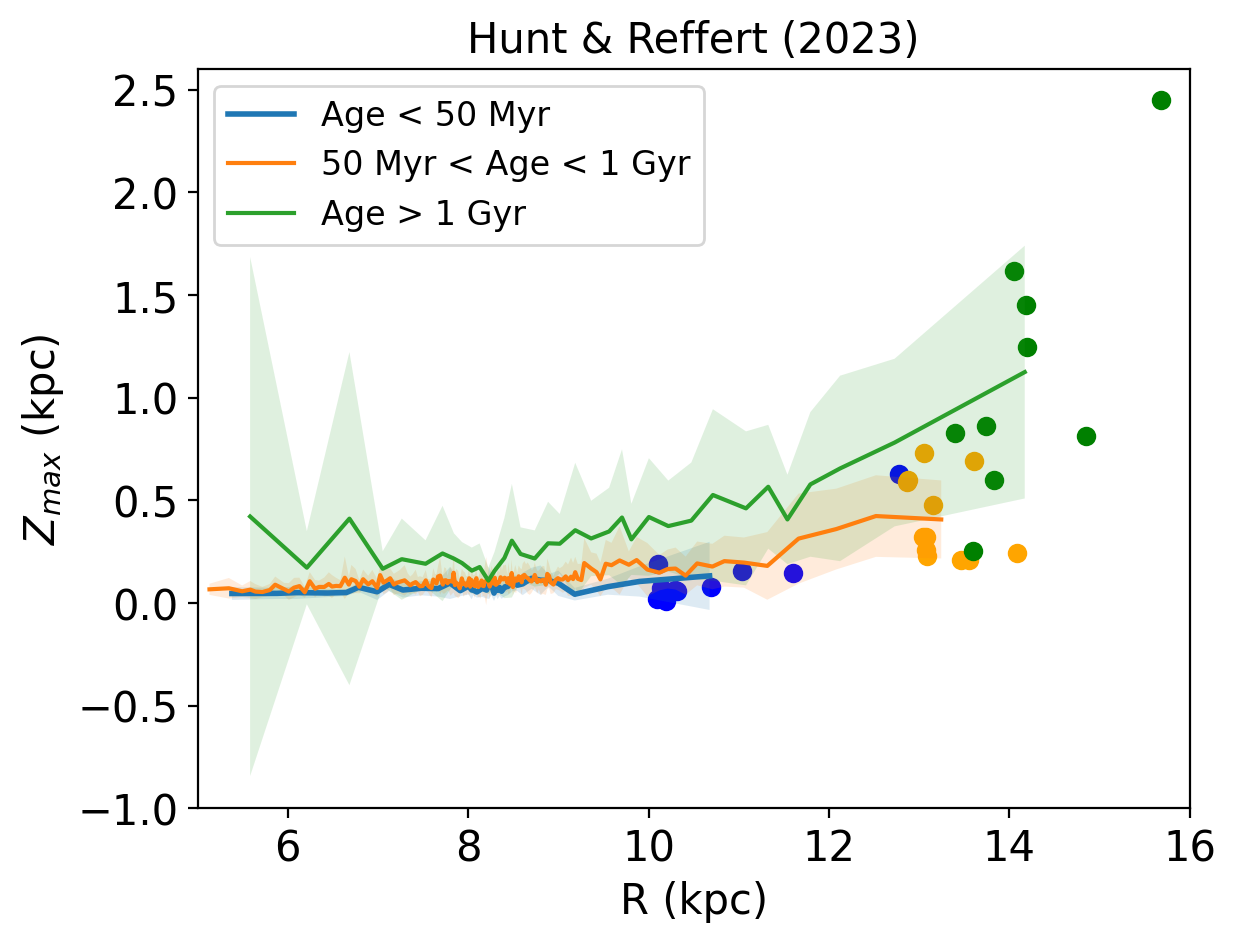
The Zmax values of OCs can determine the maximum vertical height of the Galactic disk as a function of age and . Hence, we plotted the Zmax of all the selected OCs in both the catalogs as a function of their in Fig. 6. We found a distinct pattern between the maximum vertical height and the for the three age groups. Only the older OCs are able to reach larger vertical heights from the disk, while the young OCs are confined to the Galactic mid-plane. Also, as we proceed farther from the galactic center in a radial direction, the capability of any cluster to move in an orbit with a larger vertical height increases. The overall trend of disk thickening is the same for both OC catalogs.
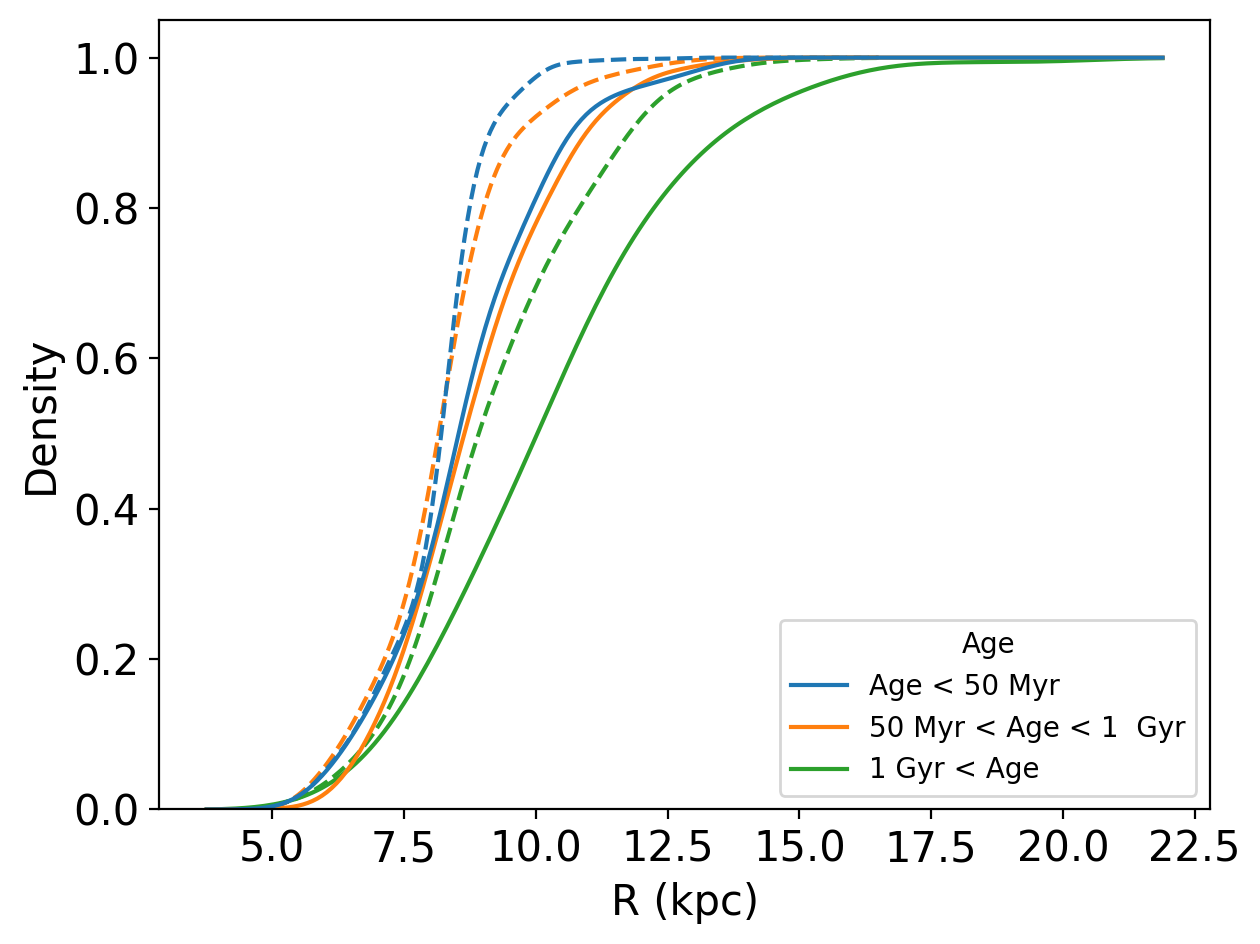
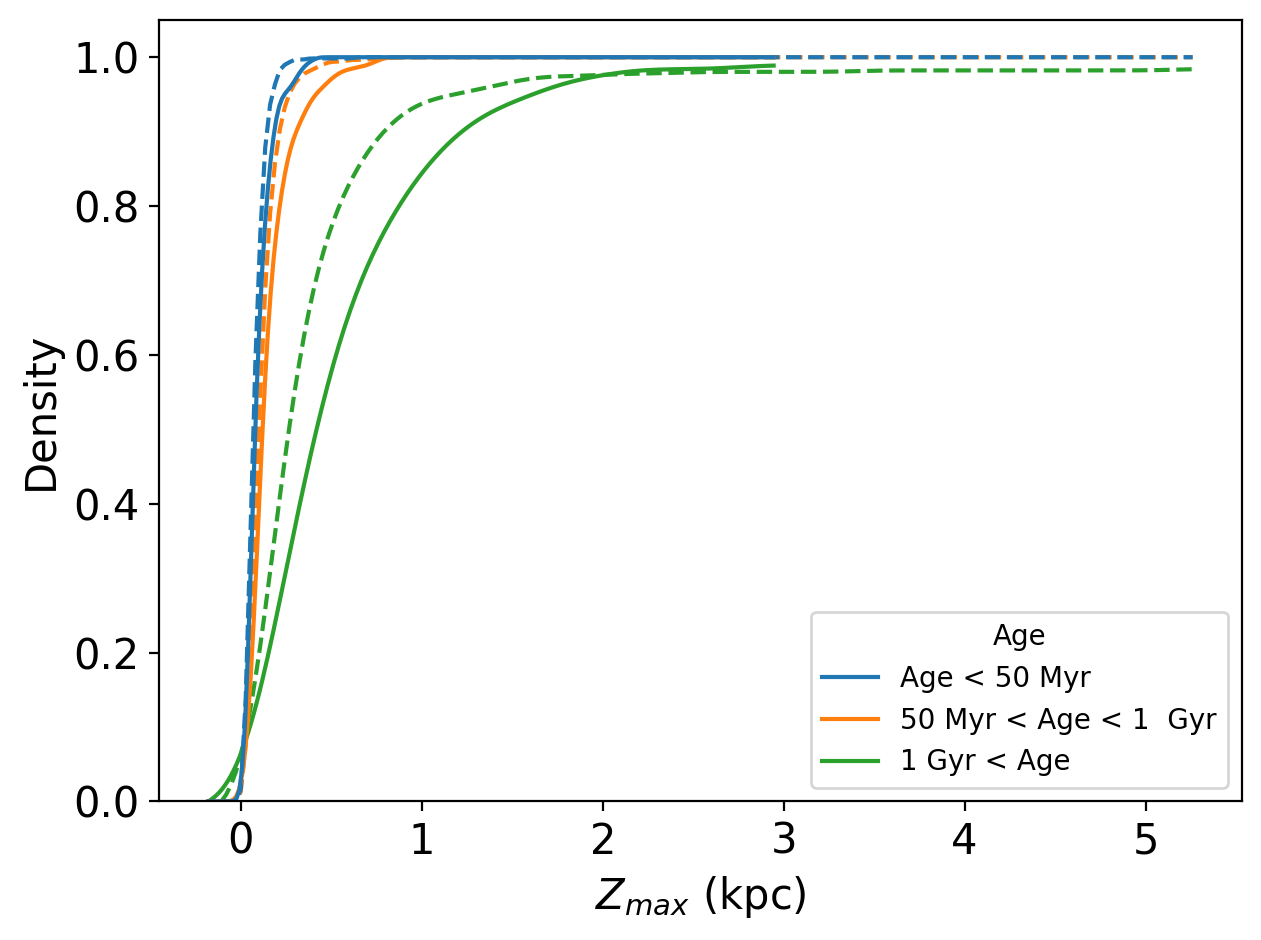
To explore the relative distribution of OCs in various age groups, we plotted the cumulative kernel density plots for and as shown in Fig. 7. The solid lines in these figures represent the OCs in the current catalog, while the dotted lines represent OCs in HR23. The figure in the upper panel shows that for OCs younger than 1 Gyr, the distribution across radial distance appears to be similar. For OCs older than 1 Gyr, we note an extended distribution, with more older OCs in the outer part of the disk. The OCs in both catalogs show a similar trend, but the OCs in the HR23 catalog are radially located relatively inside. In the lower panel of the figure, it can be noted that OCs younger than 1 Gyr have a very similar distribution of vertical height. In contrast, OCs older than 1 Gyr can reach significantly higher vertical heights, as seen from both catalogs. The figure suggests that the maximum vertical height that can be reached by OCs younger than 1 Gyr is 0.5 kpc, whereas OCs older than 1 Gyr can achieve up to a maximum vertical height of 2 kpc. The OCs in both catalogs follow a similar trend; the only difference is that HR23 has about three times the number of OCs in all three age ranges.
We quantified these empirical observations by plotting the running mean plots for both catalogs, as shown in Fig. 8. This figure shows the mean value of every 20 consecutive OCs in current catalog and 15 consecutive OCs in HR23 and their 1-sigma confidence intervals for OCs in the respective age group (filled circles with respective colours represent the remaining OCs in each group). The profiles in the figure suggest that is the lowest for young OCs, and the two older groups show larger values for the maximum vertical heights. We also note a distinct pattern in the for the three age groups. The two younger age groups show a similar pattern up to a radius of 9 kpc, beyond which the intermediate age group show larger values for . The oldest age group also appears to have a differing pattern beyond 9 kpc, with the peak-like feature at a radius of 11 kpc. The pattern shown by the intermediate age and the old age group of the OCs suggests a flaring of the disk beyond a radius of 9 kpc. Though the overall trend for the two catalogs is similar, there are differences in the details. HR23 has two peaks in the inner solar circle for the older population, which are not in current catalog. The big jump after R 10 kpc is not visible in HR23, which is very prominent in current catalog. There are many minor variations in the intermediate age population, possibly because the number of OCs is larger in HR23. The distribution is similar for the young population, mainly concentrated towards the disk mid-plane and has a small bump between 8 kpc R 9 kpc.
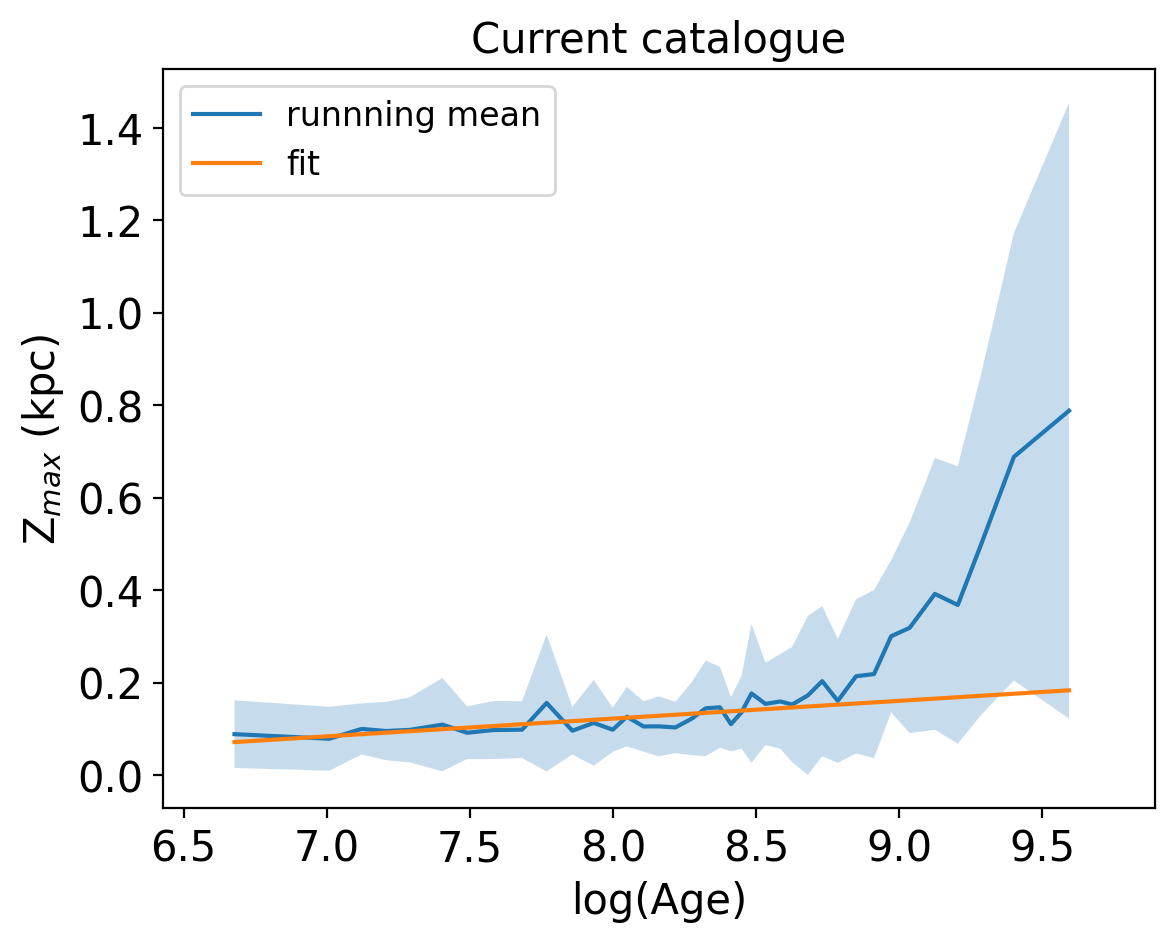
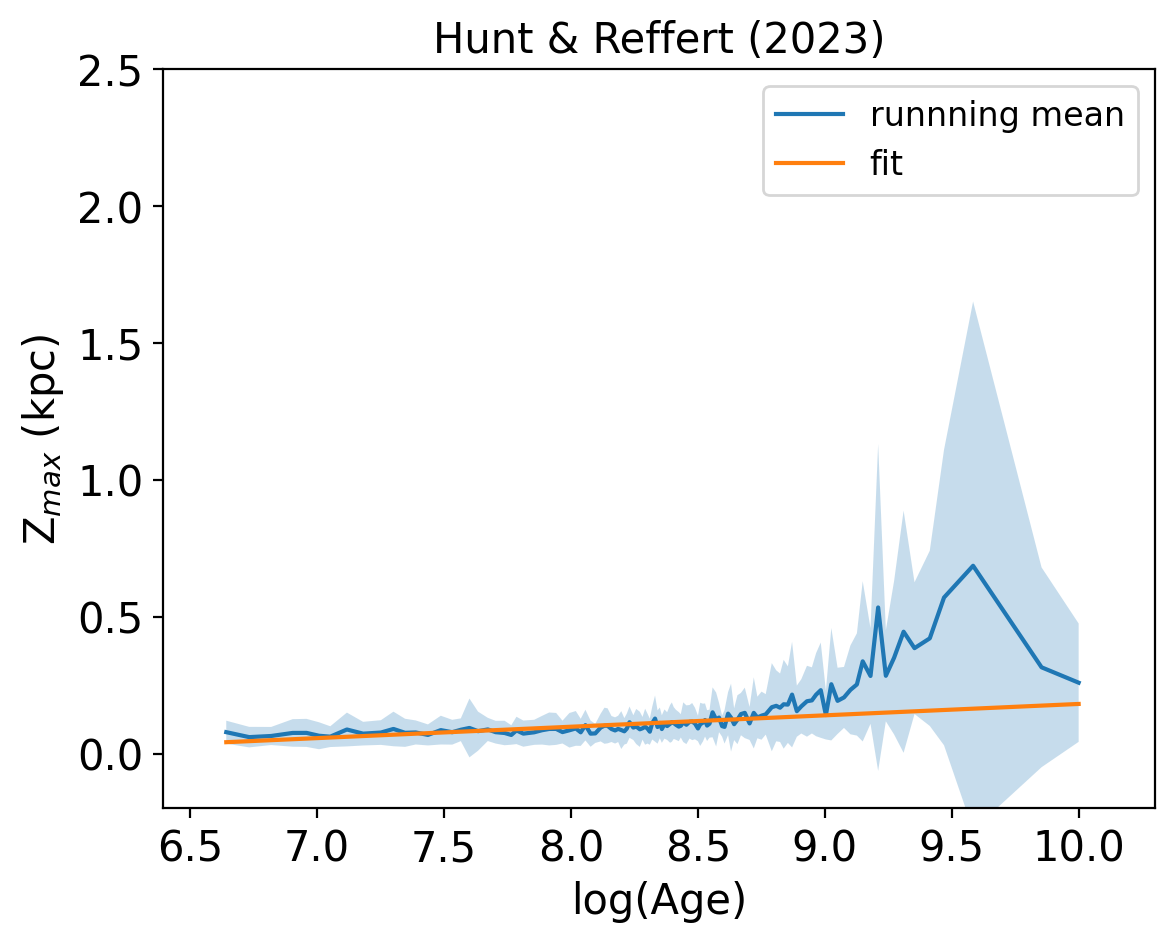
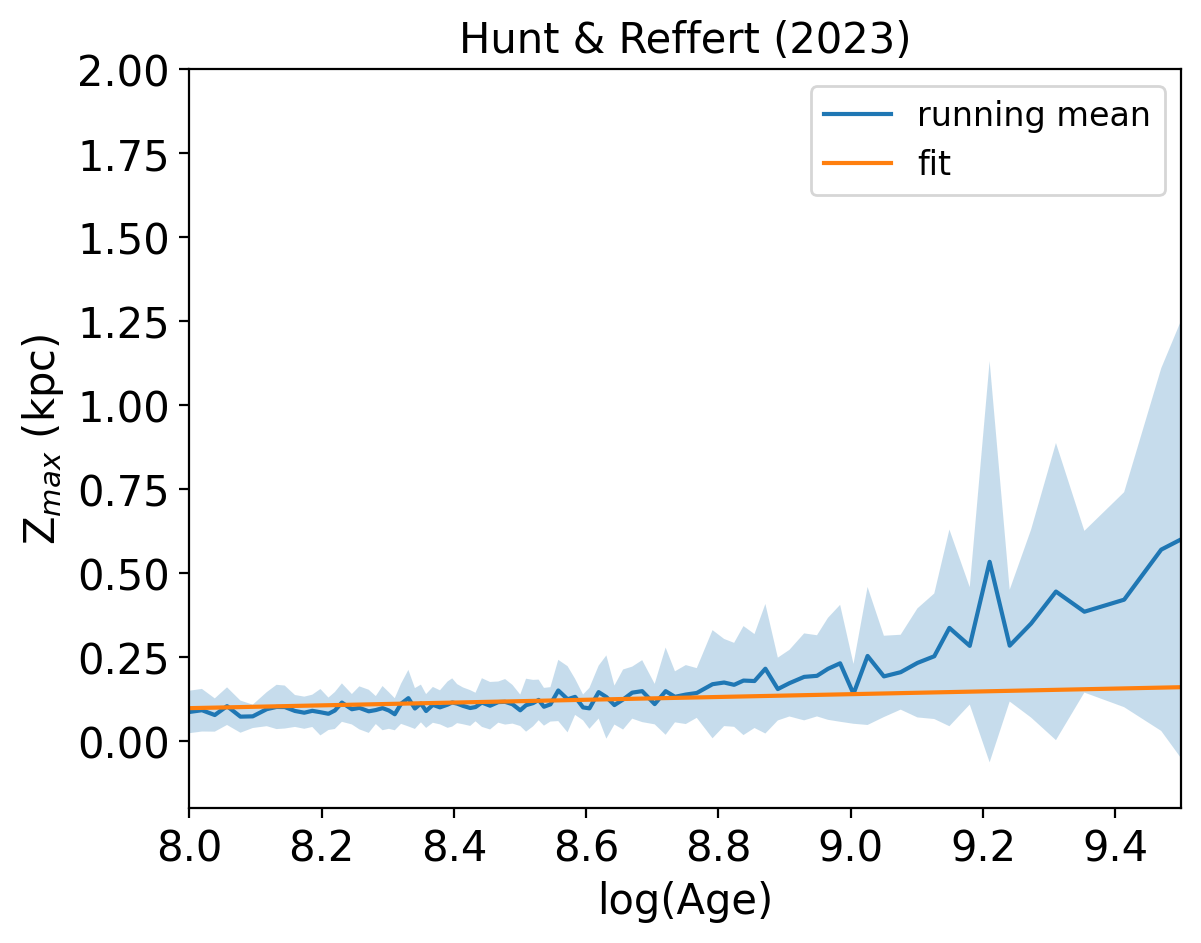
We note that the intermediate age group covers an extensive range of ages, and we attempt to identify the ages of the youngest OC that show flaring. With this aim, we plotted the running mean for values of the OCs with the cluster age in Fig. 9. We note that the profile shows relatively low values of initially and a sharp increase for older OCs. We performed a linear fit on mean values to trace the dependency of on the age of the OCs. For OCs in current catalog, we estimated the following relation,
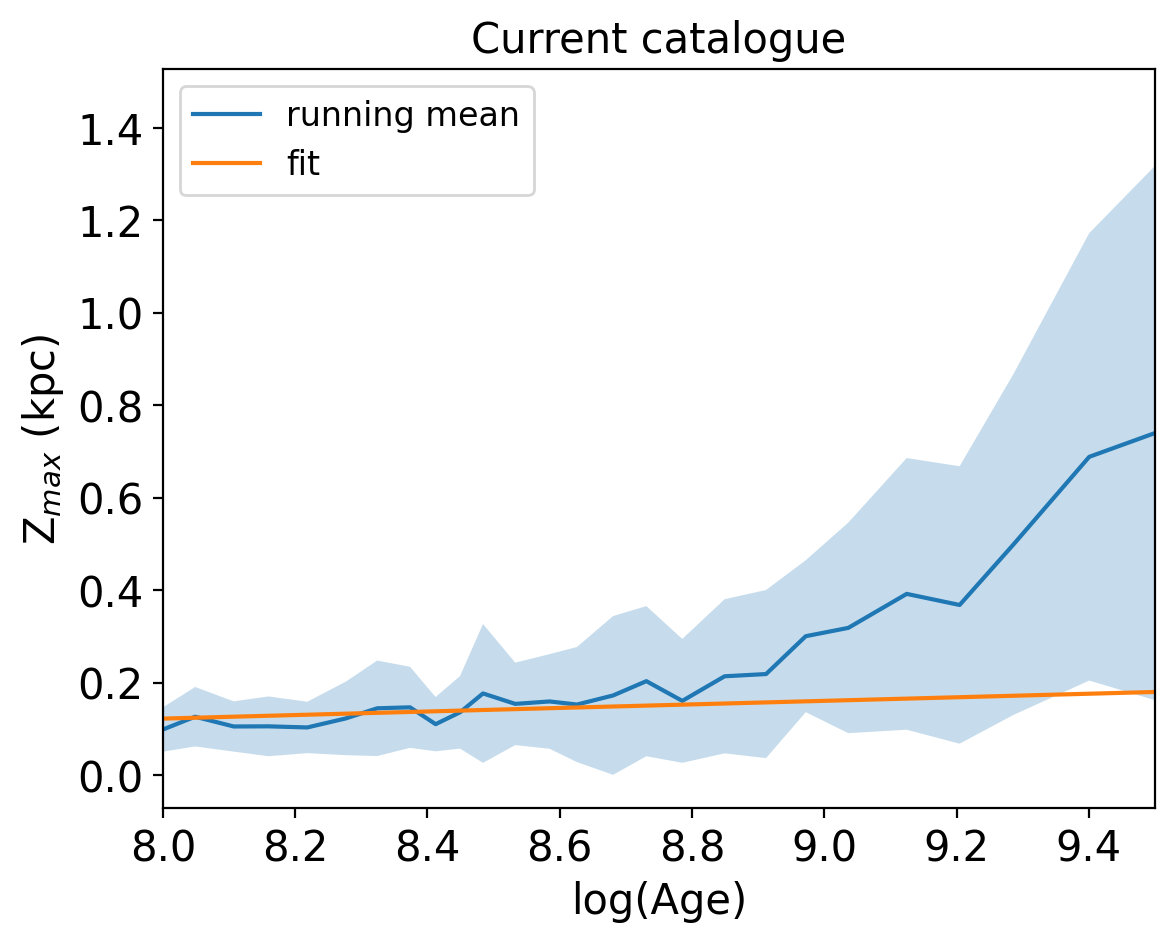
where the applicability of this expression is between the log (age) 8 and 9.0. For the first time, the above relation provides a quantitative value of for various ages. The fit also helps detect sudden jumps above and below the mean in vertical height, as shown in the figure. It appears that the deviations start around 1 Gyr. Fig. 9 provides an enlarged view of a portion of the figure in the upper panel, and we note that OCs older than ( 800 Myr) tend to have larger values of , whereas the younger OCs have lesser values of . In the case of OCs in HR23, a similar pattern is visible and with the following relation,
where the coefficients match within 1-sigma to the values obtained for current catalog.
We estimated the median values for various age bins of OCs in both catalogs. For OCs younger than 10 Myr, median is 57 pc (63 pc); in the age range 10 - 100 Myr, OCs reach a median vertical height of 90 pc (69 pc); OCs in age range 100 - 800 Myr reach a of 113 pc (100 pc); whereas OCs older than 800 Myr have a median of 339 pc (221 pc), based on the current catalog (HR23 catalog). We note that the value of grows as a function of the cluster’s age, but the values obtained from the current catalog are larger than that from HR23. The difference is significant for the youngest and the oldest age groups. We note that the current catalog has more OCs at large radii, contributing to a higher value of .
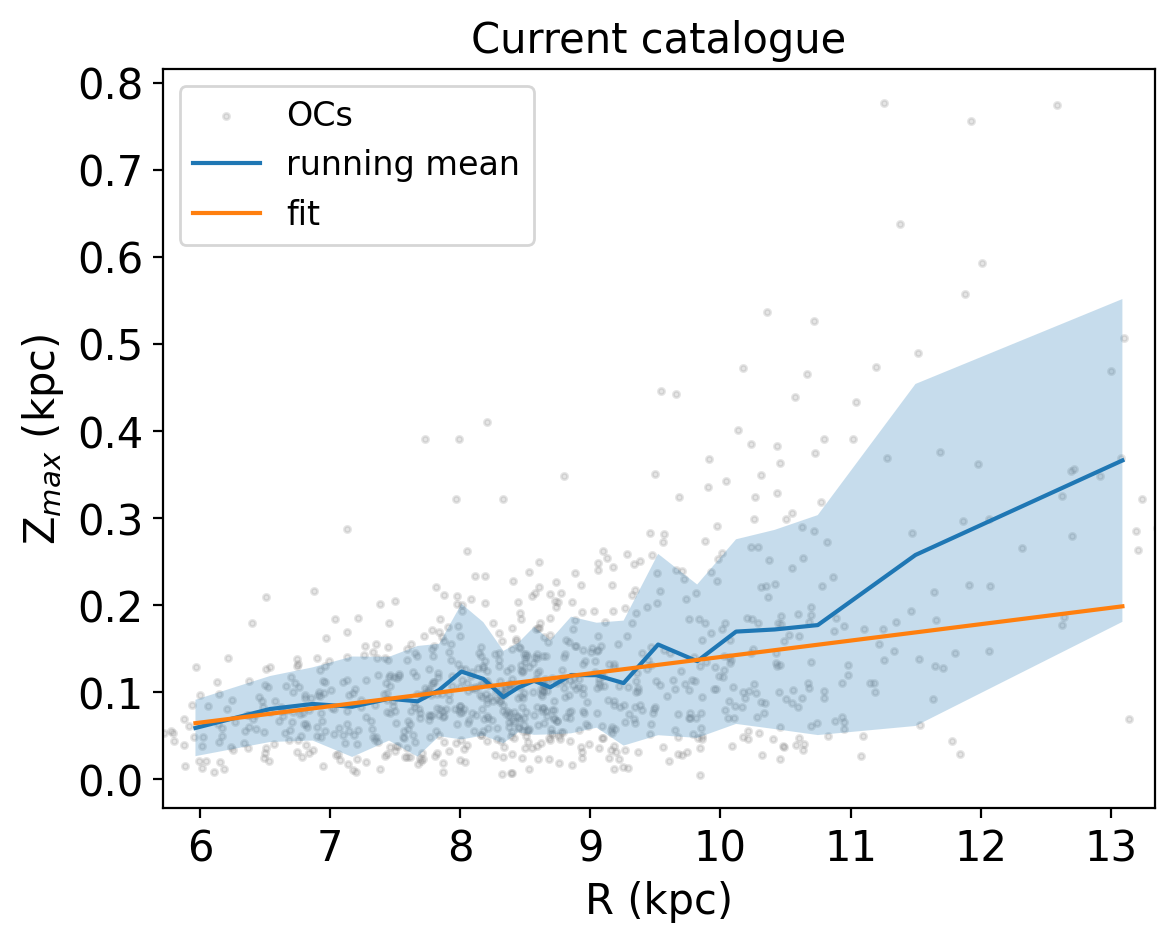
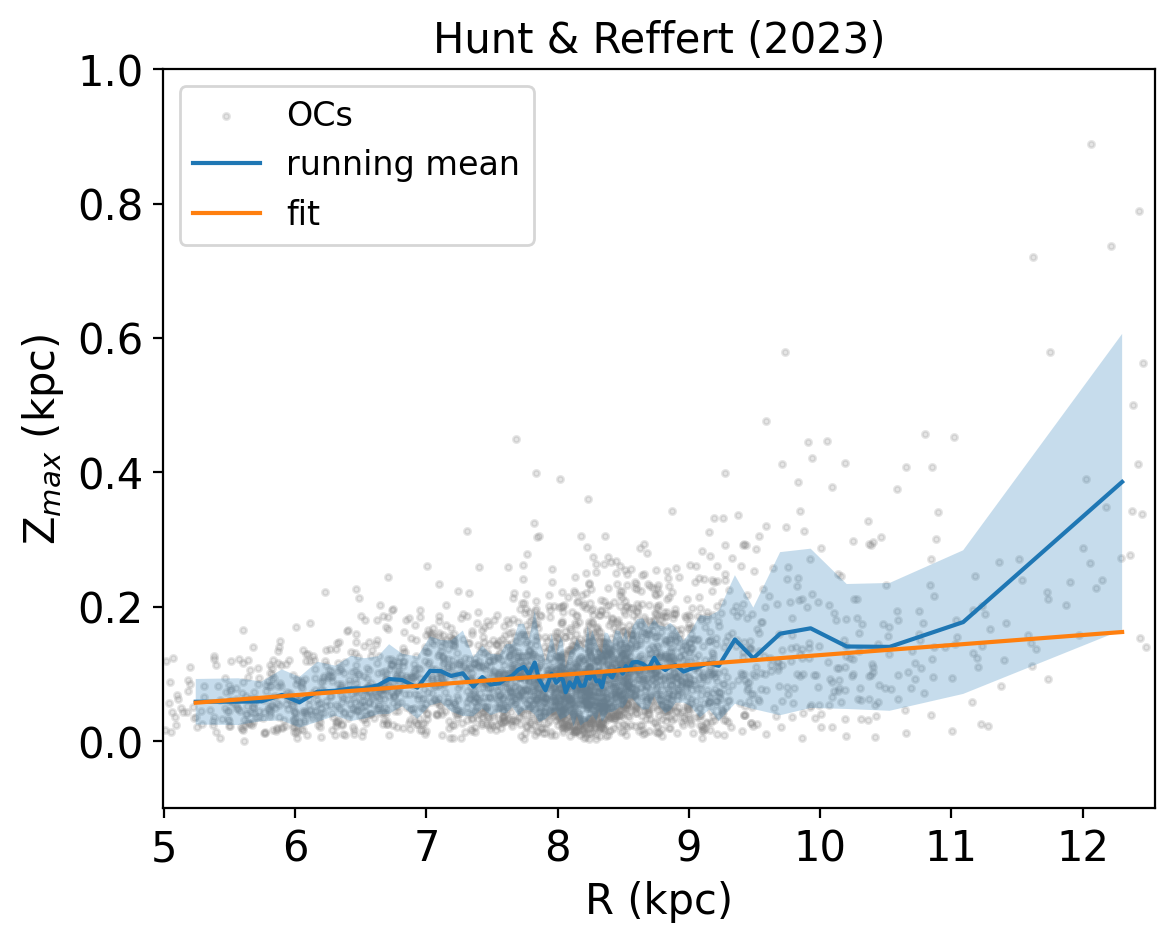
To investigate the vertical pattern of higher found with increasing in Fig. 8, we plotted the running mean (bin width = 40) of for OCs younger than 800 Myr as a function of in Fig. 10. For the first time, we estimate the dependency between and as,
Left panels of Fig. 10 suggest that most OCs younger than 800 Myr reach maximum vertical heights not greater than 200 pc within a of 10 kpc. In contrast, some OCs achieve vertical heights of greater than 200 pc beyond a radius of 11 kpc, comparable to the increased value of for the OCs older than 1 Gyr (see fig.8).
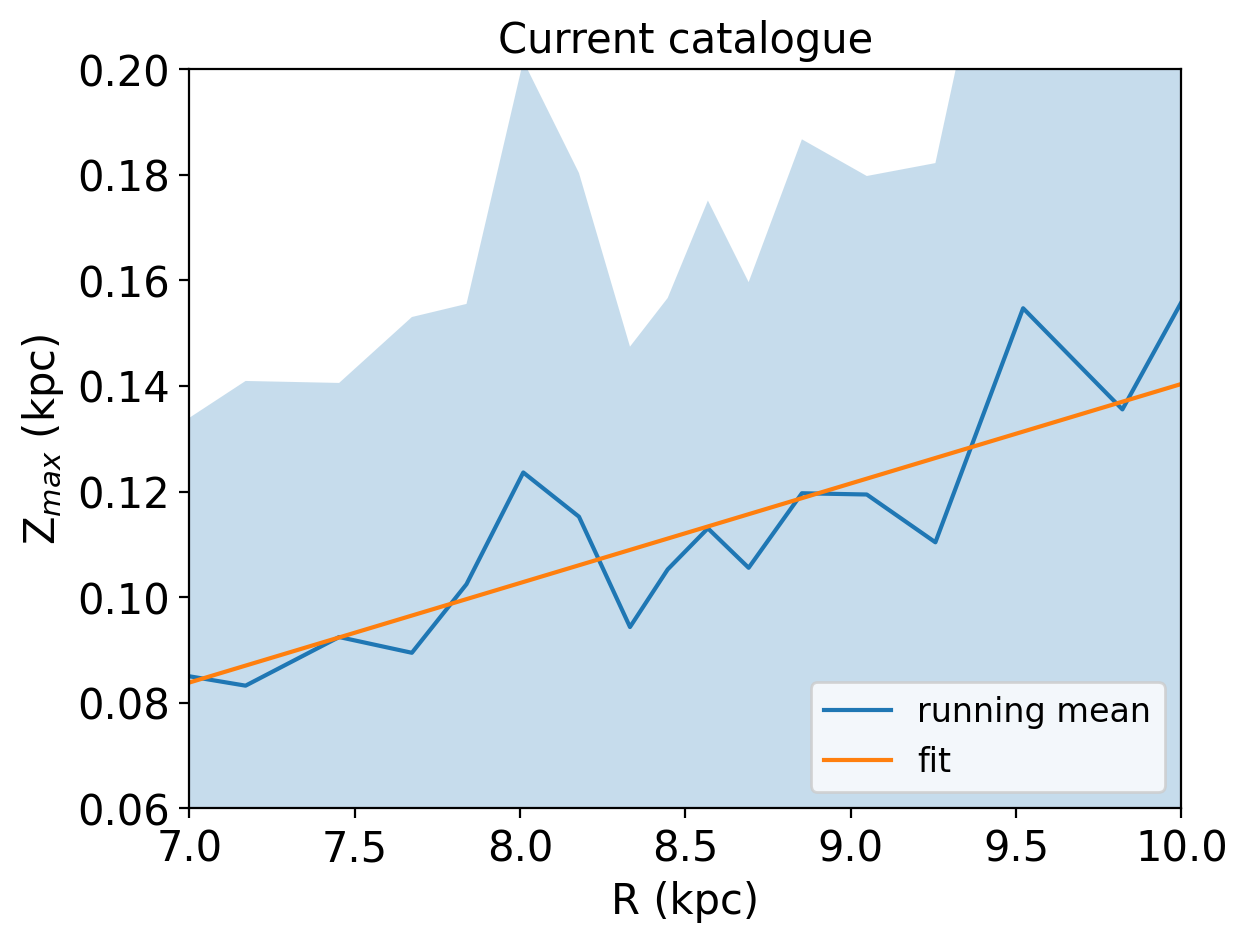
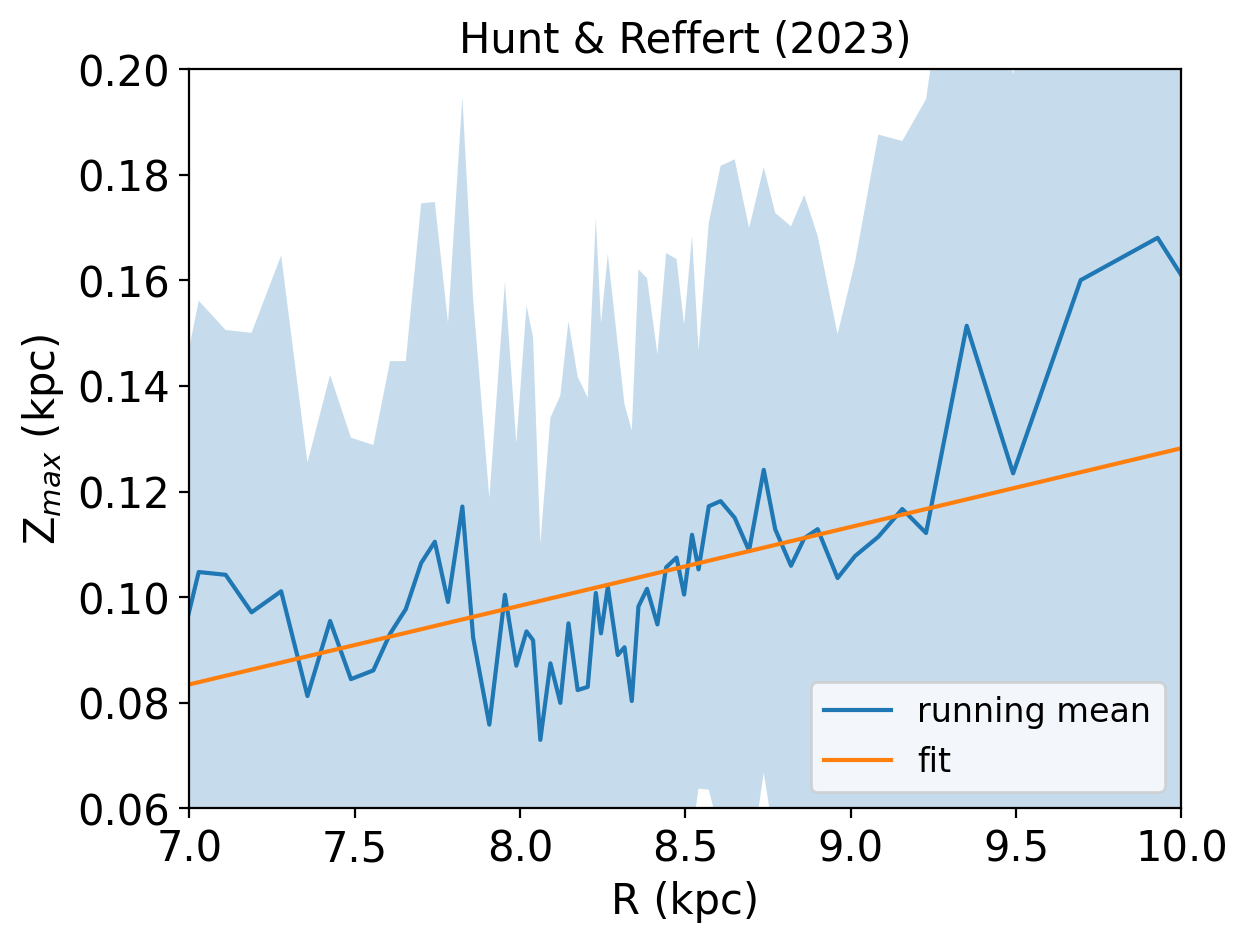
The right panels present an enlarged part between the of 7 - 10 kpc. In this running average profile, two prominent vertical features are visible for OCs in current catalog. We note that at two values (8 kpcs and 9.5 kpc), shoots up by nearly 20-30 pc. This increased value of has a width not more than 500 pc at the values as mentioned earlier of the radii.
One could also naively assume that these vertical features might correlate to the spiral structure of the Galaxy and that the tidal forces of the dense spiral arms might perturb the OCs’ vertical heights.
The dependence of as a function of R is observed in the case of HR23, with a very similar slope and a slightly different value for the y-intercept. The relation is found to be:
The relation from HR23 suggests a similar variation in with radial distance with respect to the current catalog. The prominent peak at R 8 kpc observed in the OC distribution of the current catalog is shifted inwards ( between 7.5 kpc and 8 kpc) in the distribution of OCs from HR23 catalog. We note that the number of OCs in a bin is the same in both catalogs. Therefore, there are more groups in HR23 as the number of OCs is larger in HR23, resulting in several peaks in HR23 OC distribution in comparison to a few peaks seen in the current catalog OC distribution. The peak at R 9.5 is clearly visible in both catalogs, whereas we note another peak just beyond in HR23. Overall, both the catalogs provide similar inferences on the radial distribution and related features of OCs.
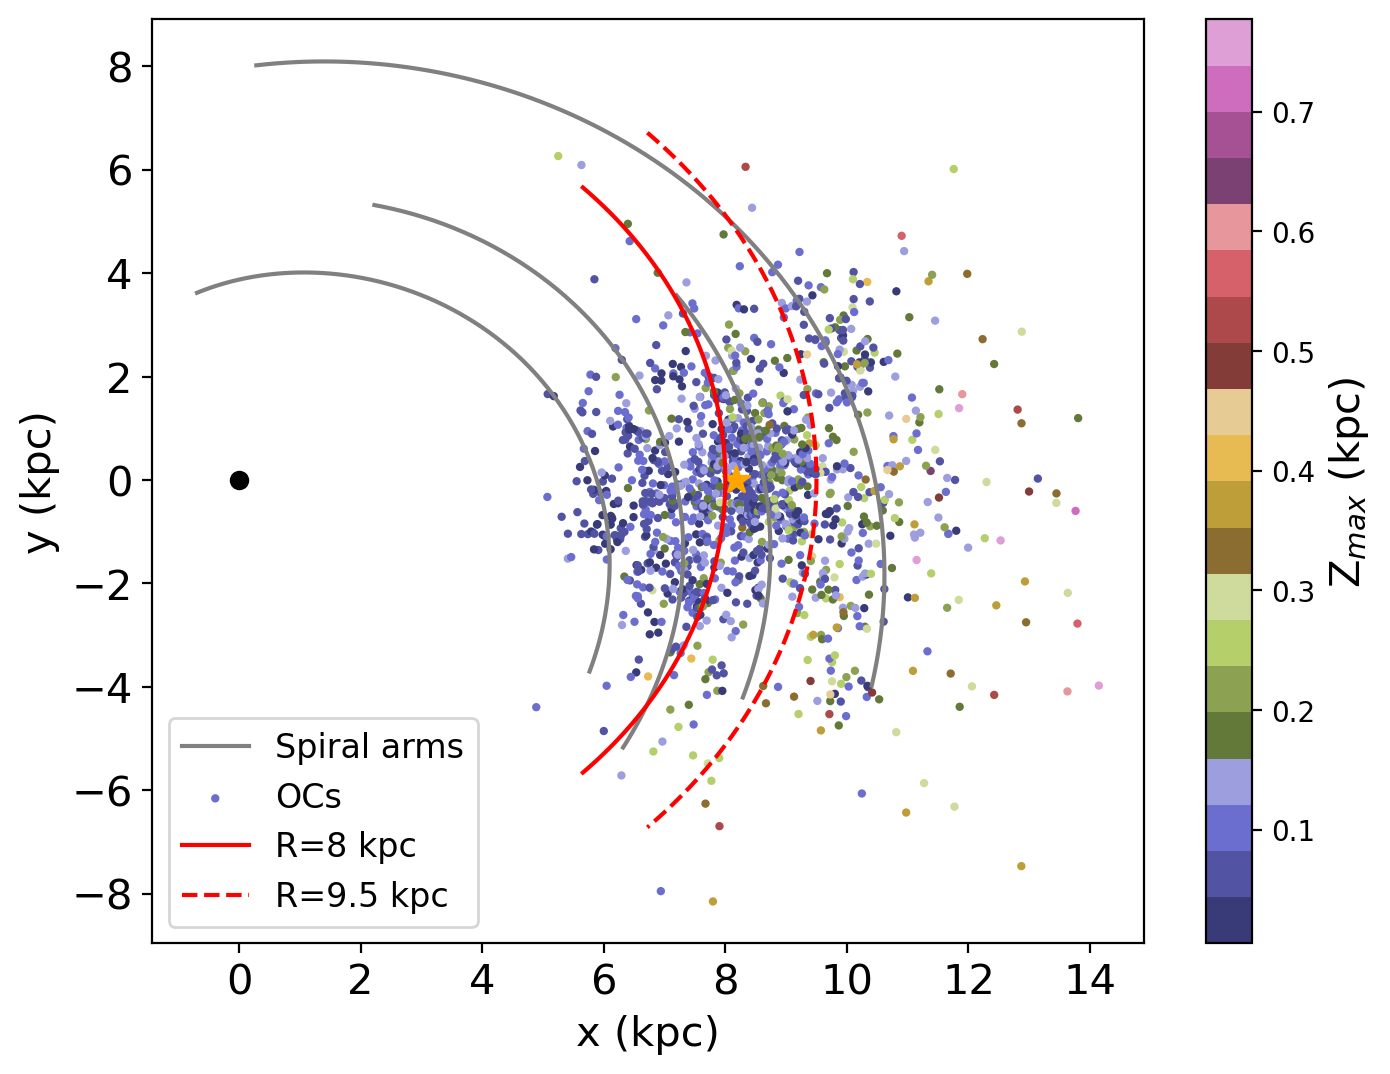
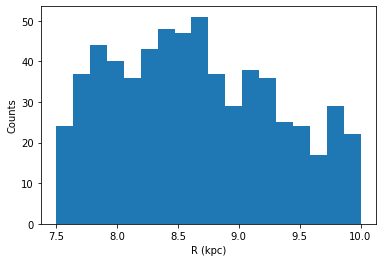
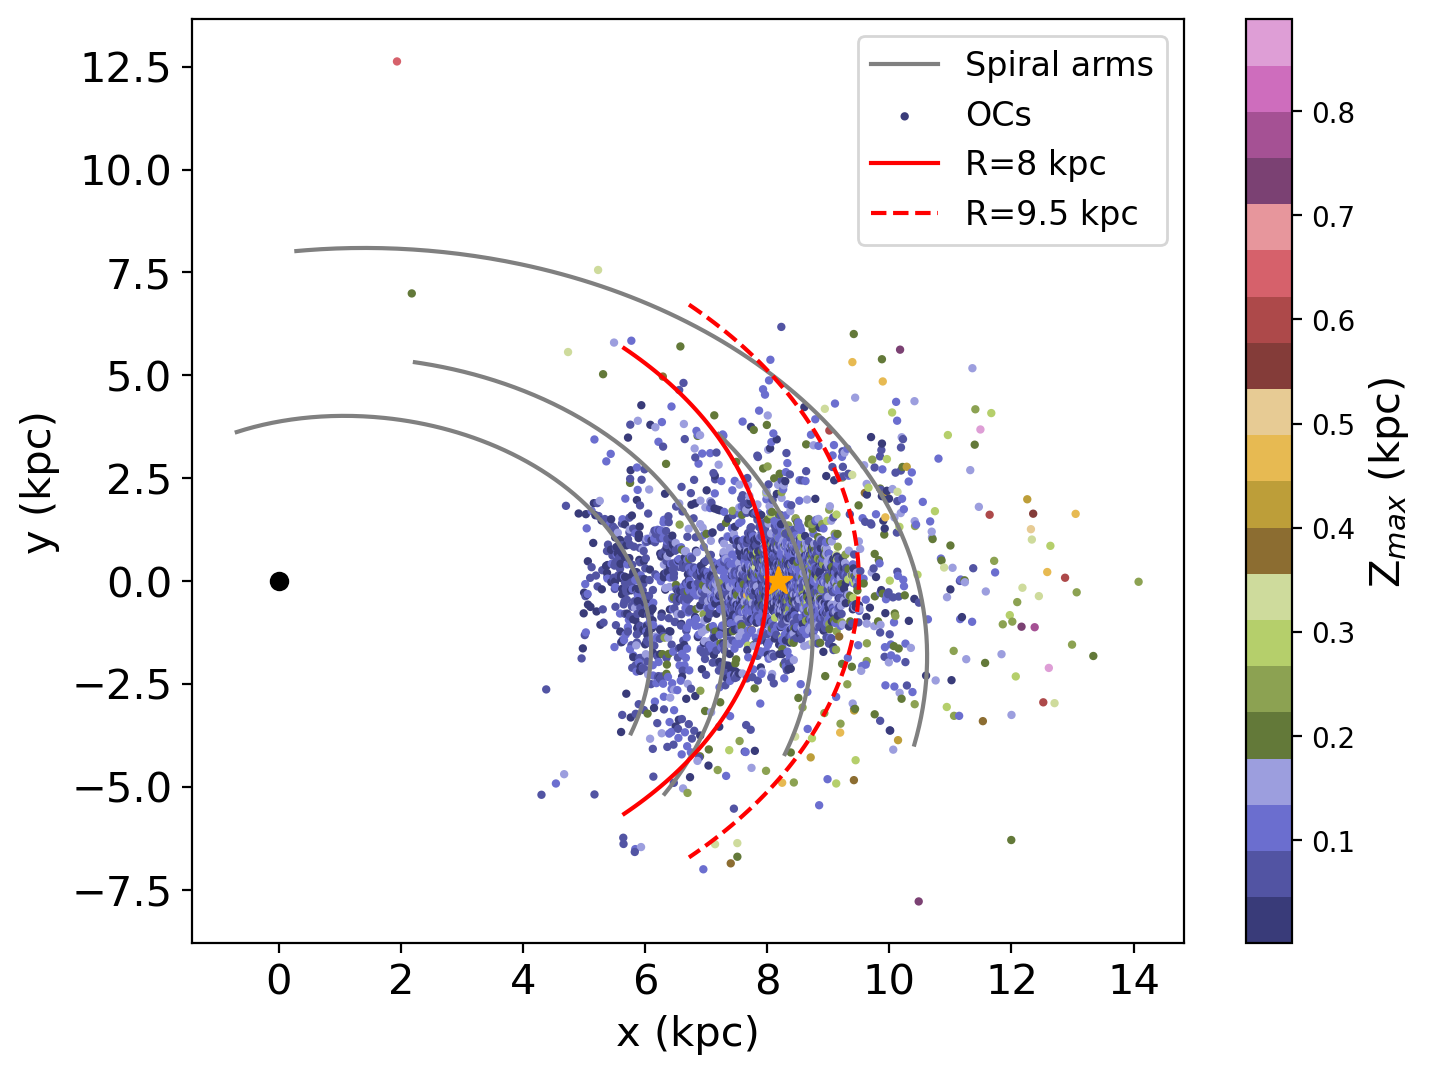
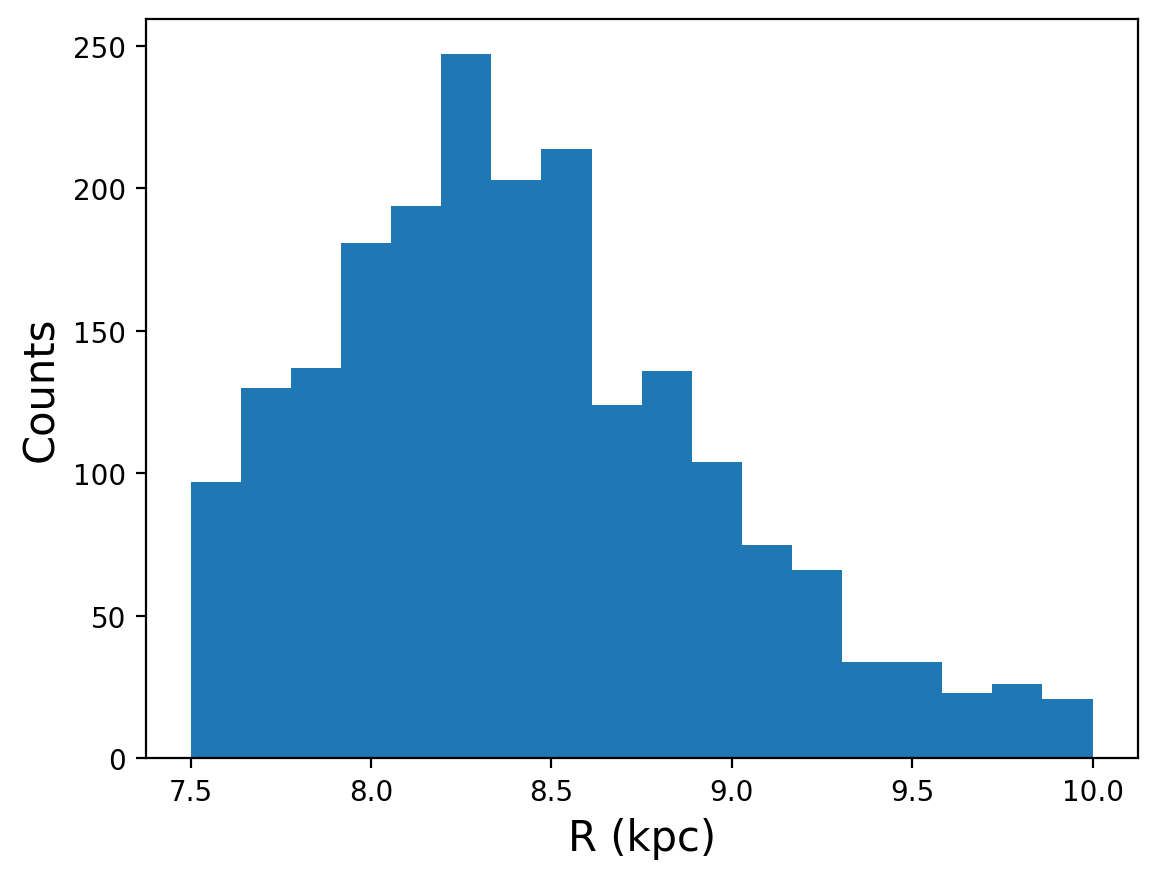
To explore the relationship between the increased values of and spiral arms, we have shown the locations of the OCs from the current calatog in the X-Y plane (Fig. 11). We also plotted the locations of spiral arms and the (partial) circles corresponding to the , 8 and 9.5 kpc. The OCs younger than 800 Myr (colour-coded with their ) are also shown here, with the position of the Sun marked within the Galactic plane by an orange star at 8.178 kpc. Interestingly, the arcs corresponding to the two radii of interest majorly occupy regions between the spiral arms. Also, the number of OCs is very low at locations where these arcs intersect the spiral arms. Therefore, this figure suggests that OCs tend to have larger values in the inter-arm region. In Fig. 11, the number of OCs as a function of is shown. We note that the largest number of OCs is around 8.5 kpc, aligning with the Local spiral arm. We do not detect any significant peaks at 8 kpc and 9.5 kpc, suggesting that regions with a localised increase in are away from the spiral arms.
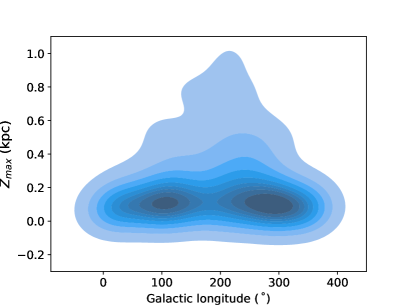
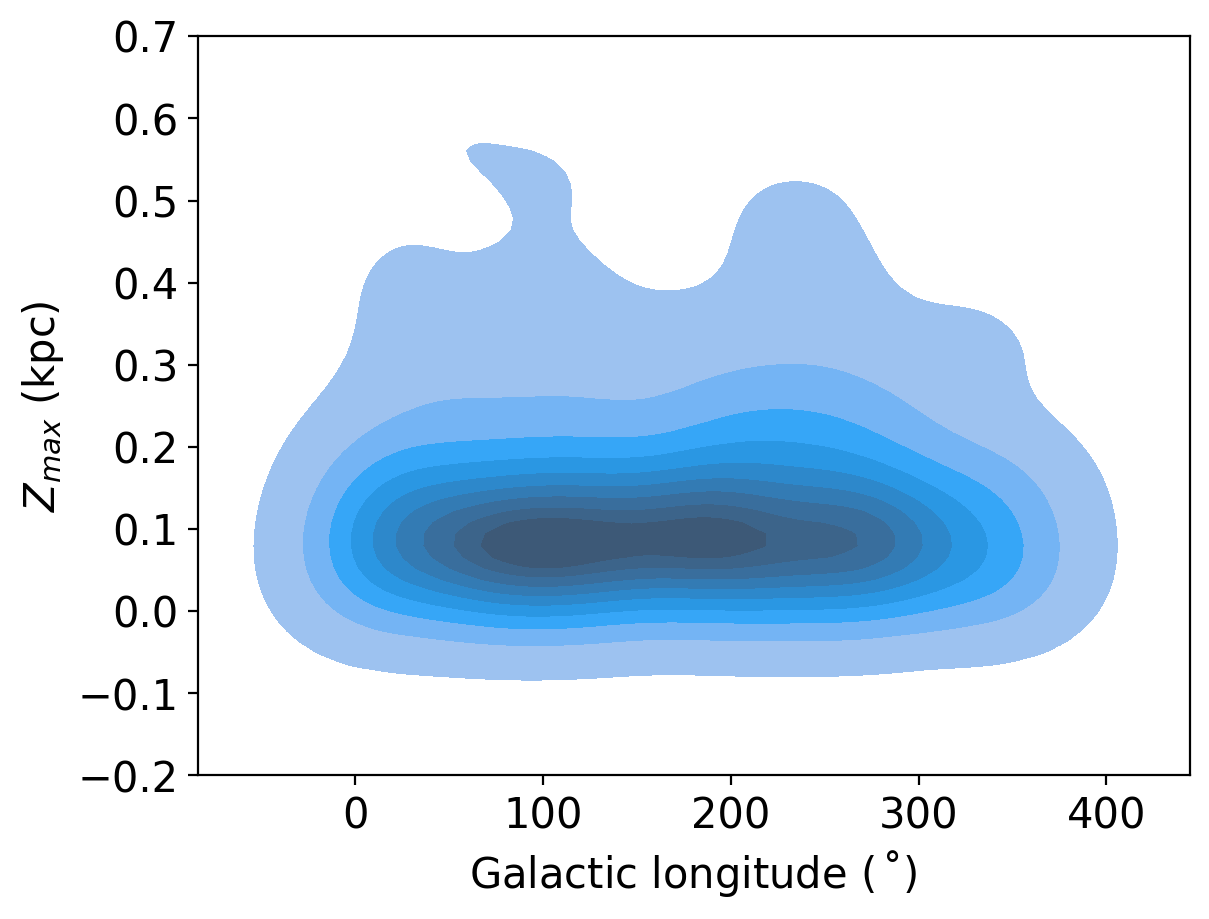
In order to assess the correlation between and the Galactic longitude (), we have shown the KDE between and as shown in Fig. 11. This figure shows that the OCs between and are orbiting with an increased , with peak between . This indicates the presence of only in the outer Galactic disk.
We performed a similar analysis for HR23, and the distributions are shown in Fig. 12. A clear increase in the OC population in the solar neighborhood is visible in Fig. 12 that is causing a prominent peak between 8 kpc R 8.5 in Fig, 12. In this histogram also, there are no peaks around 8 kpc and 9 kpc, which is a similar trend to the histogram in 11.
We note two peaks at l 120 and l 250 in Fig. 12. The peaks visible in Fig. 11 more or less match those in Fig. 12.
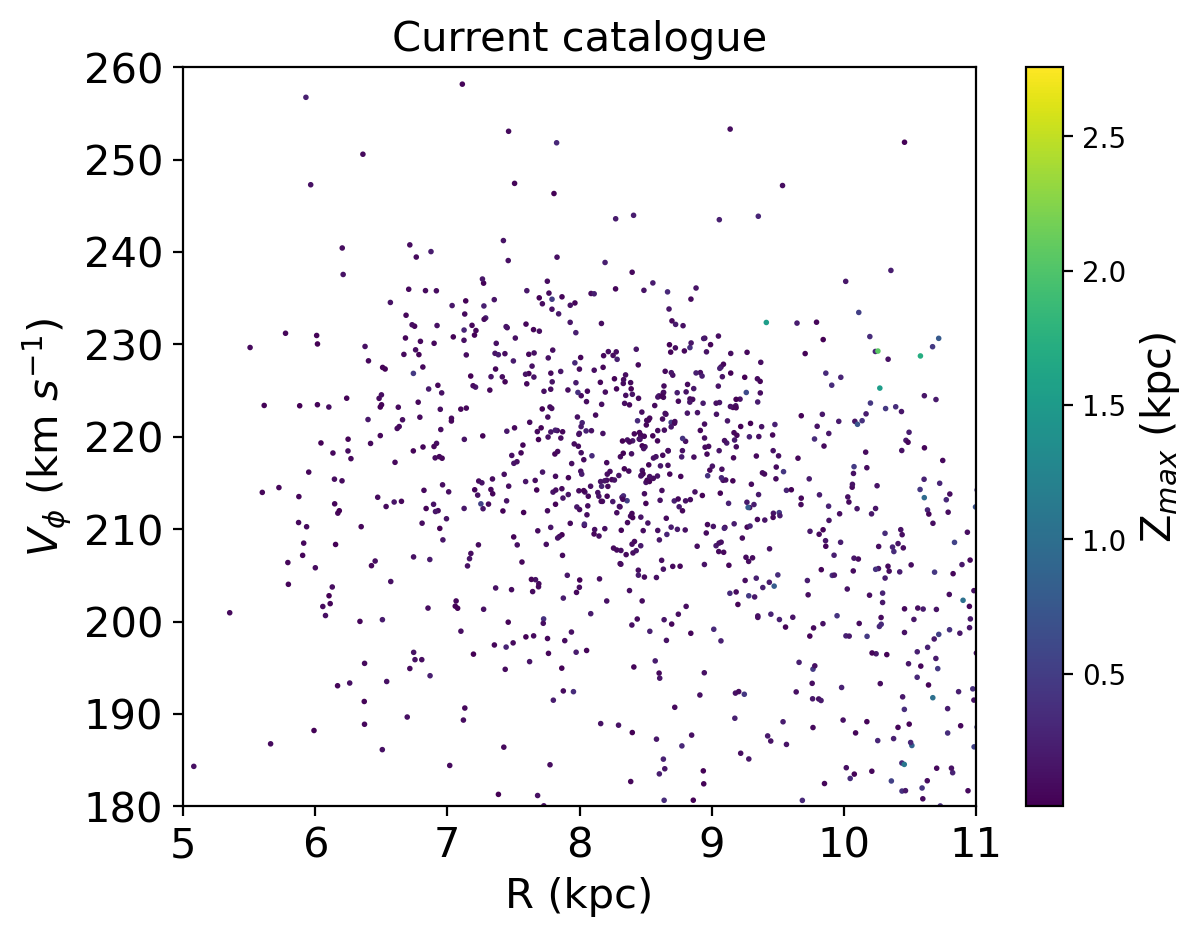
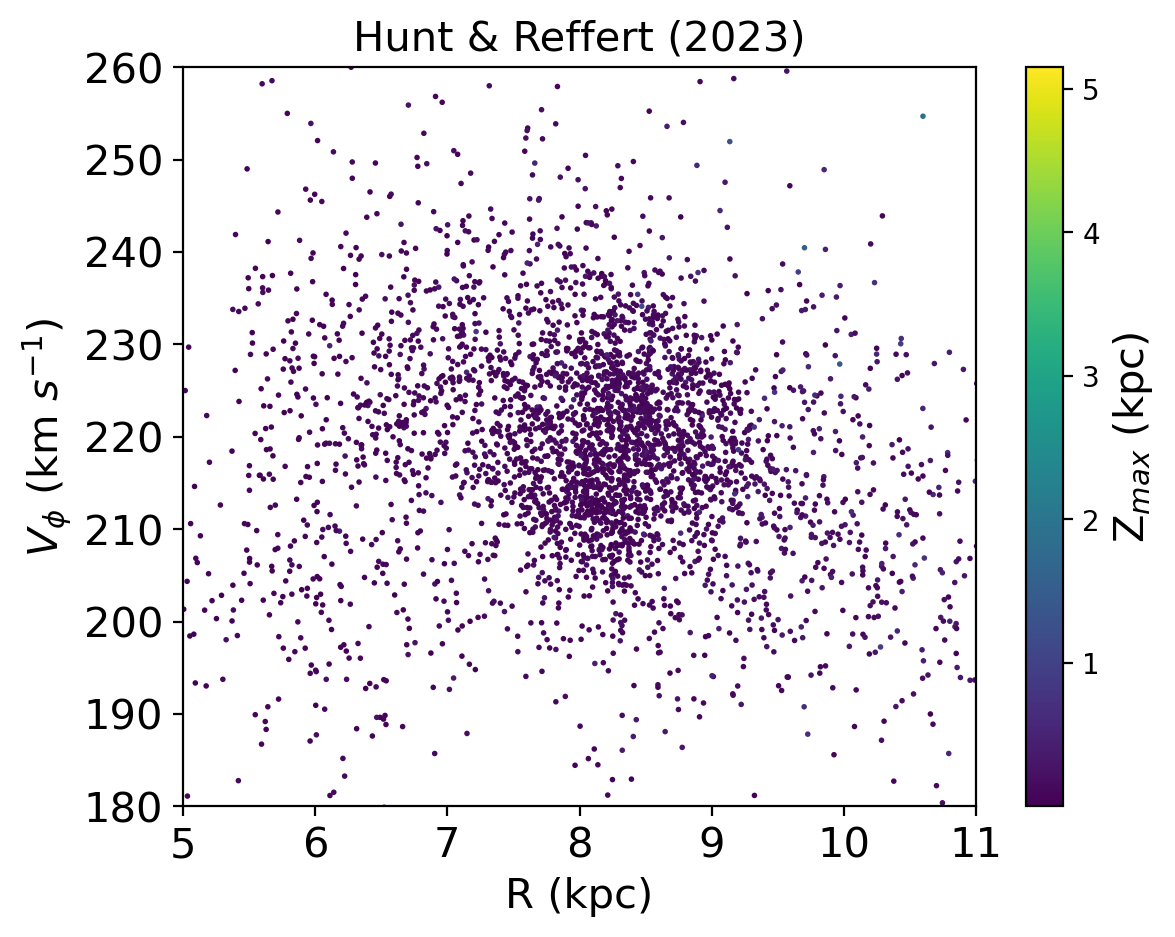
We also looked for the presence of diagonal ridges in the solar neighborhoods as found by Antoja et al. (2018). For this, we plotted the azimuthal velocity (Vϕ) of the OCs as a function of their , as shown in Fig. 13 for both the catalogs. This figure suggests that the ridges are not visible in current catalog, but they are clearly visible in HR23. Tarricq et al. (2021) also showed the involvement of OCs in ridge formation using a sample of 1382 OCs from Gaia DR2. Khanna et al. (2019), using the N-body simulation, showed that the stars located close to the Galactic midplane and having solar metallicity are involved in the prominent ridges. Fig. 13 also shows that the OCs involved in the ridge formation are orbiting at very low distances from the Galactic midplane. So, the thin-disk stars contribute to the ridge formation and support the result by Khanna et al. (2019). The ridges shown in Fig. 13 also follow the pattern shown by the field stars, which is the ridges start fading out for the larger .
5 discussion
The first contribution of this study is the catalog of 1145 OCs with updated parameters from Gaia DR3. This will be an instrumental catalog for various purposes, such as studying the OC population and exploring the properties of the Galactic disk. In this study, using the kinematic information derived from the current catalog for 1145 OCs along with 3677 OCs from HR23, we estimated the orbits of 4006 OCs. This is used to study the orbital motion of OCs and their vertical distribution in the Galactic disk. Our sample of OCs is distributed within a Galactocentric radial distance of 5 - 16 kpc, and the properties of the disk explored in this study pertain to this range. We note that the OC sample is based on data availability and, therefore, can be incomplete. The results presented in this study can reflect a bias towards nearby regions due to the unavailability of data in the other parts of the Galactic disk.
In general, the distribution of OCs perpendicular to the Galactic plane measures the scale height or thickness of the Galactic disk. The value of scale height is usually estimated from the distribution of the observed values of OCs (Bonatto et al., 2006; Joshi & Malhotra, 2023). This value will always be less than the actual height of the orbits taken by OCs in the Galaxy. In this study, we trace the actual height the OCs can achieve. The maximum height achieved by any OC in its orbit depends on its position in the disk. The OCs located in the inner part are orbiting vertically closer to the Galactic mid-plane. While, the OCs located in the outer regions of the Galactic Disk are found to gain greater vertical heights. A similar trend was found by Bonatto et al. (2006) as the scale height doubled for OCs outside compared to those inside the solar circle. Buckner & Froebrich (2014) and Joshi et al. (2016) found the scale height to increase with Galactocentric radius, and Joshi & Malhotra (2023) further confirmed the trend. Moreira et al. (2024) showed disc thickening using OCs. They concluded that the disc thickening is a consequence of disruption of OCs close to the Galactic mid-plane due to interaction with the disc. In this study, we quantified this trend by making a linear fit to vs Galactocentric radius estimation. The fit also exposed an overall flaring up of the disk beyond 10 kpc across all age groups, primarily for old OCs. The disk flaring with the was also observed by Kalberla et al. (2014); López-Corredoira & Molgó (2014); Bovy et al. (2016).
A trend between and cluster age was also found because a greater population of older OCs tends to gain higher vertical heights in their trajectories around the Galactic center. The maximum vertical distance travelled by the younger OCs is limited to a few hundred parsecs, whereas the older OCs tend to achieve 3 to 4 times the of younger OCs. We derive a relationship between and log(age) of the cluster and bring out the fact that the relation deviates for OCs older than log(age)=8.9. There are estimations of scale height for different age groups and indications that the scale height increases for older OCs in the literature such as 74 5 pc for OCs of 100 Myr by Cantat-Gaudin et al. (2020), 70.5 2.3 pc for OCs younger than 20 Myr and 87.4 3.6 pc for 20-100 Myr OCs by Hao et al. (2021), and 91.7 1.9 pc for OCs younger than 700 Myr by Joshi & Malhotra (2023).
In the case of OCs older than 800 Myr, the median value of shoots to 221 pc.
The value of is a function of both age and Galactocentric radius and shows a positive trend. Over and above this dependency, we detect specific jumps in for OCs older than log(age) = 8.9 and OCs located beyond 10 kpc, along with two noticeable bumps at 8 and 9.5 kpc. Recently, Uppal et al. (2024) found evidence for warp and flare of the old Galactic disk as traced by red clump stars. They found the scale height of the disk to range from 380 pc in the Solar neighborhood to 2.5 kpc at a Galactocentric radius of 15 kpc. In this study, the highest value of is found to be 2.75 kpc.
We noticed that OCs, specifically in the inter-arm regions of the disk, have higher values than OCs near or within the spiral arms. We also checked for the possibility of an observation bias and found that the number density of OCs at a distance of 8.0 and 9.5 kpc from the galactic center is lower than other regions of the (the highest being just before the local arm at a radius of 8.3 kpc from the Galactic center). These excursions in the Z-direction may also be due to some correlation between the newly discovered phase space spiral and the vertical heights of the OCs. We have not explored this aspect in this study, but it could be done in the future.
The patterns identified in this analysis might relate to the already known warps in the Galactic Disk. We then investigated this possibility and found a higher in the second and third Galactic quadrants. Studies by López-Corredoira et al. (2002); Momany et al. (2006); Reylé, C. et al. (2009) and He (2023) found Galactic warp in the same region of the Galaxy. This coincidence may suggest that due to the presence of warp in the galactic disk, the OCs are able to orbit at a higher distance from it.
The overall nature of the results obtained using the sample of OCs from current catalog and HR23 are similar, with a small difference in the minute details. Both samples show disc flaring in the outer regions, which is mainly caused by the older population of OCs. The sudden jump in the at R 9.5 kpc is visible in both the samples, while the jump at R 8 kpc observed for OCs in current catalog is not so prominent for OCs in HR23. Compared to the current catalog, most of the new OCs included in the HR23 are located in the solar neighborhood, hence giving rise to OCs between 8 8.5 kpc. The number of OCs at R 9.5 are similar in both catalogs, showing the same distribution. The distribution of maximum height attained by the OCs as a function of the is also more or less similar. The diagonal ridges in the solar neighborhood are visible using the OCs from HR23, suggesting that the younger OCs contribute to ridge formation. This is consistent with the results obtained by Khanna et al. (2019) using N-body simulations.
The sample studied here shows fewer older OCs inner to the Solar circle and more outside, whereas the intermediate and young OCs are similarly distributed. This may point to an efficient destruction of older OCs in the inner regions, leading to better survival in the outer disk. The larger values of found for older OCs at all Galactic radii may point to a particular kinematic perturbation around 1 Gyr, resulting in either a heating of the disk or a kinematically decoupled population.
6 Summary
In this study, we updated the OC catalog by Cantat-Gaudin et al. (2020) based on Gaia DR2 by incorporating the data from Gaia DR3. This catalog consists of the fundamental properties of 1145 OCs, such as position, proper motion, radial velocity, distance, and age. This sample is accompanied by 3677 OCs from the catalog presented by Hunt & Reffert (2023). Using this extensive sample of 4006 OCs (816 in common), we studied their distribution and motion in the Galaxy. As the parameters of OCs differ between these catalogs, the analysis is presented for both the samples separately. We estimated their orbital parameters such as eccentricity, perigalactic and apogalactic distance and the maximum vertical height traced from the Galactic disk (Zmax) by deriving their orbits in the Galaxy. The main findings of this paper are summarised as follows:
-
1.
The number distribution for OCs younger than 1 Gyr appear to be similar across the Galactocentric radial distance. In the case of OCs older than 1 Gyr, we note a radially extended distribution, with older OCs in the outer part of the disk.
-
2.
OCs younger than 1 Gyr have a very similar distribution of vertical height, whereas OCs older than 1 Gyr can reach significantly higher vertical heights. The maximum vertical height, , of the OCs is a function of age and Galactocentric radius. We derive relations for this dependency for the first time.
-
3.
The value of is the lowest for young OCs (age 50 Myr - 263 OCs). The intermediate age ( 50 Myr age 1 Gyr - 700 OCs) and the old cluster (age 1 Gyr - 182 OCs) show larger values for the maximum vertical heights. We also note a distinct pattern in the for the three age groups. We note that the two younger age groups show a similar pattern up to a radius of 9 kpc, beyond which the age group show larger values for . The oldest age group also appears to have a differing pattern beyond 9 kpc, with the peak-like feature at a radius of 11 kpc. The pattern shown by the intermediate and the old age group of the OCs suggests a flaring of the disk beyond a radius of 9 kpc.
-
4.
For OCs younger than 10 Myr, median is 63 pc; OCs in the age range 10 - 100 reach a median of 69 pc; OCs in the 100 - 800 Myr reach a of 100 pc and OCs older than 800 Myr have a median of 221 pc. Therefore, we observe that the value of increases as a function of the cluster’s age.
-
5.
We note that at two radial distance values (8 kpcs and 9.5 kpc), the value of jumps by nearly 20-30 pc. This increased value of has a width not more than 500 pc at the values mentioned above of the .
-
6.
The variation of as a function of the suggests that the OCs between and have an increased . Also, the peak of the distribution tends to point to the third quadrant more than the second quadrant. We speculate that the higher in these quadrants is related to the already identified warp in these regions of the Galactic disk.
-
7.
This study also shows that the OCs are involved in the diagonal ridges observed in the solar neighborhood and are occupied mainly by the young OCs.
Acknowledgements
AS acknowledges the support from SERB Power fellowship. This work has made use of data from the European Space Agency (ESA) mission Gaia (https://www.cosmos.esa.int/gaia), processed by the Gaia Data Processing and Analysis Consortium (DPAC, https://www.cosmos.esa.int/web/gaia/dpac/consortium). Funding for the DPAC has been provided by national institutions, in particular, the institutions participating in the Gaia Multilateral Agreement.
Data Availability
We have used the publicly available Gaia DR3 catalog, which can be accessed from: https://gea.esac.esa.int/archive/
The complete electronic tables will be provided after the acceptance of the paper.
References
- Antoja et al. (2018) Antoja, T., Helmi, A., Romero-Gómez, M., et al. 2018, Nature, 561, 360, doi: 10.1038/s41586-018-0510-7
- Belokurov et al. (2018) Belokurov, V., Erkal, D., Evans, N. W., Koposov, S. E., & Deason, A. J. 2018, MNRAS, 478, 611, doi: 10.1093/mnras/sty982
- Bonatto et al. (2006) Bonatto, C., Kerber, L. O., Bica, E., & Santiago, B. X. 2006, A&A, 446, 121, doi: 10.1051/0004-6361:20053573
- Bossini et al. (2019) Bossini, D., Vallenari, A., Bragaglia, A., et al. 2019, A&A, 623, A108, doi: 10.1051/0004-6361/201834693
- Bovy (2015) Bovy, J. 2015, ApJS, 216, 29, doi: 10.1088/0067-0049/216/2/29
- Bovy et al. (2016) Bovy, J., Rix, H.-W., Schlafly, E. F., et al. 2016, ApJ, 823, 30, doi: 10.3847/0004-637X/823/1/30
- Bovy & Tremaine (2012) Bovy, J., & Tremaine, S. 2012, The Astrophysical Journal, 756, 89
- Buckner & Froebrich (2014) Buckner, A. S. M., & Froebrich, D. 2014, MNRAS, 444, 290, doi: 10.1093/mnras/stu1440
- Cantat-Gaudin et al. (2018a) Cantat-Gaudin, T., Vallenari, A., Sordo, R., et al. 2018a, A&A, 615, A49, doi: 10.1051/0004-6361/201731251
- Cantat-Gaudin et al. (2018b) Cantat-Gaudin, T., Jordi, C., Vallenari, A., et al. 2018b, A&A, 618, A93, doi: 10.1051/0004-6361/201833476
- Cantat-Gaudin et al. (2020) Cantat-Gaudin, T., Anders, F., Castro-Ginard, A., et al. 2020, A&A, 640, A1, doi: 10.1051/0004-6361/202038192
- Cardone et al. (2005) Cardone, V., Piedipalumbo, E., & Tortora, C. 2005, Monthly Notices of the Royal Astronomical Society, 358, 1325
- Castro-Ginard et al. (2021) Castro-Ginard, A., McMillan, P. J., Luri, X., et al. 2021, A&A, 652, A162, doi: 10.1051/0004-6361/202039751
- Dias et al. (2021) Dias, W. S., Monteiro, H., Moitinho, A., et al. 2021, MNRAS, 504, 356, doi: 10.1093/mnras/stab770
- Friel (1995) Friel, E. D. 1995, ARA&A, 33, 381, doi: 10.1146/annurev.aa.33.090195.002121
- Gaia Collaboration et al. (2016) Gaia Collaboration, Prusti, T., de Bruijne, J. H. J., et al. 2016, A&A, 595, A1, doi: 10.1051/0004-6361/201629272
- Gaia Collaboration et al. (2023) Gaia Collaboration, Vallenari, A., Brown, A. G. A., et al. 2023, A&A, 674, A1, doi: 10.1051/0004-6361/202243940
- Hao et al. (2021) Hao, C. J., Xu, Y., Hou, L. G., et al. 2021, A&A, 652, A102, doi: 10.1051/0004-6361/202140608
- He (2023) He, Z. 2023, ApJ, 954, L9, doi: 10.3847/2041-8213/ace77d
- Helmi (2020) Helmi, A. 2020, ARA&A, 58, 205, doi: 10.1146/annurev-astro-032620-021917
- Helmi et al. (2018) Helmi, A., Babusiaux, C., Koppelman, H. H., et al. 2018, Nature, 563, 85, doi: 10.1038/s41586-018-0625-x
- Holmberg & Flynn (2000) Holmberg, J., & Flynn, C. 2000, Monthly Notices of the Royal Astronomical Society, 313, 209
- Hunt & Reffert (2023) Hunt, E. L., & Reffert, S. 2023, A&A, 673, A114, doi: 10.1051/0004-6361/202346285
- Joshi et al. (2016) Joshi, Y. C., Dambis, A. K., Pandey, A. K., & Joshi, S. 2016, A&A, 593, A116, doi: 10.1051/0004-6361/201628944
- Joshi & Malhotra (2023) Joshi, Y. C., & Malhotra, S. 2023, AJ, 166, 170, doi: 10.3847/1538-3881/acf7c8
- Kalberla et al. (2014) Kalberla, P. M. W., Kerp, J., Dedes, L., & Haud, U. 2014, ApJ, 794, 90, doi: 10.1088/0004-637X/794/1/90
- Khanna et al. (2019) Khanna, S., Sharma, S., Tepper-Garcia, T., et al. 2019, MNRAS, 489, 4962, doi: 10.1093/mnras/stz2462
- Lada & Lada (2003) Lada, C. J., & Lada, E. A. 2003, Annual Review of Astronomy and Astrophysics, 41, 57
- Lindegren et al. (2016) Lindegren, L., Lammers, U., Bastian, U., et al. 2016, A&A, 595, A4, doi: 10.1051/0004-6361/201628714
- López-Corredoira et al. (2002) López-Corredoira, M., Cabrera-Lavers, A., Garzón, F., & Hammersley, P. L. 2002, A&A, 394, 883, doi: 10.1051/0004-6361:20021175
- López-Corredoira & Molgó (2014) López-Corredoira, M., & Molgó, J. 2014, A&A, 567, A106, doi: 10.1051/0004-6361/201423706
- Malhan et al. (2018) Malhan, K., Ibata, R. A., & Martin, N. F. 2018, MNRAS, 481, 3442, doi: 10.1093/mnras/sty2474
- Miyamoto & Nagai (1975) Miyamoto, M., & Nagai, R. 1975, PASJ, 27, 533
- Momany et al. (2006) Momany, Y., Zaggia, S., Gilmore, G., et al. 2006, A&A, 451, 515, doi: 10.1051/0004-6361:20054081
- Moreira et al. (2024) Moreira, S., Moitinho, A., Silva, A., & Almeida, D. 2024, arXiv e-prints, arXiv:2406.14661, doi: 10.48550/arXiv.2406.14661
- Myeong et al. (2019) Myeong, G. C., Vasiliev, E., Iorio, G., Evans, N. W., & Belokurov, V. 2019, MNRAS, 488, 1235, doi: 10.1093/mnras/stz1770
- Navarro et al. (1997) Navarro, J. F., Frenk, C. S., & White, S. D. M. 1997, ApJ, 490, 493, doi: 10.1086/304888
- Re Fiorentin et al. (2021) Re Fiorentin, P., Spagna, A., Lattanzi, M. G., & Cignoni, M. 2021, ApJ, 907, L16, doi: 10.3847/2041-8213/abd53d
- Reylé, C. et al. (2009) Reylé, C., Marshall, D. J., Robin, A. C., & Schultheis, M. 2009, A&A, 495, 819, doi: 10.1051/0004-6361/200811341
- Sestito et al. (2020) Sestito, F., Martin, N. F., Starkenburg, E., et al. 2020, MNRAS, 497, L7, doi: 10.1093/mnrasl/slaa022
- Tarricq et al. (2021) Tarricq, Y., Soubiran, C., Casamiquela, L., et al. 2021, A&A, 647, A19, doi: 10.1051/0004-6361/202039388
- Uppal et al. (2024) Uppal, N., Ganesh, S., & Schultheis, M. 2024, MNRAS, 527, 4863, doi: 10.1093/mnras/stad3525
- Xue et al. (2008) Xue, X., Rix, H., Zhao, G., et al. 2008, The Astrophysical Journal, 684, 1143
- Zhang et al. (2013) Zhang, L., Rix, H.-W., van de Ven, G., et al. 2013, The Astrophysical Journal, 772, 108, doi: 10.1088/0004-637X/772/2/108