Hierarchical Reinforced Trader (HRT): A Bi-Level Approach for Optimizing Stock Selection and Execution
Abstract.
Leveraging Deep Reinforcement Learning (DRL) in automated stock trading has shown promising results, yet its application faces significant challenges, including the curse of dimensionality, inertia in trading actions, and insufficient portfolio diversification. Addressing these challenges, we introduce the Hierarchical Reinforced Trader (HRT), a novel trading strategy employing a bi-level Hierarchical Reinforcement Learning framework. The HRT integrates a Proximal Policy Optimization (PPO)-based High-Level Controller (HLC) for strategic stock selection with a Deep Deterministic Policy Gradient (DDPG)-based Low-Level Controller (LLC) tasked with optimizing trade executions to enhance portfolio value. In our empirical analysis, comparing the HRT agent with standalone DRL models and the S&P 500 benchmark during both bullish and bearish market conditions, we achieve a positive and higher Sharpe ratio. This advancement not only underscores the efficacy of incorporating hierarchical structures into DRL strategies but also mitigates the aforementioned challenges, paving the way for designing more profitable and robust trading algorithms in complex markets.
1. Introduction
Profitable automated stock trading strategies are pivotal for investment companies and hedge funds. A classical method is Harry Markowitz’s Modern Portfolio Theory (MPT) (Markowitz, 1952), which determines the optimal portfolio allocation by calculating the expected returns and the covariance matrix of stock prices. This optimization aims to either maximize returns for a given risk level or minimize risk for a specified return range. However, implementing MPT can be complex, especially when portfolio managers wish to dynamically adjust decisions at each time step and consider additional factors. An alternative approach models the stock trading problem as a Markov Decision Process (MDP) (Bertsekas, 2012), solved using dynamic programming. Nevertheless, this model’s scalability is constrained by the expansive state spaces inherent in real stock markets.
Recent research has turned to Deep Reinforcement Learning (DRL) methods for stock trading (Yang et al., 2020; Kabbani and Duman, 2022). DRL overcomes scalability issues by using deep neural networks to approximate complex functions, solving MDPs without the limitations of traditional models. Liu, Xiao-Yang, et al. (Liu et al., 2018) formalize the stock trading problem as an MDP and employ Deep Deterministic Policy Gradient (DDPG) (Lillicrap et al., 2015) to discover optimal trading strategies that yield higher cumulative returns and Sharpe ratios in the volatile stock market. Subsequent research integrates the strengths of DDPG, Proximal Policy Optimization (PPO) (Schulman et al., 2017), and Advantage Actor Critic (A2C) (Mnih et al., 2016) into an ensemble strategy (Yang et al., 2020), adapting robustly to varying market conditions. Despite these advancements, several challenges persist in applying DRL to stock trading:
-
•
Curse of Dimensionality: The computational complexity, sample inefficiency, and potential training instability escalate as the number of stocks increases, expanding the dimensionality of data and the state and action spaces exponentially. For instance, if the action for a single stock is defined as , representing sell, hold, and buy actions, the action space becomes , where is the number of market stocks. This complexity has limited the validation of current research to a small asset scale, ranging from Dow Jones 30 constituent stocks to only tens of assets.
-
•
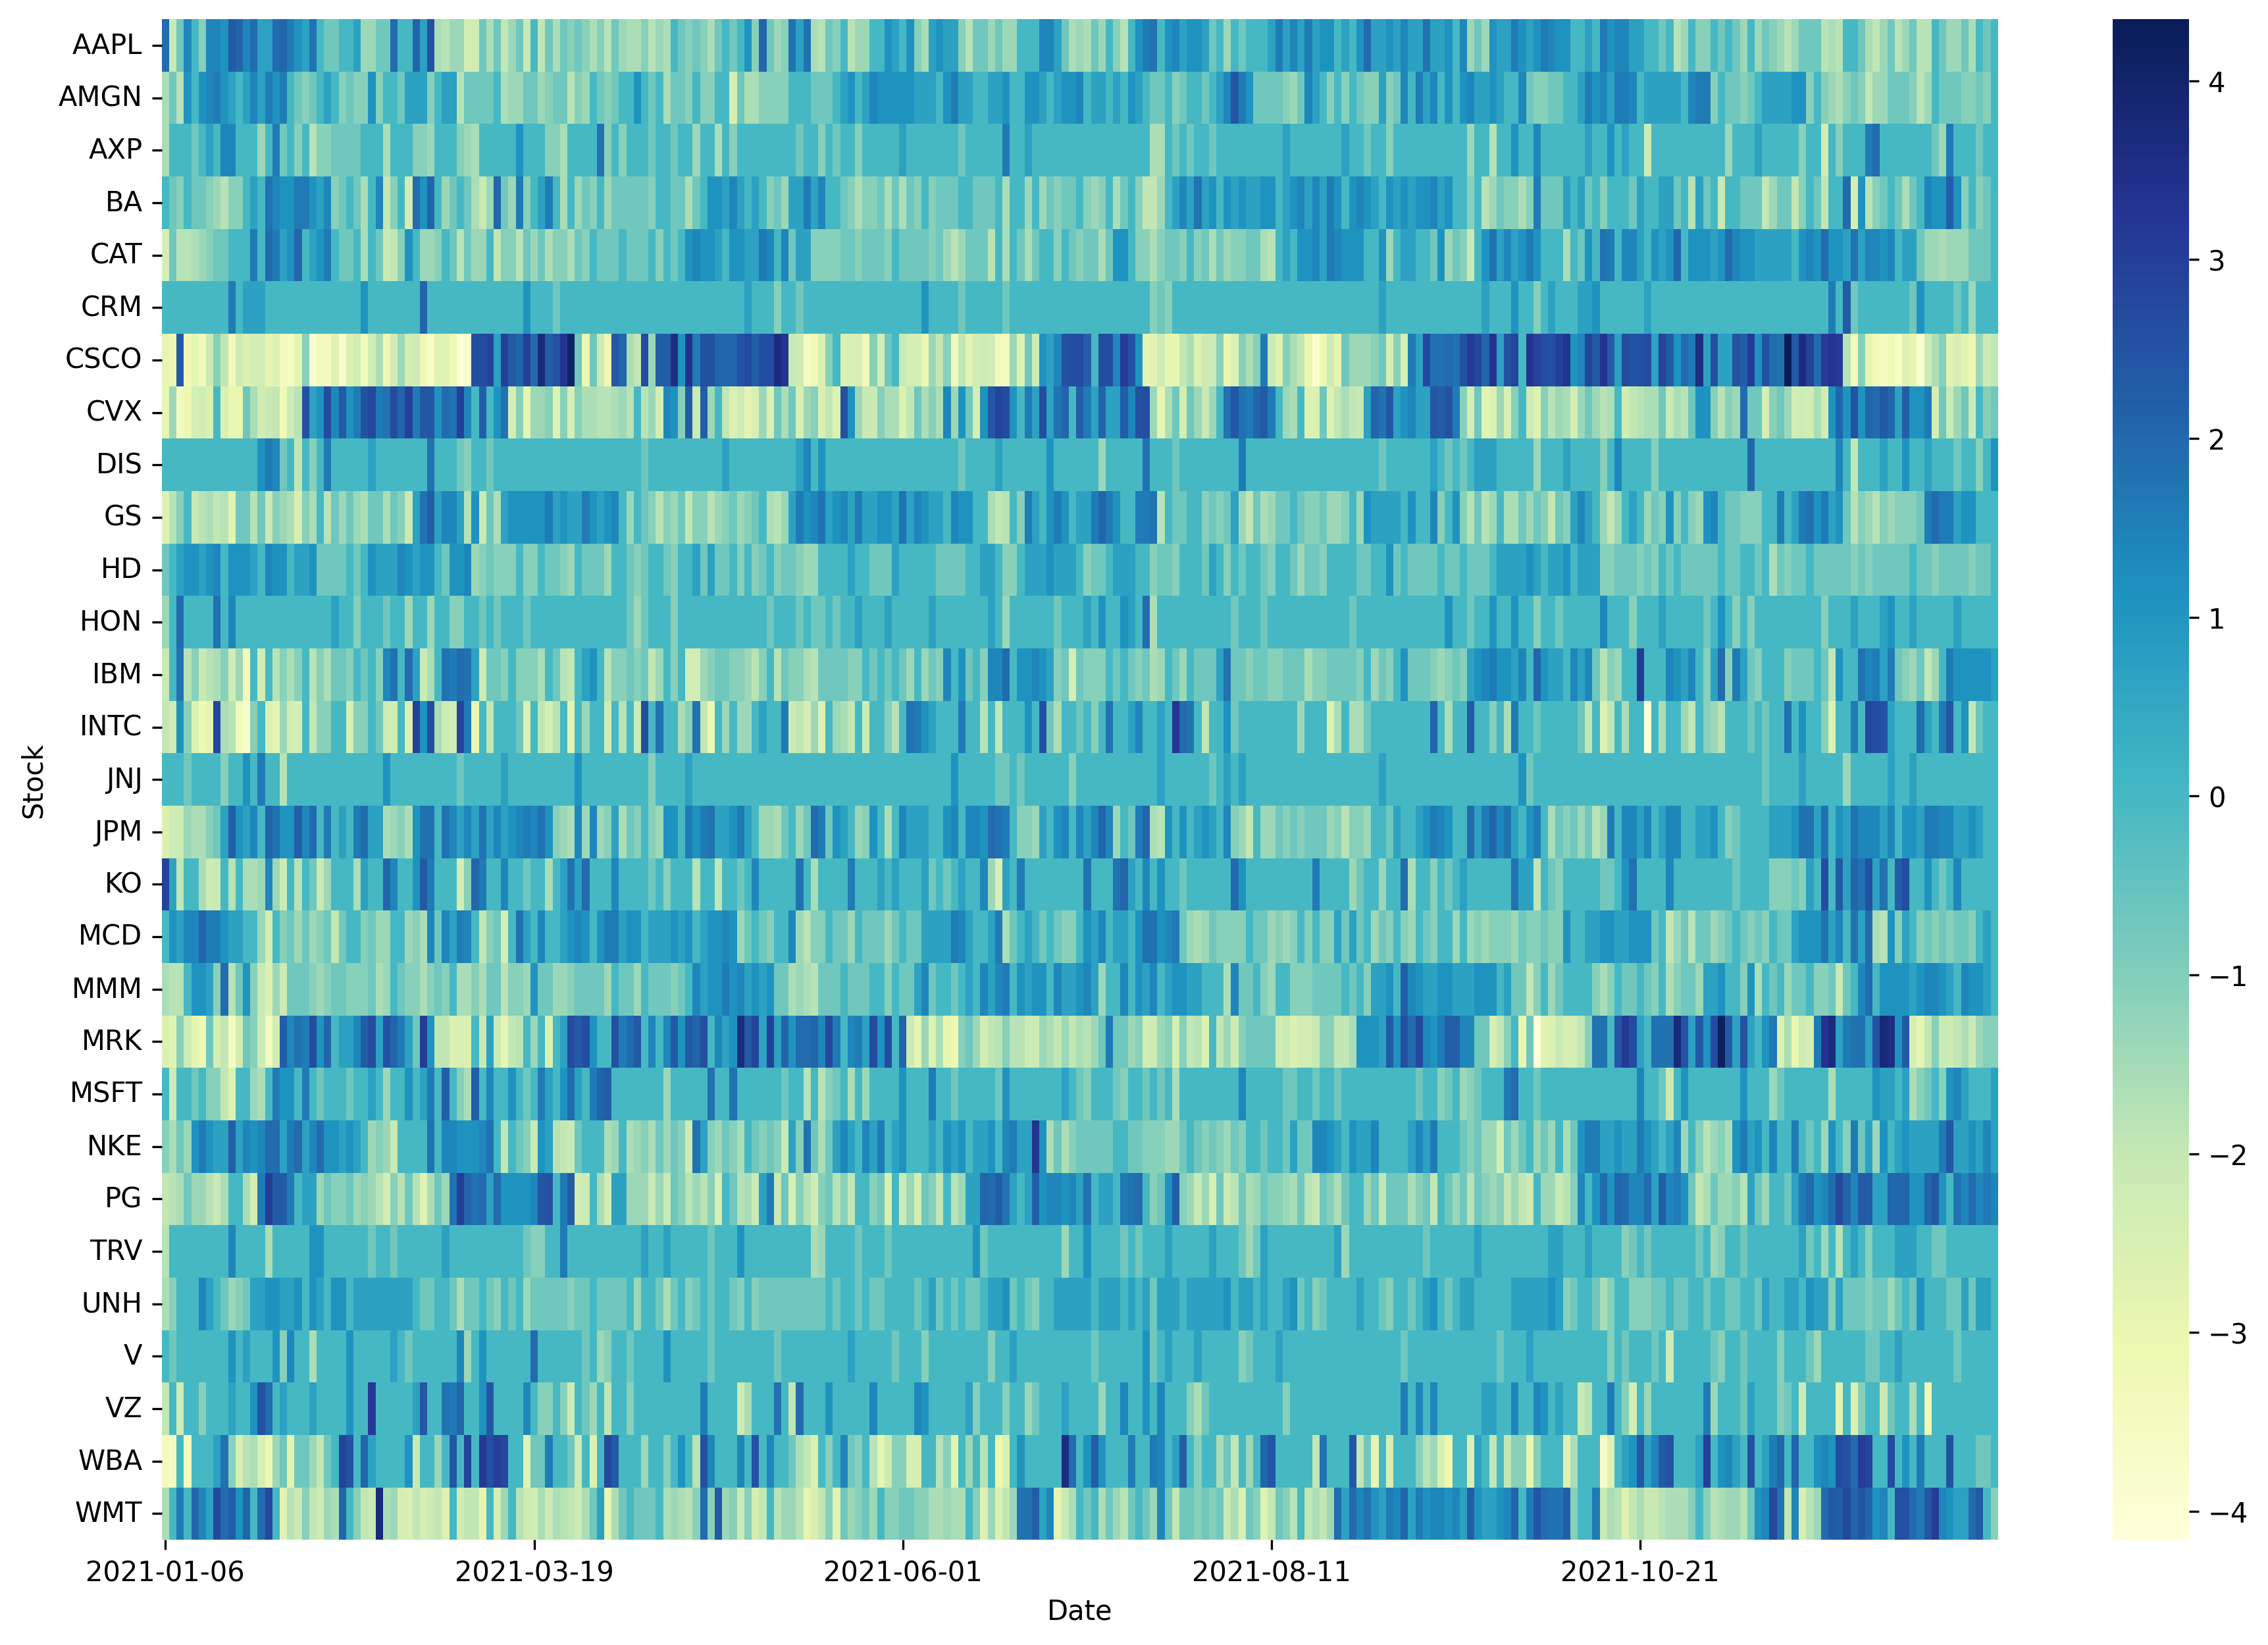
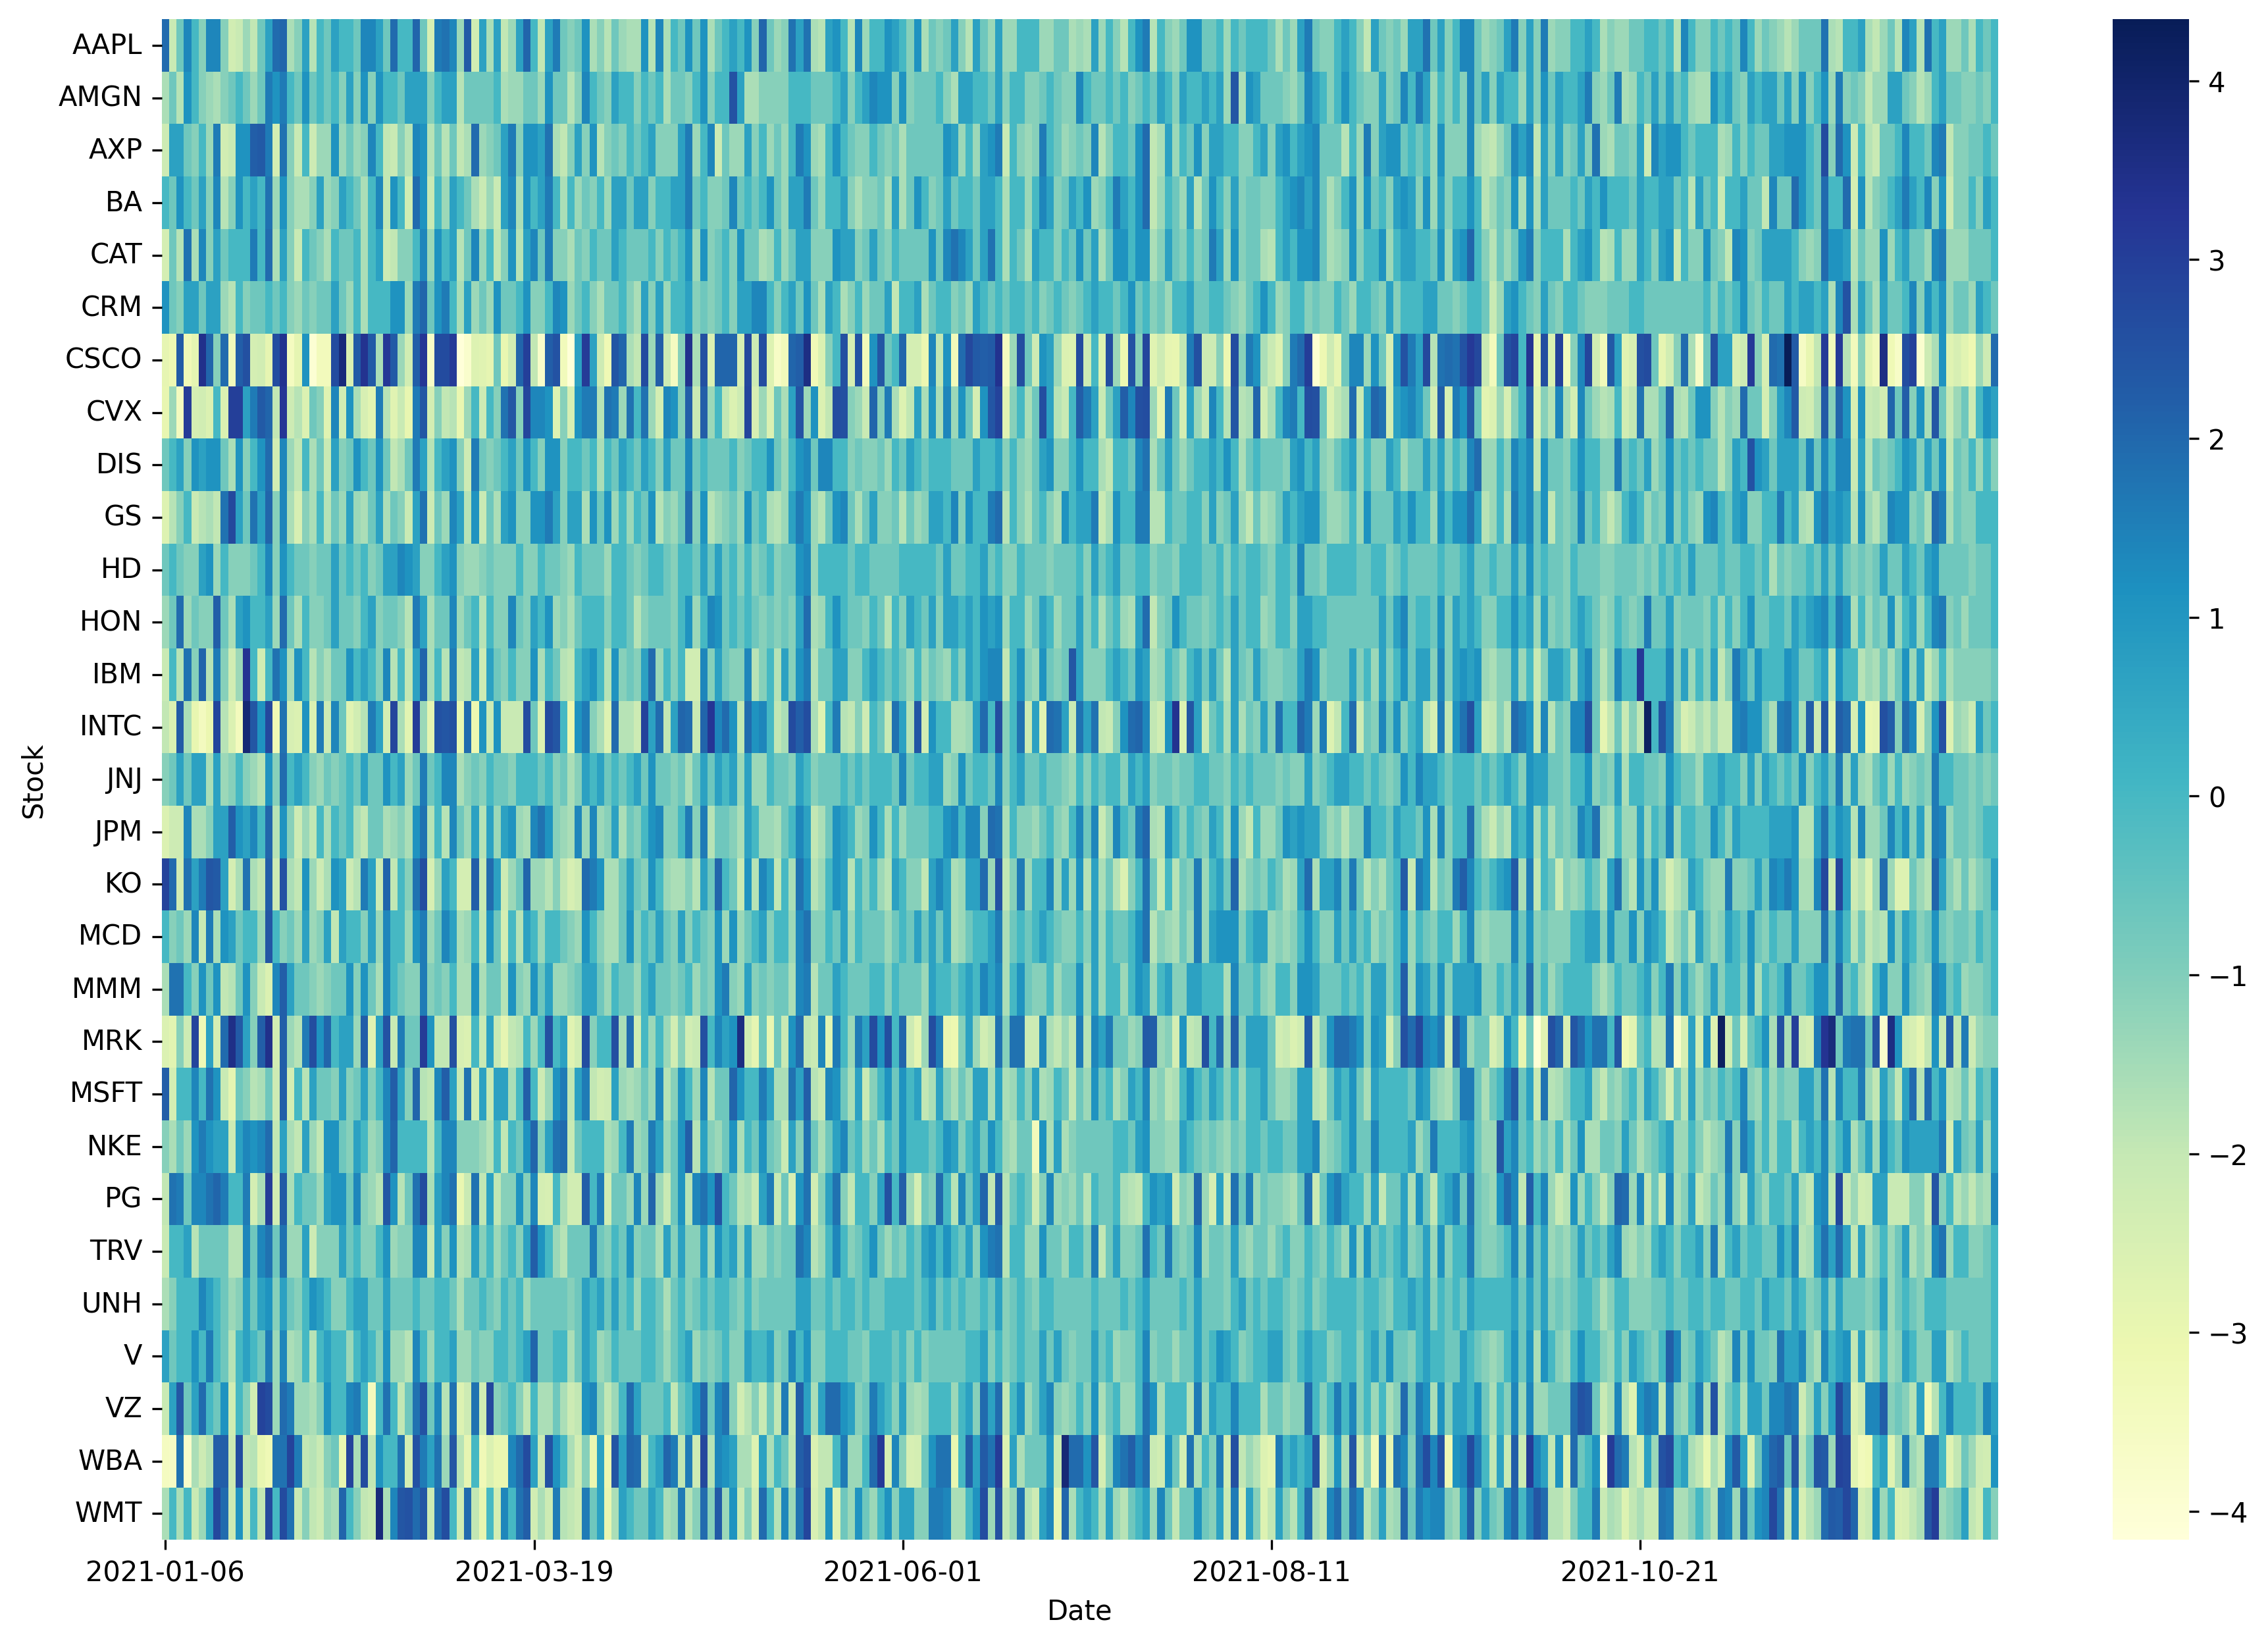
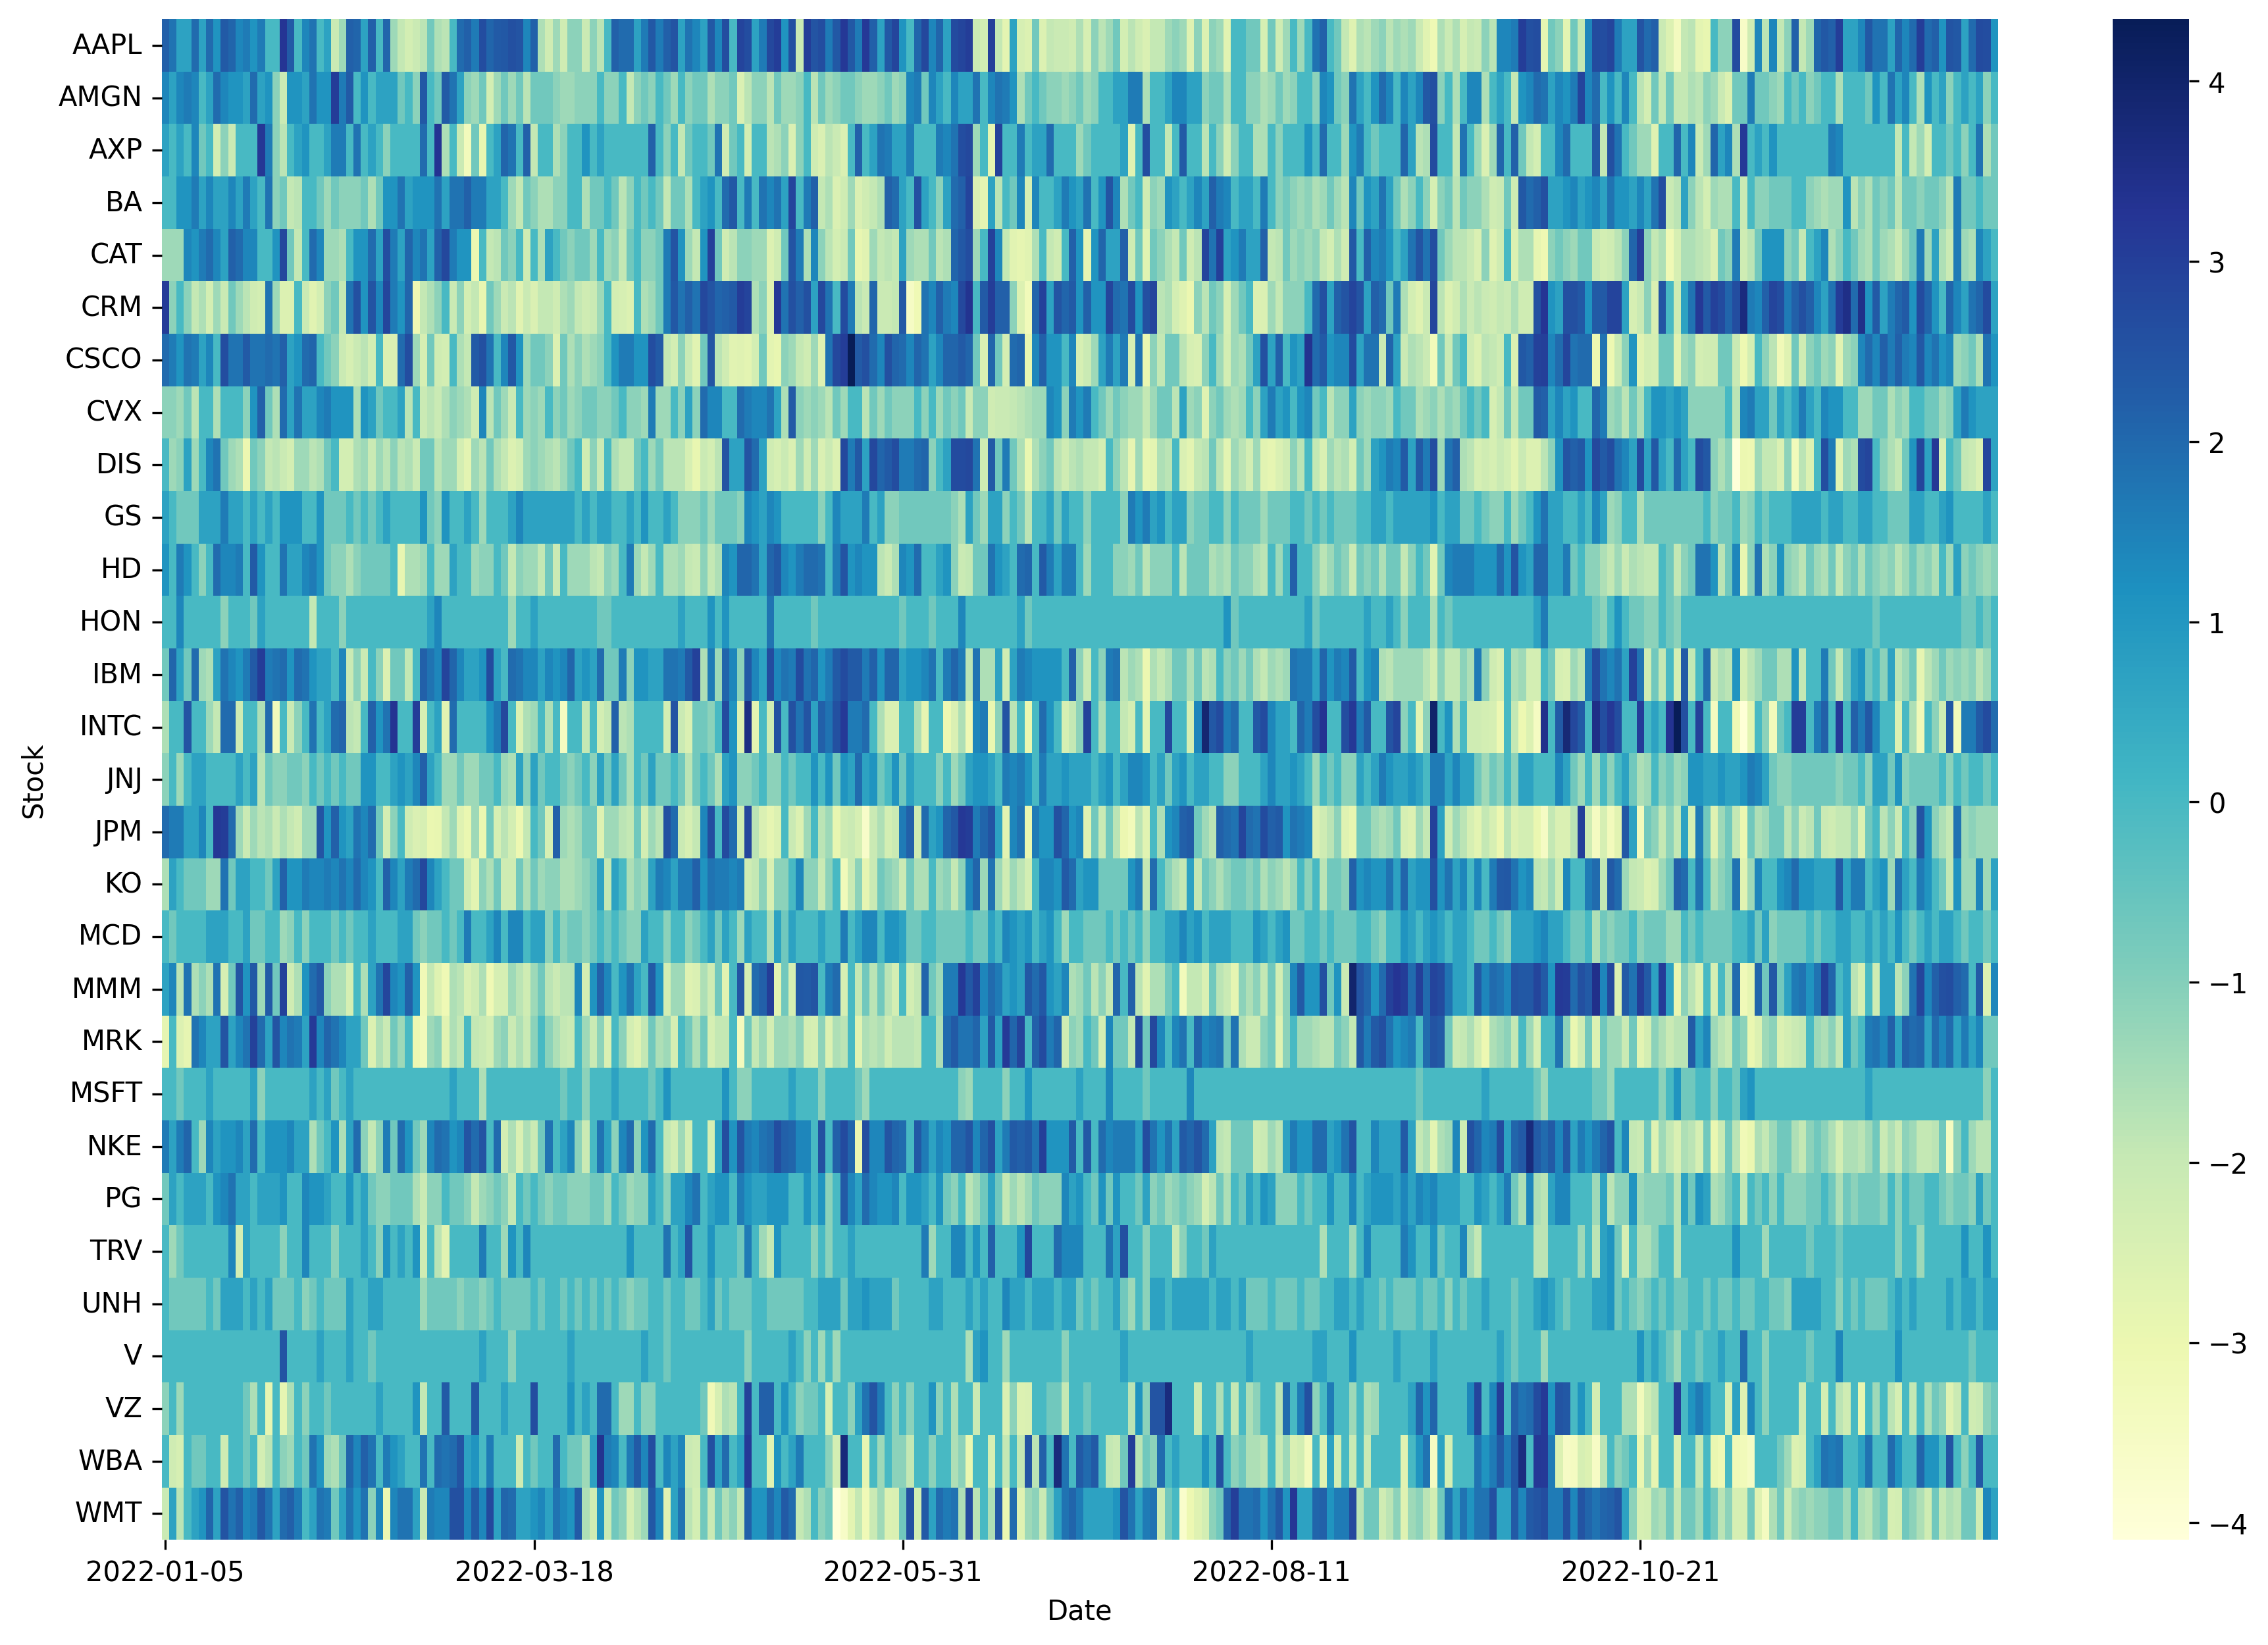
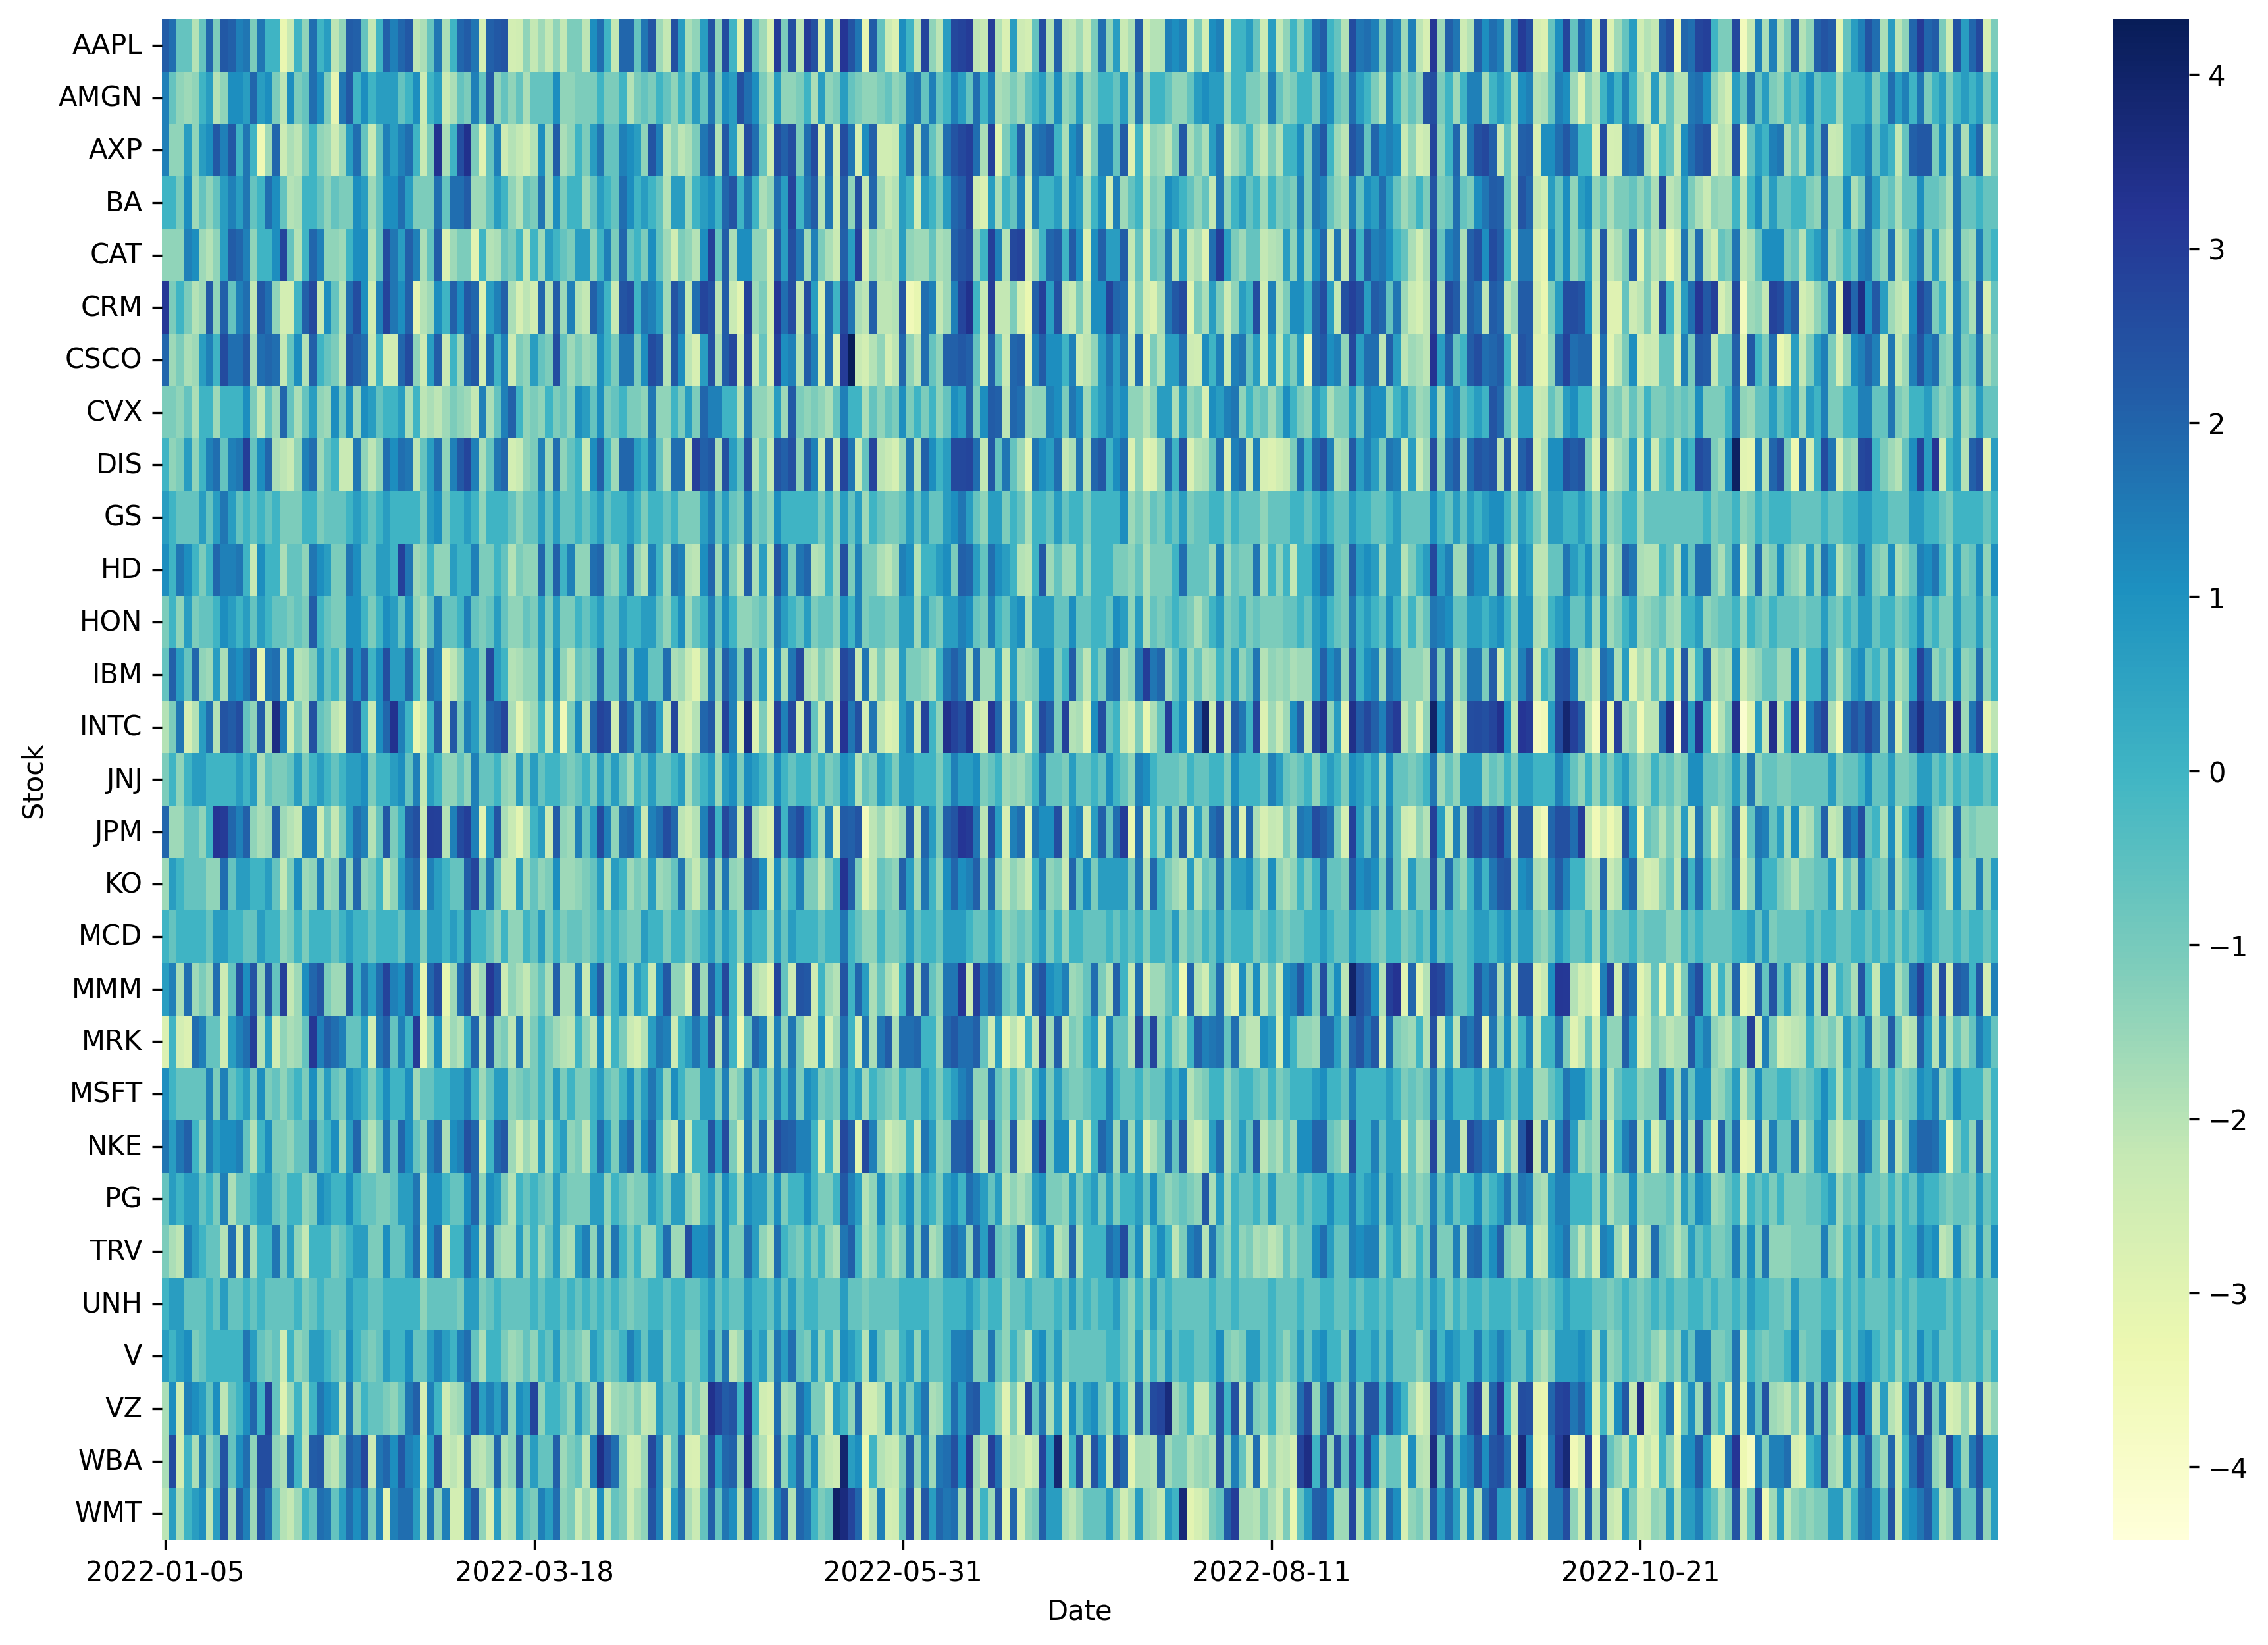
Inertia or Momentum Effect: DRL agents tend to repeat a previous action (buy, sell, or hold) based on the reward received, without necessarily considering the currently most profitable action. If an agent receives a large reward for a particular action (buy, sell, or hold), it may exploit this action in subsequent steps. Even though DDPG introduces action exploration through the addition of noise to the actions selected by its deterministic policy, we still observe crowded or clustered trading operations in Figure 1 under the example of Dow Jones 30 constituent stocks portfolio.
-
•
Insufficient Diversification: Diversification, a core principle of finance aimed at risk mitigation, is compromised when DRL agents focus repeatedly on a narrow selection of stocks. This behavior, evidenced in Figure 1, increases exposure to sector-specific risks, making the portfolio more susceptible to adverse developments within those sectors.
To mitigate the three issues mentioned above and to enhance performance and deliver superior trading strategies, we introduce the Hierarchical Reinforced Trader (HRT), an innovative approach to stock trading that utilizes a Hierarchical Reinforcement Learning (HRL) framework (Pateria et al., 2021). Our HRT agent is structured around two principal components, each serving distinct but complementary roles in the trading strategy: (1) High-Level Controller (HLC): Positioned at the strategic apex of the hierarchy, the HLC’s mandate is to determine the subset of stocks to buy, sell, or hold, effectively executing stock selection. (2) Low-Level Controller (LLC): ollowing the HLC’s directives, the LLC is tasked with refining these decisions by optimizing the trade volumes for the selected stocks, thereby determining the optimal number of shares to transact. By dividing the trading strategy into high-level stock selection and low-level trade execution, the HRT agent demonstrates potential for substantial performance improvements and the ability to address traditional challenges. Our primary contributions include:
-
•
Introducing a novel HRT agent utilizing the Hierarchical Reinforcement Learning (HRL) framework, and proposing an algorithm named Phased Alternating Training to jointly train the HLC and LLC.
-
•
By testing and validating our results on a substantially larger stock pool, the S&P 500, we consistently demonstrated a positive and higher Sharpe ratio compared to standalone DDPG and PPO approaches across various market conditions.
-
•
While a few studies have explored the application of Hierarchical Reinforcement Learning (HRL) in stock trading and portfolio management (Han et al., 2023; Qin et al., 2024; Wang et al., 2020), to our knowledge, this work is the first to elucidate how integrating the HRL framework with DRL agents can effectively mitigate the issues previously discussed.
2. Related Work
2.1. Deep Reinforcement Learning for Trading
Deep Reinforcement Learning (DRL) has significantly advanced the automation of stock trading, offering dynamic optimization through continuous market interaction, recognizing complex non-linear patterns, and integrating intermediate stages (e.g., modeling, trading signal generation, portfolio optimization, and trade execution) within a singular DRL framework (Liu et al., 2024). Prior studies have experimented with various DRL approaches, including Proximal Policy Optimization (PPO) (Schulman et al., 2017), Advantage Actor Critic (A2C) (Mnih et al., 2016), and Deep Deterministic Policy Gradient (DDPG) (Lillicrap et al., 2015), alongside its enhancement, Twin Delayed DDPG (TD3) (Fujimoto et al., 2018). Subsequent research has explored ensemble strategies, demonstrating superior performance over individual DRL agents (Yang et al., 2020). Expanding DRL with additional information, such as incorporating optimistic or pessimistic reinforcement learning influenced by prediction errors, has shown promising directions (Li et al., 2019). Moreover, enriching state representations with more features or signals has proven beneficial for agents to grasp market dynamics more effectively. Adaptive DDPG extensions, including sentiment-aware approaches, have enhanced the model’s robustness (Koratamaddi et al., 2021). Combining sentiment analysis and knowledge graphs further refines algorithmic trading strategies (Nan et al., 2022). A comprehensive review of these advancements is provided in (Millea, 2021).
2.2. Hierarchical Reinforcement Learning
DRL works well on a wide range of problems where the state space and action space are reasonably small. However, there are certain problems where DRL is insufficient or takes too much time to train. Hierarchical Reinforcement Learning (HRL) offers a divide-and-conquer strategy, segmenting overarching problems into more tractable subproblems. HRL decomposes decision-making into hierarchical policies: high-level policies focus on coarse-grained decisions, while low-level policies attend to fine-grained, detailed actions. This layered approach aids in navigating large action spaces more efficiently. There is limited research on HRL in trading, but some research exist. Wang, Rundong, et al. (Wang et al., 2020) have developed a hierarchical reinforced stock trading system for portfolio management, where a high-level policy allocates portfolio weights to maximize long-term profits, and a low-level policy optimizes share transactions within shorter windows to reduce trading costs. There are also HRL systems developed for specialized trading tasks, like High Frequency Trading (Qin et al., 2024), and Pair Trading (Han et al., 2023).
3. Methodology
3.1. Overview
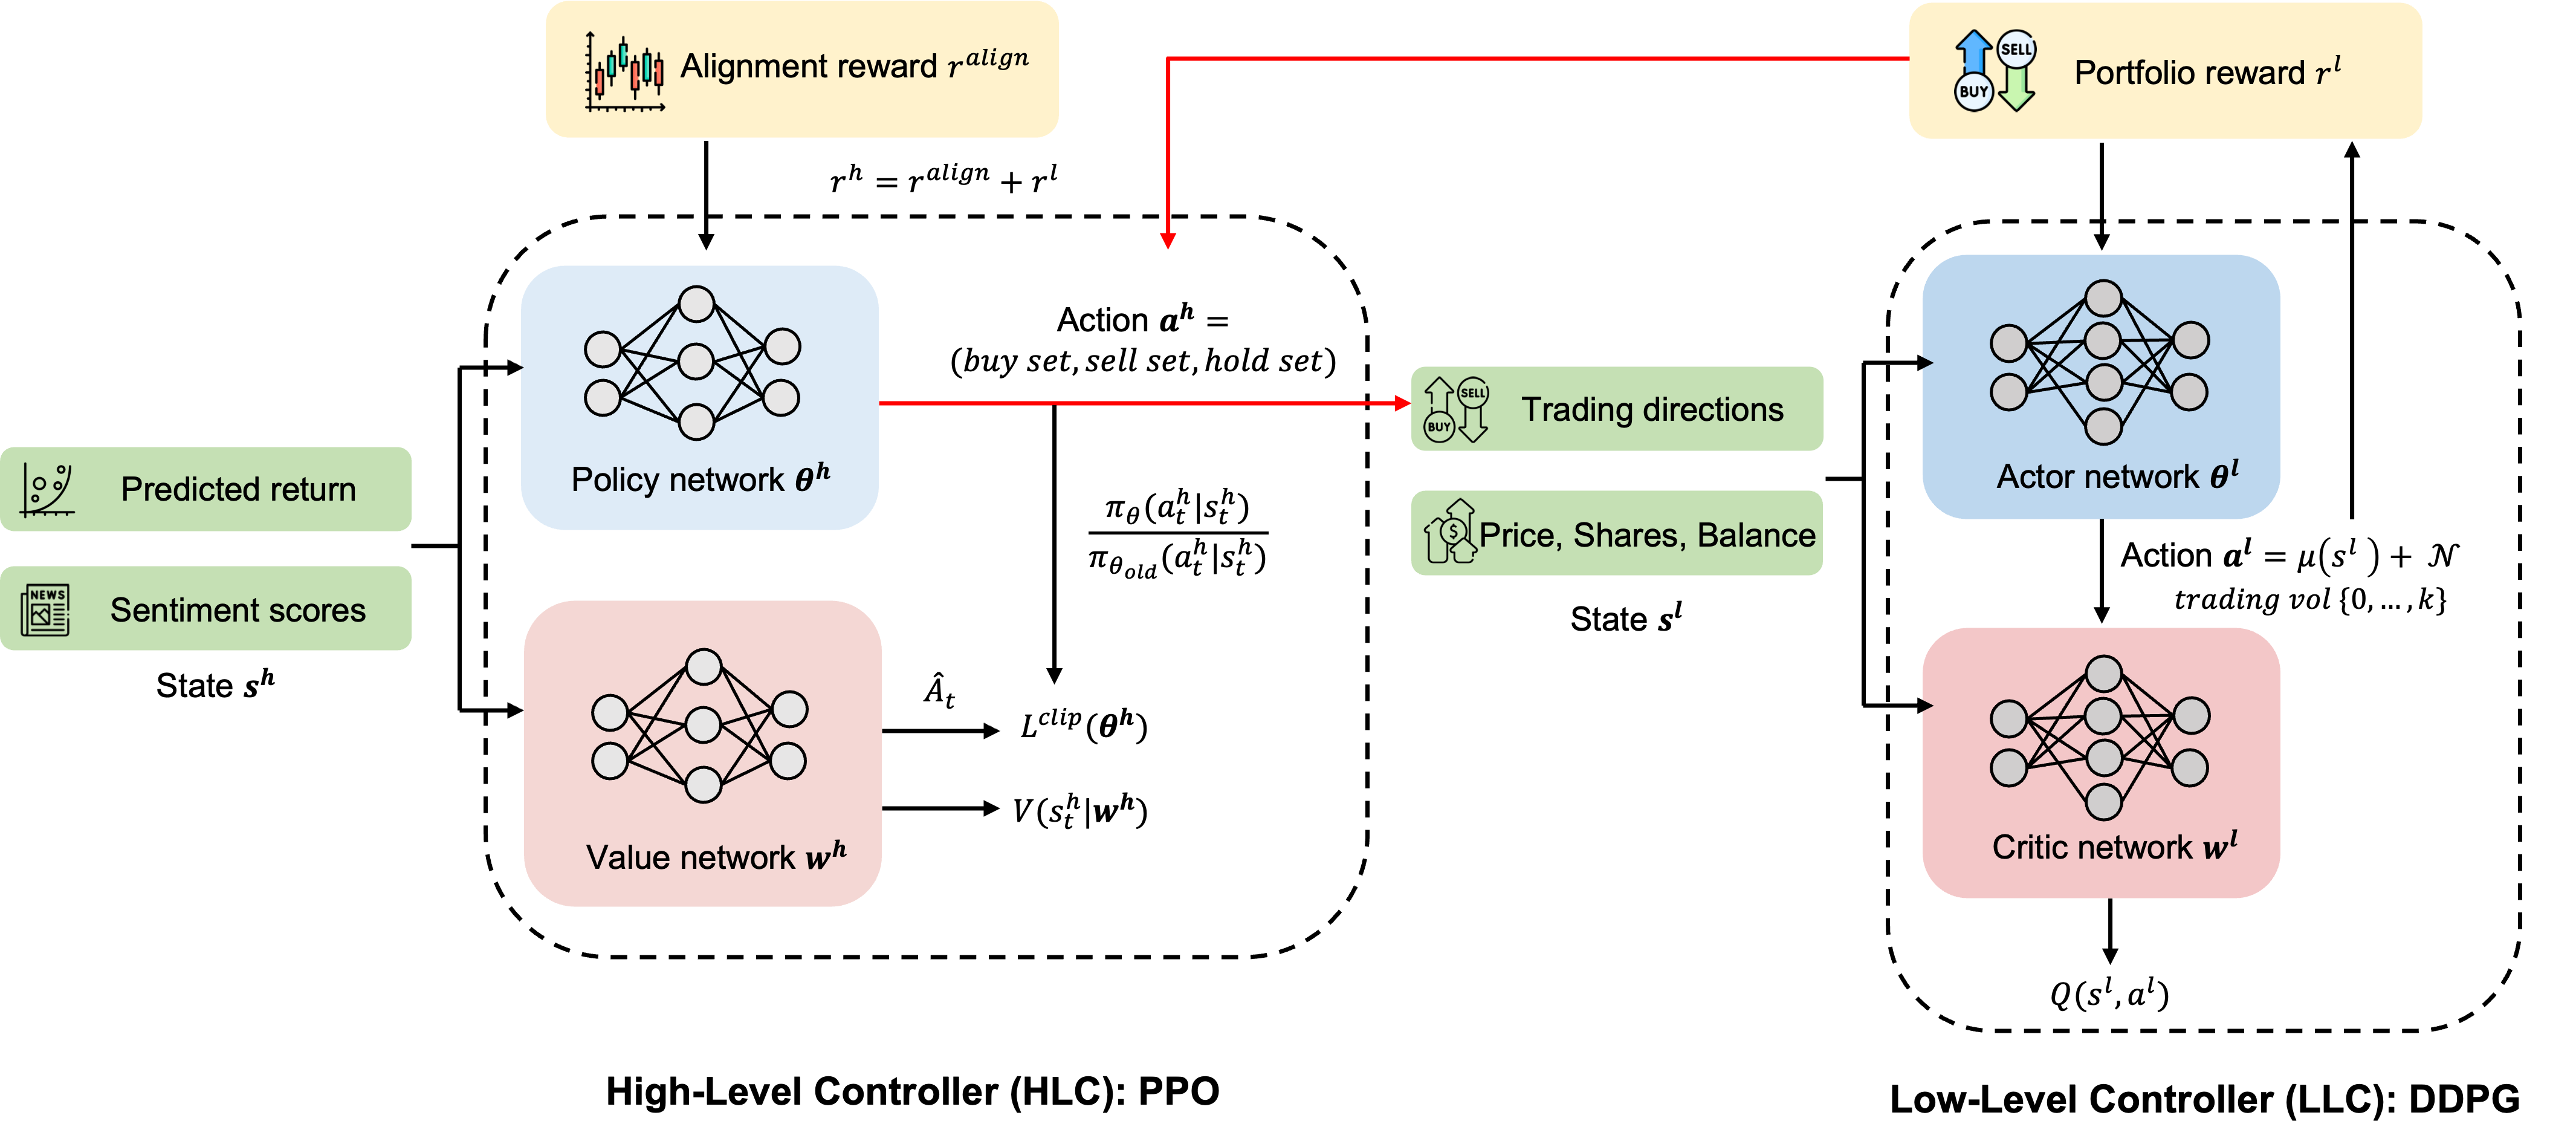
Our Hierarchical Reinforced Trader (HRT) agent introduces a novel approach to algorithmic trading by applying Hierarchical Reinforcement Learning (HRL). It splits the trading process into two distinct but interrelated decisions, aiming to improve trading performance through an in-depth understanding of market dynamics and execution efficiency. A schematic of our HRT framework is shown in Figure 2, outlining the agent’s two main components: the High-Level Controller (HLC) and the Low-Level Controller (LLC).
High-Level Controller (HLC): The HLC plays a crucial role in analyzing market conditions and sentiments to determine the key trading directions—buy, sell, or hold—and to select stocks. Due to its strategic importance, Proximal Policy Optimization (PPO) is chosen for the HLC for its efficiency in managing discrete action spaces, simplifying the decision-making process.
Low-Level Controller (LLC): Following the HLC’s strategy, the LLC hones these directions, focusing on the exact quantities of shares to trade. Deep Deterministic Policy Gradient (DDPG) is selected for the LLC. DDPG’s ability to handle continuous action spaces and maintain stable learning progress makes it ideal for the detailed task of executing trades in the stock market.
Together, the HLC and LLC work towards the ultimate goal of maximizing long-term portfolio performance. The HLC’s decisions inform the LLC’s actions, specifying trading directions for each stock. These instructions are seamlessly incorporated into the LLC’s state inputs, crucially influencing its operational strategy. The results of the LLC’s trades, measured through reward signals aimed at maximizing portfolio values, are relayed back to the HLC, ensuring alignment towards a common goal. These interactions are highlighted by red arrows in Figure 2.
3.2. Stock Selection with High-Level Controller
The High-Level Controller (HLC) within the Hierarchical Reinforced Trader (HRT) agent is specifically designed to address the stock selection challenge. It discerns which subset of stocks to buy, sell, or hold based on strategic analysis. The components of the DRL agent include:
State space. We identify two predictive sources for the state: , where signifies predicted forward returns from historical price and volume data, and captures sentiment scores derived from alternative textual data, such as news or tweets. Predictive price or forward return is one of best best predictive signals in designing trading strategies and also serve as the prediction target (Yang et al., 2018). Predicted return and sentiment score undergo cross-validation to improve predictive accuracy.
Action space. The action executed by the HLC for stock , noted as , maps to buying, selling, or holding, respectively. The complete action space covers , with indicating the total number of stocks traded.
Reward. The HLC’s reward, 111Variables are simplified here and subsequently; correct notation includes superscripts: ., merges the real-world price movement alignment reward with the downstream feedback from the Low-Level Controller (LLC), as detailed in Section 3.3. This approach ensures HLC actions not only aim to refine immediate trading directions but also support the overarching objective of enhancing portfolio value.
The alignment reward for stock , , correlates with action and the actual price change . The function, returning -1 for negative inputs, +1 for positive inputs, and 0 for neutral input, is employed to determine rewards. A reward of 1 is granted if the action aligns with the real stock return, -1 if it contradicts the stock return, and no reward or penalty is applied if the action is to hold.
| (1) |
The comprehensive reward for the HLC, , is a linear mix of the sum of for all stocks and the LLC reward. The weighting factor starts near 1, emphasizing the HLC’s alignment with stock price movements, and gradually decreases to focus more on the LLC’s reward, following an exponential decay , where we set and in our following experiments.
| (2) |
For the HLC’s architecture, we select PPO, which moderates policy updates to prevent detrimental performance shifts. This process calculates the probability ratio between new and old policies, incorporating a clipping mechanism in the objective function:
| (3) |
Here, denotes the advantage function estimate, and the clipping limits the ratio to , opting for the minimum value to restrict excessive policy changes and ensure training stability. The details of the algorithm are outlined in Algorithm 1. After training the Proximal Policy Optimization (PPO) algorithm, we identify which subsets of stocks to buy, sell, or hold. This information is then passed to the Low-Level Controller (LLC) to determine the optimal trading volume.
3.3. Executing Trading with Lower-Level Controller
Given the sets that the HLC decides to buy or sell, the Lower-Level Controller (LLC) refines this decision by determining the optimal quantity of shares to trade. Since the direction is already established, the LLC can concentrate on optimizing within the bounds set by , streamlining the training process. Additionally, for stocks designated to be held, there’s no need to engage the LLC in determining the optimal . For simplicity and consistency with current research, we adopt a setting similar to that described by Liu, Xiao-Yang, et al. (Liu et al., 2018).
State space. The state space, represented as , includes information on stock prices , stock holdings , and the remaining cash balance . Furthermore, as depicted in Figure 2, we augment with decisions from the HLC, specifying which stocks are selected for buying, selling, or holding.
Action space. The action space for a single stock is defined as , where represents the number of shares to be traded, subject to the maximum limit . This action space is normalized to [-1, 1] because using a continuous action space facilitates the modeling of transactions across multiple stocks, avoiding the computational challenges posed by a large discrete action space.
Reward. The reward function, 222Variables are simplified here and subsequently; accurate notation includes superscripts: ., quantifies the change in portfolio value from trades executed at time as reflected in stock price updates at . The portfolio value is computed as , with an acknowledgment that maintaining positions may affect the portfolio’s value due to price changes.
The LLC employs the Deep Deterministic Policy Gradient (DDPG) framework for implementation. At each timestep, the LLC executes an action in state , earns a reward , and transitions to a new state . These transactions are stored in the replay buffer . A batch of transitions is drawn from to update the -value as follows:
| (4) |
Next, the critic network is updated by minimizing the loss function , which calculates the expected difference between the target critic network and the actual critic network :
| (5) |
The detailed algorithm of the LLC is illustrated in Algorithm 2. After training DDPG, we obtain a continuous vector that describes the number of shares to be traded. This vector is then scaled back and discretized by rounding to the nearest integer to determine the actions to buy, sell, or hold. Following these actions, trades are executed to generate portfolios.
3.4. Joint Training of HLC and LLC
To train our HRT agent, we propose a phased alternating training method (Algorithm 3). This approach initiates with the optimization of the HLC to establish a strategic foundation for trading decisions. Subsequently, we focus on training the LLC, while freezing the HLC’s parameters. An iterative alternating process then refines the strategies of both the HLC and LLC, ensuring that strategic and execution tactics are consistently aligned and enhanced through mutual feedback. This feedback loop between the HLC and LLC fosters complementary learning, whereby the strategy adjustments of each controller are informed by insights from its counterpart, thereby boosting overall efficacy.
The initial focus on HLC training addresses the critical importance of accurate trading directions. Incorrect directions could undermine portfolio performance, regardless of the optimization level achieved by the LLC in determining trade volumes. A proficiently trained HLC sets the stage for effective trade execution managed by the LLC. Furthermore, dynamically integrating the rewards received by the LLC into the HLC’s training process—achieved through a linear combination with exponential decay in —progressively harmonizes strategic decisions with execution capabilities, cultivating a unified operational framework.
4. Performance Evaluations
4.1. Stock Data Preprocessing
Expanding beyond the scope of the Dow Jones 30 constituent stocks as discussed in (Liu et al., 2018; Yang et al., 2020), our study encompasses a broader pool: the S&P 500. This choice ensures adequate liquidity and uses the index as a benchmark for assessing overall U.S. market performance. The in-sample period, from 01/01/2015 to 12/31/2019 is for training, and the following year 01/01/2020 to 12/31/2020, is allocated for validation. In 2021, the U.S. equity market was bullish, characterized by strong gains across major indices, driven by economic recovery optimism and continued monetary support from the Federal Reserve. In contrast, 2022 was a bearish year for U.S. equities, with markets facing significant declines due to rising inflation concerns, tightening monetary policies, and geopolitical tensions. To test our models’ performance on different market conditions, we perform the trading on both 01/01/2021 to 12/31/2021 and 01/01/2022 to 12/31/2022. We download our stock data from Yahoo Finance 333https://finance.yahoo.com/, which includes Open, High, Low, Close, and Volume (OHLCV) data. The Volume Weighted Average Price (VWAP) is derived daily from OHLCV data.
For constructing the High-Level Controller (HLC)’s state space, we compute the daily forward return of a stock on day as the percentage change in its opening price from day to day using historical data. This process employs only the encoder part of the Transformer model (Vaswani et al., 2017), linking the encoder’s output directly to a linear layer. Although similar to traditional many-to-one RNNs, this model incorporates a self-attention mechanism. We adopted supervised learning to train the model with 158 features provided by Qlib444https://github.com/microsoft/qlib/blob/main/qlib/contrib/data/handler.py, an open-source, AI-oriented quantitative investment platform, setting a lookback window of 10 trading days. For sentiment analysis, we utilize the finetuned FinGPT model (Zhang et al., 2023) available on HuggingFace555https://huggingface.co/FinGPT/fingpt-sentiment_llama2-13b_lora, which underwent instruct tuning on the LLaMA 2 13B model. Trading executions are assumed to occur at the market opening at 9:30 AM, incorporating the market’s overnight reaction to news into the decision-making process. Thus, sentiment scores are calculated using the random sample of size 10 from previous day’s 24 hours news, with a scoring system where positive sentiment is marked as 1, neutral as 0, and negative as -1, based on a simple average from outputs of large language models (LLMs).
4.2. Training Setup
Our experiments leveraged NVIDIA Tesla V100 GPUs, utilizing the FinRL library666https://github.com/AI4Finance-Foundation/FinRL (Liu et al., 2021) to ensure comparability with prior work and efficiency in development. For the PPO-based HLC, we set the learning rate to 3e-4 and the clip parameter to 0.2, while the DDPG-based LLC was configured with a learning rate of 1e-3 for both the actor and critic networks, and a soft update parameter of 0.005. Both controllers used a replay buffer of 2e5, a batch size of 256, and a discount factor of 0.99, utilizing the AdamW optimizer over 5e5 total timesteps. Portfolio parameters included an initial capital of $1,000,000 and a transaction cost percentage of 0.1%, with daily rebalancing. The total time cost for training the HRT agent was approximately 30 hours, reflecting the complexity of the model and the depth of data being processed. In terms of potential multiple sources of randomness such as model initialization, data mini-batch shuffle during training, and random sampling of news to compute sentiment scores, etc., we conducted ten independent experiments under the same setting with respect to different random seeds.
4.3. Evaluation Metrics
For a comprehensive comparison of the trading performance across different agents and benchmarks, we utilize the following metrics:
-
•
Cumulative return: Aggregates the sum of daily returns up to the current day, offering a straightforward representation of total return.
-
•
Annualized return: , where represents the number of years over the return period. It provides a normalized measure of return, facilitating comparisons over varying time frames.
-
•
Annualized volatility: Defined as , where denotes the standard deviation of daily returns. This formula adjusts volatility to an annual scale, considering the typical 252 trading days in a year, to standardize risk assessment.
-
•
Sharpe ratio: Expressed as , with being the portfolio return, the risk-free rate (assumed to be 0 in this study), and the annualized volatility. The Sharpe ratio quantifies the risk-adjusted performance of an investment relative to a risk-free asset, highlighting the excess return per unit of risk.
-
•
Max drawdown: Measures the largest percentage drop in portfolio value from a peak to a subsequent trough before reaching a new peak. This metric is crucial for assessing the portfolio’s risk and resilience to market downturns.
| Metric | HRT-FR-original | PPO | DDPG | HRT-FR | HRT | Min-Var | S&P500 |
|---|---|---|---|---|---|---|---|
| Cumulative Return | 0.3147 0.010 | 0.3428 0.009 | 0.3813 0.008 | 0.3983 0.007 | 0.4548 0.008 | 0.2368 | 0.2913 |
| Annualized Return | 0.3200 0.009 | 0.3486 0.009 | 0.3879 0.007 | 0.4051 0.007 | 0.4628 0.008 | 0.2406 | 0.2961 |
| Annualized Volatility | 0.1489 0.010 | 0.1498 0.008 | 0.1458 0.005 | 0.1665 0.009 | 0.1687 0.009 | 0.0980 | 0.1303 |
| Sharpe Ratio | 2.1494 0.156 | 2.3274 0.138 | 2.6601 0.103 | 2.4336 0.138 | 2.7440 0.154 | 2.4549 | 2.2736 |
| Max Drawdown | -0.0738 0.018 | -0.0808 0.010 | -0.0651 0.013 | -0.0845 0.010 | -0.0755 0.016 | -0.0516 | -0.0521 |
| Metric | HRT-FR-original | PPO | DDPG | HRT-FR | HRT | Min-Var | S&P500 |
|---|---|---|---|---|---|---|---|
| Cumulative Return | -0.0154 0.008 | -0.0045 0.004 | 0.0174 0.005 | 0.0229 0.005 | 0.0368 0.004 | -0.0696 | -0.1995 |
| Annualized Return | -0.0156 0.007 | -0.0045 0.003 | 0.0176 0.005 | 0.0232 0.005 | 0.0372 0.005 | -0.0704 | -0.2016 |
| Annualized Volatility | 0.0586 0.008 | 0.0646 0.007 | 0.0790 0.008 | 0.0893 0.005 | 0.0901 0.005 | 0.1513 | 0.2416 |
| Sharpe Ratio | -0.2664 0.050 | -0.0701 0.037 | 0.2224 0.059 | 0.2594 0.045 | 0.4132 0.048 | -0.4654 | -0.8344 |
| Max Drawdown | -0.0448 0.009 | -0.0431 0.008 | -0.0484 0.007 | -0.0554 0.008 | -0.0548 0.009 | -0.1507 | -0.2543 |
4.4. Results
4.4.1. Enhanced Trading Performance
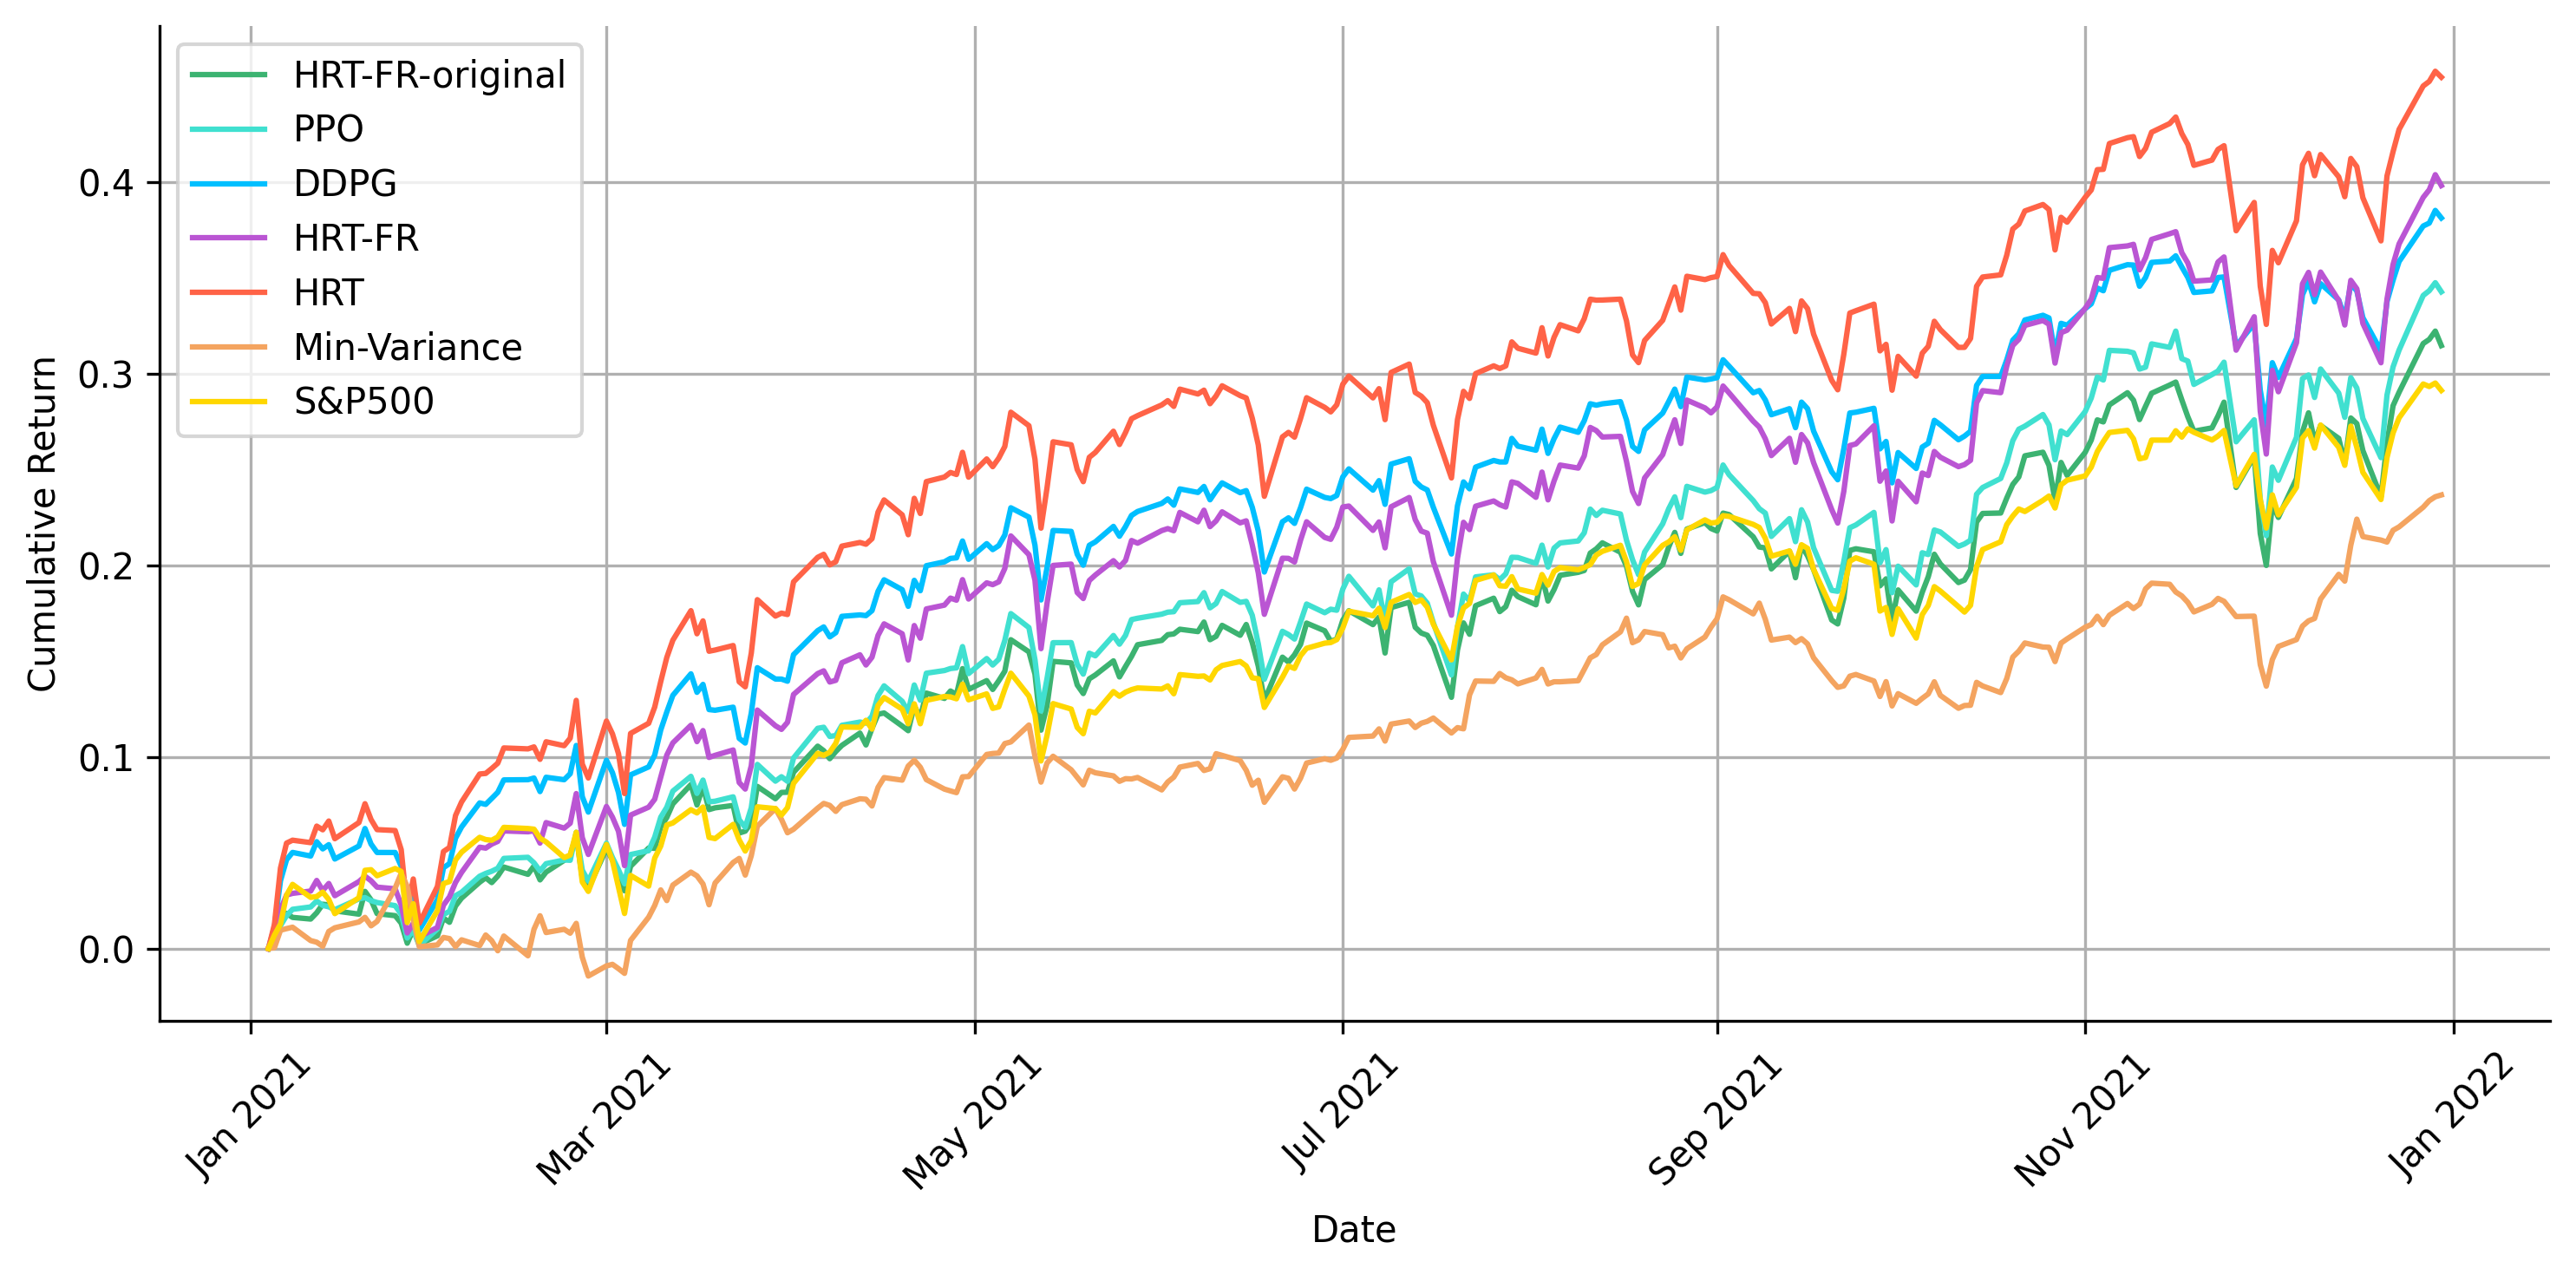
To assess the efficacy of various Deep Reinforcement Learning (DRL) trading agents, we monitored the cumulative returns of portfolios throughout the years 2021 and 2022. To ensure a balanced comparison, we benchmarked these performances against the S&P 500 and a minimum-variance portfolio, which was optimized daily for minimal variance using PyPortfolioOpt777https://github.com/robertmartin8/PyPortfolioOpt. Additionally, we evaluated our Hierarchical Reinforced Trader (HRT), which incorporates predicted forward returns and sentiment scores within its HLC, with two variants: the first, denoted as HRT-FR, exclusively includes the predicted forward return with 500 input dimensions; the second, denoted as HRT-FR-original, incorporates the 158 original features from Qlib, as discussed in Section 4.1, for predicting forward returns, resulting in a state space of input dimensions.
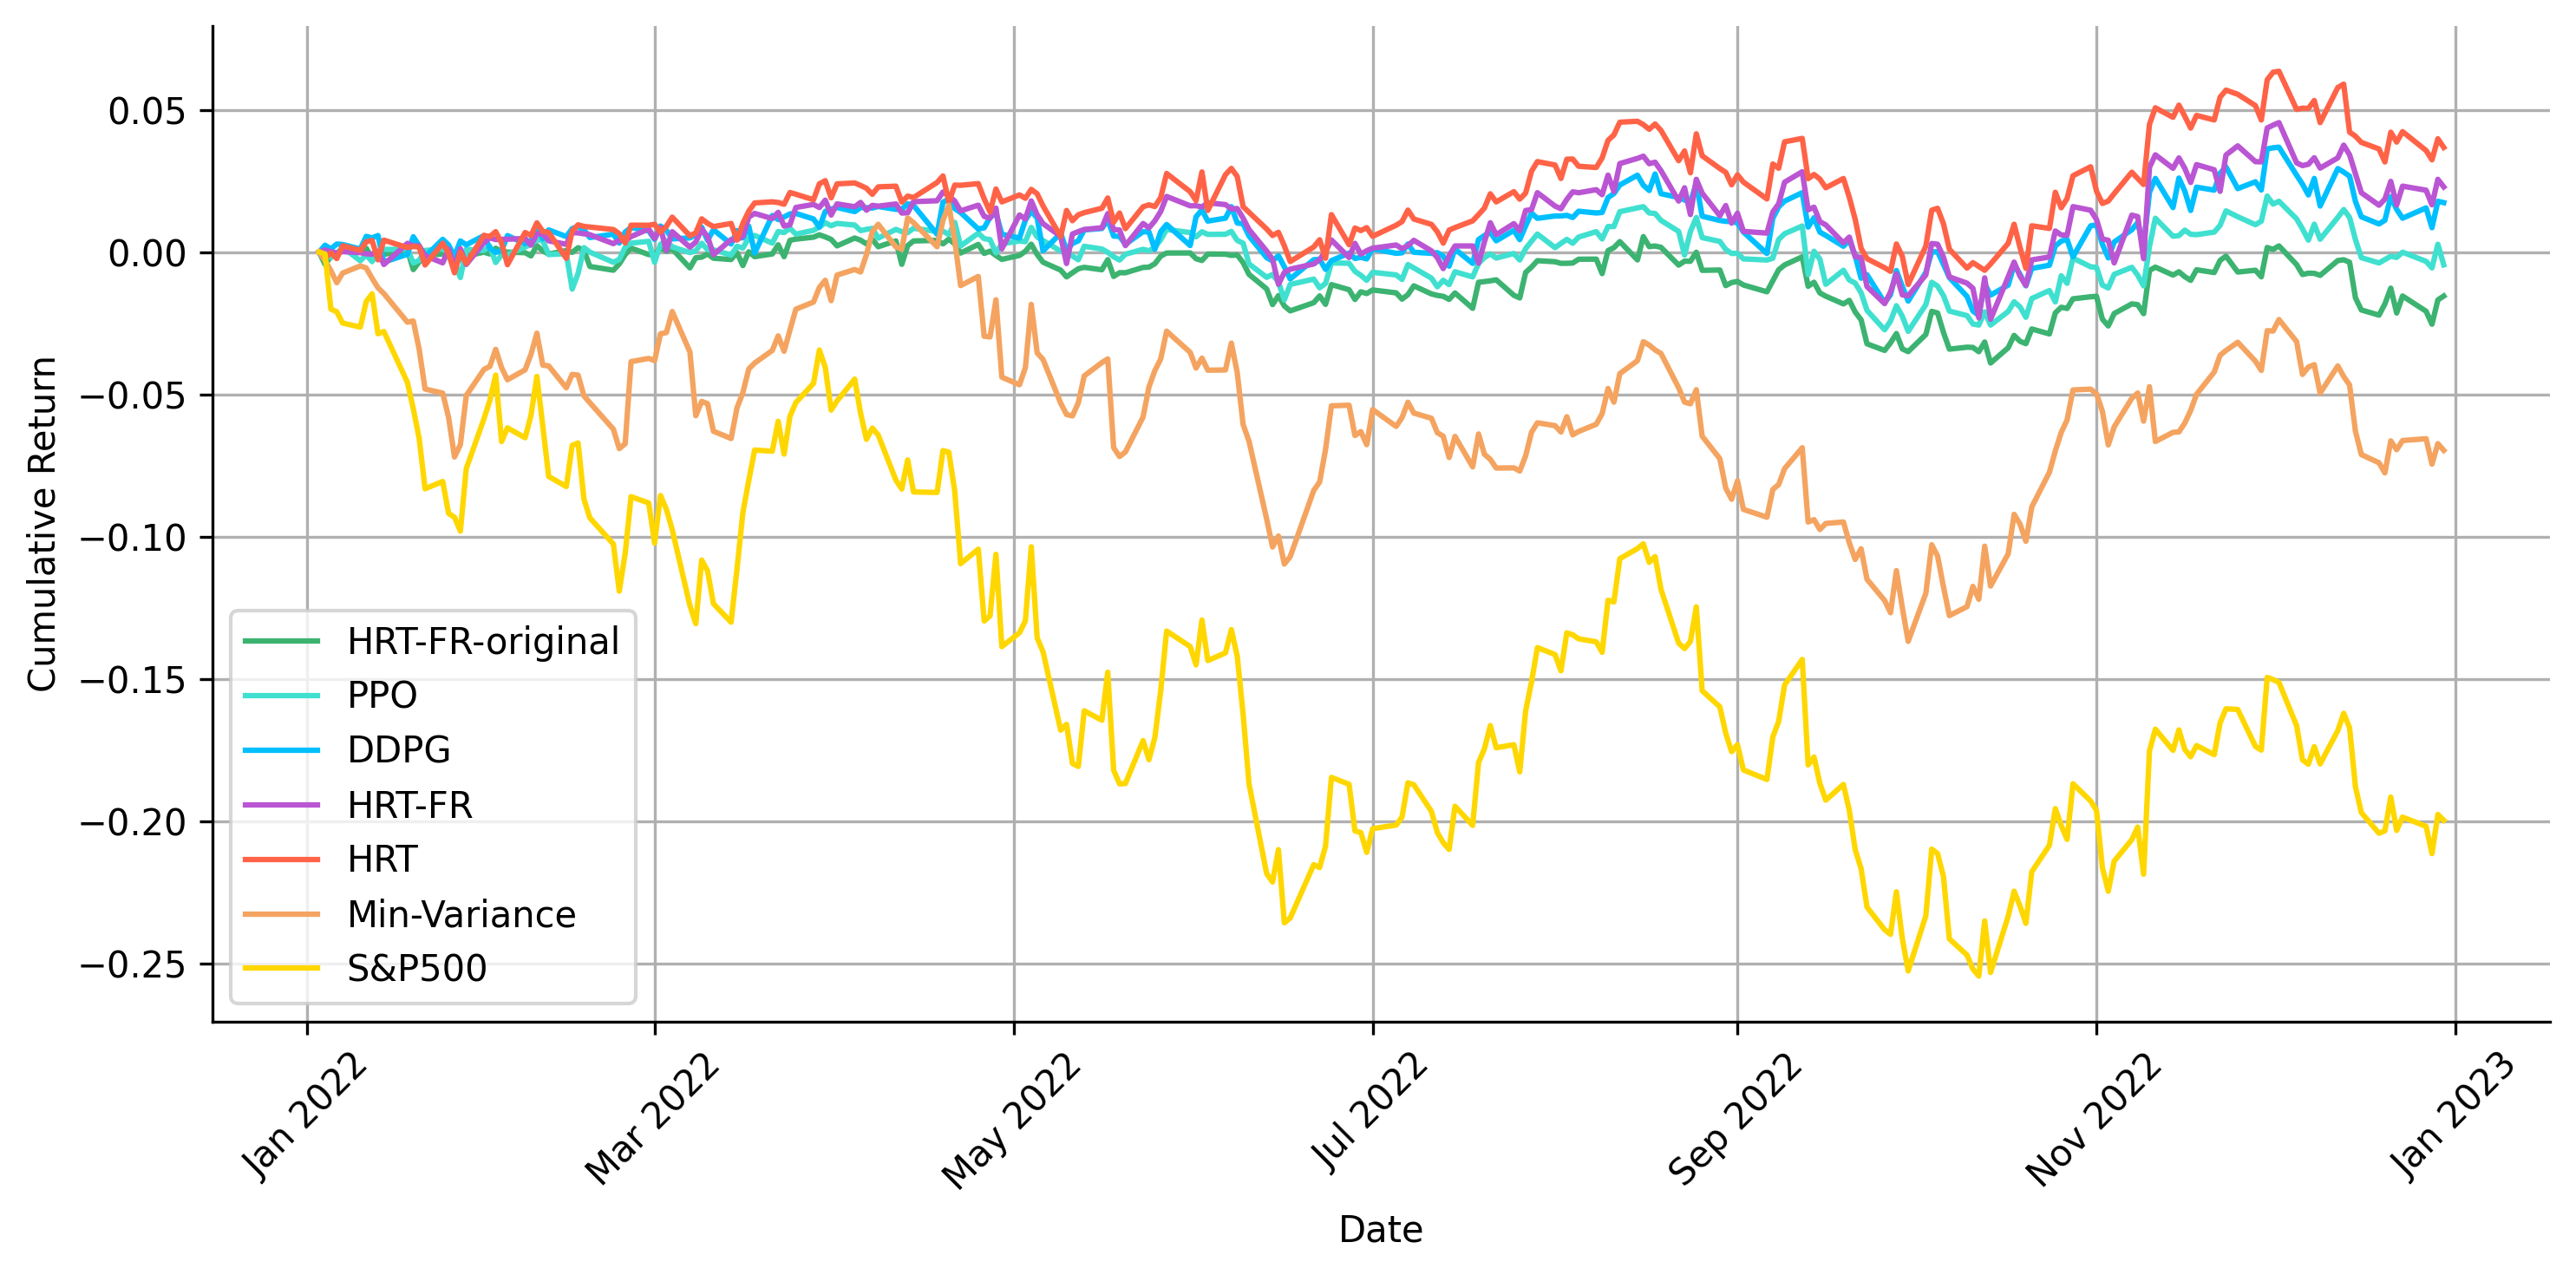
As detailed in Figure 3 and Table 1, our HRT agent consistently outperformed both the standalone DDPG and PPO models, as previously explored in research (Liu et al., 2018; Yang et al., 2020). It achieved a Sharpe ratio of 2.7440 compared to the S&P 500 baseline of 2.2736 during the bullish year of 2021. In the bearish first half of 2022, characterized by significant market volatility and downturns, as evidenced by the S&P 500’s performance, DDPG, HRT-FR, and HRT maintained minor but positive cumulative returns with significantly lower drawdowns, demonstrating their ability to adeptly navigate complex market dynamics. Notably, our HRT agent achieved a Sharpe ratio of 0.4132 during this period, with a significantly smaller drawdown compared to the S&P 500 portfolio.
Furthermore, HRT-FR, which only uses forward returns in the HLC, achieved respectable results in both years but did not outperform the standard HRT. This outcome underscores the value of incorporating predicted sentiment scores. Conversely, HRT-FR-original, with its high-dimensional state space, performed the poorest among the DRL agents, failing even to outperform the S&P 500 in 2021. We hypothesize that the challenge lies in training on such a high-dimensional input state and generalizing effectively to out-of-sample periods. In summary, the results from both years affirm the robustness of our standard HRT agent in balancing risk and return to generate a more profitable portfolio.
4.4.2. Alleviating DRL Challenges in Multi-Stock Trading
In addressing the challenges of deploying Deep Reinforcement Learning (DRL) agents for multi-stock trading, our Hierarchical Reinforced Trader (HRT) showcases significant improvements over the issues discussed in Section 1. By bifurcating the action space into two manageable components, HRT effectively navigates the dimensional complexity challenge. The action space for the High-Level Controller (HLC) narrows to , focusing solely on trading directions and bypassing the need to quantify trades, thus streamlining the decision-making process. Empirical evidence indicates that approximately 80% of stocks necessitate decisions on precise trading volumes, further compressing the Lower-Level Controller’s (LLC) action space.
For the analysis of the inertia or momentum effect, we traded stocks from the DJIA 30 across the years 2021 and 2022. The trading heatmaps for both the standalone DDPG, as discussed in a previous study (Liu et al., 2018), and our Hierarchical Reinforced Trader (HRT) are depicted in Figure 1. These visualizations reveal a consistent trend toward more diversified and frequent trading under varying market conditions. Although only DIJA 30 stocks was selected to enhance the clarity of the heatmaps, we observed analogous trends with S&P 500 stocks. We believe HRT’s ability to conduct more diversified and frequent trading can be attributed to the HLC state space, which is driven by the latest predictive returns and recent sentiment trends. Its alignment reward is set to zero if the HLC decides to hold a stock, encouraging more diversified and frequent trading. It is then passed to the LLC to determine the optimal execution amount.
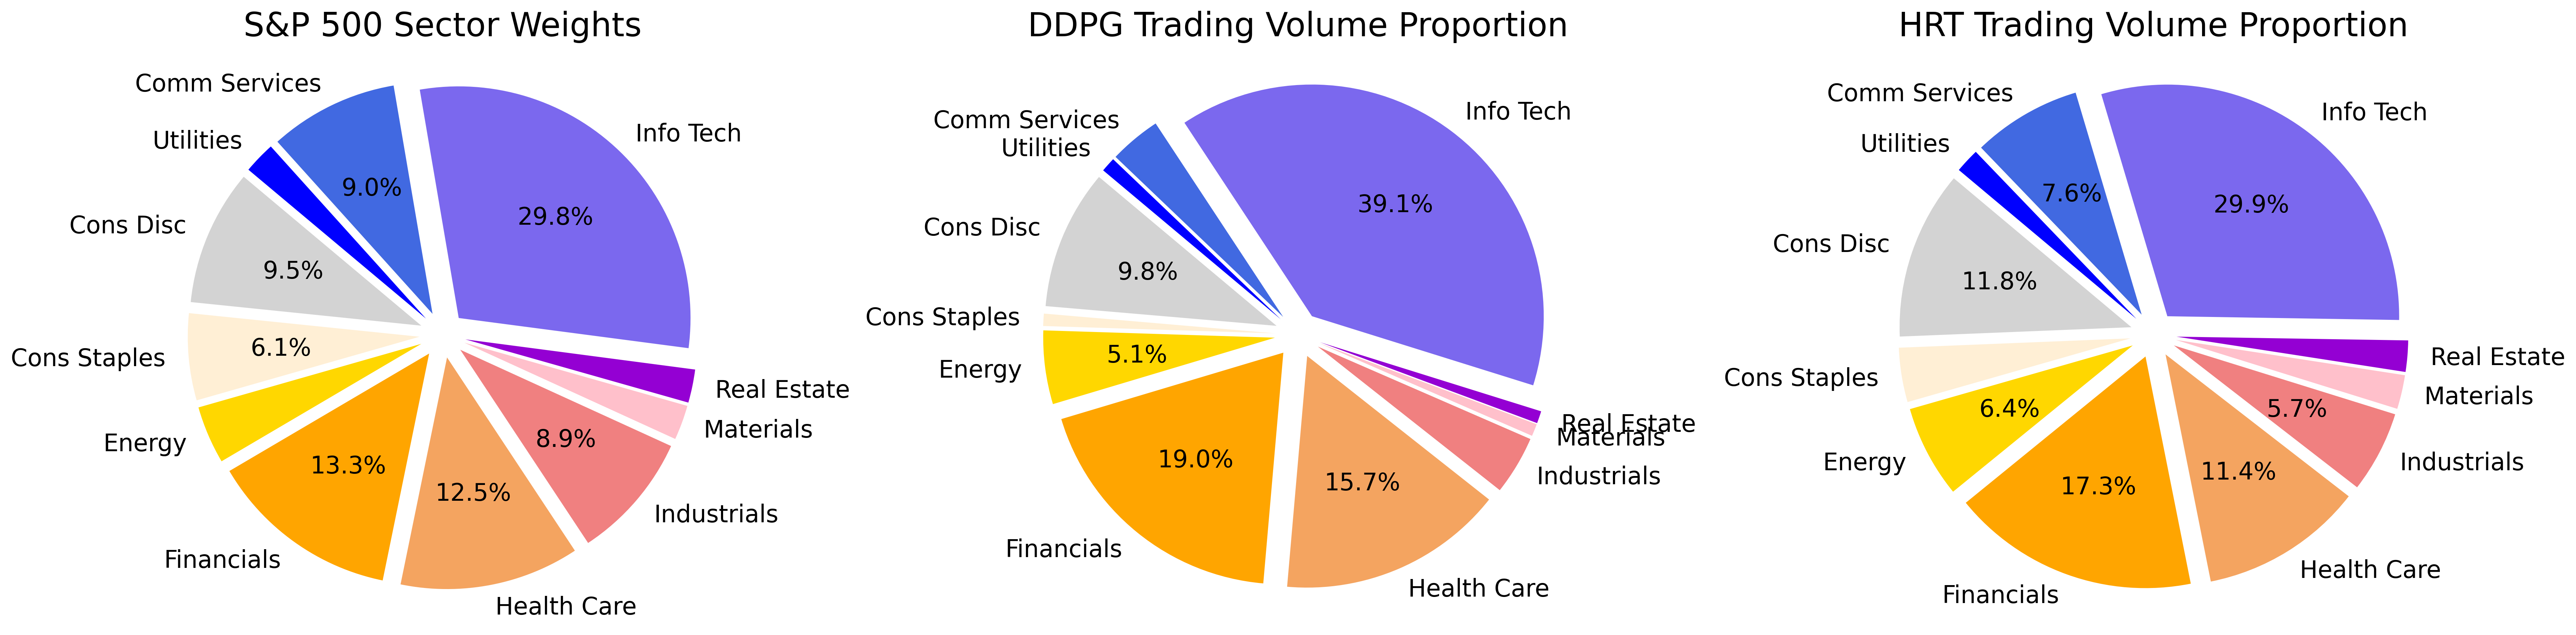
Addressing the challenge of insufficient diversification, we compared the sector-based trading volume proportions within our portfolios against the average sector weights of the S&P 500 throughout the trading period. Sector weights within the S&P 500 reflect the relative market capitalization of each sector, averaged over the trading period to establish a baseline for comparison. The comparative analysis, visually represented in Figure 4, shows that the DDPG portfolio exhibits a pronounced deviation from the S&P 500 sector weights, with a significant focus on sectors such as Information Technology, Financials, and Health Care, while minimally engaging with sectors like Consumer Staples, Real Estate, and Utilities. Conversely, our HRT system, despite also favoring trades in predominant sectors, demonstrates an alignment closer to the S&P 500’s average sector weights. This not only indicates adherence to prevailing market valuations and trends but also suggests that the HRT portfolio is diversified in a manner akin to the index itself. The sector exposure of our portfolio mirrors the broader market distribution, endorsing inherent diversification across various sectors. This diversification is corroborated by the varied trading activity within the HRT portfolio, as seen in Figure 1, underscoring our system’s ability to maintain a balanced sector distribution that mirrors prevailing market trends.
5. Conclusion and Future Work
In this study, we present the Hierarchical Reinforced Trader (HRT), a strategy that breaks down the trading process into two connected processes, aiming to boost trading performance by deeply understanding market dynamics and improving execution. We deploy a Proximal Policy Optimization (PPO)-based High-Level Controller (HLC) for selecting trading directions and a Deep Deterministic Policy Gradient (DDPG)-based Low-Level Controller (LLC) to decide the optimal number of shares to trade. We also introduce the Phased Alternating Training algorithm for simultaneous training of these two parts. In testing with actual S&P 500 data, our standard HRT agent consistently achieved positive cumulative returns and maintained strong Sharpe ratios under various market conditions. Notably, even in bearish markets characterized by significant stock price declines and high volatility, the HRT agent managed to maintain a positive Sharpe ratio. Additionally, HRT shows promise in reducing the dimensions of actions and states, suggesting that future studies could look into separating the buying and selling actions to further narrow the action space. HRT also appears to mitigate the inertia or momentum effect, which typically limits diversification in models like DDPG, thus enhancing the profitability and robustness of trading algorithms and inviting a reevaluation of applications in multi-stock trading. A future direction could involve modeling the trading process as a Partially Observable Markov Decision Process (POMDP), as a few studies (Liu et al., 2020; Kabbani and Duman, 2022) have done, taking into account the constraints imposed by the stock market. Investigating adaptive learning rates and experimenting with the most recent DRL models could also lead to improvements in overall performance.
References
- (1)
- Bertsekas (2012) Dimitri Bertsekas. 2012. Dynamic programming and optimal control: Volume I. Vol. 4. Athena scientific.
- Fujimoto et al. (2018) Scott Fujimoto, Herke Hoof, and David Meger. 2018. Addressing function approximation error in actor-critic methods. In International conference on machine learning. PMLR, 1587–1596.
- Han et al. (2023) Weiguang Han, Boyi Zhang, Qianqian Xie, Min Peng, Yanzhao Lai, and Jimin Huang. 2023. Select and trade: Towards unified pair trading with hierarchical reinforcement learning. In Proceedings of the 29th ACM SIGKDD Conference on Knowledge Discovery and Data Mining. 4123–4134.
- Kabbani and Duman (2022) Taylan Kabbani and Ekrem Duman. 2022. Deep reinforcement learning approach for trading automation in the stock market. IEEE Access 10 (2022), 93564–93574.
- Koratamaddi et al. (2021) Prahlad Koratamaddi, Karan Wadhwani, Mridul Gupta, and Sriram G Sanjeevi. 2021. Market sentiment-aware deep reinforcement learning approach for stock portfolio allocation. Engineering Science and Technology, an International Journal 24, 4 (2021), 848–859.
- Li et al. (2019) Xinyi Li, Yinchuan Li, Yuancheng Zhan, and Xiao-Yang Liu. 2019. Optimistic bull or pessimistic bear: Adaptive deep reinforcement learning for stock portfolio allocation. arXiv preprint arXiv:1907.01503 (2019).
- Lillicrap et al. (2015) Timothy P Lillicrap, Jonathan J Hunt, Alexander Pritzel, Nicolas Heess, Tom Erez, Yuval Tassa, David Silver, and Daan Wierstra. 2015. Continuous control with deep reinforcement learning. arXiv preprint arXiv:1509.02971 (2015).
- Liu et al. (2024) Xiao-Yang Liu, Ziyi Xia, Hongyang Yang, Jiechao Gao, Daochen Zha, Ming Zhu, Christina Dan Wang, Zhaoran Wang, and Jian Guo. 2024. Dynamic datasets and market environments for financial reinforcement learning. Machine Learning (2024), 1–45.
- Liu et al. (2018) Xiao-Yang Liu, Zhuoran Xiong, Shan Zhong, Hongyang Yang, and Anwar Walid. 2018. Practical deep reinforcement learning approach for stock trading. arXiv preprint arXiv:1811.07522 (2018).
- Liu et al. (2021) Xiao-Yang Liu, Hongyang Yang, Jiechao Gao, and Christina Dan Wang. 2021. FinRL: Deep reinforcement learning framework to automate trading in quantitative finance. In Proceedings of the second ACM international conference on AI in finance. 1–9.
- Liu et al. (2020) Yang Liu, Qi Liu, Hongke Zhao, Zhen Pan, and Chuanren Liu. 2020. Adaptive quantitative trading: An imitative deep reinforcement learning approach. In Proceedings of the AAAI conference on artificial intelligence, Vol. 34. 2128–2135.
- Markowitz (1952) Harry Markowitz. 1952. Portfolio selection. The Journal of Finance 7, 1 (1952), 77–91.
- Millea (2021) Adrian Millea. 2021. Deep reinforcement learning for trading—A critical survey. Data 6, 11 (2021), 119.
- Mnih et al. (2016) Volodymyr Mnih, Adria Puigdomenech Badia, Mehdi Mirza, Alex Graves, Timothy Lillicrap, Tim Harley, David Silver, and Koray Kavukcuoglu. 2016. Asynchronous methods for deep reinforcement learning. In International conference on machine learning. PMLR, 1928–1937.
- Nan et al. (2022) Abhishek Nan, Anandh Perumal, and Osmar R Zaiane. 2022. Sentiment and knowledge based algorithmic trading with deep reinforcement learning. In International Conference on Database and Expert Systems Applications. Springer, 167–180.
- Pateria et al. (2021) Shubham Pateria, Budhitama Subagdja, Ah-hwee Tan, and Chai Quek. 2021. Hierarchical reinforcement learning: A comprehensive survey. ACM Computing Surveys (CSUR) 54, 5 (2021), 1–35.
- Qin et al. (2024) Molei Qin, Shuo Sun, Wentao Zhang, Haochong Xia, Xinrun Wang, and Bo An. 2024. Earnhft: Efficient hierarchical reinforcement learning for high frequency trading. In Proceedings of the AAAI Conference on Artificial Intelligence, Vol. 38. 14669–14676.
- Schulman et al. (2017) John Schulman, Filip Wolski, Prafulla Dhariwal, Alec Radford, and Oleg Klimov. 2017. Proximal policy optimization algorithms. arXiv preprint arXiv:1707.06347 (2017).
- Vaswani et al. (2017) Ashish Vaswani, Noam Shazeer, Niki Parmar, Jakob Uszkoreit, Llion Jones, Aidan N Gomez, Łukasz Kaiser, and Illia Polosukhin. 2017. Attention is all you need. Advances in neural information processing systems 30 (2017).
- Wang et al. (2020) Rundong Wang, Hongxin Wei, Bo An, Zhouyan Feng, and Jun Yao. 2020. Deep stock trading: A hierarchical reinforcement learning framework for portfolio optimization and order execution. arXiv preprint arXiv:2012.12620 (2020).
- Yang et al. (2018) Hongyang Yang, Xiao-Yang Liu, and Qingwei Wu. 2018. A practical machine learning approach for dynamic stock recommendation. In 2018 17th IEEE international conference on trust, security and privacy in computing and communications/12th IEEE international conference on big data science and engineering (TrustCom/BigDataSE). IEEE, 1693–1697.
- Yang et al. (2020) Hongyang Yang, Xiao-Yang Liu, Shan Zhong, and Anwar Walid. 2020. Deep reinforcement learning for automated stock trading: An ensemble strategy. In Proceedings of the first ACM international conference on AI in finance. 1–8.
- Zhang et al. (2023) Boyu Zhang, Hongyang Yang, and Xiao-Yang Liu. 2023. Instruct-fingpt: Financial sentiment analysis by instruction tuning of general-purpose large language models. arXiv preprint arXiv:2306.12659 (2023).