How Does Data Diversity Shape the Weight Landscape of Neural Networks?
Abstract
To enhance the generalization of machine learning models to unseen data, techniques such as dropout, weight decay ( regularization), and noise augmentation are commonly employed. While regularization methods (i.e., dropout and weight decay) are geared toward adjusting model parameters to prevent overfitting, data augmentation increases the diversity of the input training set, a method purported to improve accuracy and calibration error. In this paper, we investigate the impact of each of these techniques on the parameter space of neural networks, with the goal of understanding how they alter the weight landscape in transfer learning scenarios. To accomplish this, we employ Random Matrix Theory to analyze the eigenvalue distributions of pre-trained models, fine-tuned using these techniques but using different levels of data diversity, for the same downstream tasks. We observe that diverse data influences the weight landscape in a similar fashion as dropout. Additionally, we compare commonly used data augmentation methods with synthetic data created by generative models. We conclude that synthetic data can bring more diversity into real input data, resulting in a better performance on out-of-distribution test instances.
1 Introduction
Machine learning (ML) models excel at discovering patterns from training data, which allows them to make predictions on unseen data. However, as models grow more complex, they risk a phenomenon called overfitting – the tendency of models to capture not only meaningful patterns but also noise and random variations from the training data, resulting in poor generalization to new instances. To address this, model regularization techniques, such as dropout (Srivastava et al., 2014) and weight decay ( regularization)(Krogh & Hertz, 1991), are used in conjunction with Deep Neural Networks (DNNs) to enhance their generalization capability. While dropout reduces model complexity by randomly deactivating neurons during training, weight decay adds a penalty to the loss function based on the magnitude of model weights. These techniques shape the model’s weight landscape in different ways: dropout works by randomly deactivating neurons during each training iteration, forcing the network to distribute learning across multiple independent pathways rather than over-relying on particular features. Weight decay, on the other hand, encourages a smoother and more evenly distributed weight structure by penalizing large weights, pushing the model toward simpler and more generalizable solutions (Andriushchenko et al., 2023; Zhang et al., 2018).
Beyond direct parameter adjustments, empirical regularization techniques such as adding noise to input data or employing data augmentation have also proven effective for improving model generalization (Bishop, 1995). By exposing models to greater breadths of input patterns, these methods help improve their adaptability to diverse, real-world data. Despite existing evidence of their effectiveness, the underlying mechanisms of data augmentation remain an insufficiently studied area of research. Recently, synthetic data generated by models such as stable diffusion (Rombach et al., 2022) and large language models (LLMs) (Brown, 2020), has emerged as a promising, new approach to boost model performance(Sahu et al., 2023; He et al., 2022). Synthetic data not only augments existing datasets but also simulates rare events and edge cases (Santoso et al., 2017).
Similar to dropout, data augmentation acts as a form of regularization by introducing purposeful variability into the model’s training process. Techniques such as rotation, flipping, cropping, random erasing, color jittering, and mixup are used to modify input image data in deep neural networks (DNNs), therefore increasing the diversity of the data seen during training . This broader input variation helps prevent overfitting by encouraging the model to capture more generalizable features and patterns. Dropout shares the goal of enhancing diversity but achieves it by randomly deactivating neurons, forcing the model to explore different configurations of its weights. Weight decay, on the other hand, works by penalizing large weights to simplify the model, thus controlling complexity and preventing it from fitting noise in the training data. Ultimately, these regularization strategies aim to enhance model generalization – either by promoting adaptability through diverse representations (dropout and data augmentation) or by constraining complexity (weight decay) to avoid overfitting.
Given that these regularization methods all seek to improve generalization, albeit through different mechanisms, a natural question arises: does data augmentation have a similar effect on the neural network’s weight landscape as dropout or weight decay? To investigate our hypothesis, we utilize Random Matrix Theory (RMT), a statistical framework for analyzing the structure of large matrices, to analyze the changes in weight matrices across different regularization approaches. The weight matrix from a specific layer can be approximated as the sum of a random noise matrix and a difference matrix , so that
After a layer has been properly trained, either through extensive training on labeled data or fine-tuning on a downstream task, the difference matrix provides meaningful structural patterns that represent learned features, which are distinct from the random noise components (Martin & Mahoney, 2019). Thus, examining can provide insights into the effects of data diversity on the learned weight matrices (Pennington & Worah, 2017; Sagun et al., 2017), facilitating comparisons of robustness among regularization approaches. Specifically, measures of weight matrices, such as the empirical spectral density (ESD), reveal characteristic signals that indicate the presence of implicit self-regularization during training (Martin & Mahoney, 2019).
In this work, we focus on the transfer learning domain and investigate the changes in weight matrices between the pre-trained and fine-tuned models in response to data augmentation techniques. By examining these changes, we aim to understand the underlying mechanisms by which diverse input data improves model performance and generalizability. Previous studies have shown that fine-tuning can significantly alter the spectral properties of weight matrices, often resulting in changes that are consistent with improved feature specialization and adaptation to new tasks(Li et al., 2020). We investigate the effects of real and synthetic data on the weight landscape, using RMT to show how data augmentation interacts with regularization techniques such as dropout and weight decay. Additionally, we evaluate the impact of traditional and synthetic data augmentation on model robustness across both in-distribution (ID) and out-of-distribution (OOD) tasks.
Our contributions can be summarized as follows: (1) We investigate the changes in the weight space of Deep Neural Networks (DNNs) resulting from varying levels of data diversity; (2) we provide theoretical and empirical insights into why diverse data improves model performance, linking these findings to changes in learned feature representations and their robustness; and (3) we explore the use of synthetic data generated through generative models, evaluating its effect on both in-distribution (ID) and out-of-distribution (OOD) tasks to determine how it complements traditional data augmentation approaches in improving model robustness and generalization. Our study offers a comprehensive perspective on how data diversity, both from real and synthetic sources, influences the internal dynamics of DNNs.
2 Methods
2.1 PRELIMINARY
This section introduces data diversity measurement and the basics of RMT, as well as the metrics that will be used in the subsequent analyses.
2.1.1 Regularization
Dropout. Dropout (Srivastava et al., 2014) helps minimize overfitting during training by randomly disabling neurons in fully connected layers based on a given probability . This randomness is controlled by a Bernoulli distribution, where neurons are either kept or deactivated during each training iteration. However, during inference, all neurons are active. To ensure consistency between training and inference, the output is scaled by during training. Dropout has become almost a default method for training or fine-tuning deep neural networks. In this paper, we implement dropout operations on different layers in transformer-based models.
Weight Decay. Weight decay (Krogh & Hertz, 1991; Ishii & Sato, 2018) is another commonly used regularization technique to prevent overfitting. It works by adding a small penalty, which is proportional to the size of weight parameters, to the loss function during training. This encourages the model to keep weights smaller. During training, the weights are updated not only based on the prediction error-induced losses but also on this penalty, which pushes the model to find simpler solutions.
Data Augmentation. Data augmentation (Rebuffi et al., 2021; Shorten & Khoshgoftaar, 2019) is a strategy to artificially expand the size and diversity of training datasets without requiring the acquisition of new data. This technique involves applying a range of transformations to existing samples, such as flipping, cropping, adjusting brightness, and adding noise. Mixup (Zhang, 2017) is a specific data augmentation technique that creates new training examples by linearly combining pairs of input data and their corresponding labels. By introducing these variations, data augmentation enables models to learn more robustly from a wider array of instances, improving generalization. This approach is particularly advantageous in domains related to image tasks.
2.1.2 Diversity Measure
Vendi Score (Dan Friedman & Dieng, 2023) has been recently proposed for measuring diversity in ML data. This score quantifies data diversity based on the similarities between elements in a dataset, making it particularly useful for evaluating the effectiveness of data augmentation techniques and assessing the diversity of synthetic samples from generative models. The score is derived by using a set of samples along with a pairwise similarity function, which calculates a value that reflects the effective count of unique elements in the dataset. More specifically, given a positive semi-definite matrix representing similarity scores, the Vendi Score (VS) is defined as
where are the eigenvalues of the matrix , with the definition of . In essence, VS is the exponential of the von Neumann entropy of the scaled similarity matrix, , equivalent to the Shannon entropy of this matrix’s eigenvalues, also known as effective ranks. The higher the Vendi Score, the more diverse the dataset is. For evaluating images, Vendi Score provides two correlation methods (as the similarity function) – the pixel-pairwise correlation by comparing raw pixels directly and the correlation of the embeddings learned from pre-trained models. We use VS as a diversity measure to evaluate different datasets. The default embedding model of VS is INCEPTION V3, which we replace with CLIP in this paper.
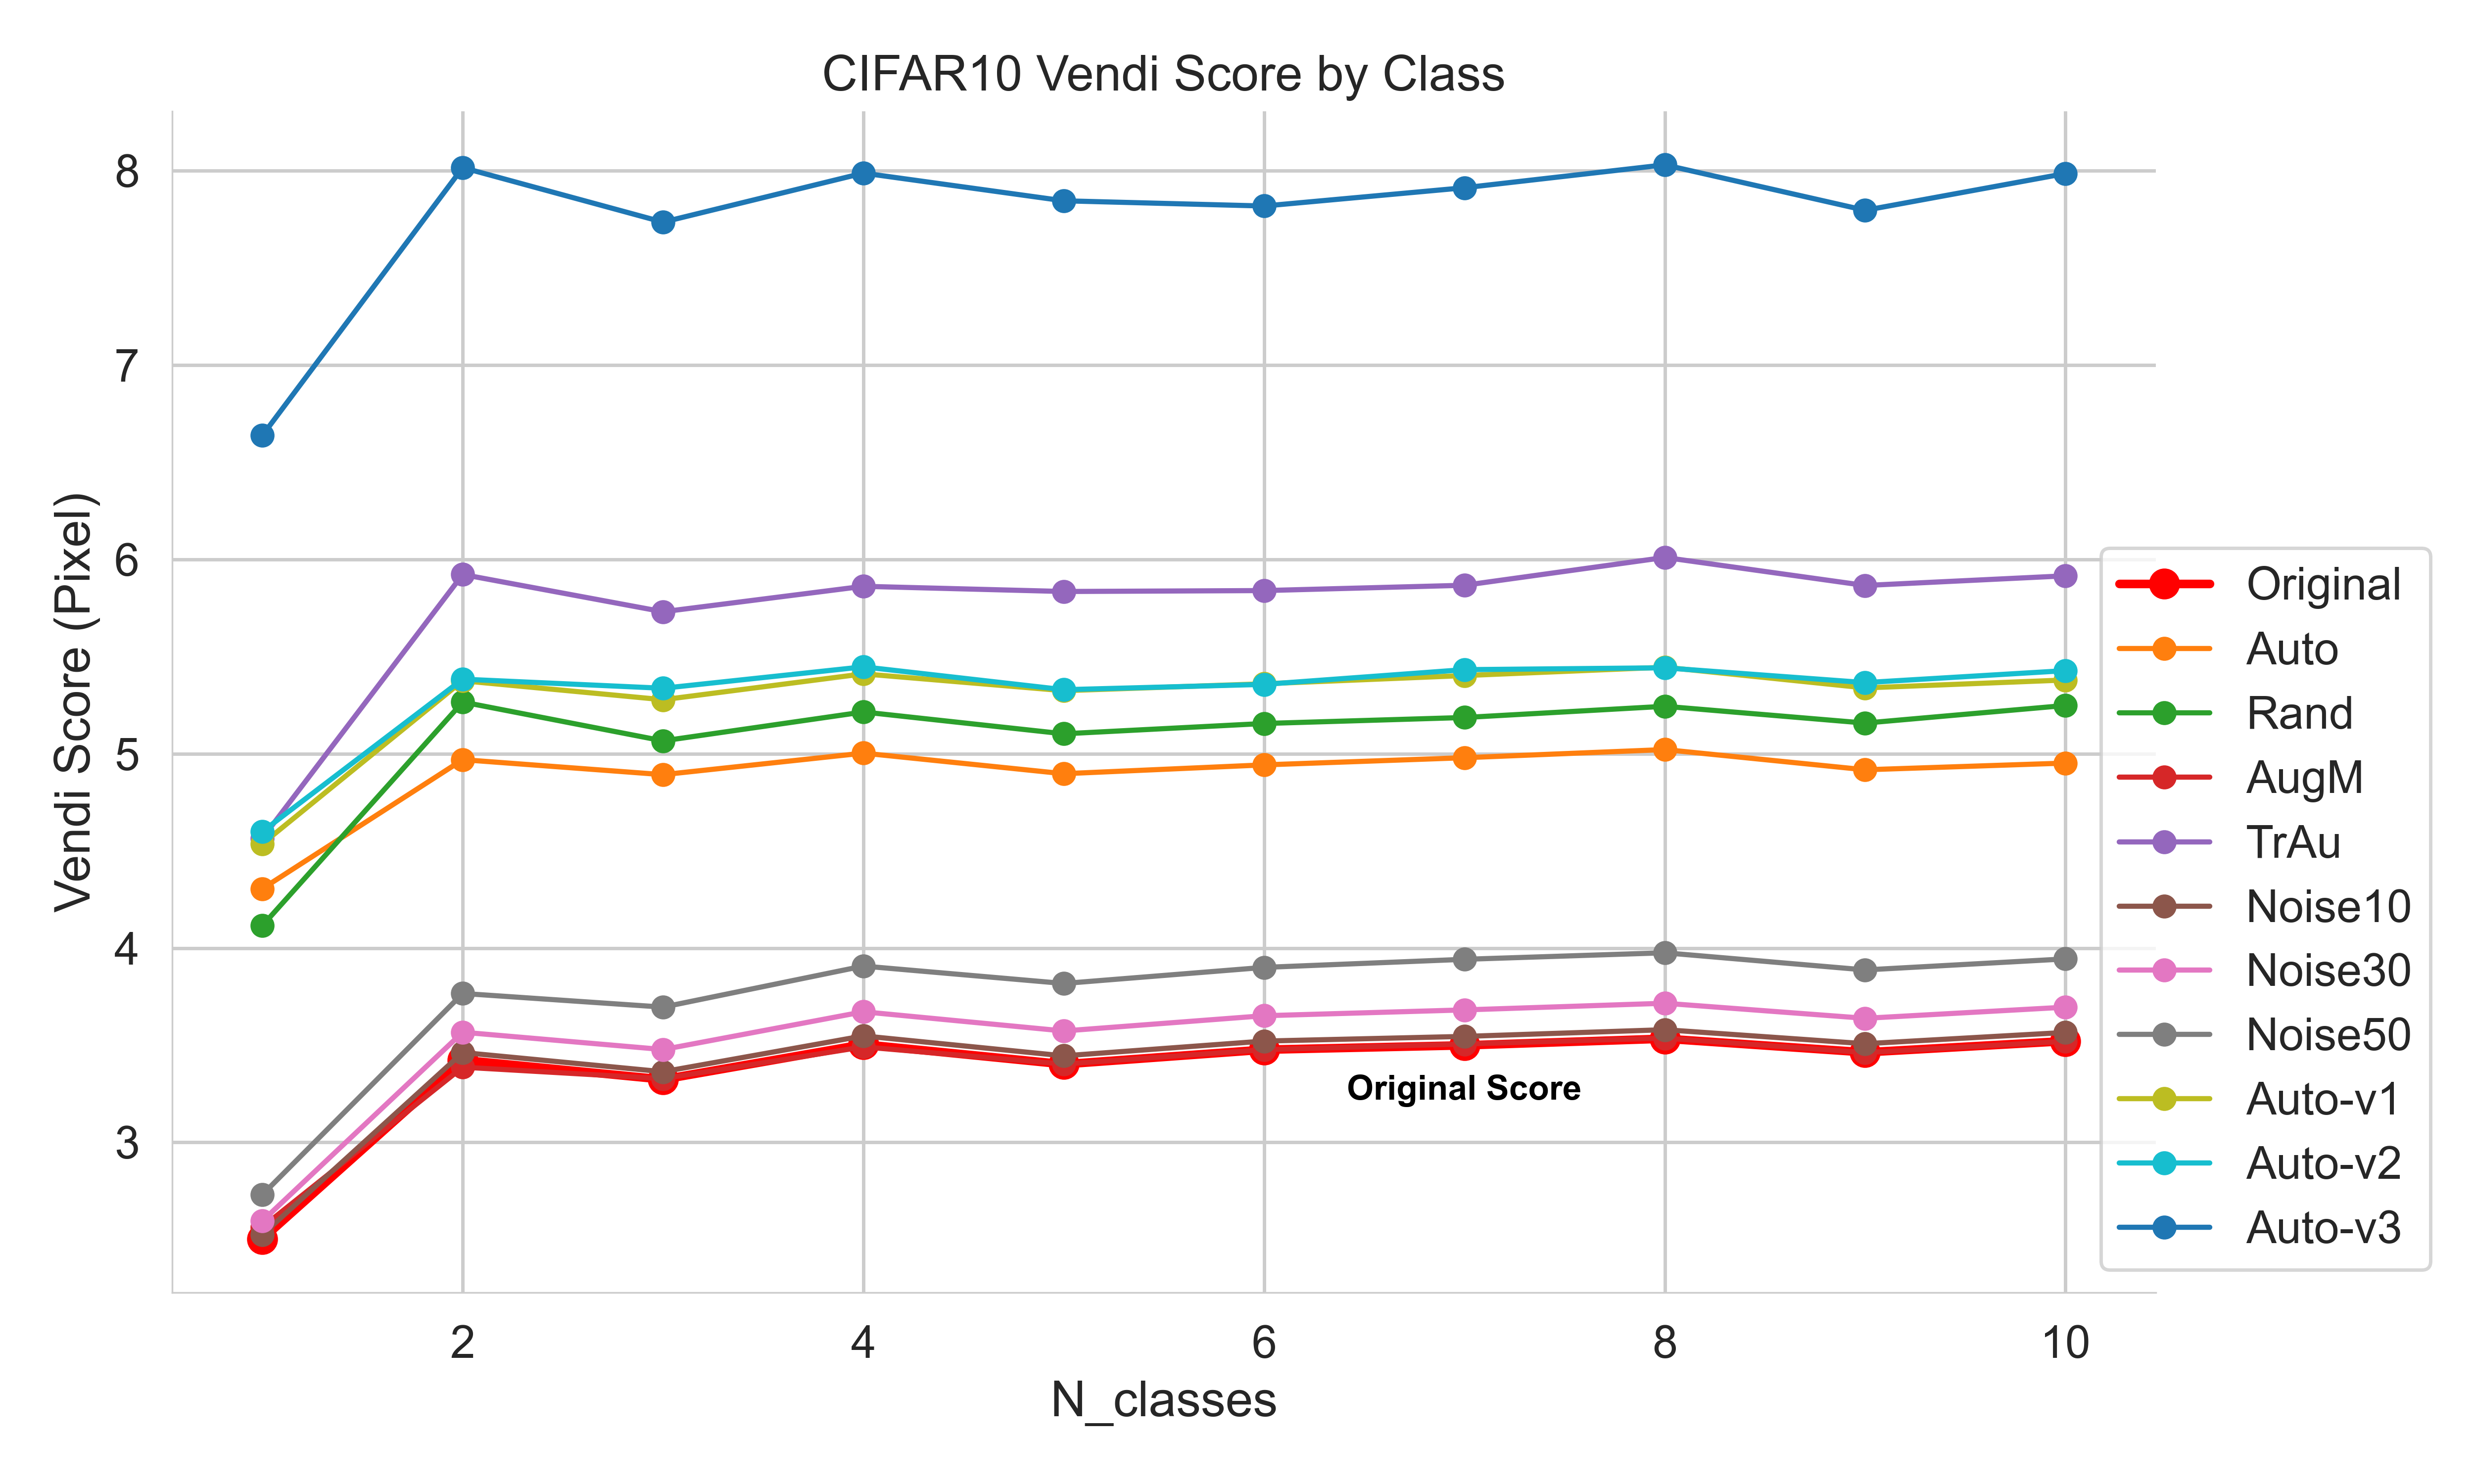
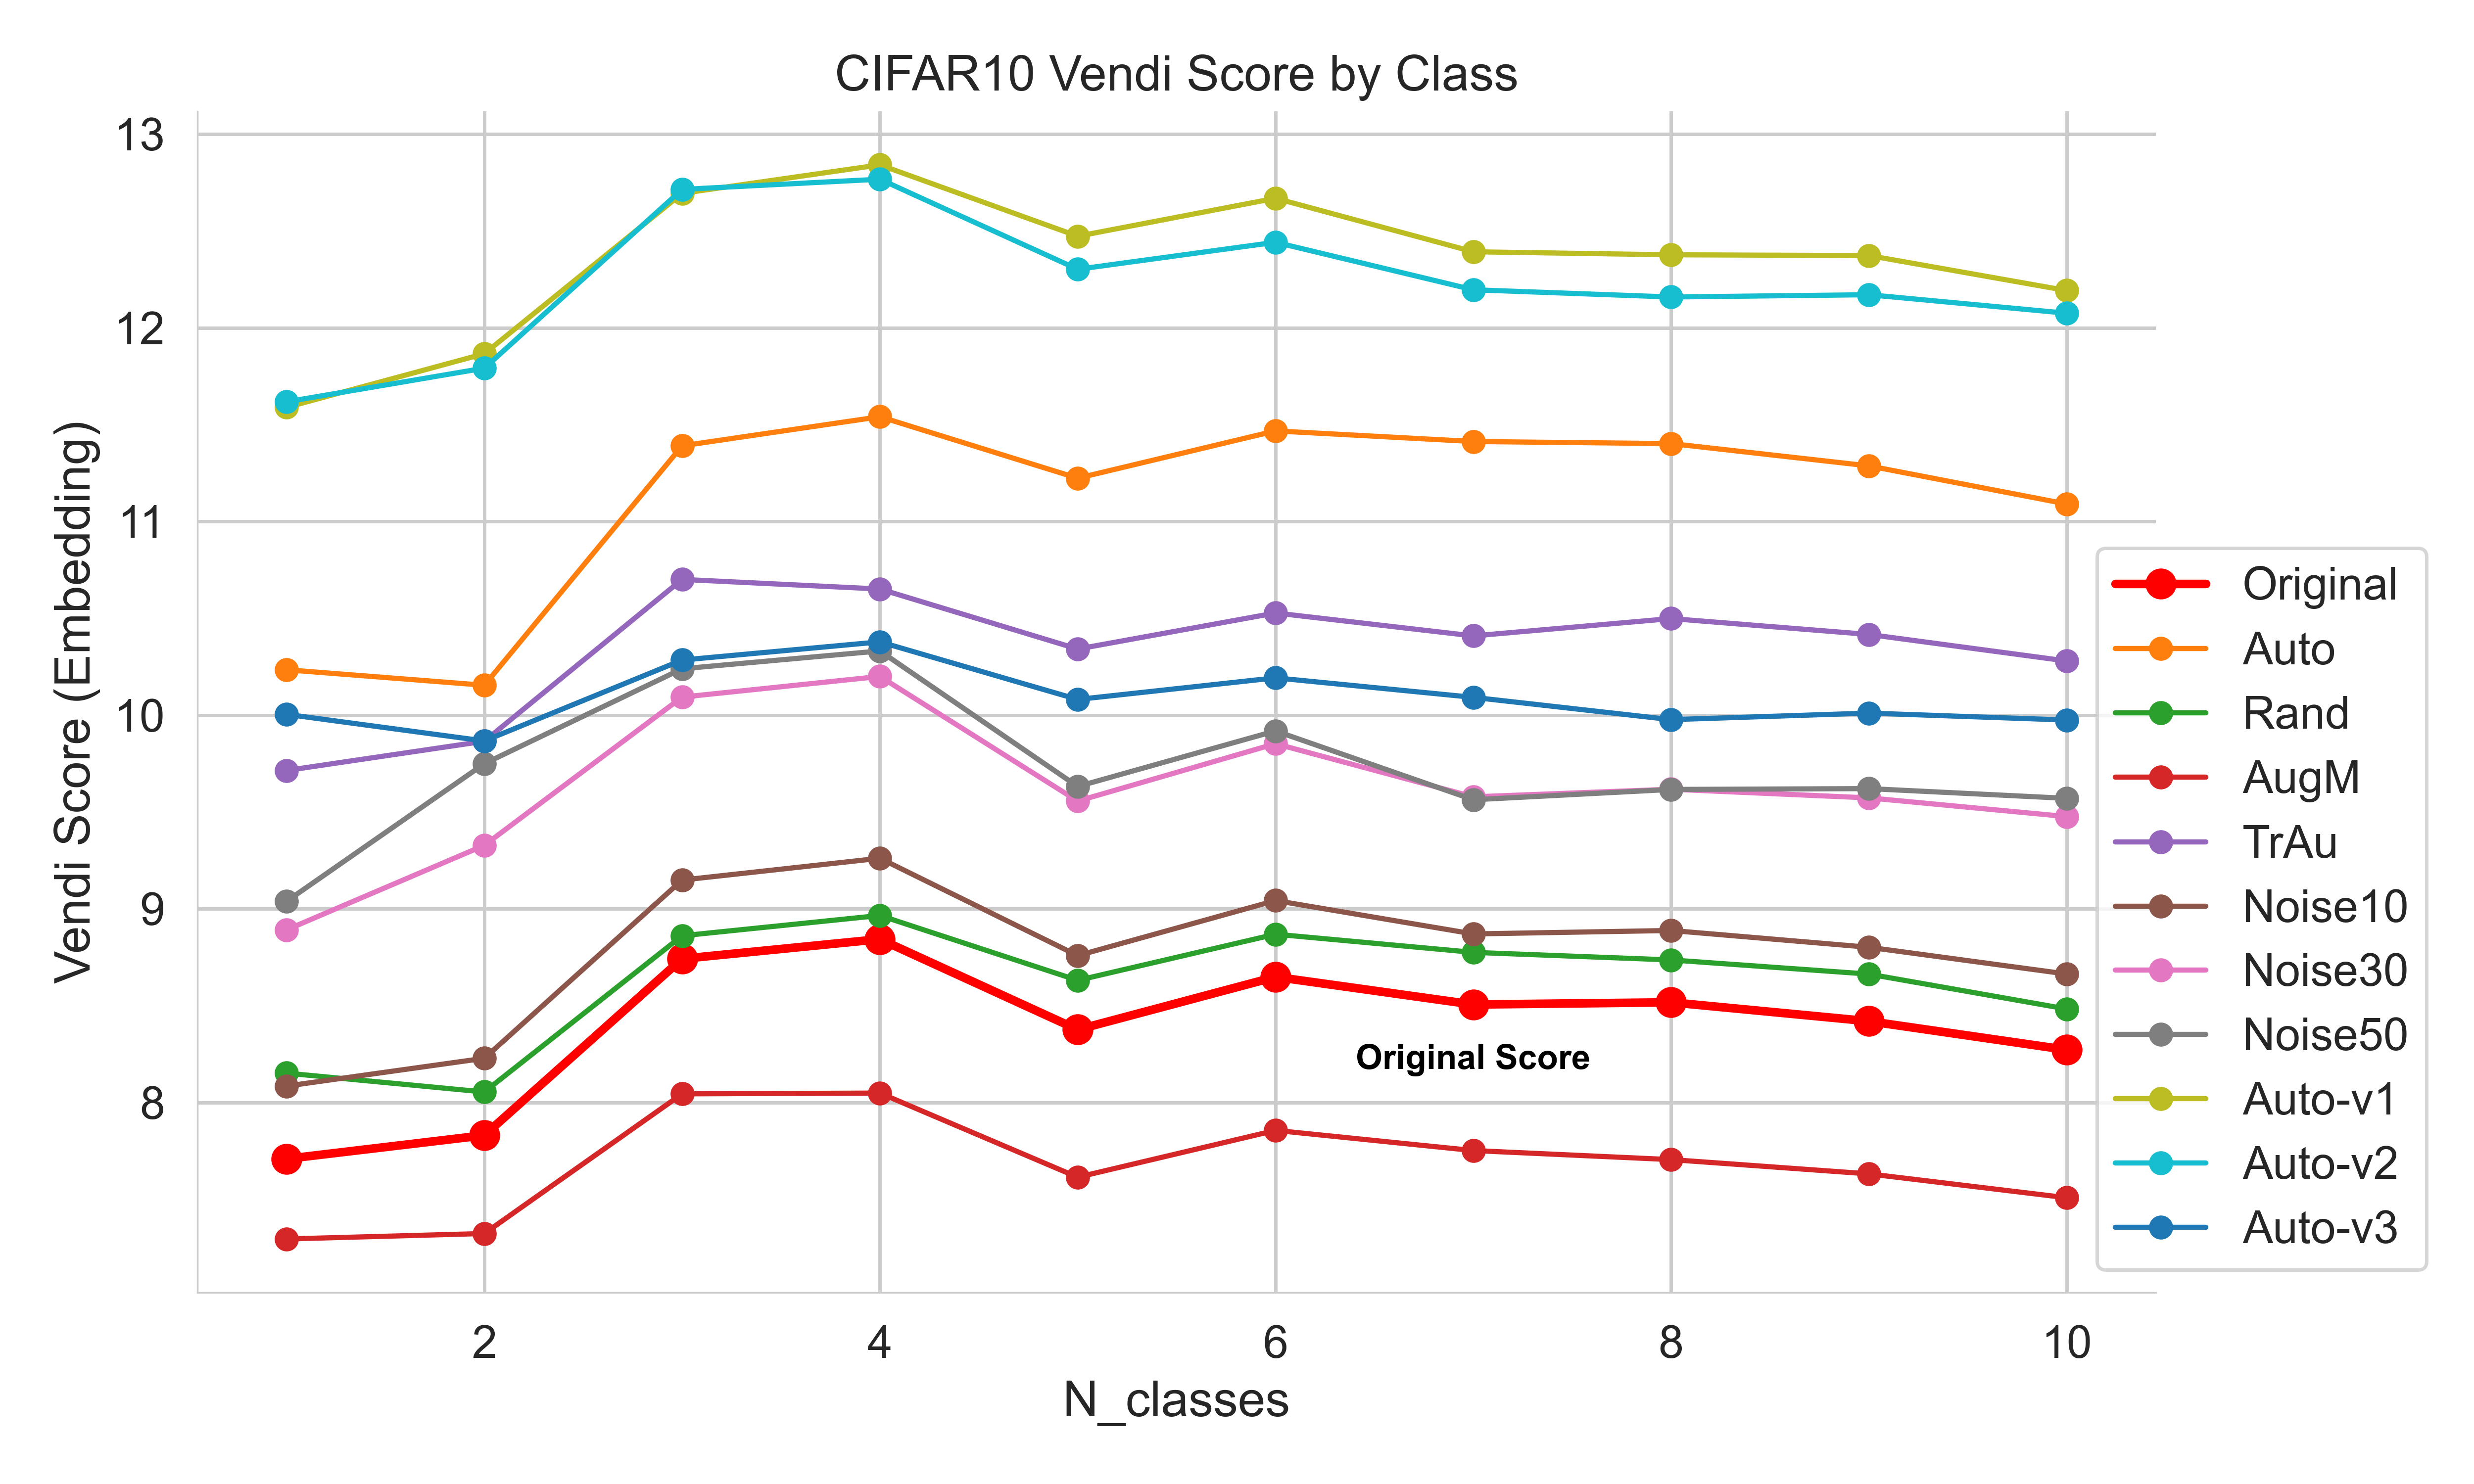
From Figure 1 one can see that the commonly used image augmentation methods typically increase the input data diversity. Some methods (e.g., Auto-v3) elevate the diversity score larger than others. Furthermore, when the number of label classes increases, the diversity score will initially increase but drop after-then. This indicates that the output label diversity can be captured by input similarities to a certain extent. We also observe that pixel-wise diversity scores do not always match embedding-wise scores after applying data augmentation. Similarly, we will see later that synthetic data itself is less diverse than real data but when it is combined with real data, the combined dataset can often reach a higher diversity score.
2.1.3 Random Matrix Theory
Consider a -layer DNN with corresponding weight matrices . For each weight matrix with shape , assume without loss of generality that (otherwise, consider ). The correlation matrix is defined as
The eigenvalues of are given by .
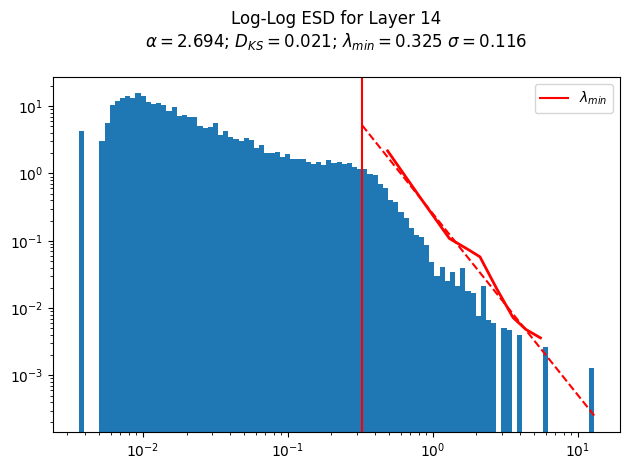
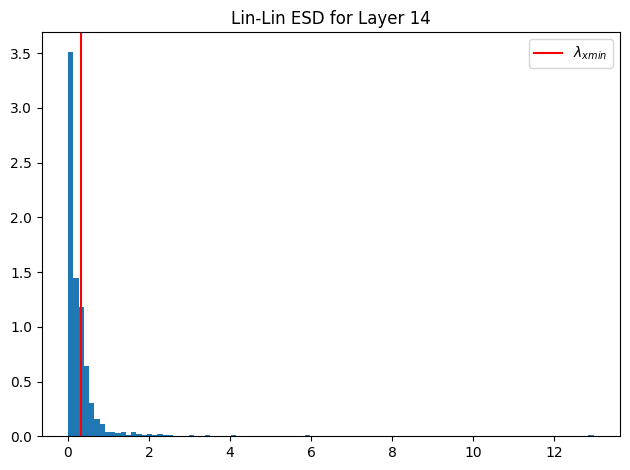
Let denote the correlation matrix’s Empirical Spectral Density (ESD). According to RMT, the ESD of a Gaussian-noise random weight matrix follows the Marchenko-Pastur (MP) distribution when the matrix dimension grows large. The MP distribution often exhibits a bulky shape. However, the empirical study of Martin and Mahoney (Martin & Mahoney, 2021) showed that, for a well-trained DNN model, specifically for a pre-trained large model, the ESD of its weight correlation matrix is heavy-tailed, not following the Gaussian noise-based MP distribution. They called it the Heavy-Tailed Self Regularization theory. Specifically, a Power Law (PL) distribution can be used to fit the heavy tail, which is given by
Here, takes values in the interval , and is chosen to be the maximum eigenvalue of the empirical correlation matrix, while is selected to obtain a better power-law fitting, which is not generally equal to the minimum eigenvalue.
The discussion above justifies the decomposition of weight matrix into two components – a random matrix and a difference matrix , which are represented by the bulk and tail of ESD, respectively, based on Martin and Mahoney’s theory. Analyzing properties of both and can obtain insights into how models are trained. Figure 2 shows the are selected to divide the ESD into bulk () and tail () parts. The exponent of a fitted PL distribution characterizes the tail behavior of the ESD, which is in close relevance to the model’s generalization capability. A smaller represents a more “heavy-tailed” landscape in ESD. More large eigenvalues in the tail of ESD will exert more influence on the model’s weight spaces.
2.2 Analysis Approach
Since the heavy-tailed nature of pre-trained models, we cannot obtain direct conclusions if our evaluation is based on a single metric. Instead, we focus on the trend of how regularization and diverse data influence the weight spectrum by calculating the differences in multiple metrics before and after fine-tuning on specific downstream tasks to gain valuable insights. For example, the initialized in the classification layer is around 6 while its value after fine-tuning can still display a certain degree of heavy-tailed property (2-6 typically). The relative changes compared with the baseline (no regularization applied) tell us the direction and magnitude of the impact of a regularization method on the weight landscape.
Let be a set of metrics that can capture the properties of the spectral in weight matrices. denotes the distance of these metrics in the spectral space between pre-trained models and fine-tuning models with/without regularization or data augmentation, i.e.,
These metrics can be categorized from two perspectives – scale metrics and shape metrics. Scale metrics measure the magnitude of eigenvalues or the overall size of the weight matrix, while shape metrics describe the distribution and structure of the eigenvalues. Scale metrics include Frobenius Norm, Spectral Norm, Stable Rank, and MP Soft Rank (Martin & Mahoney, 2019). The definitions of some of these metrics are given below:
|
|
|
|
Shape metrics include power law exponent , matrix entropy, number of power-law spikes (num_pl_spikes), etc.
|
Matrix Entropy:
|
The metric num_pl_spikes counts the number of eigenvalues that are larger than .
Table 1 describes how the changes in these metrics may reflect the changes in weight space and the corresponding characteristics of its spectrum. Our spectral analysis is implemented by a tool called WeightWatcher(Martin et al., 2021), which provides multiple scale and shape metrics.
| Metric | Change | ESD | |
|---|---|---|---|
| Less complex , fewer directions dominate. | A sharper drop-off in ESD, less ”heavy-tailed” | ||
| More complexity, more dominant directions. | A slower decay in ESD, more eigenvalues with large magnitudes | ||
| Matrix Entropy | More diverse and less structured weight patterns | More uniform distribution of across the spectrum | |
| More organized and meaningful weight structures | More concentrated around a few large | ||
| Frobenius Norm | Larger weight values overall | Larger in total | |
| Smaller weight values | Overall shrink | ||
| Spectral Norm | At least one dominant direction in | More outliers in the long tail | |
| The maximum influence of any single direction is reduced | Smaller maximum , more compact distribution | ||
| num_pl_spikes | More important and distinct features in | More separate from the | |
| Weight structure becomes more random-like | More uniform bulk distribution with fewer outliers |
3 Experiment
3.1 Experiment Setup
We employ the state-of-the-art text-to-image model CLIP (Radford et al., 2021) given its powerful capability of performing image classification tasks and fine tune CLIP on CIFAR-10 and CIFAR-100 (Krizhevsky et al., 2009). During fine-tuning, we freeze the text encoder, thus only the weights in the image encoder and the last classification layers are updated. The pre-trained vision model we used is CLIP-VIT-B32. The setting of the following training hyperparameters – a learning rate of 1e-5, 5 epochs, and a batch size of 32 – are kept the same in all experiments. Model performance measures are evaluated on the real test images.
3.2 Impact of Regularization
The default CLIP-VIT-B32 model does not apply dropout in the image encoder. To investigate the impact of dropout on both hidden layers and output layers, we add dropout layers in both MultiheadAttention layers and feedforward layers within each transformer block, as well as in the final classification layer. In the hidden layers, dropout is applied after the normalization layer. The dropout rate in the baseline model is zero, and we subsequently deploy the dropout rates of 0.1, 0.3, 0.5, and 0.7 to conduct a comparison study. The weight decay values are varied with six levels – 1e-5, 5e-5, 1e-4, 5e-4, 1e-3, and 5e-3 – to investigate how they change weight matrices.

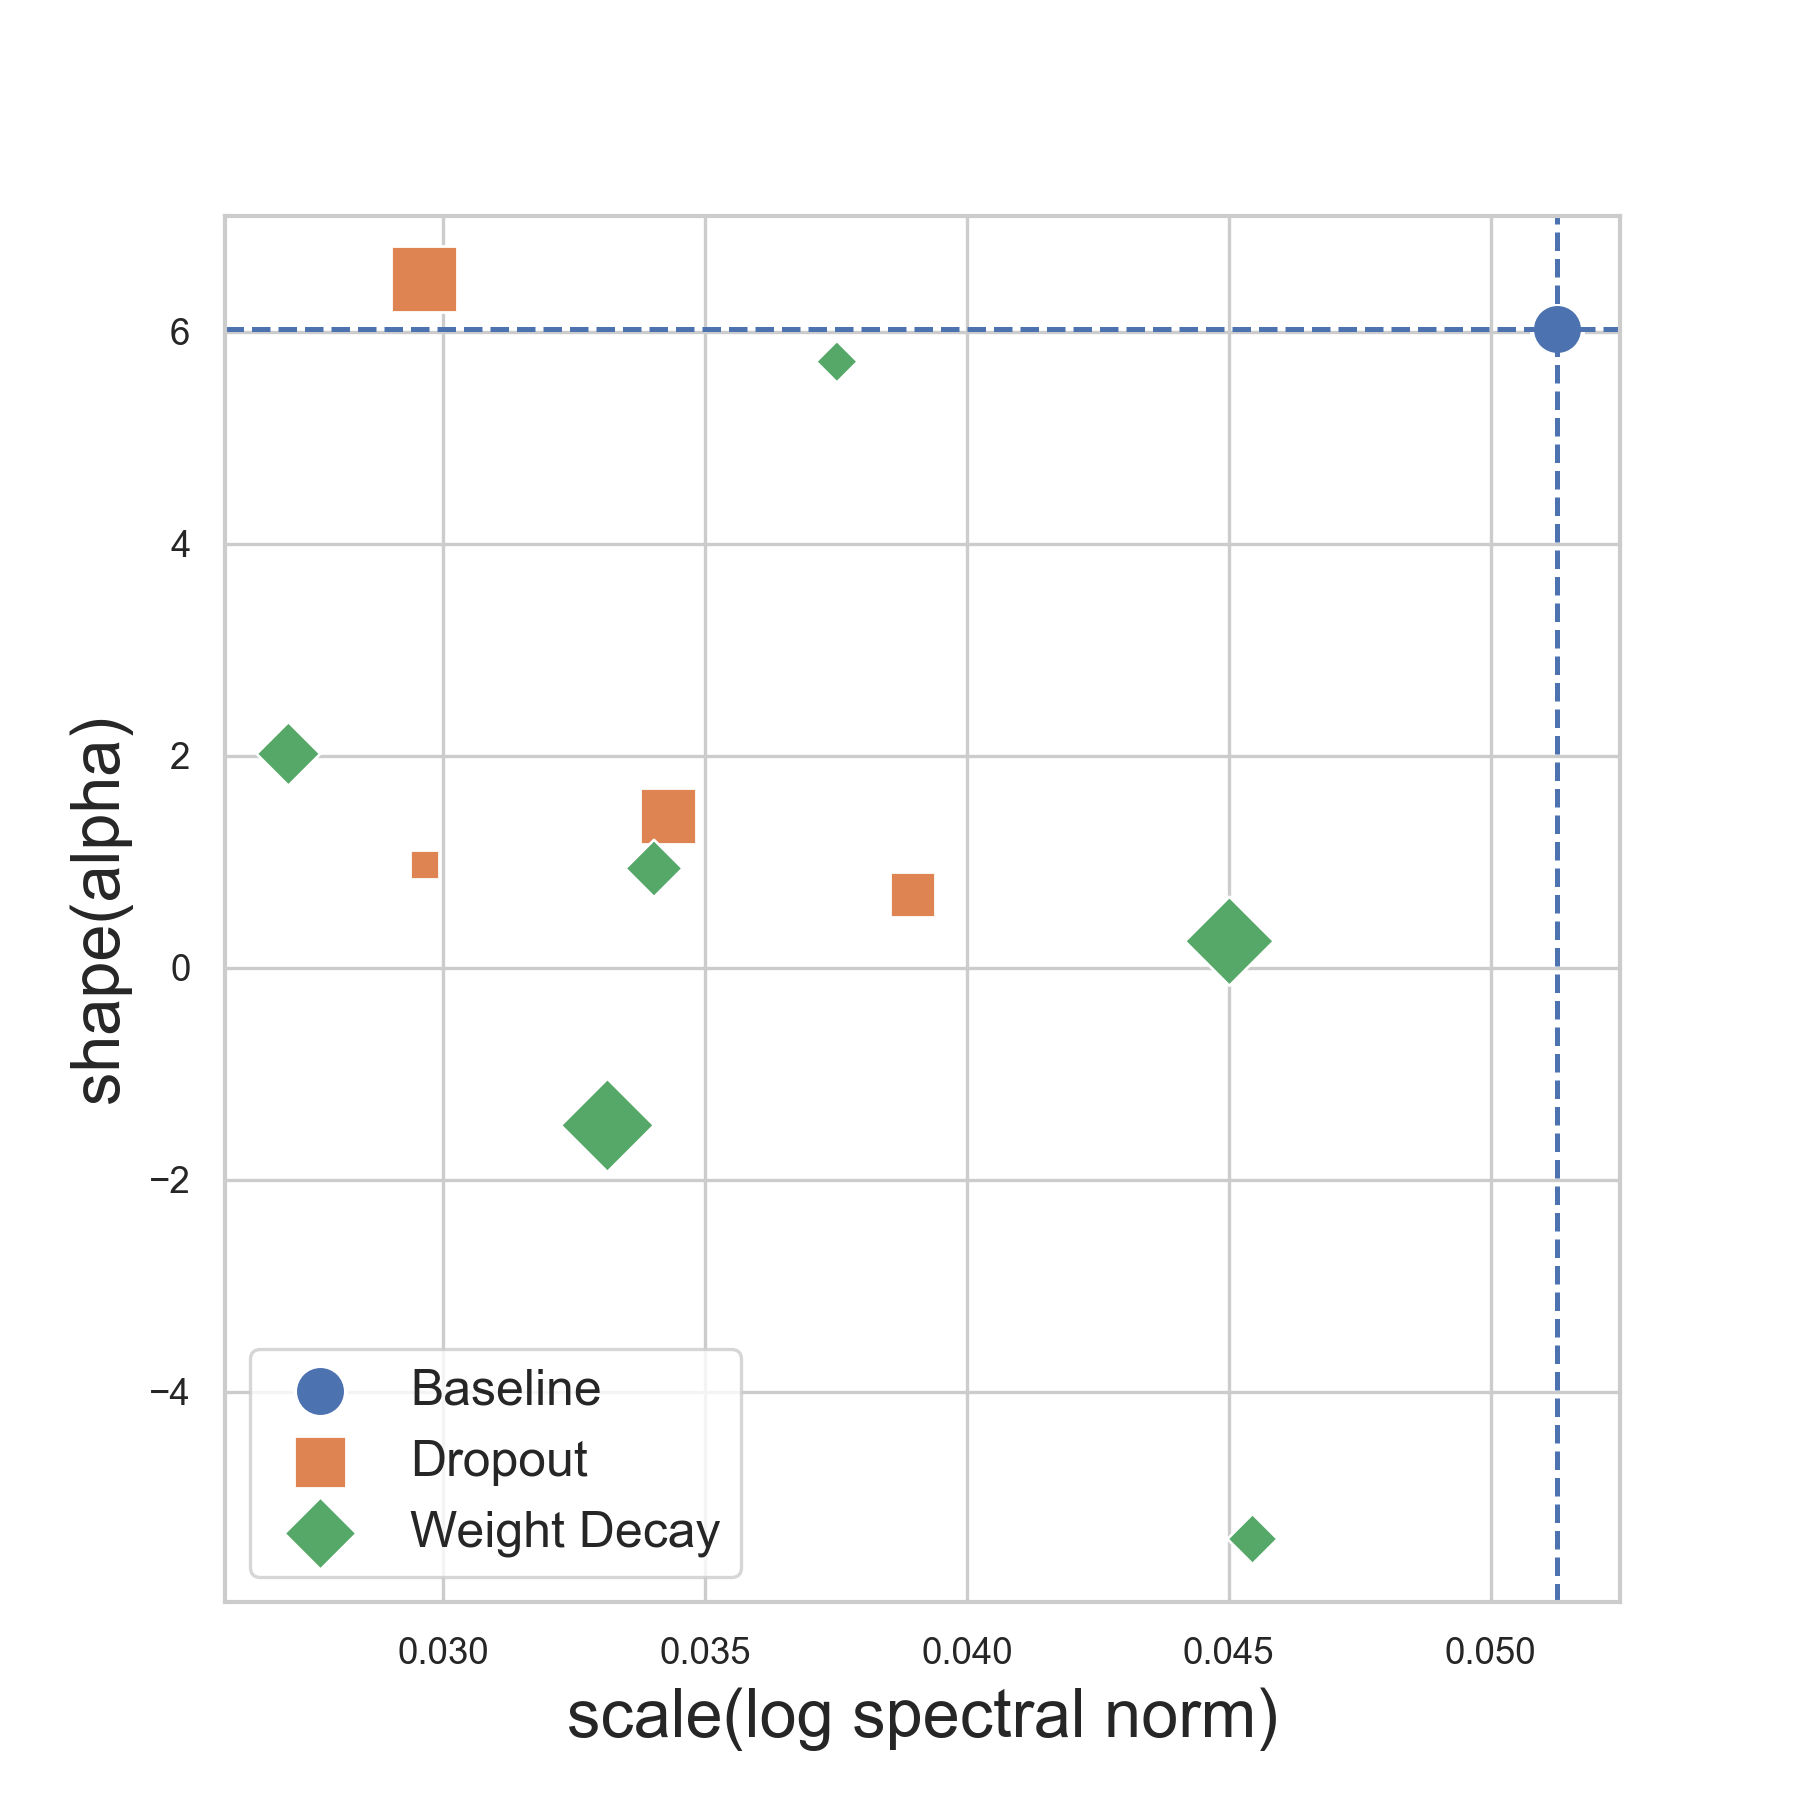

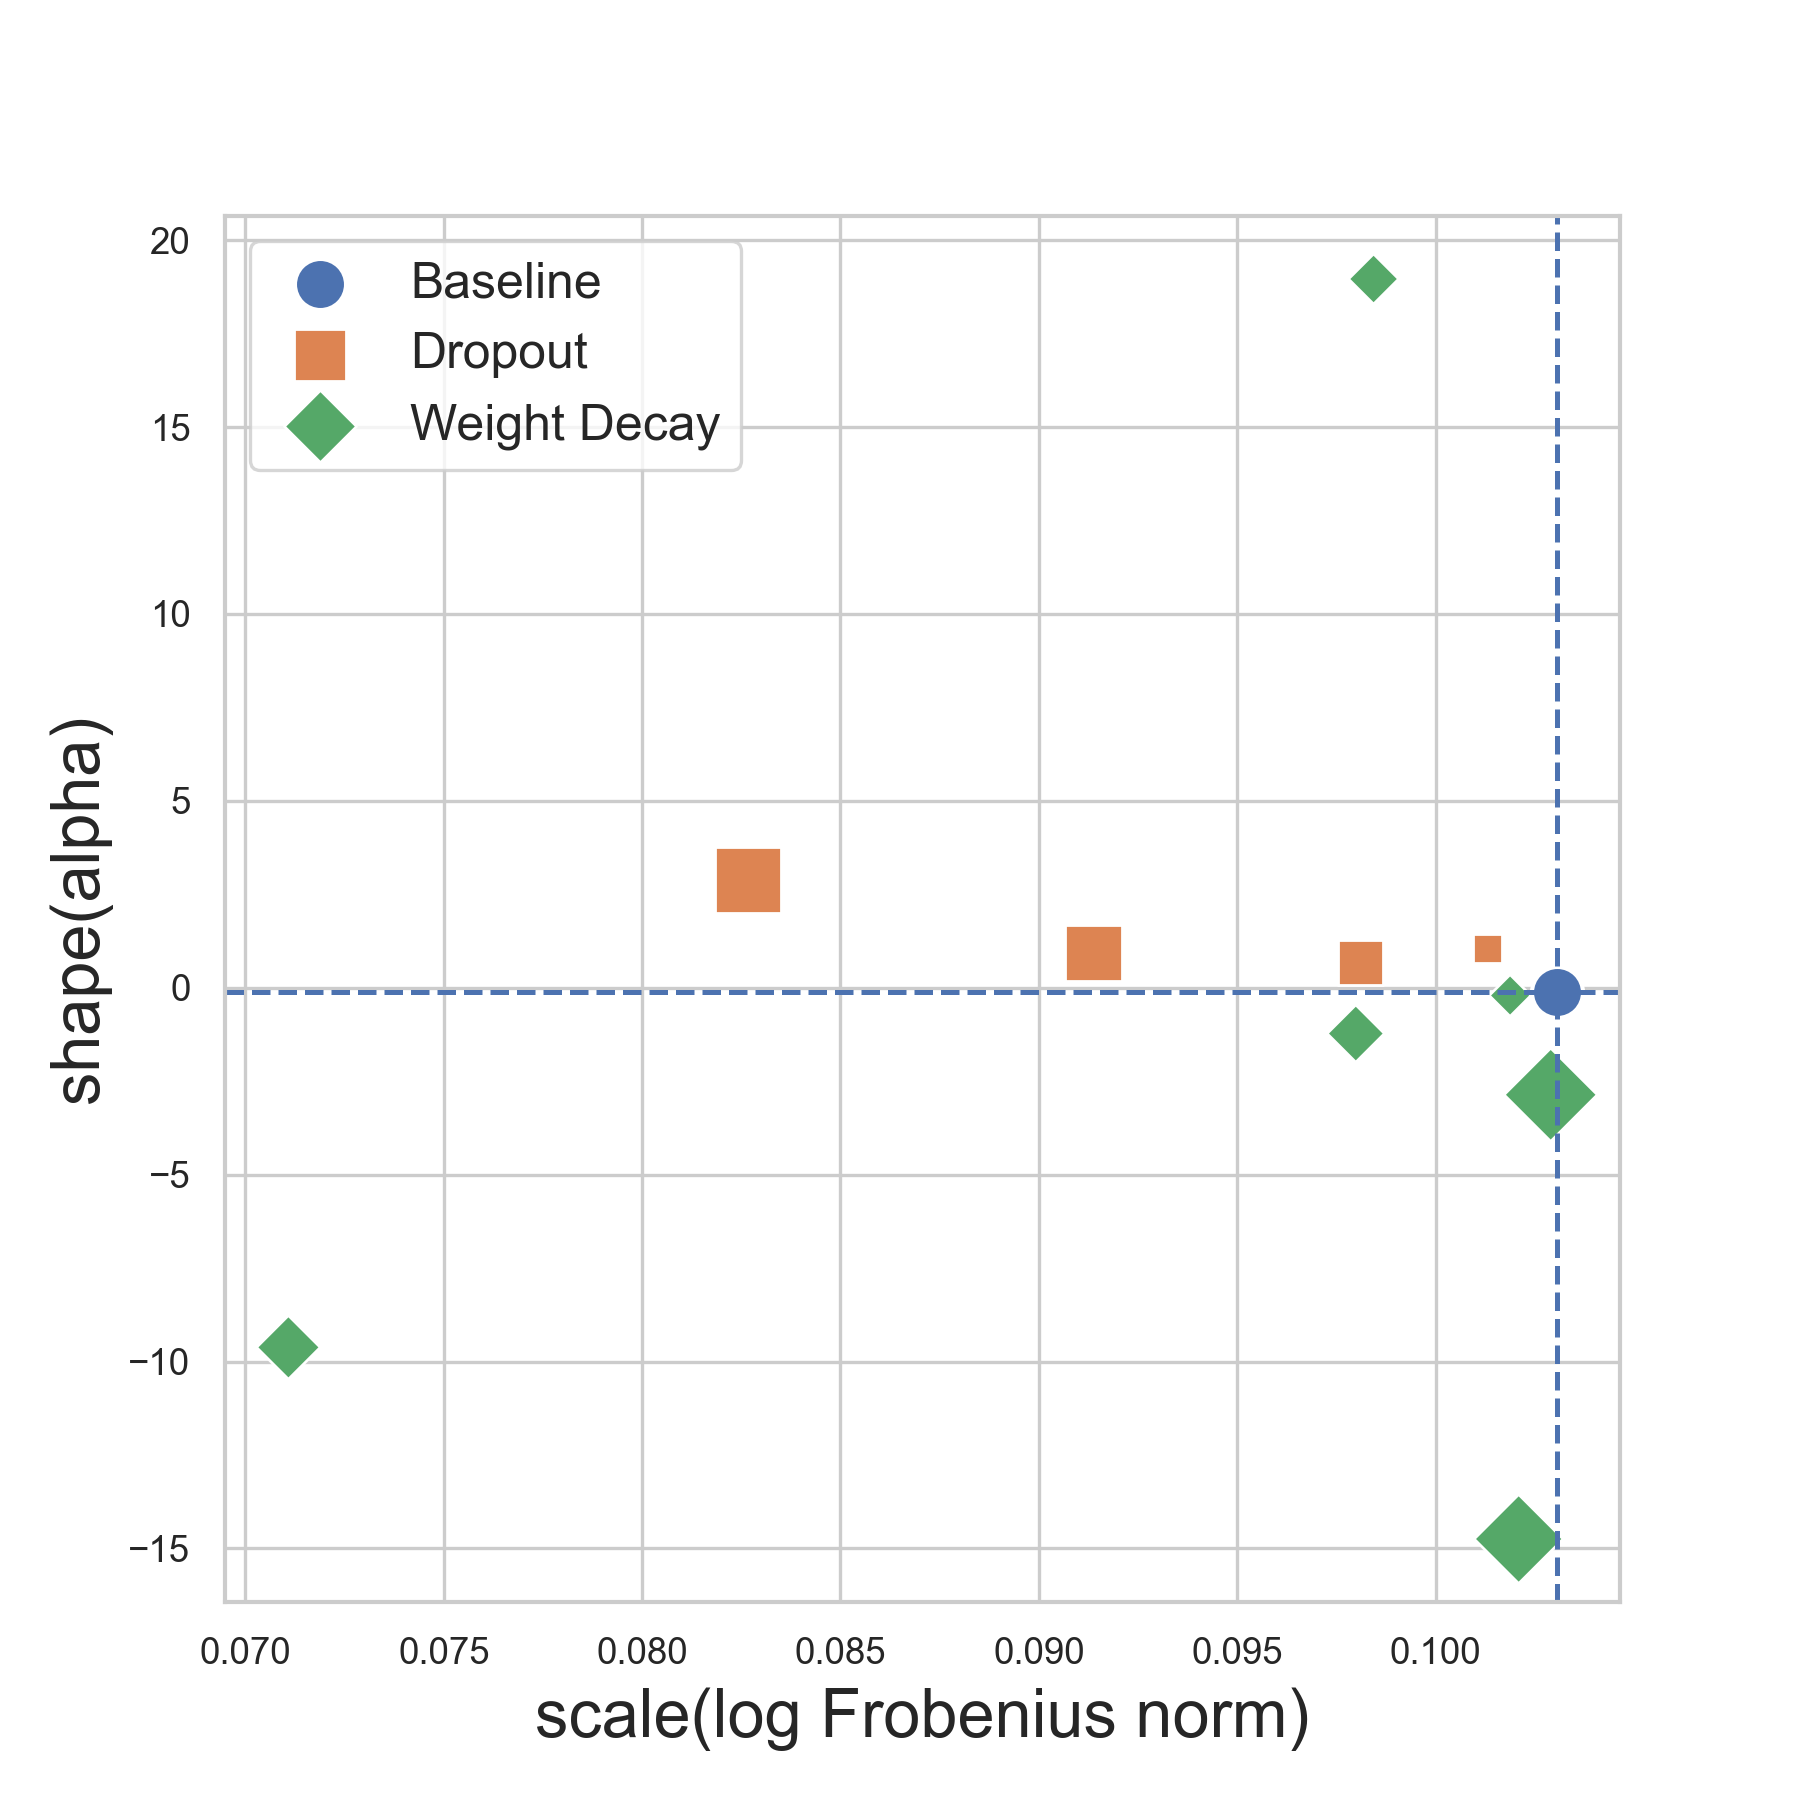
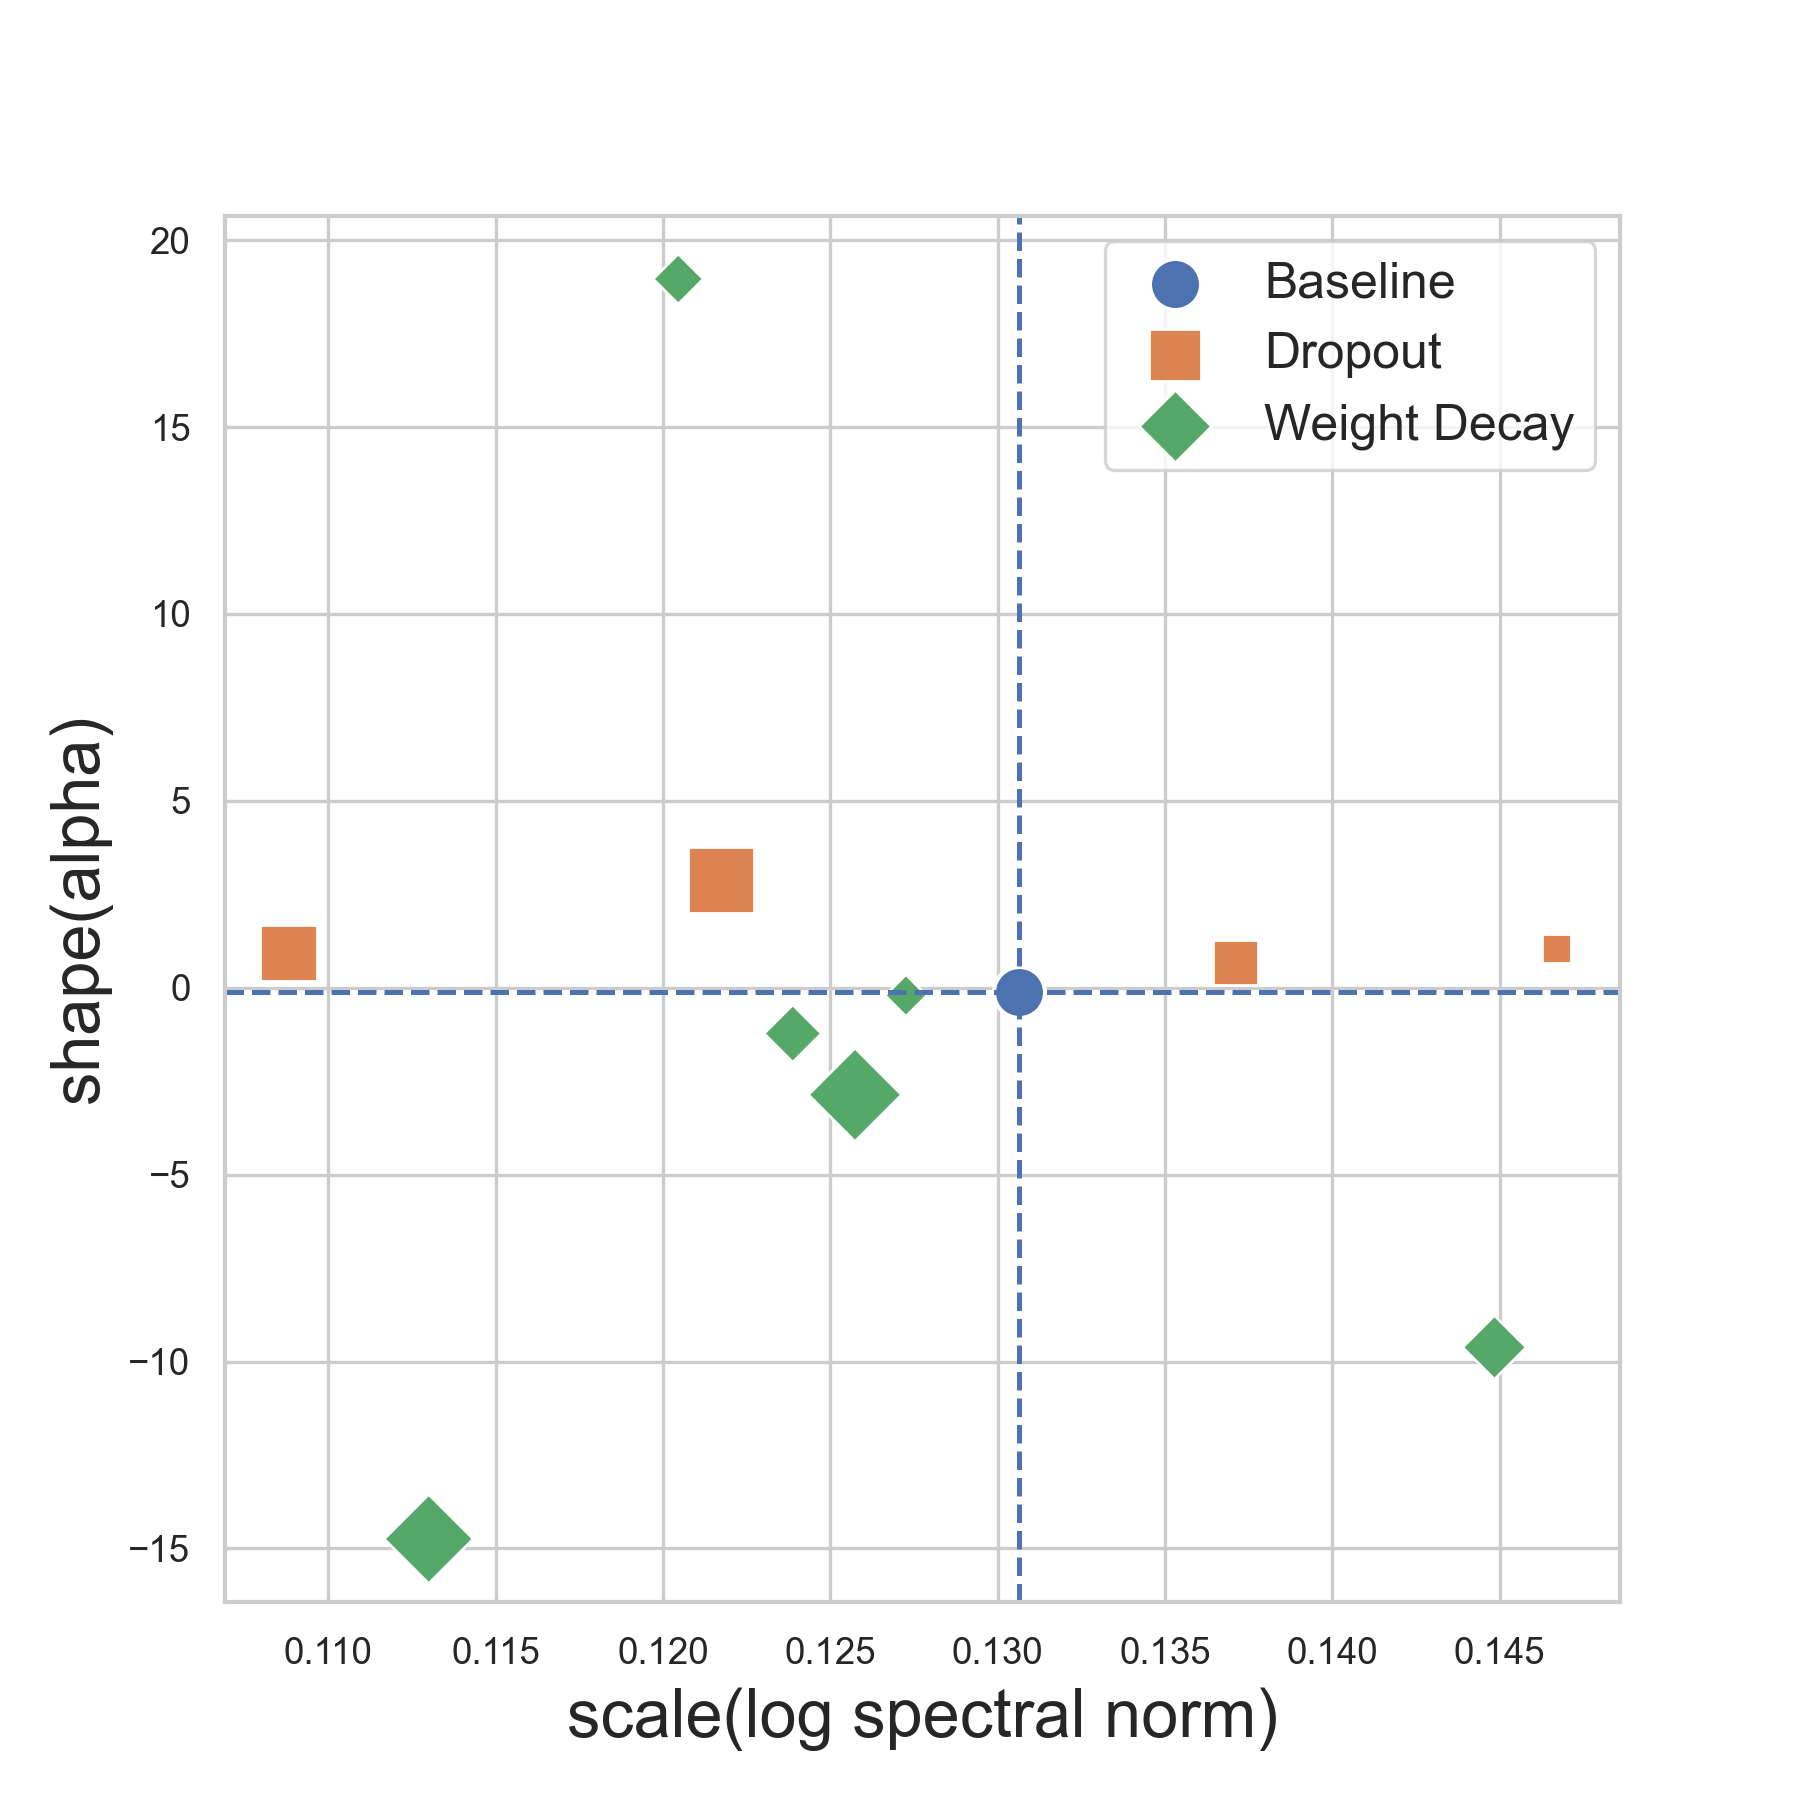

Figure 3 shows the scale-shape plot of distance measure () on CIFAR-10 and CIFAR-100 datasets. The horizontal and vertical dash lines show the position of the baseline, to which no regularization technique is applied. These lines divide the plot into 4 quadrants, which assist in understanding the impact of a regularization technique on the weight matrix as comparing to the baseline. If two different regularization techniques give similar change directions of , we consider they have similar impacts on the weight space. Compared with the baseline, dropout tends to increase the value of , reduce the Frobenius Norm, and decrease the number of spikes in ESD when the dropout rate increases. In particular, dropouts tend to reduce the largest eigenvalue (the spectral norm) of the weight matrix. On the other hand, increasing weight decay leads to a drop of significantly, and it increases the num_pl_spikes, which represents a more heavy-tailed ESD. Similar to dropout, weight decay reduces the largest eigenvalue. Smaller weight decay values make the overall size of the weight matrix shrink more effectively.
Summary. After fine-tuning the same dataset, dropout, and weight decay display a certain degree of resembling behaviors on some ESD metrics but diverge on others. In scale metrics, both dropout and weight decay can significantly shrink the size of the weight matrix and diminish the largest eigenvalue. But in shape metrics, dropout encourages a more evenly distributed ESD, while weight decay tends to make long-tailed ESD, thus increasing the nonrandom part of the weight matrix.
3.3 Impact of Data Diversity
To increase training data diversity, we implement ten types of data augmentation: First, four automatic image augmentation techniques in PyTorch are applied: AutoAugment (Cubuk et al., 2018), RandAugment (Cubuk et al., 2020), AugMix (Hendrycks et al., 2019), and TrivialAugment(Müller & Hutter, 2021). Then we add Gaussian noise into the original images with a ratio of 0.1, 0.3, and 0.5. Finally, we created three advanced augmented datasets by combining AutoAugment with other data augmentation methods. They are auto-v1: AutoAugment + Gaussian noise with 0.5 ratio; auto-v2: AutoAugment + Gaussian noise with 0.5 ratio + RandomHorizontalFlip + RandomVerticalFlip; auto-v3: AutoAugment + Gaussian noise with 0.5 ratio + ElasticTransform. We try to combine multiple data augmentations to explore how diverse datasets we can create (also see Figure 1).
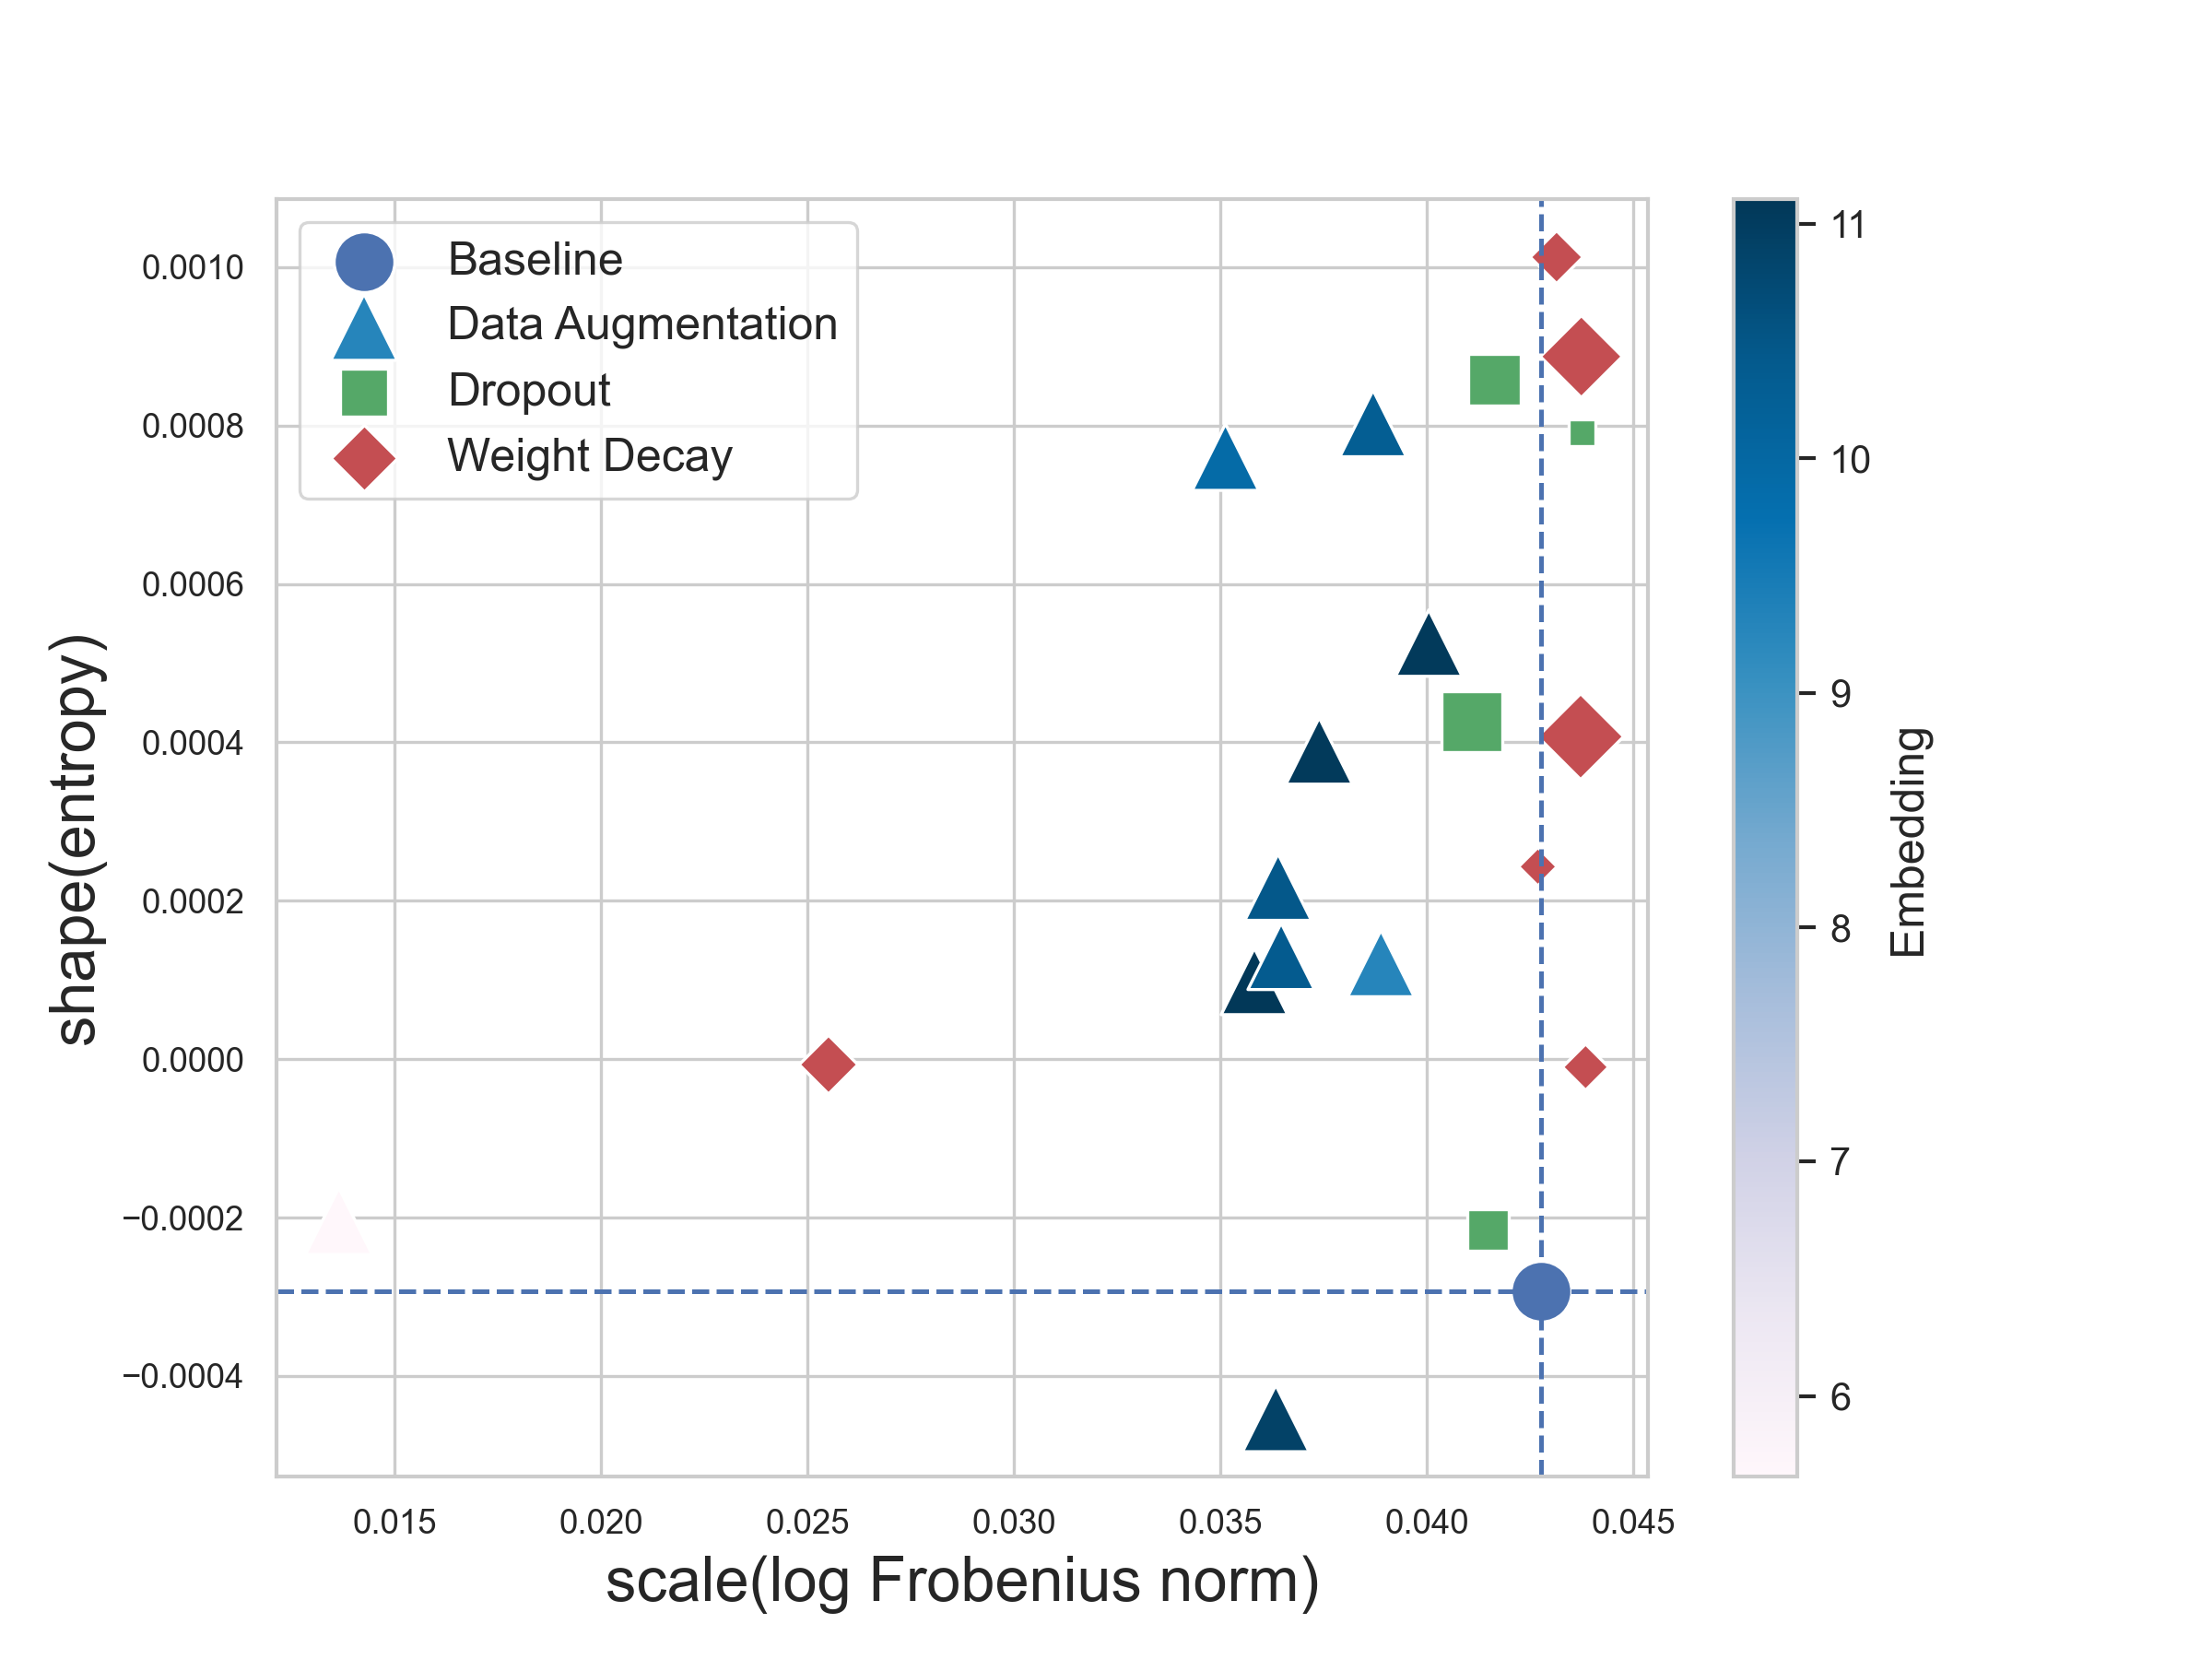
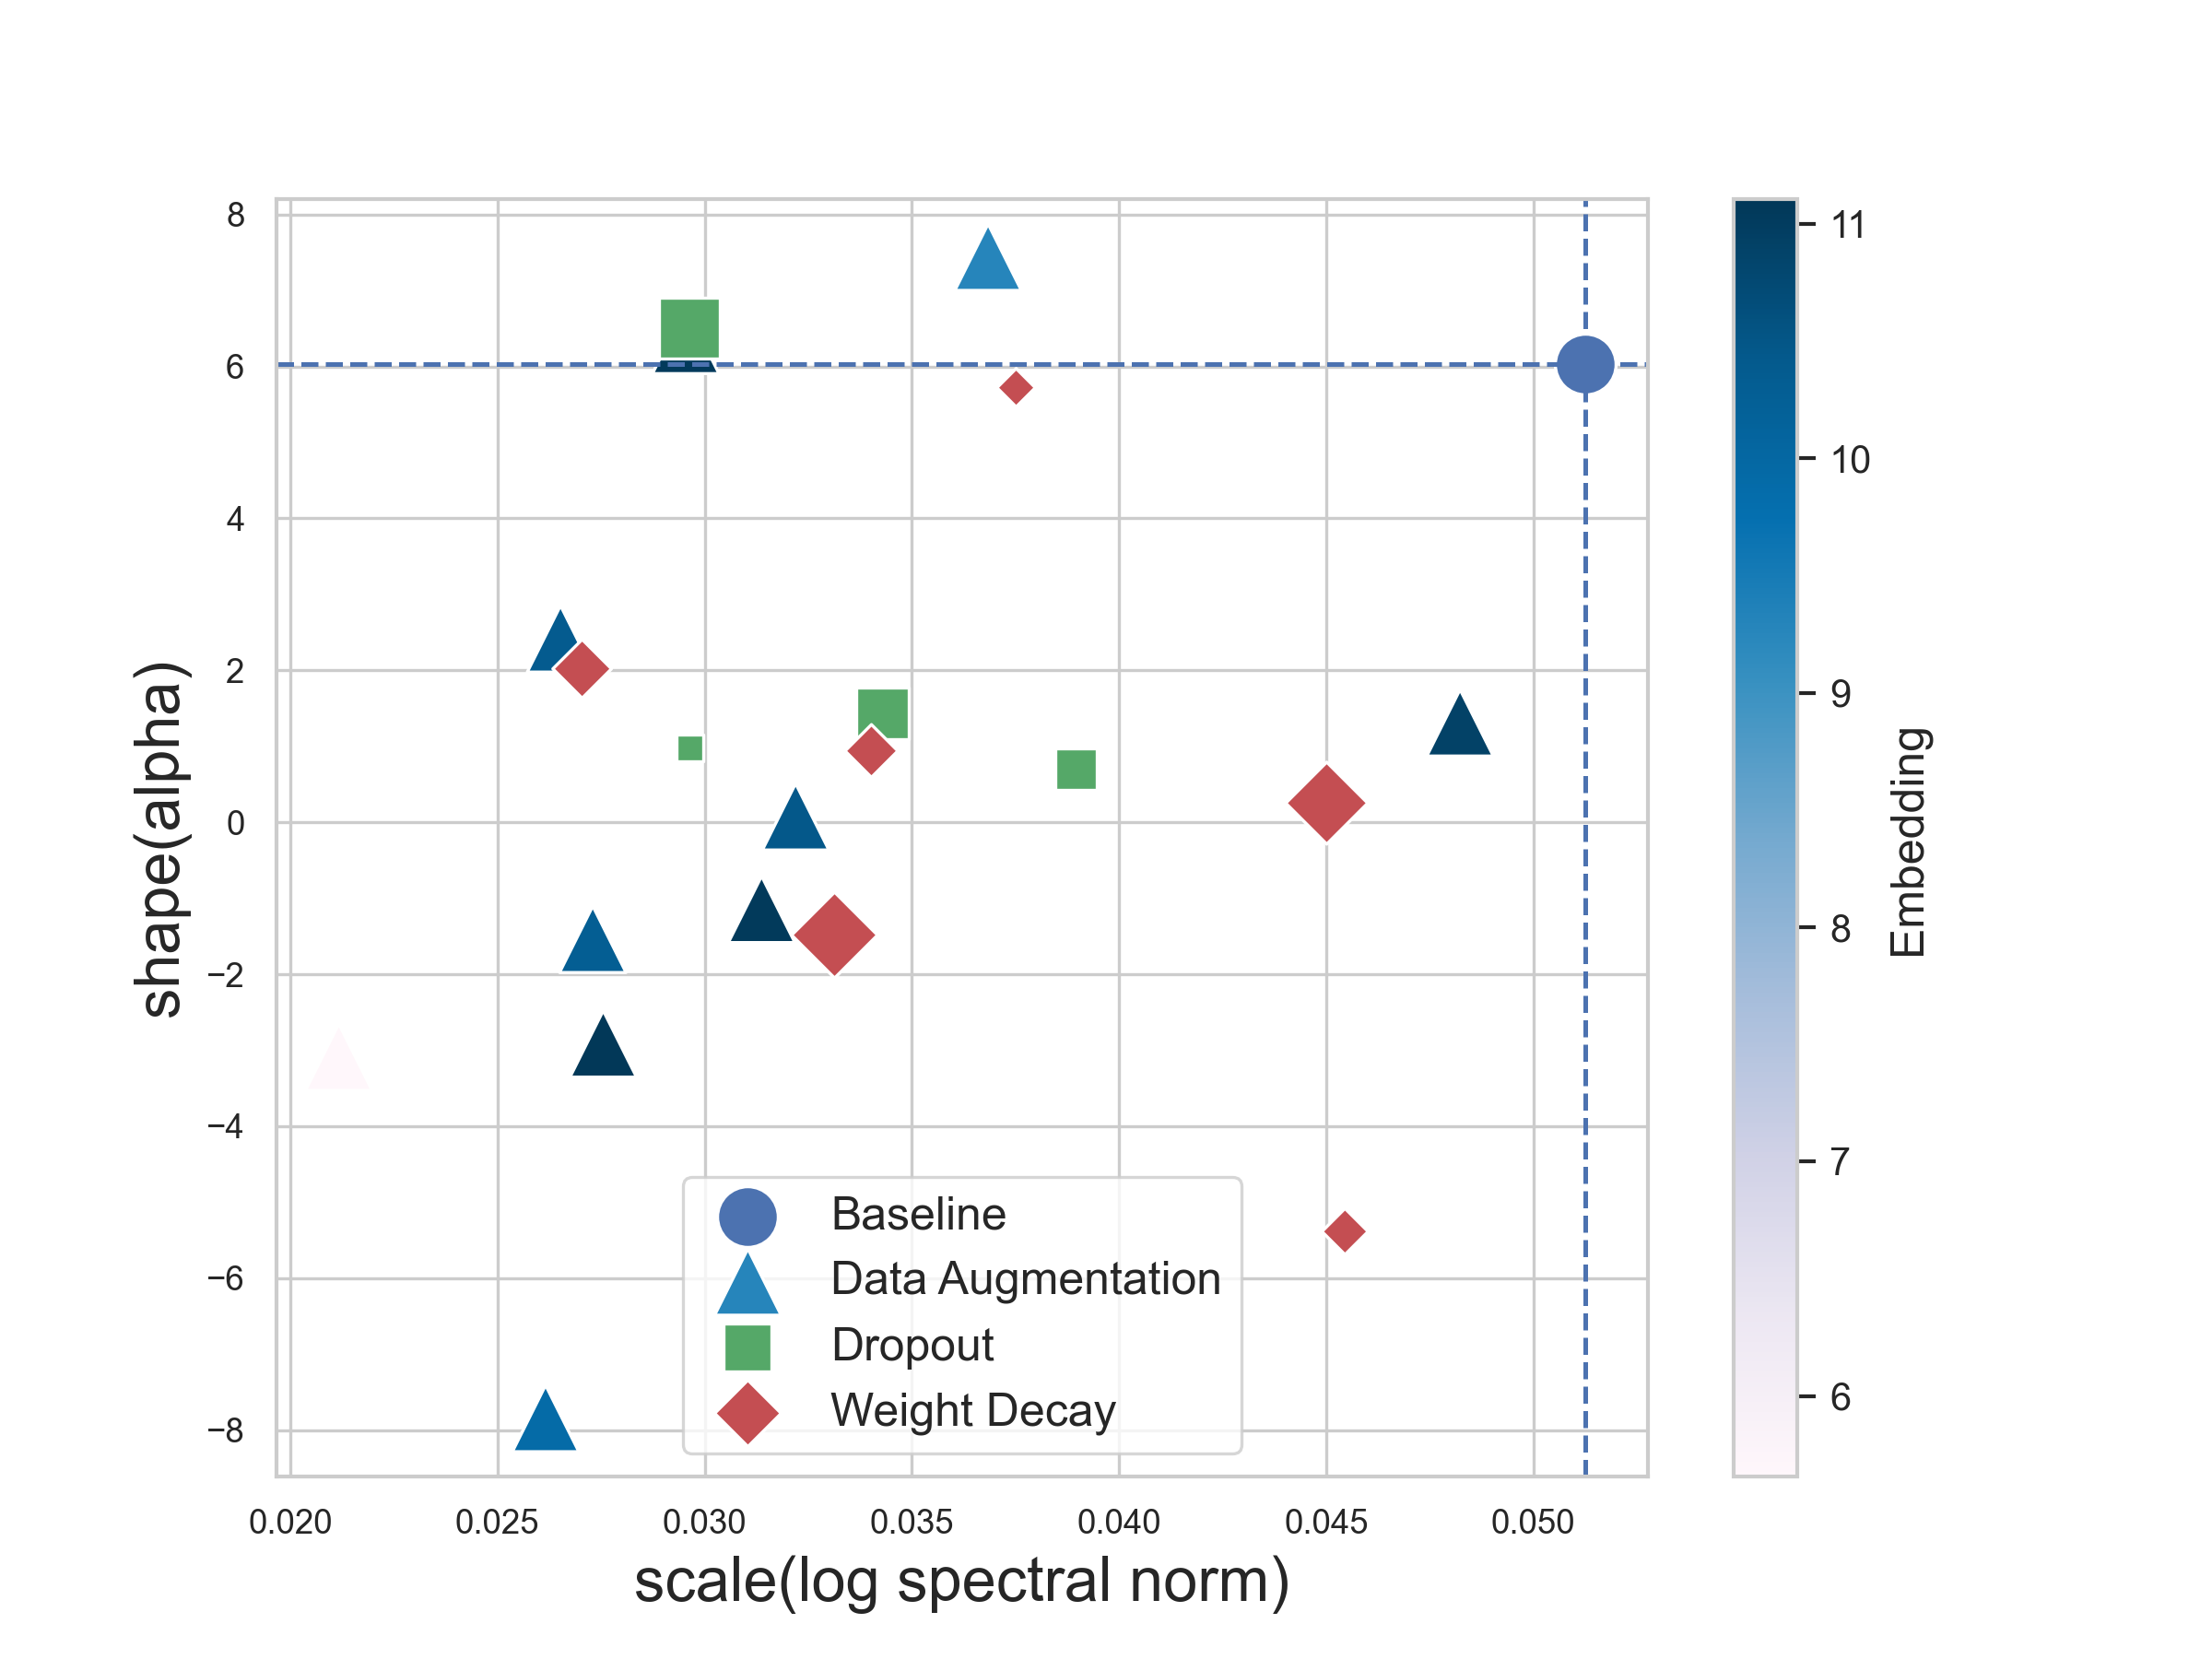

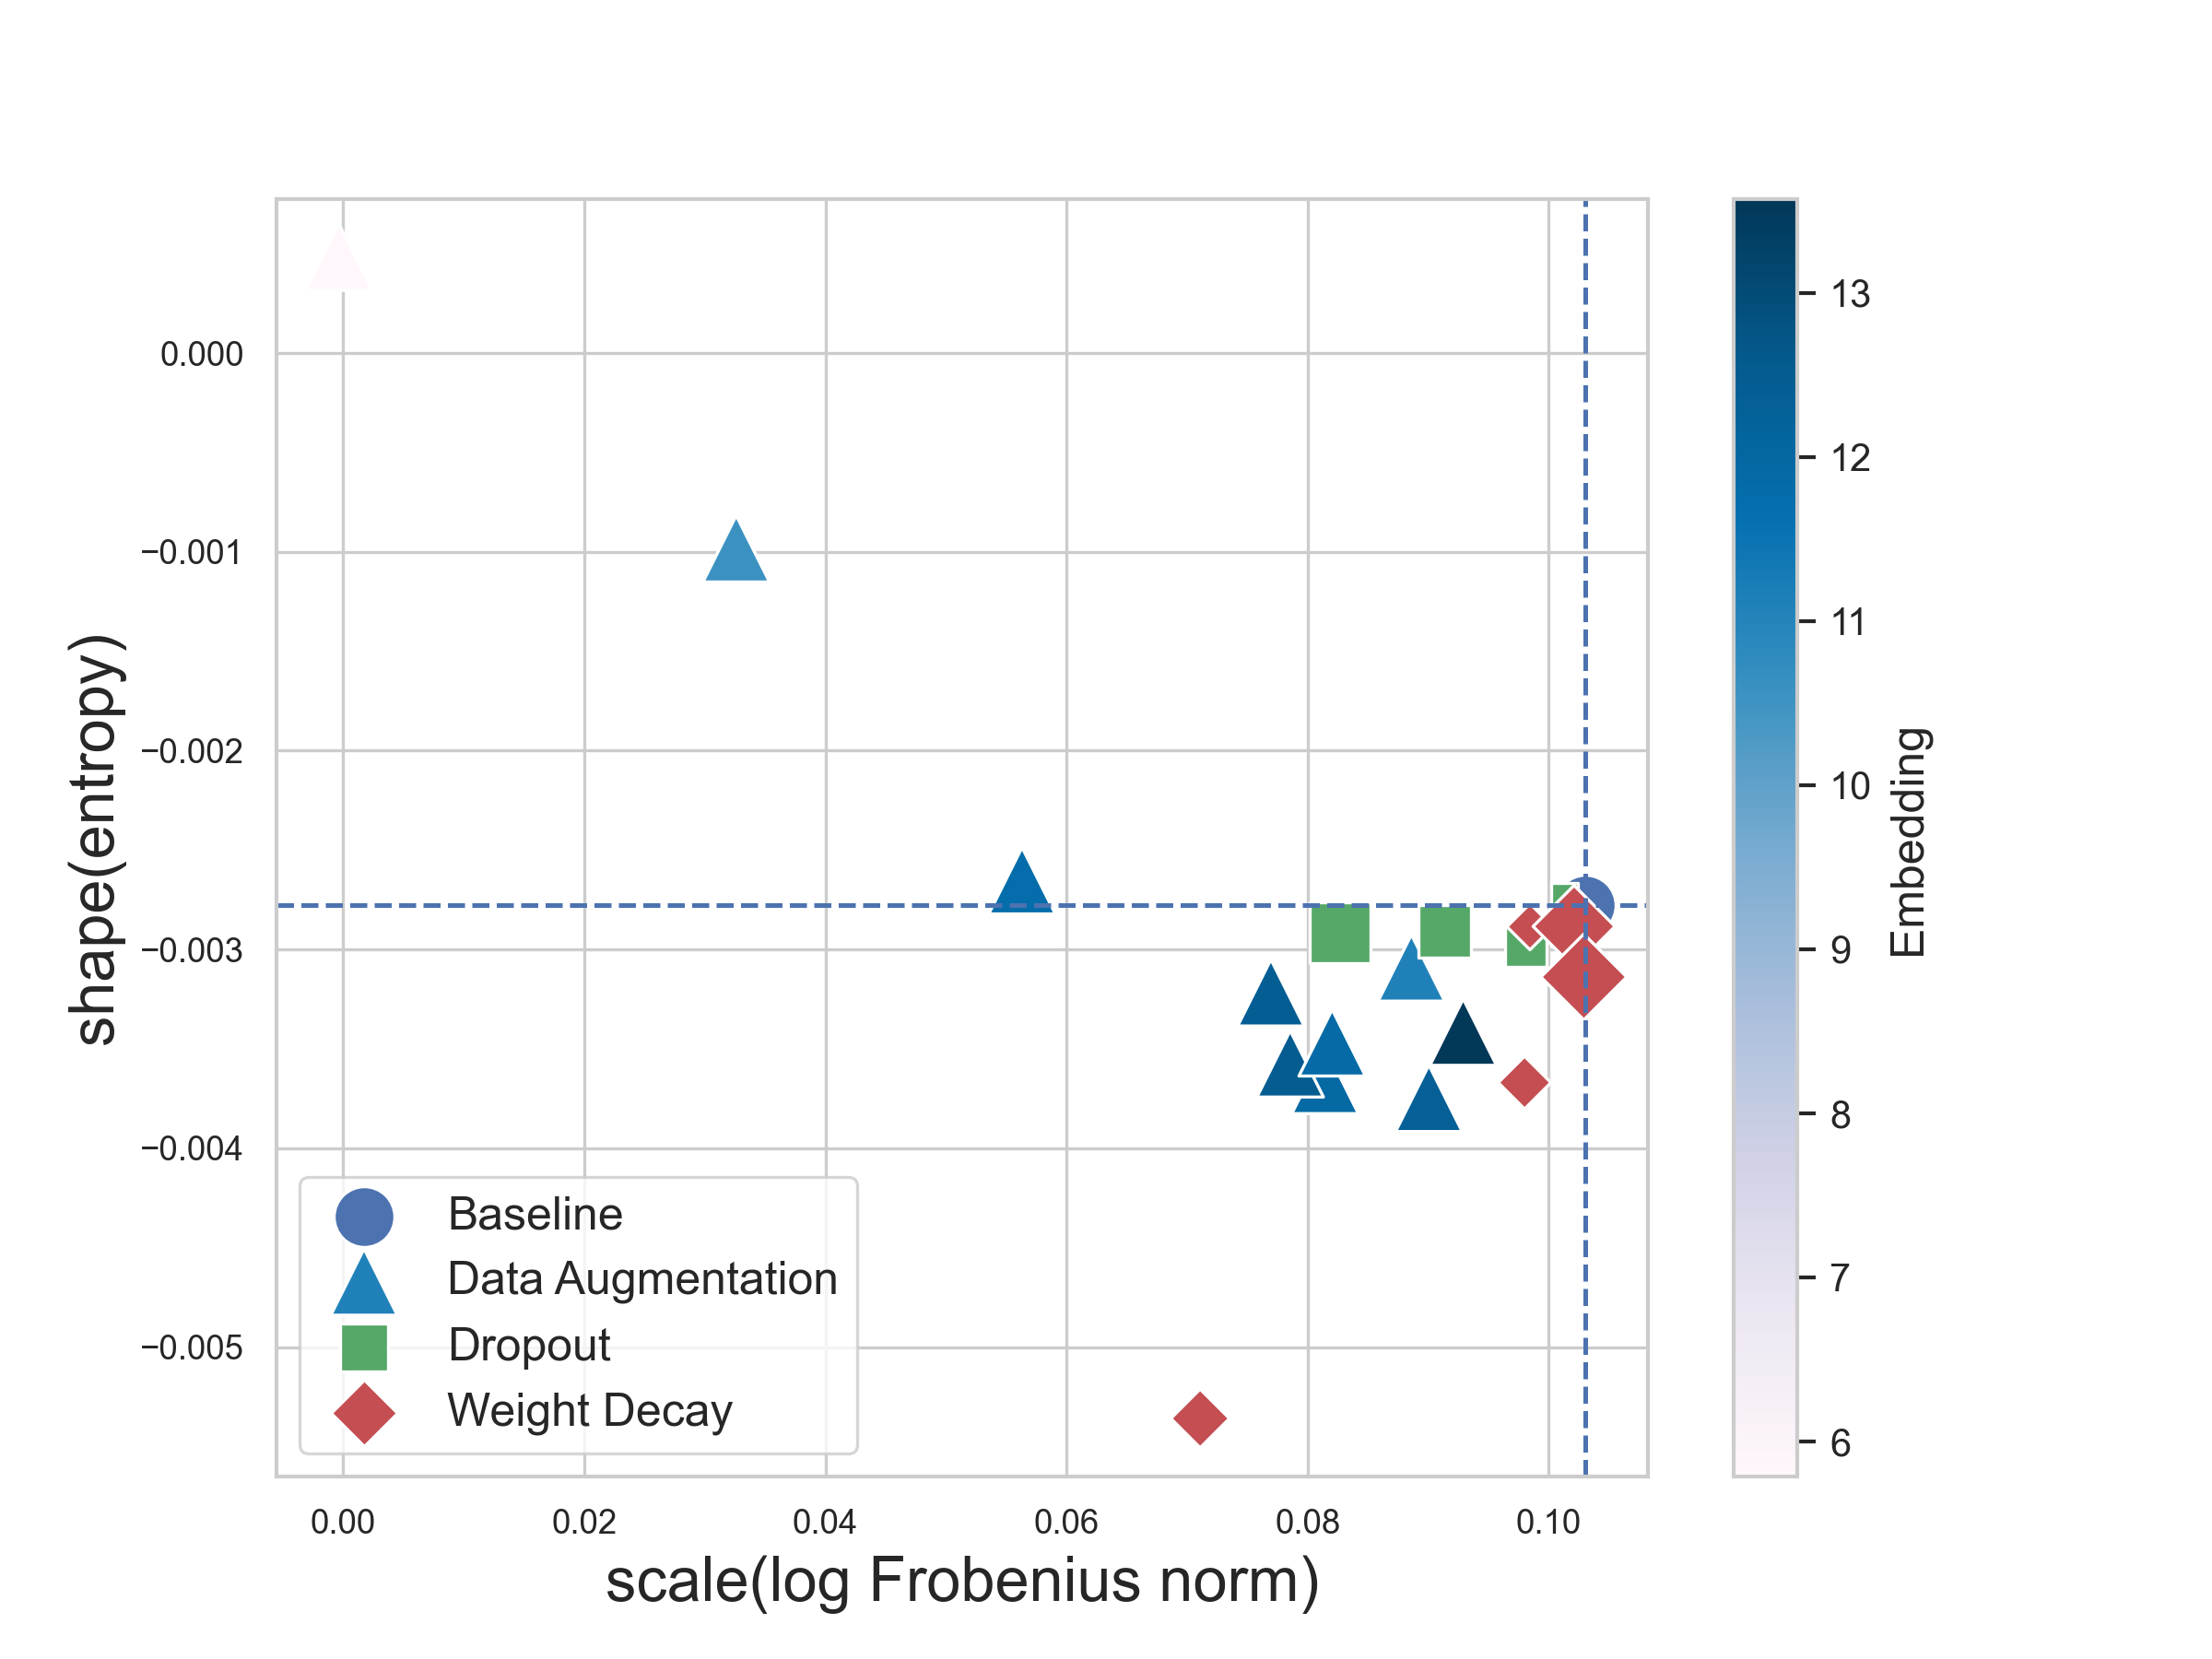
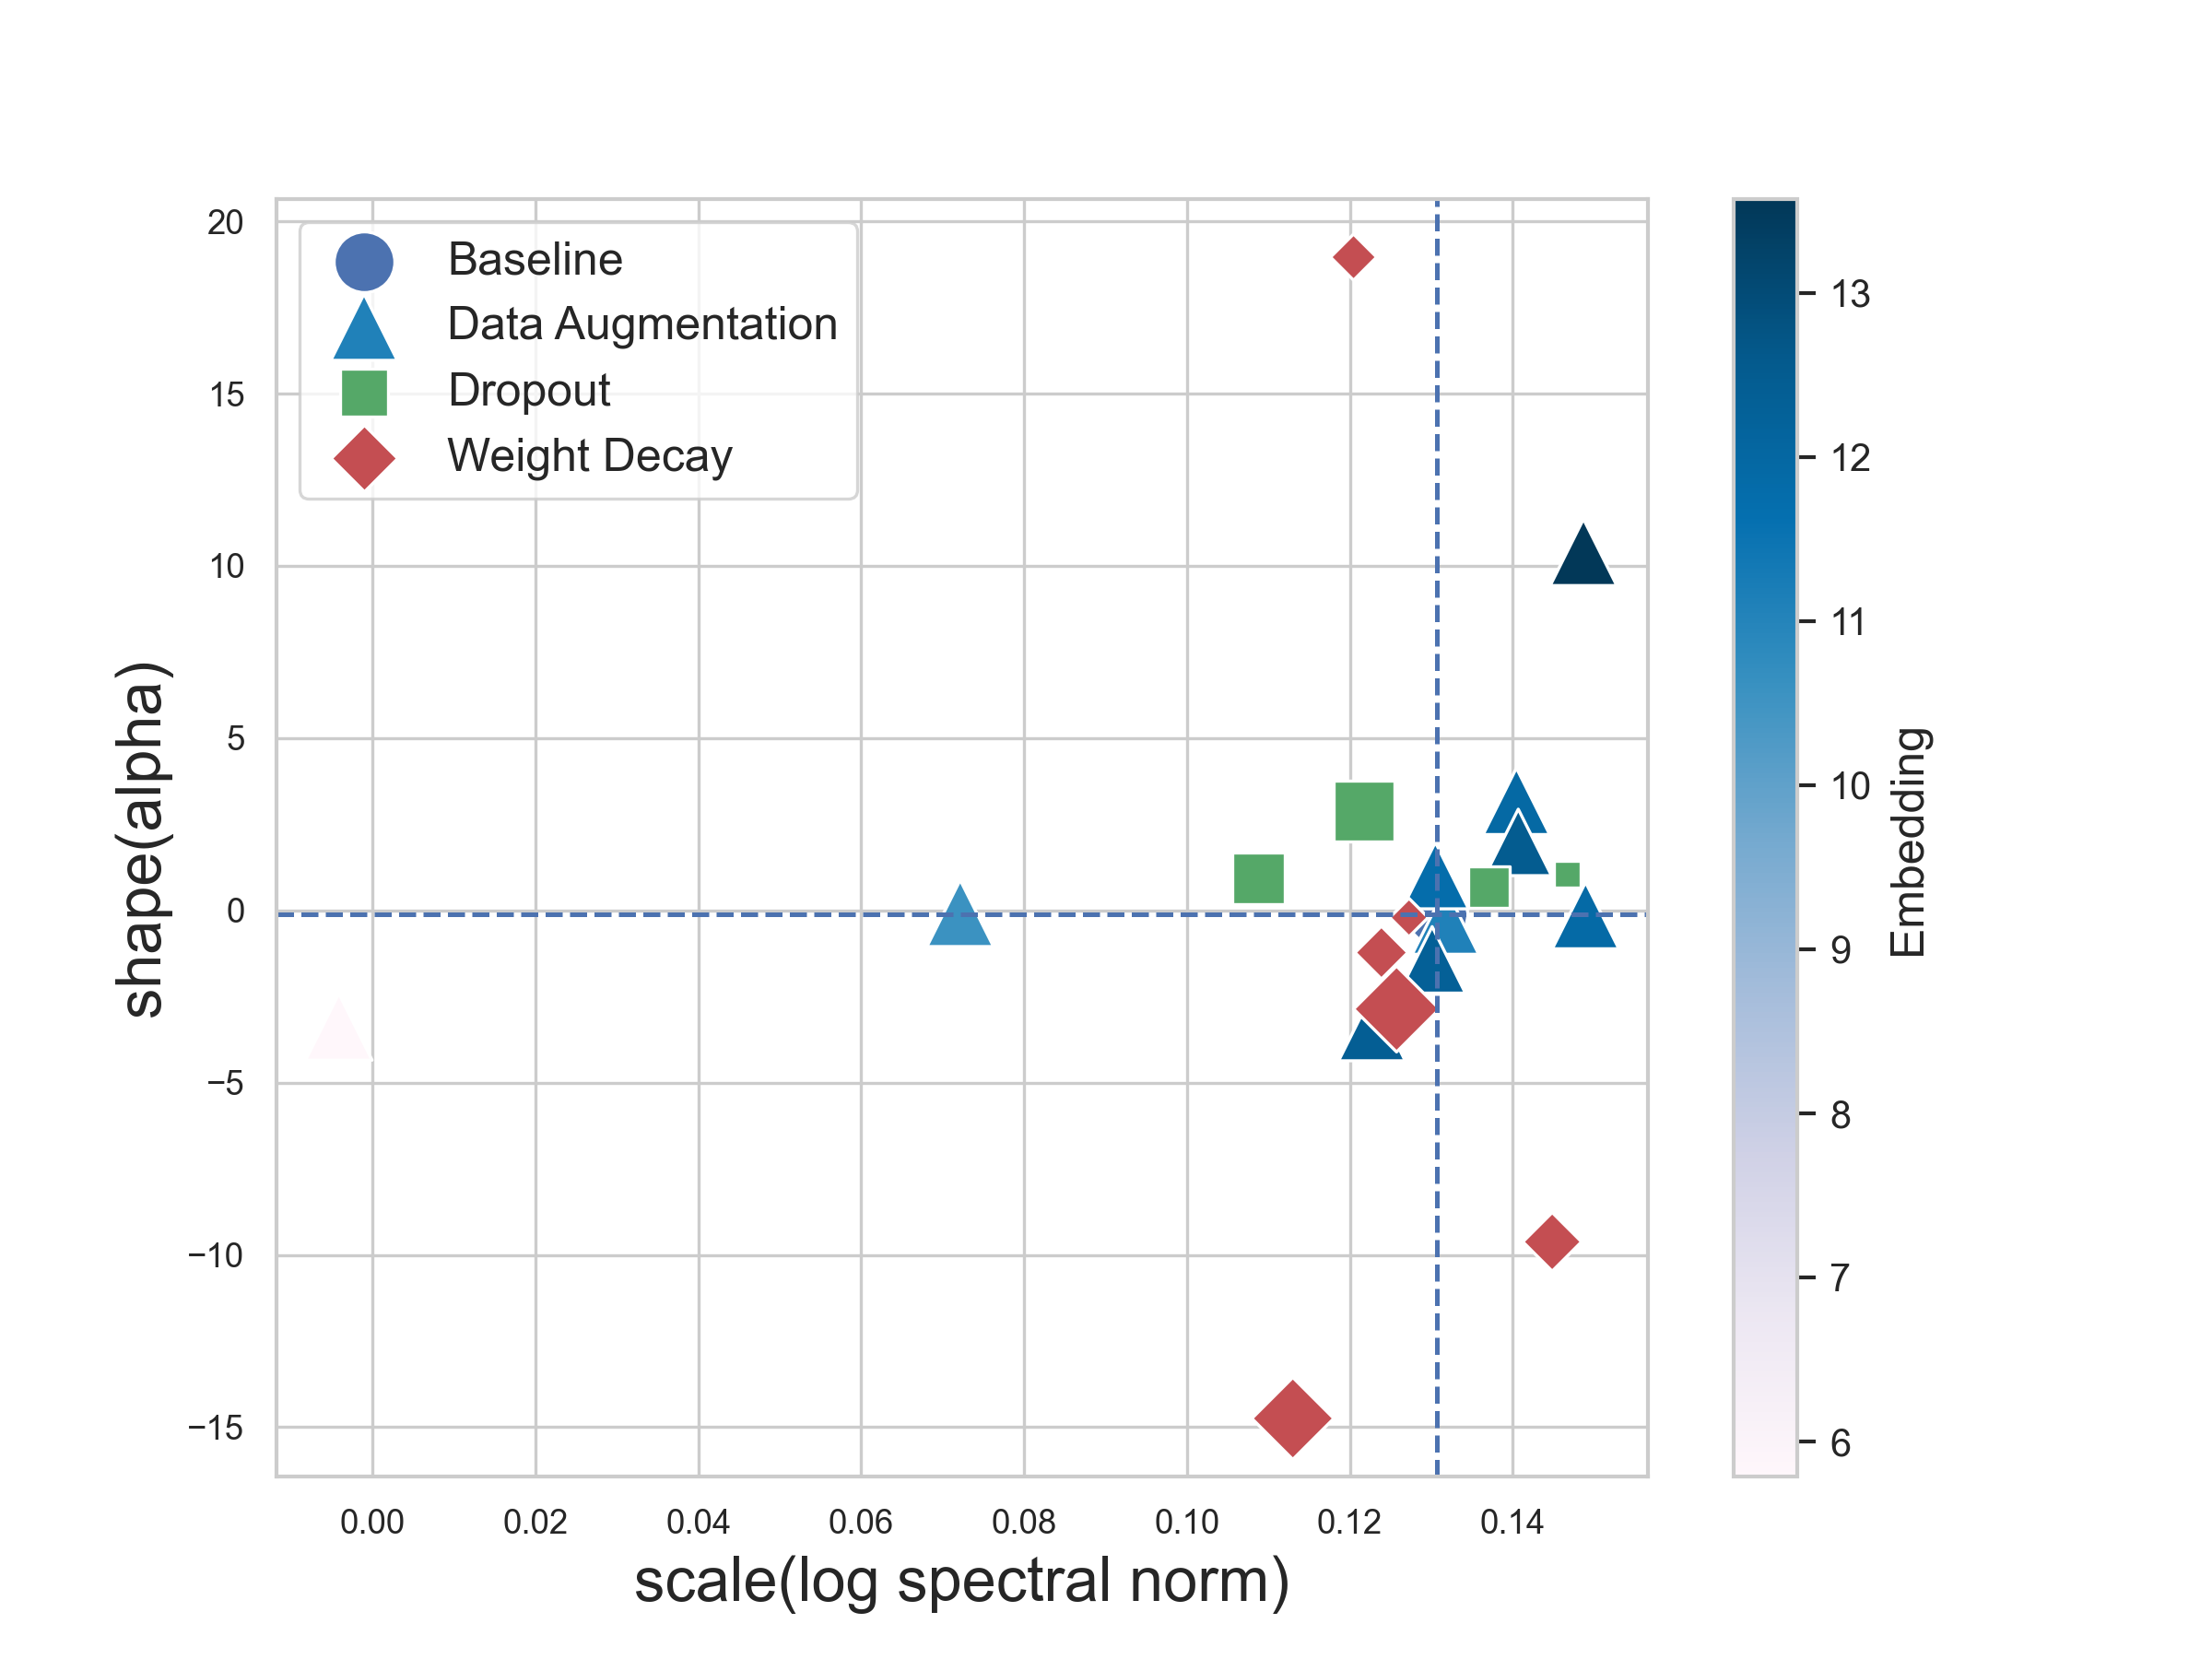

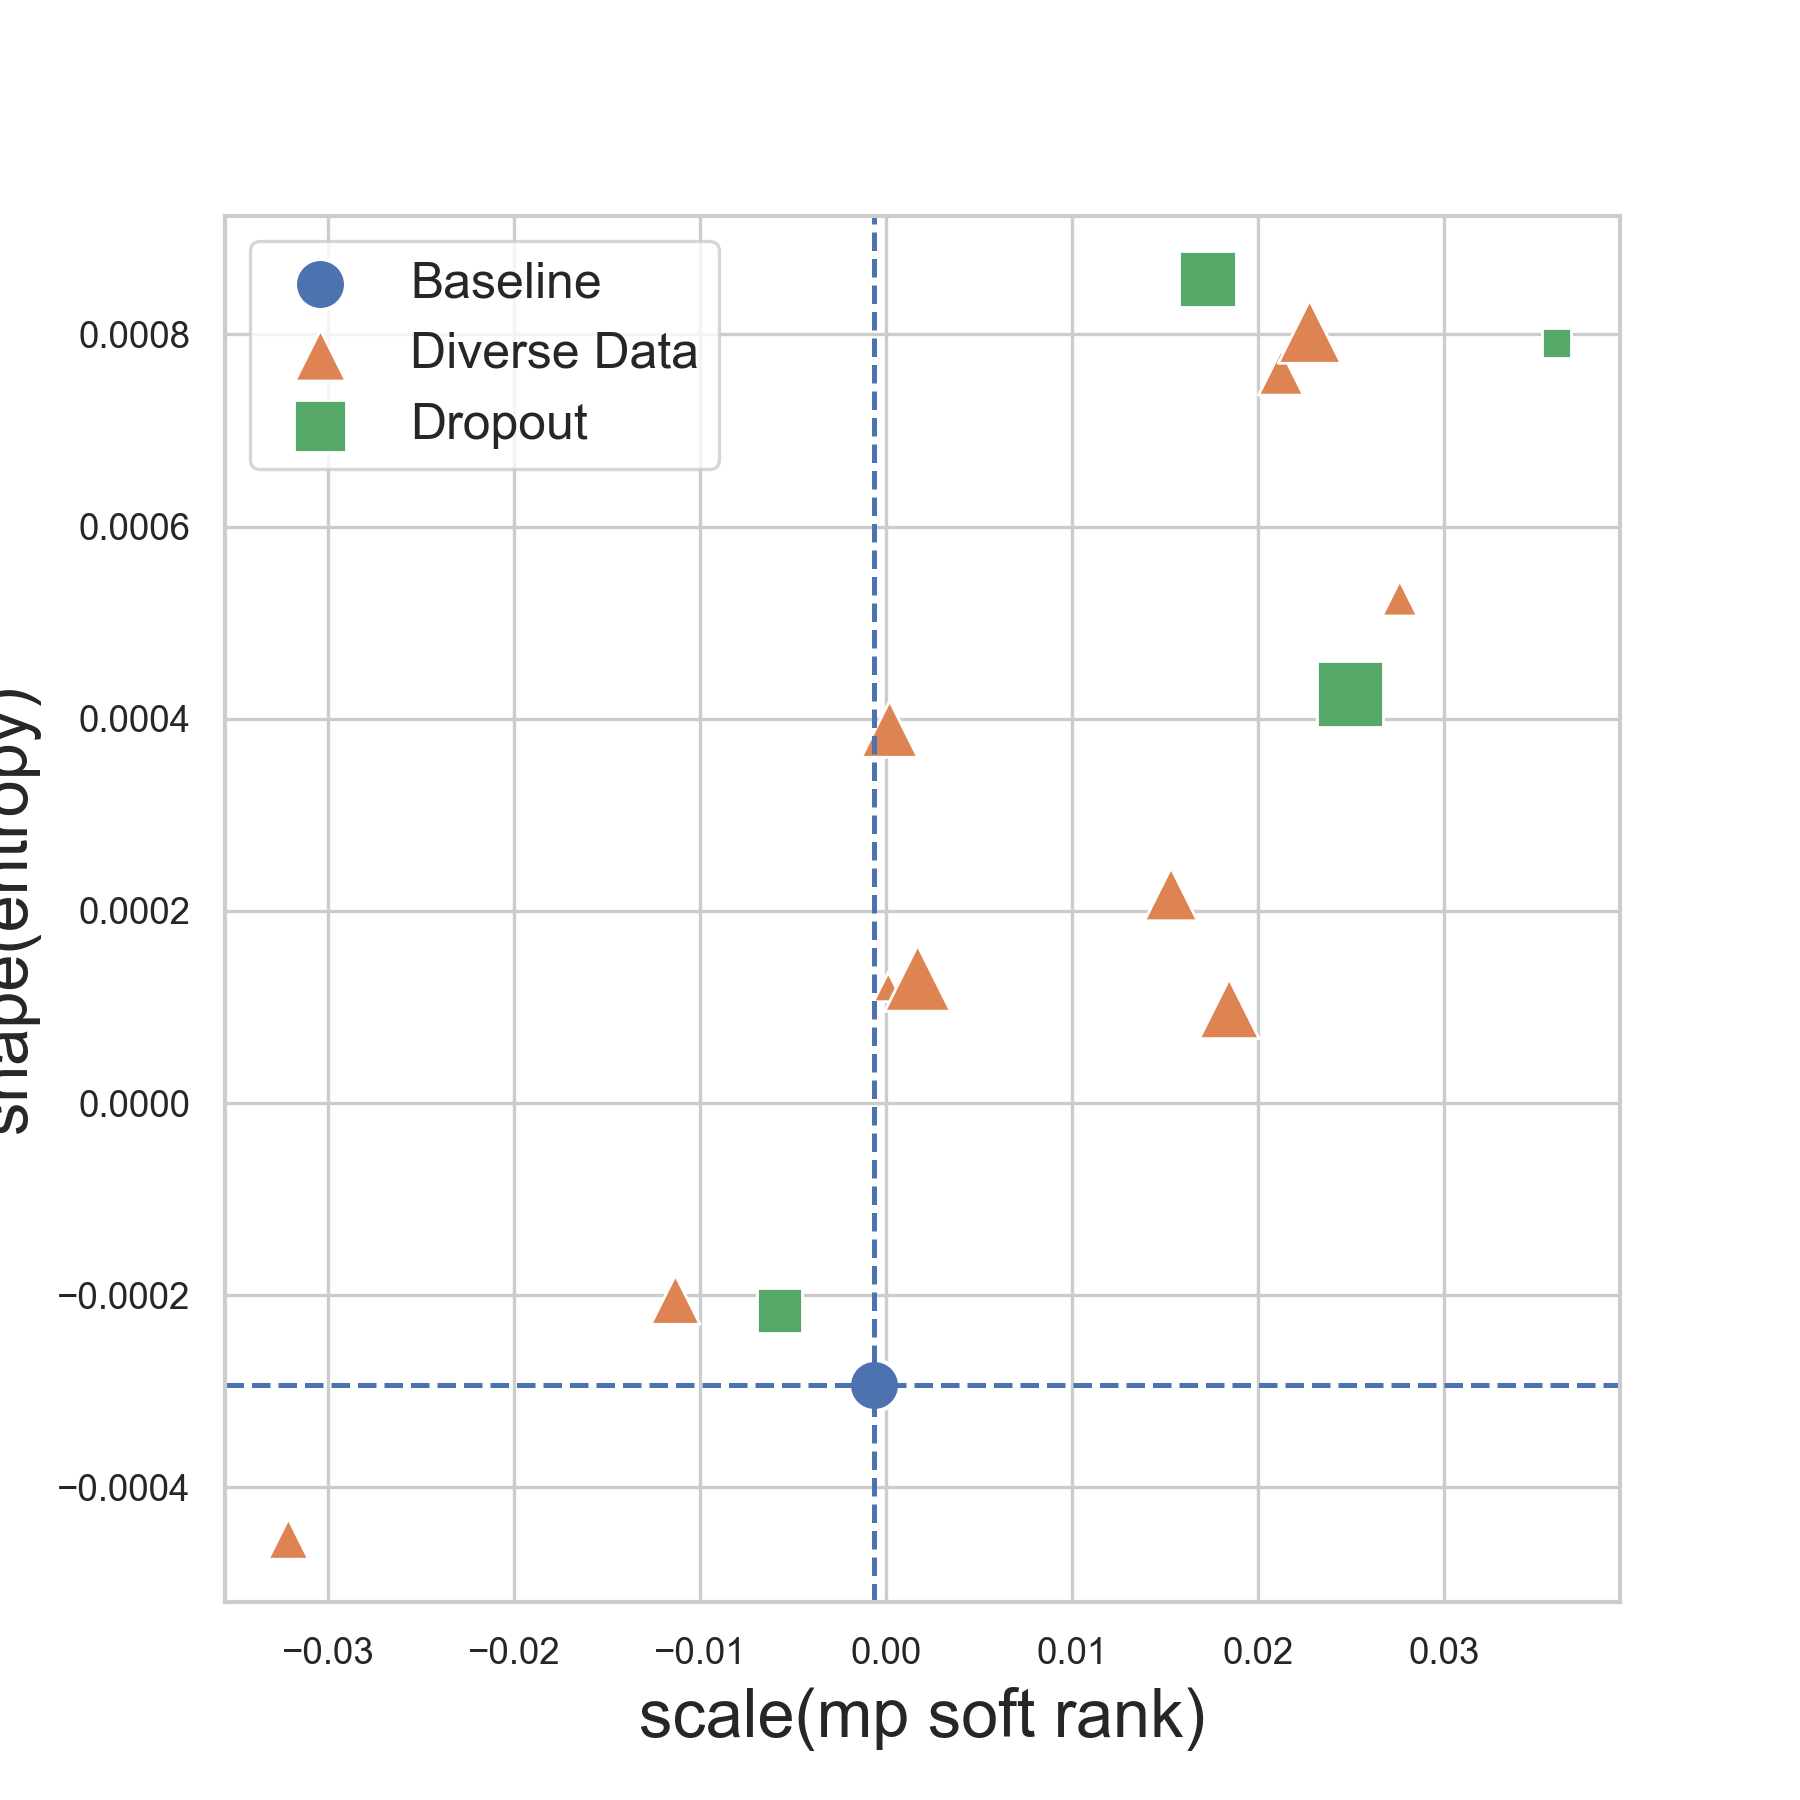
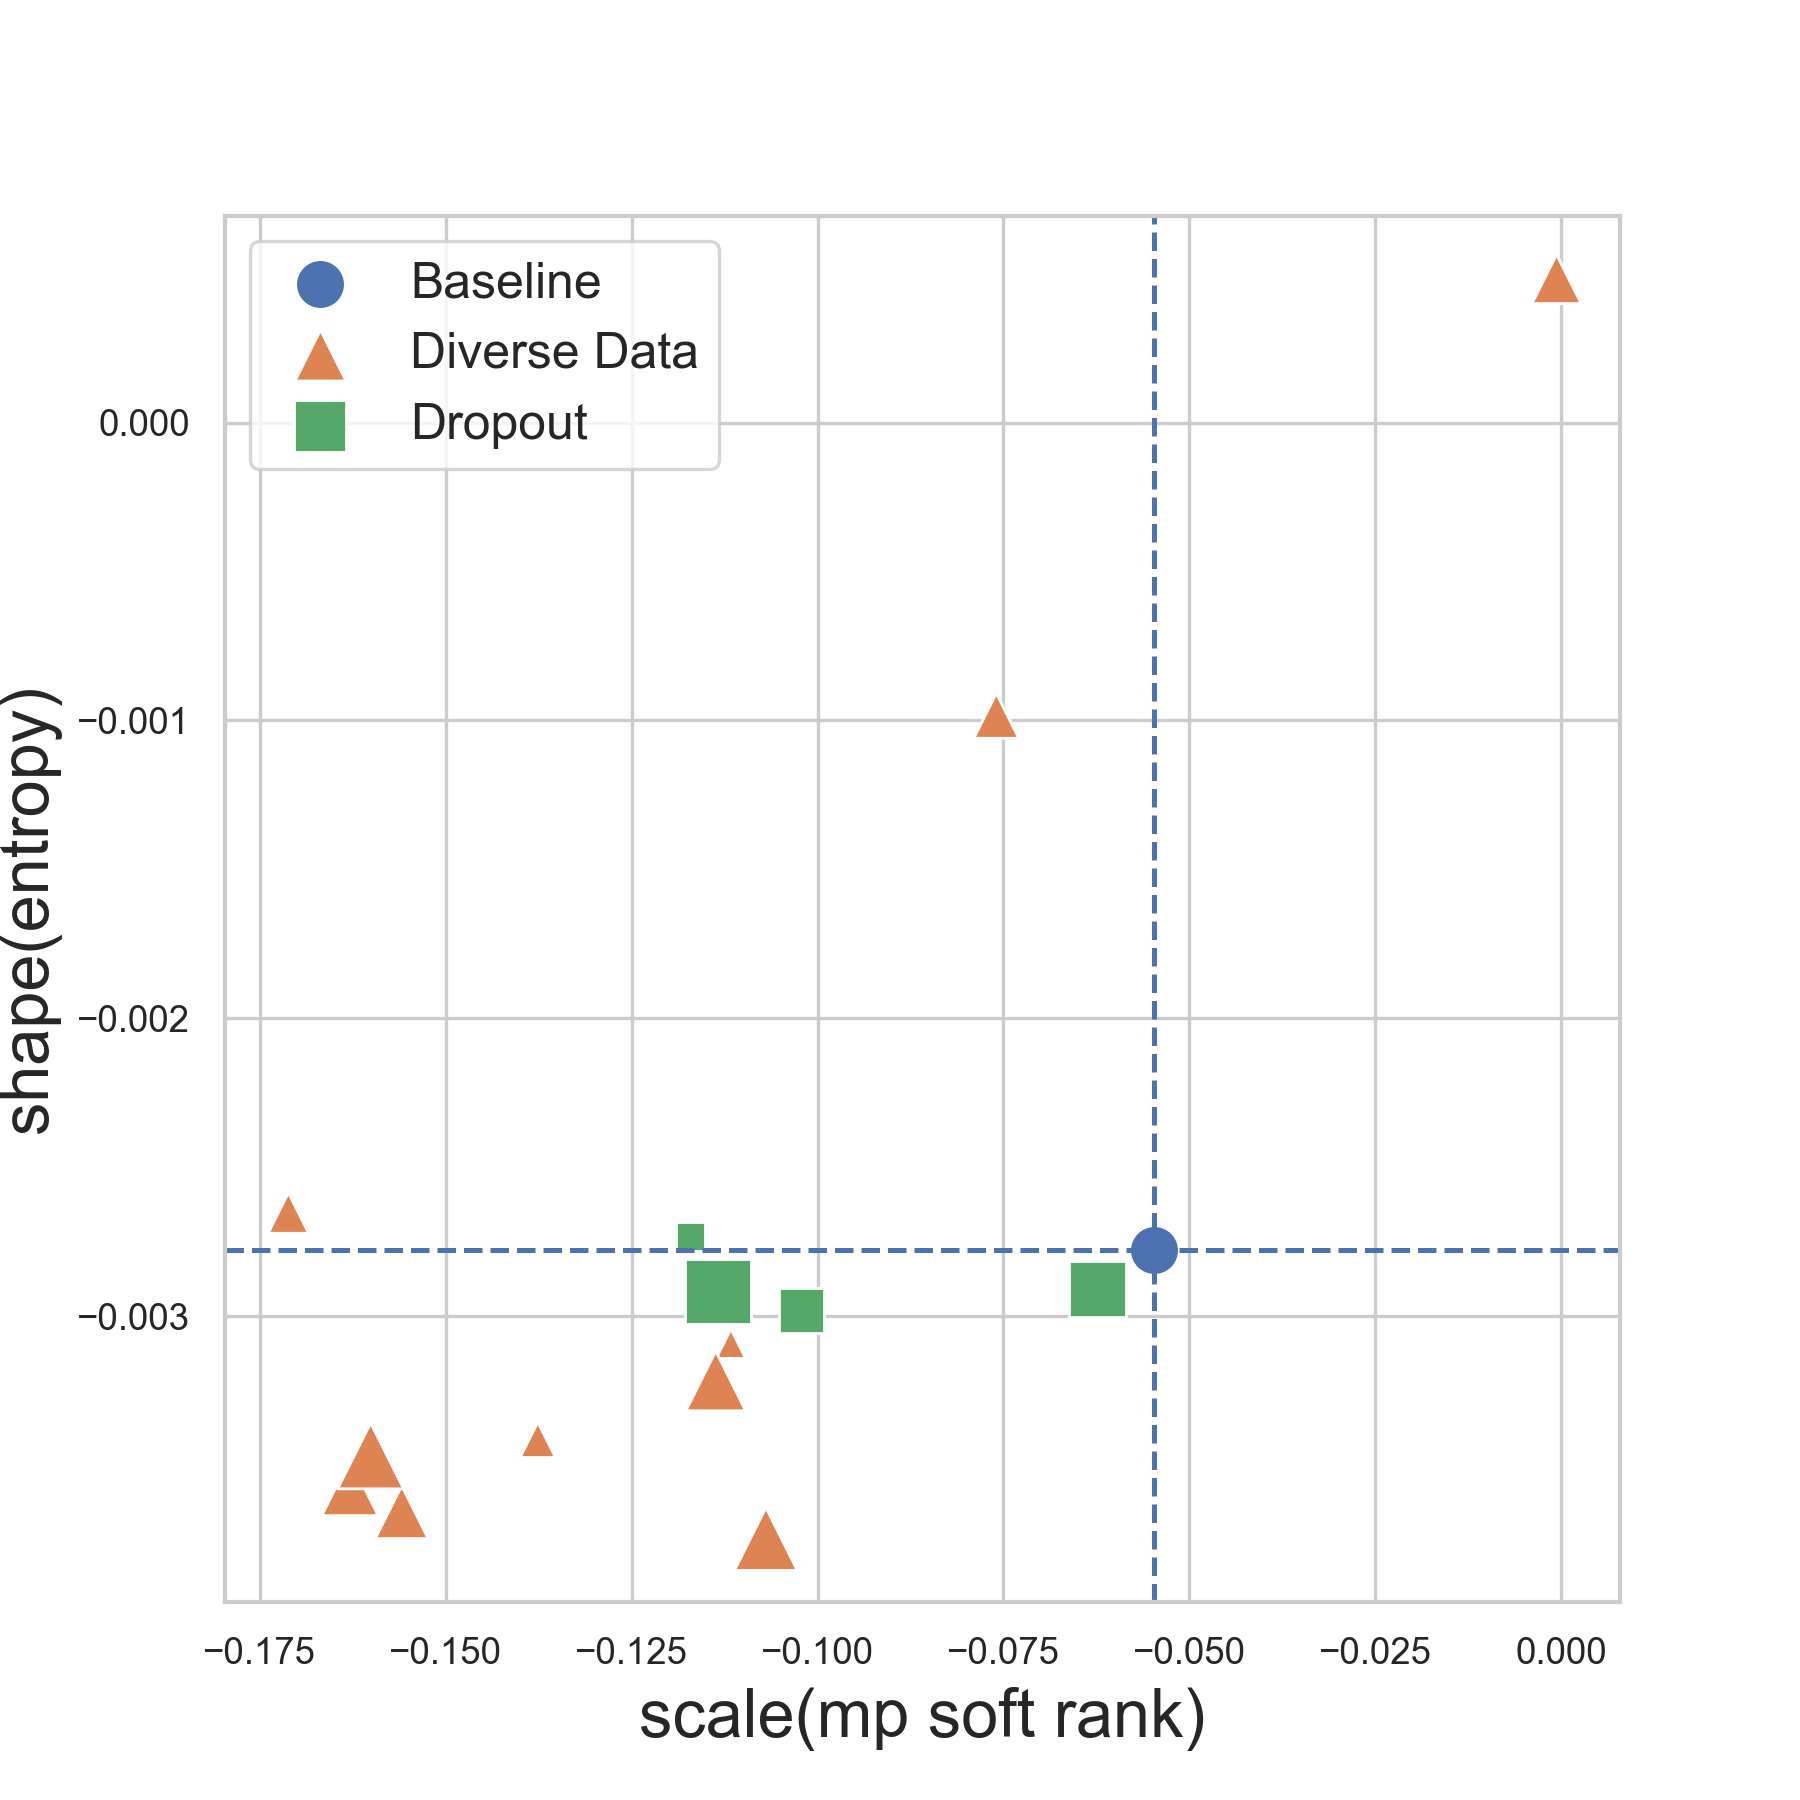
Figure 4 adds the triangle markers representing multiple data augmentation methods into scale-shape plots. They illustrate how training data diversity can alter the spectral distributions of weight matrices. Comparing them with dropout and weight decay, the effects of data diversity are more aligned with dropout than weight decay. In scale metrics, from Figure 4 (a)(c)(d), we observe diverse data can reduce the Frobenius norm and spectral norm of eigenvalues, thus shrinking the size of weight matrix in the same fashion of dropout and weight decay. Figure 4(c)(f) also shows the behavior of due to data diversity is similar to that of dropout. Overall, more resembling behaviors of shape metrics have been seen in data diversity and dropout than in data diversity and weight decay (see Figure 4(a)(b)(d)(f)). Readers can find more scale-shape plots about other layers in Appendeix.
Summary. Based on spectral analysis, we find many similarities between data augmentation and dropout. By fine-tuning CIFAR-10 and CIFAR-100 datasets, they display many common tendencies of impact on the weight matrix when compared with the baseline. Data augmentation increases input data diversity, thus enriching features in the input data, while dropout forces the neural networks to reduce the reliance on any specific neurons. The induced effects of these methods on weight matrices seem to agree with each other – they reduce the overall size of the weight matrix, thus limiting the maximum influence of any single weight correlation direction and making the weight matrix less complex. Moreover, they have a similar impact on shape metrics such as entropy and . However, diverse data sometimes has opposite effects on shape metrics as compared with those of weight decay.
3.4 Diversity of Synthetic data
To investigate whether or not synthetic data can bring in more input data diversity and thus further enhance model performance in the transfer learning context, we utilize the state-of-the-art image generative model Stable Diffusion v1-5 (SD) (Rombach et al., 2022) to generate synthetic images. We use Domainnet (Peng et al., 2019) datasets to evaluate the CLIP model performance on both in-distribution (ID) and out-of-distribution (OOD) tasks. Specifically, for ID tasks, we use 50000 instances from the “real” category (i.e., they are real images, as opposed to artificially stylized images), which covers 142 image labels. The baseline model is trained on these instances and evaluated on “real” test images. Data augmentation techniques mentioned in section 3.3 are applied to the “real” training data for model training as a comparison. For OOD tasks, we evaluate trained models on stylized images, including “clippart”, “infograph”, “inpainting” and “sketch” styles in DomainNet. All model parameters remain the same as those in previous sections.
To improve the diversity of SD-generated images, we increase the variance of prompts for the stable diffusion model. We provide four prompt formats that are randomly picked for individual image-generating processes. Moreover, we dynamically adjust the generated images by randomly selecting and applying compressed resolutions within the ranges of 320-640 pixels for the first dimension and 240-720 pixels for the second dimension.
We use Top-1 accuracy and Expected Calibration Error (ECE) as evaluation metrics for both ID and OOD tasks. ECE is widely used for model uncertainty evaluation. It quantifies how well a model’s predicted probabilities (confidence) align with its actual outcomes (accuracy) (Guo et al., 2017). The smaller ECE is, the better the model is calibrated. Synthetic training datasets are created by replacing a certain proportion (15%, 25%, and 35%) of real images with SD-generated images, thereby the total training data size is kept the same as the baseline and other data augmentation methods.
| ID | OOD | OOD Avg | ||||||||||
| Data | Acc | ECE | Clipart | Infograph | Painting | Sketch | Acc | ECE | ||||
| Acc | ECE | Acc | ECE | Acc | ECE | Acc | ECE | |||||
| baseline | 85.27 | 0.05 | 64.95 | 0.12 | 31.21 | 0.25 | 54.89 | 0.20 | 51.00 | 0.22 | 50.51 | 0.20 |
| auto | 85.03 | 0.04 | 67.99 | 0.10 | 31.93 | 0.10 | 57.74 | 0.18 | 55.83 | 0.18 | 53.37 | 0.14 |
| rand | 85.11 | 0.04 | 65.73 | 0.10 | 31.77 | 0.21 | 58.35 | 0.16 | 56.01 | 0.16 | 52.97 | 0.16 |
| augM | 84.48 | 0.04 | 67.10 | 0.10 | 31.69 | 0.21 | 55.98 | 0.18 | 54.51 | 0.18 | 52.32 | 0.17 |
| trAu | 84.30 | 0.03 | 65.93 | 0.08 | 31.12 | 0.20 | 55.31 | 0.16 | 54.17 | 0.17 | 51.63 | 0.15 |
| noise10 | 84.41 | 0.03 | 66.69 | 0.08 | 32.12 | 0.18 | 56.76 | 0.16 | 57.18 | 0.14 | 53.19 | 0.14 |
| noise30 | 84.45 | 0.03 | 67.59 | 0.07 | 32.68 | 0.16 | 56.76 | 0.15 | 58.12 | 0.14 | 53.79 | 0.13 |
| noise50 | 83.51 | 0.03 | 64.87 | 0.08 | 30.44 | 0.19 | 55.77 | 0.15 | 54.55 | 0.15 | 51.41 | 0.14 |
| auto-v1 | 83.44 | 0.03 | 65.53 | 0.07 | 31.59 | 0.15 | 55.93 | 0.14 | 55.73 | 0.14 | 52.20 | 0.13 |
| auto-v2 | 81.86 | 0.02 | 64.32 | 0.06 | 27.82 | 0.16 | 53.96 | 0.13 | 53.67 | 0.13 | 49.94 | 0.12 |
| auto-v3 | 75.89 | 0.03 | 55.37 | 0.06 | 23.71 | 0.15 | 49.37 | 0.13 | 46.68 | 0.13 | 43.78 | 0.12 |
| synthetic(0.15) | 85.85 | 0.05 | 66.91 | 0.11 | 33.00 | 0.19 | 56.65 | 0.15 | 59.97 | 0.15 | 54.13 | 0.15 |
| synthetic(0.25) | 85.11 | 0.05 | 67.21 | 0.07 | 32.28 | 0.20 | 53.84 | 0.17 | 54.98 | 0.12 | 52.08 | 0.14 |
| synthetic(0.35) | 84.58 | 0.05 | 64.59 | 0.14 | 30.58 | 0.22 | 54.75 | 0.15 | 51.07 | 0.17 | 50.25 | 0.17 |
Result. Table 2 shows that both traditional data augmentation methods and the synthetic data method can result in better OOD performance, i.e., higher top-1 accuracy and lower ECE on average compared with the baseline. Extremely augmented data such as auto-v2 and auto-v3 may harm the model’s learning ability. Similarly, infusing a larger proportion of synthetic data into the training dataset may not bring in additional benefits; instead, it can decrease the model’s performance in terms of classification accuracy. A recent publication (Alemohammad et al., 2023) describes a similar phenomenon called model collapses, which is caused by excessively using synthetic data to retrain generative models. This may be partially due to the lack of diversity of synthetic data itself. The more iterations of retraining, the less diverse the generated synthetic data will be. Our findings demonstrate the importance of data diversity in enhancing machine learning capability.
4 Related Work
Data diversity and applications of synthetic data have been getting more and more attention from the machine learning research community in recent years. Authors in the paper (Lopes et al., 2020) explore the role of diversity in data augmentation and propose two diversity definitions. One definition is model-based, or based on the performance of classification, and the other definition is input image data-based, by comparing the conditional entropy of clean data distribution and the augmented data distribution. They conclude that the diversity produced by data augmentation is able to improve model performance. However, it falls short of explaining the underlying mechanisms of how data diversity affects the ML model. The study from He et al. (2022) evaluates the use of synthetic data, which are generated by test-to-image models such as GLIDE, for image recognition tasks. It concludes that models trained solely on synthetic data do not outperform those trained on real data. Following this work, we try to explain why using synthetic data alone to train a model cannot beat what real data does. Similarly, model collapses have been observed by the authors of Alemohammad et al. (2023). They state that the self-consuming loop – that is, iteratively using synthetic data from generative models as their own training data – can significantly harm the quality of generated output. They suggest adding fixed real data to break the loop and to improve the quality of generated images. In our experiments, we only use synthetic data to replace a small portion of real data so as to increase overall data diversity and improve model performance on both ID and OOD tasks.
The spectral analysis of weight metrics has been applied to various scenarios. Martin & Mahoney (2021) found deep neural networks naturally regularize themselves by shaping their weight matrices, for which they proposed a Heavy-Tailed Self-Regularization (HTSR) theory. Their follow-up work (Martin et al., 2021) used the power-law fitting on weight matrices’ spectra to predict a model’s quality and generalization ability without needing training or testing data, thus purely focusing on the intrinsic properties of the model’s weights. Yang et al. (2023) applied the HTSR theory in the natural language processing area. They proposed a KS distance-based estimation method to make a better power law fitting, making the exponent better capture the shape of the tail distribution of ESD. On the other hand, the significance of weight matrices has been explored in other recent studies. Wortsman et al. (2022) demonstrated that merging weights from different fine-tuning models can improve overall model performance and highlighted the impact of weight manipulation on optimizing model behavior without retraining. All of these prior studies motivated us to investigate the impact of data diversity from the model’s weight matrices perspective.
5 Discussion
Model generalizability is an open challenge for deploying machine learning and deep learning models, as it directly impacts their adaptability and reliability in real-world applications. Regularization techniques, such as dropout and weight decay, are typically used to reduce overfitting and improve model robustness. Data augmentation, an empirical method that increases the diversity of training data, particularly in situations where training data is scarce, could achieve similar effects. However, the underlying mechanisms of how and why data augmentation enhances model performance remain an open question in theory and practice. With advancements in generative AI, the concept of data diversity has received significant attention with respect to both training data and model outputs. Diverse training data enables large pre-trained models to learn a wide range of meaningful features without overfitting to noise, while ensuring diversity in generated outputs is crucial for their use as effective training data in downstream tasks. This motivates our investigation into the role of data diversity in the learning process of a model. Specifically, we aim to understand how data diversity influences the weight landscape and provide insights into why data augmentation can lead to more robust models. To achieve this, we used Random Matrix Theory (RMT) to analyze spectral patterns in the weight matrices of neural networks, comparing the effects of dropout, weight decay, and various data augmentation techniques. Additionally, we quantified the diversity of training sets using the Vendi score, which measures data variability and helps assess how training diversity contributes to model generalization in our framework.
We observed that dropout and data augmentation exhibit similarities in how they affect the weight space of neural networks. Both methods reduce the overall magnitude of the weight matrix and induce similar changes in the spectral metrics of the empirical spectral density (ESD) on the same dataset. This suggests that they influence weight formation in a comparable way: dropout forces the model to be less reliant on specific weight correlations, resulting in a less concentrated ESD, while the rich features in a diverse dataset encourage the model to focus on a broader range of information during training, leading to a more balanced weight landscape. In contrast, weight decay, another regularization method, also reduces the overall size of the weight matrix but impacts the shape of the ESD differently, leading to distinct regularization effects.
We also explored the use of synthetic data generated by generative models as an augmentation strategy to improve model performance. While previous studies have not thoroughly examined its effectiveness, we compared this new approach with traditional data augmentation in both in-distribution (ID) and out-of-distribution (OOD) tasks. Our results show that incorporating a small amount of synthetic data enhances average model performance on both ID and OOD tasks, primarily due to the increased diversity provided by the synthetic data. However, there is also a risk of model collapse when relying too heavily on synthetic data, which occurs when the model starts overfitting to synthetic patterns that lack the variability and quality of real-world data. This over-reliance can reduce generalizability, cause biased learning, and diminish the model’s ability to recognize a broad range of real-world features, ultimately making the model less robust and effective in practical applications. Therefore, a careful balance between real and synthetic data is still necessary to prevent model collapse and prevent overfitting.
References
- Alemohammad et al. (2023) Sina Alemohammad, Josue Casco-Rodriguez, Lorenzo Luzi, Ahmed Imtiaz Humayun, Hossein Babaei, Daniel LeJeune, Ali Siahkoohi, and Richard G Baraniuk. Self-consuming generative models go mad. arXiv preprint arXiv:2307.01850, 2023.
- Andriushchenko et al. (2023) Maksym Andriushchenko, Francesco D’Angelo, Aditya Varre, and Nicolas Flammarion. Why do we need weight decay in modern deep learning? arXiv preprint arXiv:2310.04415, 2023.
- Bishop (1995) Chris M Bishop. Training with noise is equivalent to tikhonov regularization. Neural computation, 7(1):108–116, 1995.
- Brown (2020) Tom B Brown. Language models are few-shot learners. arXiv preprint arXiv:2005.14165, 2020.
- Cubuk et al. (2018) Ekin D Cubuk, Barret Zoph, Dandelion Mane, Vijay Vasudevan, and Quoc V Le. Autoaugment: Learning augmentation policies from data. arXiv preprint arXiv:1805.09501, 2, 2018.
- Cubuk et al. (2020) Ekin D Cubuk, Barret Zoph, Jonathon Shlens, and Quoc V Le. Randaugment: Practical automated data augmentation with a reduced search space. In Proceedings of the IEEE/CVF conference on computer vision and pattern recognition workshops, pp. 702–703, 2020.
- Dan Friedman & Dieng (2023) Dan Dan Friedman and Adji Bousso Dieng. The vendi score: A diversity evaluation metric for machine learning. Transactions on machine learning research, 2023.
- Guo et al. (2017) Chuan Guo, Geoff Pleiss, Yu Sun, and Kilian Q Weinberger. On calibration of modern neural networks. In International Conference on Machine Learning, pp. 1321–1330. PMLR, 2017.
- He et al. (2022) Ruifei He, Shuyang Sun, Xin Yu, Chuhui Xue, Wenqing Zhang, Philip Torr, Song Bai, and Xiaojuan Qi. Is synthetic data from generative models ready for image recognition? arXiv preprint arXiv:2210.07574, 2022.
- Hendrycks et al. (2019) Dan Hendrycks, Norman Mu, Ekin D Cubuk, Barret Zoph, Justin Gilmer, and Balaji Lakshminarayanan. Augmix: A simple data processing method to improve robustness and uncertainty. arXiv preprint arXiv:1912.02781, 2019.
- Ishii & Sato (2018) Masato Ishii and Atsushi Sato. Layer-wise weight decay for deep neural networks. In Image and Video Technology: 8th Pacific-Rim Symposium, PSIVT 2017, Wuhan, China, November 20-24, 2017, Revised Selected Papers 8, pp. 276–289. Springer, 2018.
- Krizhevsky et al. (2009) Alex Krizhevsky, Geoffrey Hinton, et al. Learning multiple layers of features from tiny images. 2009.
- Krogh & Hertz (1991) Anders Krogh and John Hertz. A simple weight decay can improve generalization. Advances in neural information processing systems, 4, 1991.
- Li et al. (2020) Hao Li, Pratik Chaudhari, Hao Yang, Michael Lam, Avinash Ravichandran, Rahul Bhotika, and Stefano Soatto. Rethinking the hyperparameters for fine-tuning. arXiv preprint arXiv:2002.11770, 2020.
- Lopes et al. (2020) Raphael Gontijo Lopes, Sylvia J Smullin, Ekin D Cubuk, and Ethan Dyer. Affinity and diversity: Quantifying mechanisms of data augmentation. CoRR, 2020.
- Martin & Mahoney (2019) Charles H Martin and Michael W Mahoney. Traditional and heavy-tailed self regularization in neural network models. arXiv preprint arXiv:1901.08276, 2019.
- Martin & Mahoney (2021) Charles H Martin and Michael W Mahoney. Implicit self-regularization in deep neural networks: Evidence from random matrix theory and implications for learning. Journal of Machine Learning Research, 22(165):1–73, 2021.
- Martin et al. (2021) Charles H Martin, Tongsu Peng, and Michael W Mahoney. Predicting trends in the quality of state-of-the-art neural networks without access to training or testing data. Nature Communications, 12(1):4122, 2021.
- Müller & Hutter (2021) Samuel G Müller and Frank Hutter. Trivialaugment: Tuning-free yet state-of-the-art data augmentation. In Proceedings of the IEEE/CVF international conference on computer vision, pp. 774–782, 2021.
- Peng et al. (2019) Xingchao Peng, Qinxun Bai, Xide Xia, Zijun Huang, Kate Saenko, and Bo Wang. Moment matching for multi-source domain adaptation. In Proceedings of the IEEE/CVF international conference on computer vision, pp. 1406–1415, 2019.
- Pennington & Worah (2017) Jeffrey Pennington and Pratik Worah. Nonlinear random matrix theory for deep learning. Advances in neural information processing systems, 30, 2017.
- Radford et al. (2021) Alec Radford, Jong Wook Kim, Chris Hallacy, Aditya Ramesh, Gabriel Goh, Sandhini Agarwal, Girish Sastry, Amanda Askell, Pamela Mishkin, Jack Clark, et al. Learning transferable visual models from natural language supervision. In International conference on machine learning, pp. 8748–8763. PMLR, 2021.
- Rebuffi et al. (2021) Sylvestre-Alvise Rebuffi, Sven Gowal, Dan Andrei Calian, Florian Stimberg, Olivia Wiles, and Timothy A Mann. Data augmentation can improve robustness. In M. Ranzato, A. Beygelzimer, Y. Dauphin, P.S. Liang, and J. Wortman Vaughan (eds.), Advances in Neural Information Processing Systems, volume 34, pp. 29935–29948. Curran Associates, Inc., 2021. URL https://proceedings.neurips.cc/paper_files/paper/2021/file/fb4c48608ce8825b558ccf07169a3421-Paper.pdf.
- Rombach et al. (2022) Robin Rombach, Andreas Blattmann, Dominik Lorenz, Patrick Esser, and Björn Ommer. High-resolution image synthesis with latent diffusion models. In Proceedings of the IEEE/CVF conference on computer vision and pattern recognition, pp. 10684–10695, 2022.
- Sagun et al. (2017) Levent Sagun, Utku Evci, V Ugur Guney, Yann Dauphin, and Leon Bottou. Empirical analysis of the hessian of over-parametrized neural networks. arXiv preprint arXiv:1706.04454, 2017.
- Sahu et al. (2023) Gaurav Sahu, Olga Vechtomova, Dzmitry Bahdanau, and Issam Laradji. PromptMix: A class boundary augmentation method for large language model distillation. In Houda Bouamor, Juan Pino, and Kalika Bali (eds.), Proceedings of the 2023 Conference on Empirical Methods in Natural Language Processing, pp. 5316–5327, Singapore, December 2023. Association for Computational Linguistics. doi: 10.18653/v1/2023.emnlp-main.323. URL https://aclanthology.org/2023.emnlp-main.323.
- Santoso et al. (2017) Budi Santoso, Hari Wijayanto, Khairil A Notodiputro, and Bagus Sartono. Synthetic over sampling methods for handling class imbalanced problems: A review. In IOP conference series: earth and environmental science, volume 58, pp. 012031. IOP Publishing, 2017.
- Shorten & Khoshgoftaar (2019) Connor Shorten and Taghi M Khoshgoftaar. A survey on image data augmentation for deep learning. Journal of big data, 6(1):1–48, 2019.
- Srivastava et al. (2014) Nitish Srivastava, Geoffrey Hinton, Alex Krizhevsky, Ilya Sutskever, and Ruslan Salakhutdinov. Dropout: a simple way to prevent neural networks from overfitting. The journal of machine learning research, 15(1):1929–1958, 2014.
- Wortsman et al. (2022) Mitchell Wortsman, Gabriel Ilharco, Samir Ya Gadre, Rebecca Roelofs, Raphael Gontijo-Lopes, Ari S Morcos, Hongseok Namkoong, Ali Farhadi, Yair Carmon, Simon Kornblith, and Ludwig Schmidt. Model soups: averaging weights of multiple fine-tuned models improves accuracy without increasing inference time. In Kamalika Chaudhuri, Stefanie Jegelka, Le Song, Csaba Szepesvari, Gang Niu, and Sivan Sabato (eds.), Proceedings of the 39th International Conference on Machine Learning, volume 162 of Proceedings of Machine Learning Research, pp. 23965–23998. PMLR, 17–23 Jul 2022. URL https://proceedings.mlr.press/v162/wortsman22a.html.
- Yang et al. (2023) Yaoqing Yang, Ryan Theisen, Liam Hodgkinson, Joseph E Gonzalez, Kannan Ramchandran, Charles H Martin, and Michael W Mahoney. Test accuracy vs. generalization gap: Model selection in nlp without accessing training or testing data. In Proceedings of the 29th ACM SIGKDD Conference on Knowledge Discovery and Data Mining, pp. 3011–3021, 2023.
- Zhang et al. (2018) Guodong Zhang, Chaoqi Wang, Bowen Xu, and Roger Grosse. Three mechanisms of weight decay regularization. arXiv preprint arXiv:1810.12281, 2018.
- Zhang (2017) Hongyi Zhang. mixup: Beyond empirical risk minimization. arXiv preprint arXiv:1710.09412, 2017.
Appendix A Appendix
We present more scale-shape plots here: