Dialetto, ma Quanto Dialetto?
Transcribing and Evaluating Dialects on a Continuum
Abstract
There is increasing interest in looking at dialects in NLP. However, most work to date still treats dialects as discrete categories. For instance, evaluative work in variation-oriented NLP for English often works with Indian English or African-American Venacular English as homogeneous categories (Faisal et al., 2024; Ziems et al., 2023), yet even within one variety there is substantial variation. We examine within-dialect variation and show that performance critically varies within categories. We measure speech-to-text performance on Italian dialects, and empirically observe a geographical performance disparity. This disparity correlates substantially (-0.5) with linguistic similarity to the highest performing dialect variety. We cross-examine our results against dialectometry methods, and interpret the performance disparity to be due to a bias towards dialects that are more similar to the standard variety in the speech-to-text model examined. We additionally leverage geostatistical methods to predict zero-shot performance at unseen sites, and find the incorporation of geographical information to substantially improve prediction performance, indicating there to be geographical structure in the performance distribution.
Dialetto, ma Quanto Dialetto?
Transcribing and Evaluating Dialects on a Continuum
Ryan Soh-Eun Shim1, 2 and Barbara Plank1, 2 1MaiNLP, Center for Information and Language Processing, LMU Munich, Germany 2Munich Center for Machine Learning (MCML), Munich, Germany S.Shim@lmu.de b.plank@lmu.de
1 Introduction
An increasing body of work in Natural Language Processing (NLP) has called attention to the disparity in research focus between high-resource, standardized linguistic varieties and empirical linguistic variation (Plank, 2016; Hupkes et al., 2023; Kantharuban et al., 2023; Chang et al., 2024). While there are many types of variation (e.g. genre, register), dialect variation has emerged as a particular point of focus, with increasing availability of evaluative benchmarks (Faisal et al., 2024; Ziems et al., 2023), dialect-specific datasets (Dogan-Schönberger et al., 2021; Blaschke et al., 2024), and methodological contributions (Blaschke et al., 2023; Demszky et al., 2021) towards dialect-robust models (Zampieri et al., 2020).
A considerable amount of such work conceptualizes dialects solely as discrete linguistic categories that stand side-by-side with the standard variety (e.g. African-American Vernacular English vs. mainstream American English) (Faisal et al., 2024; Ziems et al., 2023). However, prior work in dialectology has noted that dialect relations often stand in a continuum, where similarity between varieties slowly decreases the further away from a given geographical site, rather than being a sharp transition (Heeringa and Nerbonne, 2001). For dialect NLP, this means that a purely discrete conceptualization of linguistic categories not only largely overlooks the dialect continuum, but also leaves important evaluation gaps. As consequence, gradient variation within the category may not be evenly described (Jones, 2015; Labov, 2012), and lesser known transitional varieties (Jeszenszky et al., 2018) between the linguistic categories examined may be left out of evaluative benchmarks.
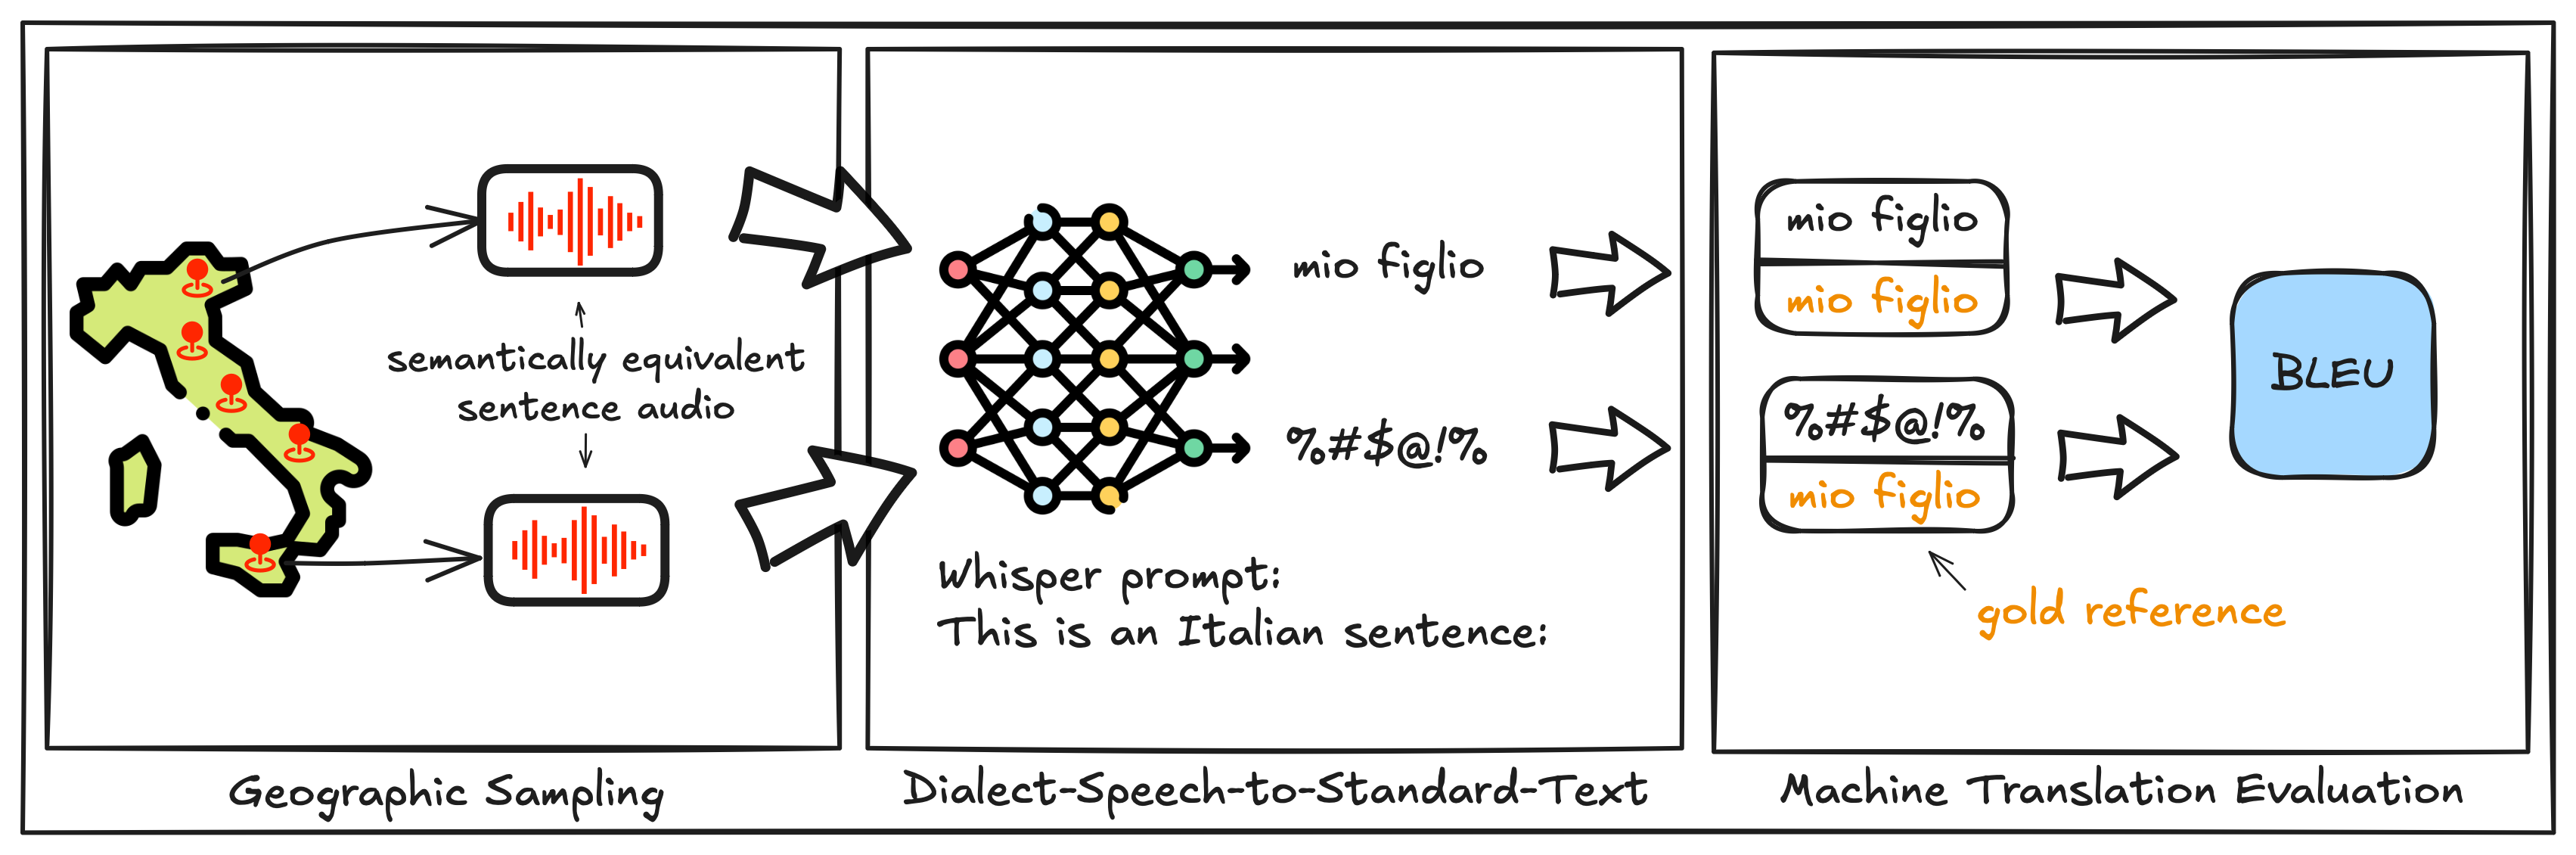
We perform a more fine-grained investigation of such a regional gap in speech-to-text models to gain insights on cross-lingual transfer performance by drawing upon geostatistical and dialectometric techniques. In contrast with prior work which evaluates performance disparity on a discrete basis (e.g. Chilean Spanish, Argentinian Spanish) (Kantharuban et al., 2023), we place dialects on a continuum using a large-scale geotagged dataset of related Italian dialects, where we conceptualize dialect relations to stand in a continuum (Heeringa and Nerbonne, 2001). As such, we perform zero-shot speech-to-text on semantically-equivalent speech samples across geographically-contiguous dialect sites, where in line with Kantharuban et al. (2023), we find evidence of zero-shot performance of speech-to-text models on dialects correlating with similarity to the standard variety. Our contributions are as follows:
-
1.
Categorical to Continuous Conceptualization: Following established work in linguistic dialectometry (Heeringa and Nerbonne, 2001), we conceptualize dialect relations as a continuum. This allows us to visualize in fine-grained detail regional performance gaps, which we find to correlate strongly with linguistic similarity to the highest performing variety, corroborating prior evaluative work done on a categorical basis (Kantharuban et al., 2023).
-
2.
Geostatistics for Dialect NLP: We perform a dialect-level examination of zero-shot performance prediction, and leverage geostatistical techniques for interpolating performance at held-out sites. We find the incorporation of geographical information to lead to a robust increase in performance prediction.
2 Dataset
2.1 Italian Dialect Dataset
We conduct our study on Vivaldi (Tosques and Castellarin, 2013), a geo-tagged parallel corpus of spoken Italian dialect varieties in audio form. The corpus contains data at different levels of linguistic units (e.g. word, sentence, discourse). The data is collected across 293 sites in Italy, and is divided into the categories of phonetic, lexical, morphological, syntactic, and discourse level data. Our criterion of using semantically-equivalent data across dialect sites is motivated by the fact that there are syntactic, lexical, and phonetic differences between dialects, which serves as a more realistic basis for evaluating zero-shot performance on dialects. As such, we leverage 15 sentence-level recordings and 20 word-level recordings per site in our experiments. To ensure a fair comparison between sites and because of the rich linguistic variety observed in Italy Ramponi (2024), we further filter for only dialect sites that fall under the Italic language branch according to the metadata, thereby removing data from Bavarian, Greek, Occitan, among others. This results in 223 sites.
In view of the scale of variation in Italian dialects, where differences between groups may warrant the status of individual languages, we also evaluate our results on only the Tuscan subgroup, which qualitative work establishes as bearing the most similarity to standard Italian. Table 1 summarizes the statistical information of our data.
rowsep=0pt # dialects used # words used # sentences used 223 20 15
rowsep=0pt Original Generated (1) Si munge due volte al giorno Si munge due volte ogni giorno EN: One milks two times per day One milks two times every day (2) Domani tornerò a casa Domani ritornerò a casa mia EN: I will go home tomorrow I will return to my home tomorrow
3 Methodology
3.1 Speech-to-Text
For our speech-to-text model, we employ Whisper (Radford et al., 2023), a family of encoder-decoder speech-to-text models. Our experiment utilizes Whisper-large-v3, which is trained on 1 million hours of weakly-labeled and 4 million hours of pseudo-labeled audio data. The training regime for Whisper is both multilingual and multi-task, where samples are either asked to be transcribed into the original language, or to be translated into English. This is achieved by way of special tokens (e.g. <lang>, <translate>, <transcribe>). In addition, the data format for long-form transcriptions includes a token <prev> to denote the previous context during training. At inference time, the space of this prior context can be used to achieve prompting, where the ASR output would be conditioned on this prior context. We take advantage of this prior context to prompt the model to transcribe the speech in standard language (e.g. "Questa è una frase italiana: "; English translation: "this is an Italian sentence: "). This is necessary due to the spoken nature of dialect varieties in Italy, where there is often no widely used written variety that corresponds with what is spoken, and speakers of such varieties would write often only in the standard variety.
3.2 Evaluation
Dolev et al. (2024) report Whisper as a viable system for speech-based dialect-to-standard ASR for Swiss German when transcribed to standard German text and evaluated with BLEU (Papineni et al., 2002). Given a similar mismatch between input and output for dialect speech to standard text for our Italian dialect data, we follow Dolev et al. (2024) in evaluating our dialect speech-to-text output with standard machine translation evaluation metrics. We employ BLEU (Papineni et al., 2002) and chrF (Popović, 2015)111We employ the implementation in SacreBLEU (Post, 2018)., both of which are based on ngram overlap. Due to the expected mismatch between Italian dialect speech and standard Italian text, we increase the number of gold references to allow for more opportunity for alternative yet valid phrasings to be counted as correct. We follow prior work in expanding the number of gold references by way of a LLM-based paraphrasing approach (Tang et al., 2024; Zeng et al., 2024). Table 2 gives an example of the original and generated gold references for standard Italian. In our experiments, we generate 10 additional references per item222We use Meta-Llama-3.1-70B-Instruct: https://huggingface.co/meta-llama/Llama-3.1-70B-Instruct, in addition to the original gold standard. Note that we do not employ standard ASR metrics such as word error rate or character error rate, as we do not expect the speech and the text to align well for every variety, due to the non-written nature of non-standard varieties.
3.3 Dialectometric Analysis
To quantify the linguistic distance between varieties, we follow established approaches in dialectometry (Wieling and Nerbonne, 2015) for both distance computation and visualization, which we employ on 20 audio recordings of words per site.
3.3.1 Linguistic Distance
To quantify the linguistic distance between dialect varieties, we follow Bartelds and Wieling (2022) in adopting self-supervised speech representations for the extraction of features on semantically equivalent words, upon which dynamic time warping (DTW) can be applied for a measure of phonetic distance. Formally, let and denote two lists of semantically equivalent words from two dialect varieties, where and , with and representing semantically equivalent items. For each pair of items , we extract their acoustic features using XLSR-53, a self-supervised speech representation model, where we employed an off-the-shelf finetune on Italian data in the Common Voice (Ardila et al., 2019) dataset333https://huggingface.co/jonatasgrosman/wav2vec2-large-xlsr-53-italian. Let and represent the feature vectors for the words and , respectively. The acoustic distance for the -th pair is then computed by way of dynamic time warping, which obtains the distance between two time series that may vary in speed and length by computing the shortest path in a cost matrix. Following Bartelds and Wieling (2022), the distance is length normalized for a fair comparison between sites. The acoustic distance between dialect varieties and is then computed by averaging the pairwise distances across all items in the lists:
rowsep=0pt Pearson Spearman chrF2 -0.50 -0.58 BLEU -0.54 -0.50
3.3.2 Multidimensional Scaling
Nerbonne (2010) shows that a map depicting dialect relations as a continuous surface can be achieved by leveraging (classical) multidimensional scaling444We use the implementation in dialectR (Shim and Nerbonne, 2022).. Multidimensional scaling (MDS) is a dimensionality reduction method, which takes as input a distance matrix and aims to project it to a lower-dimensional space while aiming to preserve the distances in the original high-dimensional space. Formally, given data points , let be the distance matrix, where represents the distance between and . MDS seeks to minimize the following objective, termed the stress function:
where is the Euclidean distance between and in the lower-dimensional space, and represents the stress, a measure of how well the configuration preserves the original distances.
Nerbonne (2010) proposes to reduce the pairwise distance matrix between dialect varieties to 3 dimensions with such an approach, which can then be converted to RGB values respectively (i.e. one dimension converted to one color), which are then overlayed on a map. This allows for color mixtures that visually depict gradual and sharp transitions, with the limitation of losing some of the information in the original distance matrix due to the dimensionality reduction.
3.4 Geostatistical Analysis
Prior work has found geographical proximity between pivot and target language to be an important predictor of cross-lingual transfer (Ahuja et al., 2022; Samardžić et al., 2022; Lin et al., 2019). The varieties examined in Ahuja et al. (2022) cover the span of languages, where the performance is argued to be due to overlap in typological and vocabulary overlap. We propose that for varieties within the same language, the geographical signal is arguably even stronger due to higher geographical proximity and fewer confounding factors (Shim et al., 2024; Jeszenszky et al., 2017), such that the signal can be helpful in predicting zero-shot performance for varieties within a given language. To verify this claim, we leverage geostatistical techniques to predict the zero-shot performance of Whisper on unseen held-out sites. We employ three geostatistical interpolation methods in our experiments555We use implementations in the R package gstat (Pebesma, 2004; Gräler et al., 2016): nearest neighbor interpolation (NN), inverse distance weighting (IDW), and kriging. While NN and IDW do not make assumptions on the geographical distribution of the data, the use of kriging makes the assumption of stationarity, which is the assumption that the mean and variance are constant across space. Given that the variable we model is speech-to-text performance on dialects, its geographical distribution arguably may violate the assumption of stationarity, depending on how well the model generalizes to the dialect varieties in different regions. Given such a potential for non-stationarity in the data, we expect this to require modelling in order to better satisfy the assumption. We detail our treatment of this in Section 3.4.5.
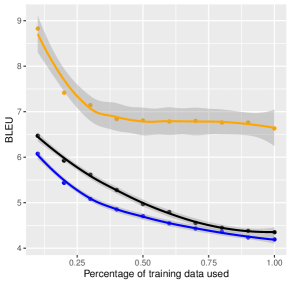
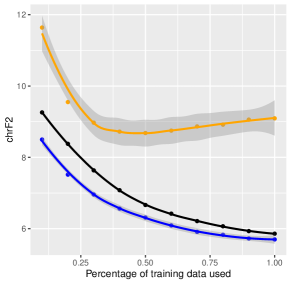
In our experiments, we perform an 80/10/10 split for training, validation, and test data, where we tune hyperparameters by way of a grid search on the validation set, and report the RMSE on the test set. In addition, we measure the impact of training data size across the geostatistical methods examined, where we sample the training data from a percentage range of 0.1 to 1.0. For each point in the percentage range, we repeat the sampling procedure 100 times and take the mean of the interpolation RMSE across the 100 runs, in order to ensure that the performance reported is representative of the data. Table 4 summarizes our results; Figure 3 shows the effect of training data size.
rowsep=0pt NN IDW RK chrF2 9.09 5.86 5.70 BLEU 6.63 4.35 4.19
3.4.1 Baseline
To verify the extent to which increasing levels of geospatial information is helpful for prediction, we employ nearest neighbor interpolation as a baseline, where the predicted value of a sample is taken to be identical to its geographically nearest neighbor in the training data.
3.4.2 Inverse Distance Weighting
Inverse distance weighting (IDW) is a geostatistical interpolation method, where the estimated value at a target point is computed as a weighted average of the known values from surrounding data points. The weights are inversely proportional to the distance from the target point, with closer points having more influence. Formally, given a set of known points with corresponding values , the interpolated value at is defined as:
where the weights are given by:
with representing the Euclidean distance between and , and being a positive power parameter that controls the influence of the distance. In our experiments, we perform a grid search and evaluate on the validation data to determine the hyperparameters used on the test data for each run.
3.4.3 Variogram
A variogram is a method in geostatistics that is used to quantify the degree of spatial autocorrelation between data points. In contrast to IDW, which assumes a deterministic decrease in similarity as distance increases, a variogram provides a probabilistic approach to measuring how spatial correlation between values changes with increasing separation distance, allowing for a more data-driven approach towards deriving the weights of the values used to interpolate the value at an unknown site. Formally, the variogram is defined as:
where is the observed value of the random variable at location ; is the lag distance, representing the separation distance between two locations; is the value of at location ; and is the number of data point pairs separated by distance .
The function estimates the spatial variance as a function of distance, with larger values of indicating weaker correlation between points. A variogram is typically visualized by plotting against , which allows for a visual interpretation of the y-intercept, representing measurement error or spatial variability at very short distances (the nugget); the point at which spatial correlation diminishes (the sill), and the distance at which the variogram reaches the sill, beyond which points are effectively uncorrelated (the range). A function is typically then fit to the empirical values by adjusting for the parameters of nugget, sill, and range, in order for a continuous model to be obtained that best fits the empirical distribution of the data. Such a model of how the variance varies with distance forms the basis for kriging, a more sophisticated interpolation method that we employ in our experiments and describe next. In our experiments, we automatically fit the theoretical variogram by way of the best least squares fit to the data.
3.4.4 Ordinary Kriging
Kriging uses the variogram to calculate weights that account for both distance and spatial correlation, providing more accurate estimates at unsampled locations. In ordinary kriging, the value at an unknown location , denoted as , is a weighted sum of the known values at nearby locations:
The weights are determined using the variogram, giving more importance to closer points with stronger spatial correlation. To ensure the estimate is unbiased, the weights are constrained to sum to 1. The kriging weights are found by solving a system of equations based on the variogram, where a Lagrange multiplier enforces the constraint above. The weights are then applied to the known values to predict values at sites unseen in the data.
However, a key assumption behind ordinary kriging is that the spatial process which generates the values is stationary, where the mean and variance are assumed to be constant across space. Where this assumption does not hold, it may be necessary to incorporate auxiliary variables that help explain trends in the data by way of regression, which then allows kriging to be done on the residuals.
3.4.5 Regression Kriging
Regression kriging extends ordinary kriging by incorporating auxiliary variables to account for trends in the data that might otherwise violate the stationarity assumption. These auxiliary variables are commonly assumed to have a linear relationship with the variable of interest.
In regression kriging, the observed values at known locations are assumed to follow a model of the form:
where is the drift term, which represents the trend at location , and is a spatially correlated random error with a mean of zero. The drift term is typically modeled as a linear combination of one or more auxiliary variables at each location:
where are the regression coefficients, and are the values of the auxiliary variables at location . The kriging weights are then computed by solving the kriging system, with the variogram used to model the spatial correlation of the residuals .
In our experiments, we hypothesize that a correlation exists between speech-to-text BLEU and chrF2 scores and similarity to the standard variety (approximated by the highest performing variety). We therefore model similarity to the highest performing variety as the drift term, and compute the variogram on the basis of the residuals.
4 Results
4.1 Speech-to-Text Evaluation
rowsep=0pt N Min 1st Q Median 3rd Q Max All Varieties 223 17.97 27.5 35.52 42.51 63.25 Tuscan 8 51.99 57.73 62.32 64.24 72.45 Umbrian 13 48.03 49.67 54.80 60.82 70.45 Abruzzian 8 34.10 38.00 42.89 46.86 53.16 Venetian 31 31.53 37.86 41.76 46.50 57.72 Sicilian 12 34.60 38.17 41.32 43.83 45.56 Ligurian 15 26.88 32.73 37.03 39.77 48.54 Trentinian 11 24.28 31.29 35.52 41.77 48.23 Lucanian 10 23.35 28.73 35.41 42.85 45.12 Molisan 15 25.95 30.94 34.26 39.70 43.26 Apulian 6 21.08 24.30 32.48 38.99 42.20 Friulian 16 22.48 29.40 31.12 37.56 40.81 Ladin 9 17.97 21.72 27.52 28.71 38.10 Piedmontese 13 19.93 25.15 26.40 28.68 30.34 Lombardian 23 18.50 23.50 25.84 30.24 39.07 Sardinian 14 20.04 22.44 23.69 25.13 27.50
rowsep=0pt N Min 1st Q Median 3rd Q Max All Varieties 223 0.00 4.19 7.98 14.50 29.67 Tuscan 8 14.75 20.19 32.72 39.18 49.72 Umbrian 13 12.53 19.45 27.56 34.32 46.08 Abruzzian 8 7.58 12.80 16.14 19.16 27.69 Lucanian 10 3.48 4.31 11.65 14.42 16.75 Sicilian 12 3.45 6.63 11.43 13.70 21.19 Venetian 31 3.31 7.75 10.53 18.28 31.06 Molisan 15 2.20 6.39 8.97 12.50 21.10 Apulian 6 1.53 2.24 8.65 13.14 18.30 Ligurian 15 2.65 4.27 7.45 10.20 17.97 Trentinian 11 3.75 4.38 7.05 10.96 16.51 Friulian 16 1.75 3.02 6.62 11.41 16.96 Lombardian 23 1.62 2.42 4.79 7.43 11.45 Ladin 9 1.36 1.80 4.35 7.04 11.57 Sardinian 14 1.99 2.34 4.30 6.12 8.85 Piedmontese 13 1.74 1.92 3.78 5.90 9.21
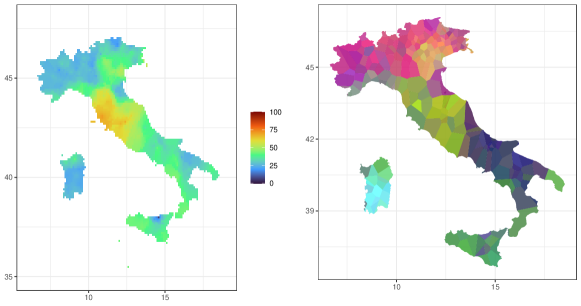
The chrF results are geographically interpolated and plotted in Figure 2. We observe in the map that zero-shot performance is particularly high in the Tuscan region, where the highest performing dialect site also resides, as shown in Table 5 and Table 6. Prior literature has established standard Italian to be modelled after Tuscan varieties (Hall, 1980; Wieling et al., 2014), which corroborates the trend observed in our results. The similarity of Umbrian dialects with Tuscan dialects is also observable in Umbrian dialects ranking second after Tuscan in Table 5 and Table 6. Table 3 details the correlation between linguistic similarity and the performance scores, where the Pearson correlation for the chrF score is -0.50 and for BLEU -0.54, and the Spearman correlation is -0.58 for chrF and -0.50 for BLEU, suggesting a strong correlation between similarity to the standard (as approximated by the highest performing site) and speech-to-text performance.
4.2 Dialectometric Analysis
In Figure 2, colors that are more similar in the dialectometry map indicate more linguistic similarity. We observe the green-tinted areas such as Tuscany correspond with higher-performing regions, which we interpret to be similarity to the standard variety. The greenness in north Sardinia is documented in prior literature (Cugno et al., 2022), where the dialects spoken there — Gallurese and Sassarese — are considered to be Southern Corsican varieties, where Corsican is considered to be strongly influenced by Tuscan. Similarly, the green tints in Sicily correspond with observations made of the dataset in prior literature (La Quatra et al., 2024), where it is noted that varieties such as Sicilian contain a considerable amount of standard Italian presence in the data, suggesting some samples to exhibit language mixing between standard and dialect.
4.3 Geostatistical interpolation
Building on the observation that there is a clear geographical signal in both the performance and dialectometry maps, we next measure to what extent the incorporation of geographical knowledge helps predict zero-shot speech-to-text performance at unseen sites. As shown in Table 4, geostatistical interpolation is highly predictive of both BLEU and chrF scores, with RMSE scores going to as low as 4.19 and 5.70 by regression kriging, our best method. Figure 3 additionally show the effect of training data size on the regression prediction performance. In all results, we observe that the incorporation of distance and covariance between samples as weighting improves over an interpolation by only the value of the nearest neighbor, where regression kriging is consistently the best performing method, followed by inverse distance weighting.
5 Discussion
5.1 Evaluating Dialects as a Continuum
In Figure 2, we observe that for Italian dialects, the evaluation results stand in a continuum that bears similarity to the map of dialect similarity relations. Furthermore, even when one restricts the examined samples to Tuscan varieties, we observe in Table 5 and Table 6 that there is still a disparity that extends the further away one is from the highest performing sites. Our results highlight the need for work in dialect evaluation to take into account the continuous nature of dialects that may exhibit even within dialects that might fall under the same category. While prior work has made important headway in individually evaluating non-standard varieties as as separate categories and highlighting the performance disparity when compared against the standard, regional variation also exhibits within non-standard varieties such as AAVE (Jones, 2015). Our results suggest that performance prediction in AAVE would arguably also exhibit regional differences, potentially patterning based on how similar the regional varieties are to standard English (e.g. in urban sites), although empirical work is needed to confirm this hypothesis. Importantly, our findings highlight that an evaluation of dialects that is insufficiently balanced geographically therefore carries the risk of overly optimistic views towards model performance at geographically marginal sites, which in turn may lead to social harm towards the subgroups which speak it.
5.2 Geo-Based Performance Prediction
Extending on the claim of Ahuja et al. (2022), who highlight the role of geography in predicting how well the pivot language for finetuning generalizes to the target language, we explicitly utilize geostatistical methods in our work on geographically proximate dialects, and find both the distance between dialect sites and the covariance between sites to be useful for predicting zero-shot ASR performance at unseen sites. Our results emphasize the geographical structure of dialects, and points to the possibility of leveraging such geographical structure for multilingual transfer between dialects.
6 Related Work
Kantharuban et al. (2023) stands as the work most similar to our own, where LLMs for both speech and for text are used to evaluate on the tasks of Machine Translation and Automatic Speech Recognition on regional dialects of high and low-resource languages. They find model performance on such varieties to be highly correlated with lexical and phonetic similarity to the highest performing variety. Their work however considers dialect varieties categorically by considering regional varieties such as Argentinian and Chilean Spanish under the same language of Spanish. Our work instead proposes to work on varieties on a continuous basis across geographically nearby varieties.
As regards treating varieties as a continuum, in NLP, Grieve et al. (2024) hypothesize that language models inherently model varieties of language, and propose to leverage sociolinguistic expertise to identify underrepresented varieties. In dialectology the notion of dialects as a continuum is well-established, where computational work in quantifying such a continuum abounds in the field of dialectometry (Heeringa and Nerbonne, 2001; Wieling and Nerbonne, 2015; Nerbonne, 2010).
With regard to bias against dialect varieties in ASR, Feng et al. (2021) show that Dutch ASR systems perform worse on Flanders speakers compared to speakers of all regions in the Netherlands. Kulkarni et al. (2024) show different ASR systems to exhibit different performance biases across 11 states in Brazil, where their dataset consists of scripted speech, and with categorical boundaries between states. Chang et al. (2024) document how self-supervised representations still exhibit a performance disparity in ASR upon AAVE. Our work shows that there is geographical structure in dialect ASR bias that is continuous and correlated with social variables, enabling more fine-grained studies on ASR bias in other languages.
7 Conclusion
In this paper, we conceptualize dialect relations as a continuum. We cross-examine our results against established research in linguistic dialectometry (Wieling and Nerbonne, 2015). We find zero-shot performance of ASR systems on dialects to pattern similarly to a measure of similarity to the standard variety, observing strong correlations. Furthermore, we introduce geostatistical methods that are predictive of zero-shot performance at held-out sites. Our work highlights the need for more research on non-standard varieties that takes into account the continuum nature of dialects. Doing so holds the potential for uncovering bias and closing prior evaluation gaps.
8 Limitations
Our study focuses on related varieties of Italian dialects, which potentially limits the generalizability of our findings. The scope of language varieties examined in our study is constrained by the scarcity of geo-tagged dialect datasets, which potentially limits the generalizability of our results to other languages. Furthermore, we approximate the standard variety by the best performing dialect variety, which may affect the correlation results depending on how similar the best performing Tuscan variety actually is to standard Italian. Future work should examine how well our insights generalize to other dialect continuua and to other modalities, where a continuum-based disparity may likewise also exhibit in text-based regional linguistic data.
9 Acknowledgements
We would like to thank the members of the MaiNLP lab and the anonymous reviewers for their invaluable feedback. The icons featured in Figure 2 are from Freepik (Italy, neural network)666https://www.flaticon.com and SVG Repo (pin, arrow, sound wave)777https://www.svgrepo.com. Lastly, we recognize the support for SS and BP through the ERC Consolidator Grant 101043235.
References
- Ahuja et al. (2022) Kabir Ahuja, Shanu Kumar, Sandipan Dandapat, and Monojit Choudhury. 2022. Multi task learning for zero shot performance prediction of multilingual models. In Proceedings of the 60th Annual Meeting of the Association for Computational Linguistics (Volume 1: Long Papers), pages 5454–5467, Dublin, Ireland. Association for Computational Linguistics.
- Ardila et al. (2019) Rosana Ardila, Megan Branson, Kelly Davis, Michael Henretty, Michael Kohler, Josh Meyer, Reuben Morais, Lindsay Saunders, Francis M Tyers, and Gregor Weber. 2019. Common voice: A massively-multilingual speech corpus. arXiv preprint arXiv:1912.06670.
- Bartelds and Wieling (2022) Martijn Bartelds and Martijn Wieling. 2022. Quantifying language variation acoustically with few resources. In Proceedings of the 2022 Conference of the North American Chapter of the Association for Computational Linguistics: Human Language Technologies, pages 3735–3741, Seattle, United States. Association for Computational Linguistics.
- Blaschke et al. (2024) Verena Blaschke, Barbara Kovačić, Siyao Peng, Hinrich Schütze, and Barbara Plank. 2024. MaiBaam: A multi-dialectal Bavarian Universal Dependency treebank. In Proceedings of the 2024 Joint International Conference on Computational Linguistics, Language Resources and Evaluation (LREC-COLING 2024), pages 10921–10938, Torino, Italia. ELRA and ICCL.
- Blaschke et al. (2023) Verena Blaschke, Hinrich Schütze, and Barbara Plank. 2023. Does manipulating tokenization aid cross-lingual transfer? a study on POS tagging for non-standardized languages. In Tenth Workshop on NLP for Similar Languages, Varieties and Dialects (VarDial 2023), pages 40–54, Dubrovnik, Croatia. Association for Computational Linguistics.
- Chang et al. (2024) Kalvin Chang, Yi-Hui Chou, Jiatong Shi, Hsuan-Ming Chen, Nicole Holliday, Odette Scharenborg, and David R Mortensen. 2024. Self-supervised speech representations still struggle with african american vernacular english. arXiv preprint arXiv:2408.14262.
- Cugno et al. (2022) Federica Cugno et al. 2022. Italian dialect classifications. DIALECTOLOGÍA, (2022.2022):197–230.
- Demszky et al. (2021) Dorottya Demszky, Devyani Sharma, Jonathan Clark, Vinodkumar Prabhakaran, and Jacob Eisenstein. 2021. Learning to recognize dialect features. In Proceedings of the 2021 Conference of the North American Chapter of the Association for Computational Linguistics: Human Language Technologies, pages 2315–2338, Online. Association for Computational Linguistics.
- Dogan-Schönberger et al. (2021) Pelin Dogan-Schönberger, Julian Mäder, and Thomas Hofmann. 2021. Swissdial: Parallel multidialectal corpus of spoken swiss german. Preprint, arXiv:2103.11401.
- Dolev et al. (2024) Eyal Dolev, Clemens Lutz, and Noëmi Aepli. 2024. Does whisper understand Swiss German? an automatic, qualitative, and human evaluation. In Proceedings of the Eleventh Workshop on NLP for Similar Languages, Varieties, and Dialects (VarDial 2024), pages 28–40, Mexico City, Mexico. Association for Computational Linguistics.
- Faisal et al. (2024) Fahim Faisal, Orevaoghene Ahia, Aarohi Srivastava, Kabir Ahuja, David Chiang, Yulia Tsvetkov, and Antonios Anastasopoulos. 2024. DIALECTBENCH: An NLP benchmark for dialects, varieties, and closely-related languages. In Proceedings of the 62nd Annual Meeting of the Association for Computational Linguistics (Volume 1: Long Papers), pages 14412–14454, Bangkok, Thailand. Association for Computational Linguistics.
- Feng et al. (2021) Siyuan Feng, Olya Kudina, Bence Mark Halpern, and Odette Scharenborg. 2021. Quantifying bias in automatic speech recognition. arXiv preprint arXiv:2103.15122.
- Grieve et al. (2024) Jack Grieve, Sara Bartl, Matteo Fuoli, Jason Grafmiller, Weihang Huang, Alejandro Jawerbaum, Akira Murakami, Marcus Perlman, Dana Roemling, and Bodo Winter. 2024. The sociolinguistic foundations of language modeling. Preprint, arXiv:2407.09241.
- Gräler et al. (2016) Benedikt Gräler, Edzer Pebesma, and Gerard Heuvelink. 2016. Spatio-temporal interpolation using gstat. The R Journal, 8:204–218.
- Hall (1980) Robert A. Jr. Hall. 1980. Language, dialect and ‘regional italian’. International Journal of the Sociology of Language, 1980(25):95–106.
- Heeringa and Nerbonne (2001) Wilbert Heeringa and John Nerbonne. 2001. Dialect areas and dialect continua. Language variation and change, 13(3):375–400.
- Hupkes et al. (2023) Dieuwke Hupkes, Mario Giulianelli, Verna Dankers, Mikel Artetxe, Yanai Elazar, Tiago Pimentel, Christos Christodoulopoulos, Karim Lasri, Naomi Saphra, Arabella Sinclair, et al. 2023. A taxonomy and review of generalization research in nlp. Nature Machine Intelligence, 5(10):1161–1174.
- Jeszenszky et al. (2018) Péter Jeszenszky, Philipp Stoeckle, Elvira Glaser, and Robert Weibel. 2018. A gradient perspective on modeling interdialectal transitions. Journal of linguistic geography, 6(2):78–99.
- Jeszenszky et al. (2017) Péter Jeszenszky, Philipp Stoeckle, Elvira Glaser, and Robert Weibel. 2017. Exploring global and local patterns in the correlation of geographic distances and morphosyntactic variation in swiss german. Journal of Linguistic Geography, 5(2):86–108.
- Jones (2015) Taylor Jones. 2015. Toward a Description of African American Vernacular English Dialect Regions Using “Black Twitter”. American Speech, 90(4):403–440.
- Kantharuban et al. (2023) Anjali Kantharuban, Ivan Vulić, and Anna Korhonen. 2023. Quantifying the dialect gap and its correlates across languages. In Findings of the Association for Computational Linguistics: EMNLP 2023, pages 7226–7245, Singapore. Association for Computational Linguistics.
- Kulkarni et al. (2024) Ajinkya Kulkarni, Anna Tokareva, Rameez Qureshi, and Miguel Couceiro. 2024. The balancing act: Unmasking and alleviating asr biases in portuguese. arXiv preprint arXiv:2402.07513.
- La Quatra et al. (2024) Moreno La Quatra, Alkis Koudounas, Elena Baralis, and Sabato Marco Siniscalchi. 2024. Speech analysis of language varieties in Italy. In Proceedings of the 2024 Joint International Conference on Computational Linguistics, Language Resources and Evaluation (LREC-COLING 2024), pages 15147–15159, Torino, Italia. ELRA and ICCL.
- Labov (2012) William Labov. 2012. Dialect diversity in America: The politics of language change. University of Virginia Press.
- Lin et al. (2019) Yu-Hsiang Lin, Chian-Yu Chen, Jean Lee, Zirui Li, Yuyan Zhang, Mengzhou Xia, Shruti Rijhwani, Junxian He, Zhisong Zhang, Xuezhe Ma, Antonios Anastasopoulos, Patrick Littell, and Graham Neubig. 2019. Choosing transfer languages for cross-lingual learning. In Proceedings of the 57th Annual Meeting of the Association for Computational Linguistics, pages 3125–3135, Florence, Italy. Association for Computational Linguistics.
- Nerbonne (2010) John Nerbonne. 2010. Mapping aggregate variation. An International Handbook of Linguistic Variation, 2:476–495.
- Papineni et al. (2002) Kishore Papineni, Salim Roukos, Todd Ward, and Wei-Jing Zhu. 2002. Bleu: a method for automatic evaluation of machine translation. In Proceedings of the 40th Annual Meeting of the Association for Computational Linguistics, pages 311–318, Philadelphia, Pennsylvania, USA. Association for Computational Linguistics.
- Pebesma (2004) Edzer J. Pebesma. 2004. Multivariable geostatistics in S: the gstat package. Computers & Geosciences, 30:683–691.
- Plank (2016) Barbara Plank. 2016. What to do about non-standard (or non-canonical) language in nlp. Preprint, arXiv:1608.07836.
- Popović (2015) Maja Popović. 2015. chrF: character n-gram F-score for automatic MT evaluation. In Proceedings of the Tenth Workshop on Statistical Machine Translation, pages 392–395, Lisbon, Portugal. Association for Computational Linguistics.
- Post (2018) Matt Post. 2018. A call for clarity in reporting BLEU scores. In Proceedings of the Third Conference on Machine Translation: Research Papers, pages 186–191, Brussels, Belgium. Association for Computational Linguistics.
- Radford et al. (2023) Alec Radford, Jong Wook Kim, Tao Xu, Greg Brockman, Christine McLeavey, and Ilya Sutskever. 2023. Robust speech recognition via large-scale weak supervision. In International conference on machine learning, pages 28492–28518. PMLR.
- Ramponi (2024) Alan Ramponi. 2024. Language varieties of Italy: Technology challenges and opportunities. Transactions of the Association for Computational Linguistics, 12:19–38.
- Samardžić et al. (2022) Tanja Samardžić, Ximena Gutierrez-Vasques, Rob van der Goot, Max Müller-Eberstein, Olga Pelloni, and Barbara Plank. 2022. On language spaces, scales and cross-lingual transfer of UD parsers. In Proceedings of the 26th Conference on Computational Natural Language Learning (CoNLL), pages 266–281, Abu Dhabi, United Arab Emirates (Hybrid). Association for Computational Linguistics.
- Shim et al. (2024) Ryan Soh-Eun Shim, Kalvin Chang, and David R. Mortensen. 2024. Phonotactic complexity across dialects. In Proceedings of the 2024 Joint International Conference on Computational Linguistics, Language Resources and Evaluation (LREC-COLING 2024), pages 12734–12748, Torino, Italia. ELRA and ICCL.
- Shim and Nerbonne (2022) Ryan Soh-Eun Shim and John Nerbonne. 2022. dialectR: Doing dialectometry in R. In Proceedings of the Ninth Workshop on NLP for Similar Languages, Varieties and Dialects, pages 20–27, Gyeongju, Republic of Korea. Association for Computational Linguistics.
- Tang et al. (2024) Tianyi Tang, Hongyuan Lu, Yuchen Jiang, Haoyang Huang, Dongdong Zhang, Xin Zhao, Tom Kocmi, and Furu Wei. 2024. Not all metrics are guilty: Improving NLG evaluation by diversifying references. In Proceedings of the 2024 Conference of the North American Chapter of the Association for Computational Linguistics: Human Language Technologies (Volume 1: Long Papers), pages 6596–6610, Mexico City, Mexico. Association for Computational Linguistics.
- Tosques and Castellarin (2013) Fabio Tosques and Michele Castellarin. 2013. Das vivaio acustico delle lingue e dei dialetti d’italia (vivaldi): Ein sprachatlas als nützliches tool für die untersuchung italienischer dialekte und minderheitensprachen. kunsttexte. de-Journal für Kunst-und Bildgeschichte, (2):1–14.
- Wieling and Nerbonne (2015) Martijn Wieling and John Nerbonne. 2015. Advances in dialectometry. Annu. Rev. Linguist., 1(1):243–264.
- Wieling et al. (2014) Martijn Wieling, John Nerbonne, Simonetta Montemagni, and R Harald Baayen. 2014. Lexical differences between tuscan dialects and standard italian: Accounting for geographic and sociodemographic variation using generalized additive mixed modeling. Language, pages 669–692.
- Zampieri et al. (2020) Marcos Zampieri, Preslav Nakov, and Yves Scherrer. 2020. Natural language processing for similar languages, varieties, and dialects: A survey. Natural Language Engineering, 26(6):595–612.
- Zeng et al. (2024) Xianfeng Zeng, Yijin Liu, Fandong Meng, and Jie Zhou. 2024. Towards multiple references era – addressing data leakage and limited reference diversity in machine translation evaluation. In Findings of the Association for Computational Linguistics ACL 2024, pages 11939–11951, Bangkok, Thailand and virtual meeting. Association for Computational Linguistics.
- Ziems et al. (2023) Caleb Ziems, William Held, Jingfeng Yang, Jwala Dhamala, Rahul Gupta, and Diyi Yang. 2023. Multi-VALUE: A framework for cross-dialectal English NLP. In Proceedings of the 61st Annual Meeting of the Association for Computational Linguistics (Volume 1: Long Papers), pages 744–768, Toronto, Canada. Association for Computational Linguistics.