Energy equipartition in multiple-population globular clusters
Abstract
We present the results of Monte Carlo simulations aimed at exploring the evolution towards energy equipartition of first- (1G) and second-generation (2G) stars in multiple-population globular clusters and how this evolution is affected by the initial differences between the spatial distributions of the two populations. Our results show that these initial differences have fundamental implications for the evolution towards energy equipartition of the two populations. We find that 2G stars, which are assumed to be initially more centrally concentrated than 1G stars, are generally characterized by a more rapid evolution towards energy equipartition. The evolution towards energy equipartition depends on the velocity dispersion component and is more rapid for the tangential velocity dispersion. The extent of the present-day differences between the degree of energy equipartition of 2G and 1G stars depends on the cluster’s dynamical age and may be more significant in the tangential velocity dispersion and at intermediate distances from the cluster’s center around the half-mass radius.
keywords:
globular clusters: general, stars: kinematics and dynamics, methods: numerical1 Introduction
Numerous observational studies have shown that globular clusters host multiple stellar populations characterized by differences in their chemical properties (see e.g. Bastian & Lardo 2018, Gratton et al. 2019, Milone & Marino 2022 for some recent reviews and references therein).
These studies find that, in addition to a population with chemical properties similar to those of halo field stars with the same metallicity (hereafter referred to as first-generation, 1G), globular clusters host one, or more, groups of chemically anomalous stars (hereafter second-generation, 2G) typically characterized by enhanced Na, Al, N, and helium abundances, and depletion in O, Mg, and C (see e.g. Carretta et al. 2009a, 2009b, Gratton et al. 2012 and references therein). About 20 per cent of Galactic globular clusters exhibit also significant differences in Fe (see e.g. Milone et al. 2017, Marino et al. 2018, 2021, McKenzie et al. 2022).
Theoretical studies have predicted that these populations also differ in their initial structural and kinematic properties. Specifically, hydrodynamical and -body simulations have shown that 2G stars may form in a sub-system more spatially concentrated than the 1G system (see e.g. D’Ercole et al. 2008, Bekki 2011, Bekki et al. 2017, Calura et al. 2019, Lacchin et al. 2021, 2022, Yaghoobi et al. 2022a, 2022b).
Studying the dynamics of multiple populations from their initial to present-day dynamical state is necessary to connect the formation phase and the observed properties of these populations, as well as to understand how the global dynamical properties of globular clusters are affected by the presence of multiple populations with different spatial and kinematic properties.
The effects of dynamical processes acting during a cluster’s long-term evolution alter the properties set at the time of formation and gradually erase the dynamical differences between 1G and 2G stars (see e.g. Mastrobuono-Battisti & Perets 2013, 2016, Hénault-Brunet et al. 2015, Tiongco et al. 2019, Vesperini et al. 2021, Sollima 2021). Some clusters, however, are expected to retain some of these differences, and recent observational studies have revealed dynamical differences between 1G and 2G stars generally consistent with those predicted by theoretical studies (see e.g. Sollima et al. 2007, Bellini et al. 2009, 2015, Lardo et al. 2011, Simioni et al. 2016, Cordero et al. 2017, Milone et al. 2018, Dalessandro et al. 2019, Cordoni et al. 2020, Libralato et al. 2022, Onorato et al. 2023, Mehta et al. 2024; See Leitinger et al. 2023 for a study showing two Galactic clusters (NGC6101 and NGC3201) with a 1G more concentrated than the 2G, but see also Mehta et al. 2024 for a recent study showing that in NGC3201 the 2G is more centrally concentrated than the 1G, and Cadelano et al. 2024 for an observational study of the dynamical properties of this cluster also providing support to scenarios in which the 2G formed more centrally concentrated than the 1G).
The dynamical differences between 1G and 2G stars imprinted by the formation processes and revealed by observations broaden the range of questions raised by the discovery of multiple populations to include a variety of issues concerning the evolution of the structural and kinematic properties of 1G and 2G stars.
The goal of the study presented in this paper is to explore the implications of initial differences between the spatial distributions of 1G and 2G stars for their evolution towards energy equipartition. The evolution towards energy equipartition is one of the dynamical consequences of the collisional evolution of a stellar system (see e.g. Spitzer 1987, Heggie & Hut 2003). As shown in a number of studies, the degree of energy equipartition in globular clusters may provide a number of a key insights into their initial and present-day dynamical properties and stellar content such as, for example, the presence of stellar and intermediate-mass black holes, the anisotropy in the velocity distribution, the dynamical phase, and the core-collapsed nature of clusters (Vishniac 1978, Trenti & van der Marel 2013, Webb & Vesperini 2017, Bianchini et al. 2018, Pavlík & Vesperini 2021, 2022, Livernois et al. 2022, Aros & Vesperini 2023). Thanks to high-precision HST proper motion studies spanning a broad range of stellar masses, the observational investigation of this aspect of the dynamics of stars clusters is now becoming possible (see e.g. Bellini et al. 2018, Libralato et al. 2018, 2019, 2022, Watkins et al. 2022).
Here we study the evolution towards energy equipartition in multiple-population globular clusters through a suite of Monte Carlo simulations and explore how the degree of energy equipartition for different populations depends on time, distance from the cluster’s center, and the velocity components.
This paper is organized as follows: we describe our simulations and the stars selected in our analysis in Section 2, in Section 3 we present a brief general overview of the spatial and kinematic properties of the systems we have studied, our results are described in Section 4, and we summarize our conclusions in Section 5.
2 Initial conditions and Simulation Properties
This study analyzes the dynamical evolution of five different models ran with the Monte Carlo simulation code MOCCA (Hypki & Giersz 2013, Giersz et al. 2013) on the Indiana University’s Quartz supercomputer. The MOCCA code implements Henon’s Monte Carlo method to follow the evolution of star clusters (Hénon 1971). MOCCA includes the effects of two-body relaxation, binary-binary and binary-single interactions (using the FEWBODY code by Fregeau et al. 2004), and a spatial truncation mimicking the effects of the external tidal field of the host galaxy. In the simulations presented in this paper, binary and single stellar evolution are modeled using respectively, the BSE and SSE codes by Hurley et al. (2000, 2002). Supernovae kick velocities follow a Maxwellian distribution with a dispersion of 265 km/s (Hobbs et al. 2005). In a separate study we will investigate models with reduced kick velocities and higher retention fraction of black holes (see Aros & Vesperini 2023 for a study of the role of stellar and intermediate-mass black holes on the evolution towards energy equipartition in single-population black holes). For further details about the MOCCA code see Hypki & Giersz (2013), Giersz et al. (2013) (see also Hypki et al. 2022 for a description of recent updates to the code).
Our models include systems with a range of different values for the initial number of stars () following a Kroupa (2001) initial stellar mass function from with no primordial binaries; the effect of primordial binaries and the various parameters defining the primordial binary population will be addressed in a future paper. A metallicity of is adopted. Each model has an initial ratio of the half-mass radius to the tidal cut-off radius () of 0.14. Each simulation includes two populations, 1G and 2G, initially described by King models (King, 1966) with for the 1G stars and for the 2G stars, where the ratio of the initial half-mass radii of the 2G population to that of the 1G population () is equal to 20, and the initial fraction of 2G stars (defined as the ratio of the number of 2G stars to the total number of stars) is equal to 0.2. The system is initially set up in equilibrium with initial stellar velocities assigned using a velocity dispersion calculated from the Jeans equations (see e.g. Binney & Tremaine 2008) with the combined potential determined by the two stellar populations. The choice of a 2G initially more centrally concentrated than the 1G is generally informed and motivated by the results of a number of theoretical studies predicting that 2G stars formed in the central regions of a more extended 1G system (see e.g. D’Ercole et al. 2008, Bekki 2010, 2011, Calura et al. 2019, Lacchin et al. 2022). For all models, the 1G initially extends to the cluster’s truncation radius, and the truncation radii chosen are equal to tidal radii of clusters on circular orbits in a logarithmic potential at a galactocentric distance of 4 kpc (and 8 kpc for the model N05M_wf evolving in a weaker tidal field). All the models start with an isotropic velocity distribution except for the model denoted by N1M_a which has structural properties identical to those of the N1M model but a radially anisotropic velocity distribution following an Osipkov-Merritt profile [, where , , and are the three spherical components of the velocity dispersion, and is the anisotropy radius (see e.g. Osipkov 1979, Merritt 1985) with . The initial conditions are summarized in Table 1.
We point out that the selection of models is not meant to provide a comprehensive exploration of the initial parameter space but rather to include a few selected choices aimed at illustrating the role of some of the key parameters that determine the rate at which two-body relaxation, stellar evolution, the response of the cluster to mass loss due to stellar evolution, and the strength of the external tidal field drive the clusters’ dynamical evolution.
For the following analysis, we focus on the main sequence stars of mass range , and calculate the profiles and quantities found using the projected radius (), projected radial velocity (), and projected tangential velocity (). The mass range chosen is similar to that approached in a number of recent studies of proper motion data (see e.g. Libralato et al. 2022, Watkins et al. 2022) and the high-end of the mass range roughly corresponds to the main sequence turn-off mass at 12 Gyr.
We perform the following analysis of projected radial profiles and time evolution using the average of 30 randomized projections for each snapshot, where one snapshot is taken each Gyr from 1 to 12 Gyr. Shaded regions will be provided for each plots, which represent the 25th to 75th percentiles of values from the 30 randomized projections.
| ID. | ||
|---|---|---|
| N2M | 97 pc | |
| N1M | 77 pc | |
| N1M_a | 77 pc | |
| N05M | 61 pc | |
| N05M_wf | 97 pc |
3 An overview of the spatial and kinematic properties
The focus of this paper is on the evolution towards energy equipartition in 1G and 2G stars in multiple-population globular clusters. Before discussing the results concerning energy equipartition, we start with a brief preliminary overview of the spatial and kinematic properties of the systems investigated and the degree of dynamical mixing of the 1G and 2G properties.
3.1 Spatial Mixing
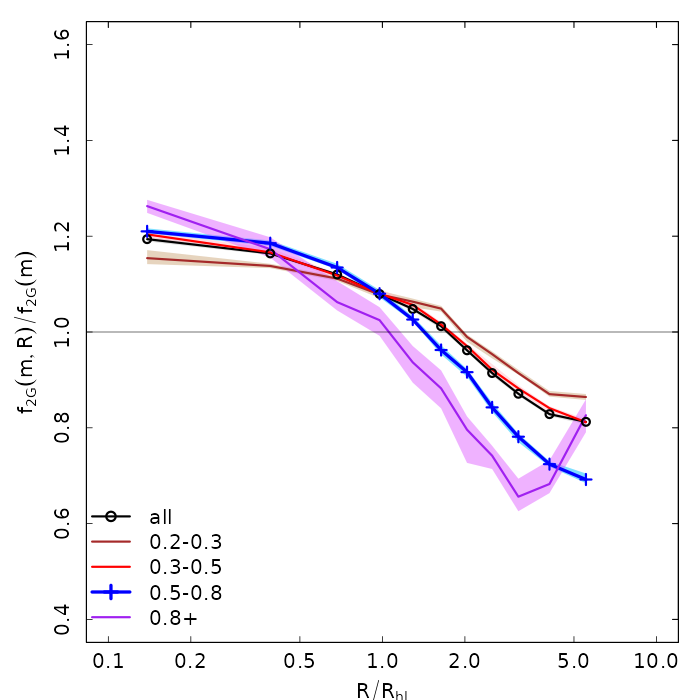
In Figure 1, we plot the fraction of 2G stars for multiple mass ranges, , normalized by the global 2G fraction of that mass range, , as a function of projected radius (normalized by the projected half-light radius, ) for the N1M model at 12 Gyr. Note that a completely mixed cluster would be represented as a horizontal line at / for all mass bins. By 12 Gyr, N1M exhibits a partial level of radial mixing across all stars and high-mass stars are further from mixed than low mass stars.
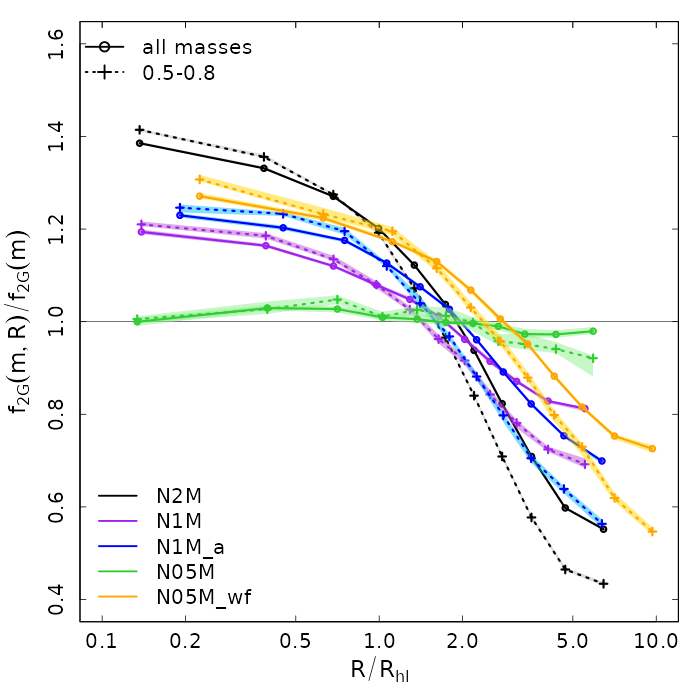
We find a range of similar trends across all models in Figure 2, where we plot the mixing of all stars selected and of a high-mass bin (; dashed line) for all simulations. For reference, mean mass of the stars in our selection and in our total cluster at 12 Gyr are and 0.39 , respectively, except for the N05M model, which has an average stellar mass of the total cluster of 0.49 . N05M is the system with the shortest initial half-mass relaxation time and nearly completely mixed by 12 Gyr, while N2M is the dynamically youngest and the furthest model from complete spatial mixing.
It is interesting to notice the differences between the degree of mixing of the N1M and N1M_a models; these two systems have initially the same structural properties but differ in their initial velocity anisotropy radial profile (see Section 2); although the differences in the degree of spatial mixing of these two models is modest, it suggests differences in the initial kinematic properties may play a role in the rate of spatial mixing. We will further explore the role of the initial anisotropy on the spatial mixing rate in a future investigation.
| ID. | |||
|---|---|---|---|
| N2M | 539,702 | 3.73 | 0.58 |
| N1M | 200,989 | 3.23 | 0.60 |
| N1M_a | 259,938 | 3.01 | 0.52 |
| N05M | 43,864 | 1.98 | 0.61 |
| N05M_wf | 116,719 | 2.50 | 0.57 |
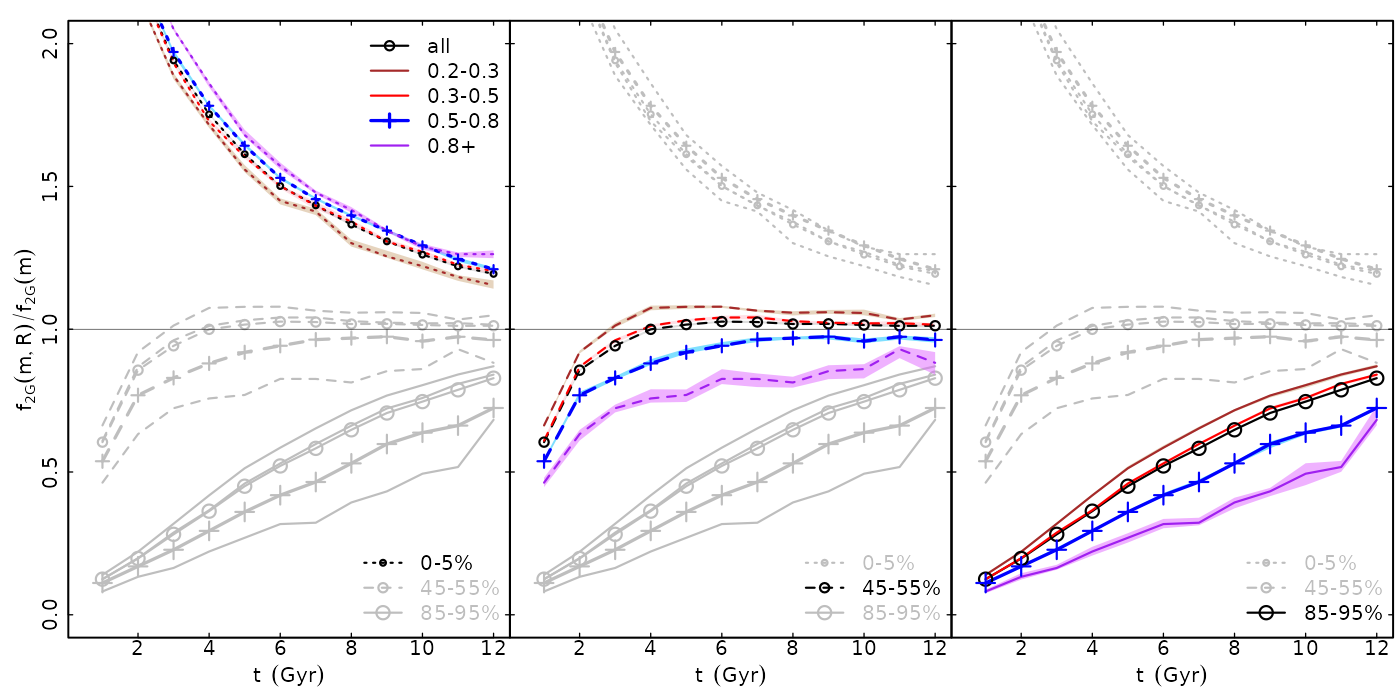
To further illustrate the dynamical evolution of the radial mixing, in Figure 3 we show the mixing ratio shown in Figure 1 as a function of time for multiple Lagrangian projected-radius bins (calculated using all stars selected), and shown in units of the projected half-light radius in Table 3) for a representative model, N1M. This figure clearly shows the development of a mass-dependent mixing during the cluster long-term evolution; this behavior matches that previously found in Vesperini et al. (2021) but, as already pointed by those authors, the dependence of the degree of mixing on the stellar mass may be too weak to be detected in observational data. Finally, in Table 2, we report the values of the total number of stars, the half-light radius, and the global fraction of the total cluster mass in 2G stars at Gyr. The limited set of initial conditions considered for this initial exploration of energy equipartition in multiple-population clusters are not meant to produce systems spanning the entire range of observed clusters’ properties, but the final properties of our models reported in Table 2 are generally consistent with those typically found in many Galactic globular clusters111 See e.g. Milone et al. 2017 for an extensive study of multiple populations in Galactic globular clusters based on HST observation. They show that the distribution of the fraction of 2G stars in their sample has a median of 64% with the 25th and 75th percentiles equal to 55% and 72% respectively. The full range of 2G’s fraction in their sample was 35% to 90%. (see also Vesperini et al. 2021, Hypki et al. 2024 for more extensive investigations studying the dependence of the 2G fraction on the clusters’ initial conditions). We also note that Figure 2 shows that our models span various degree of spatial mixing at 12 Gyr encompassing the variety of spatial distributions of 1G and 2G stars found in Galactic globular clusters ranging from clusters where the two populations are completely mixed (see e.g. Dalessandro et al. 2014, Nardiello et al. 2015) to those in which some memory of the initial differences is still present and the 2G population is more centrally concentrated than the 1G population (see e.g. Sollima et al. 2007, Bellini et al. 2009, Lardo et al. 2011, Milone et al. 2012, Cordero et al. 2014, Simioni et al. 2016, Dalessandro et al. 2019, Onorato et al. 2023). Similar initial conditions (see e.g. Vesperini et al. 2021) have also been shown to produce differences in the anisotropy between 1G and 2G stars generally consistent with those found in the Galactic clusters for which the kinematics of multiple populations has been studied (see e.g. Bellini et al. 2015, Milone et al. 2018, Cordoni et al. 2020, 2024, Dalessandro et al. 2024; an extensive investigation of the spatio-kinematical mixing will be presented in Aros et al. in prep.).
3.2 Kinematic mixing
We continue our analysis with a brief overview of our results concerning the kinematic mixing of the two populations in the projected radial and tangential directions.
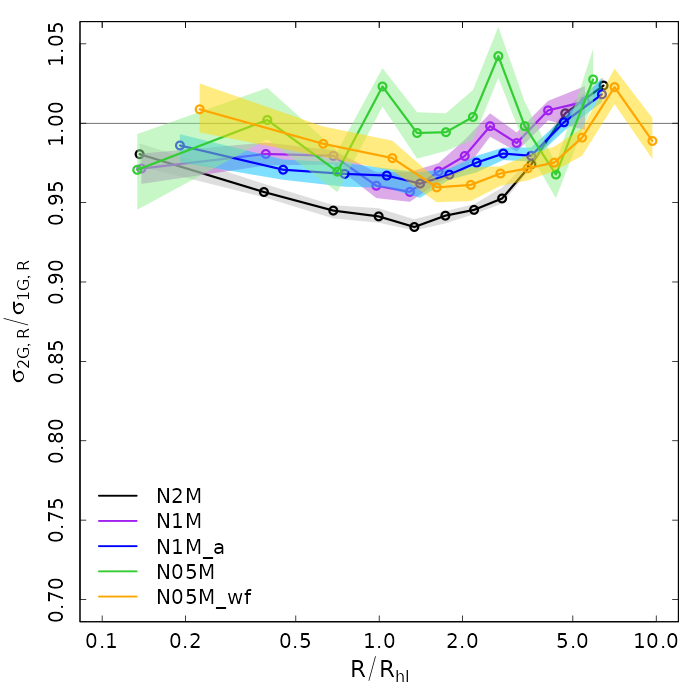
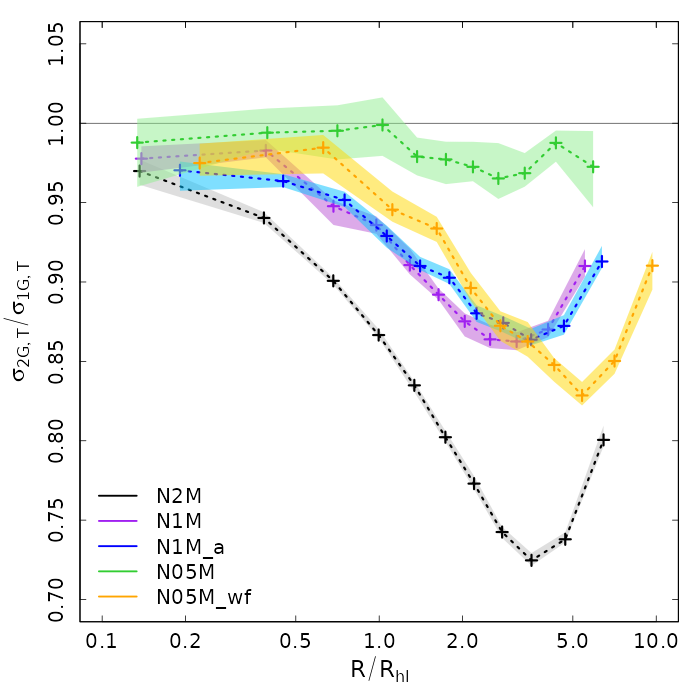
In Figure 4, we show the radial profile of the ratio of the 2G to the 1G velocity dispersion for the radial (top panel) and tangential (bottom panel) velocity components measured at 12 Gyr for all the models. We point out that while the two populations are close to kinematically mixed in the radial component of the velocity dispersion, there are significant differences between the tangential velocity dispersions of the two populations, especially in the intermediate regions. This result is consistent with the predictions of previous numerical studies (see e.g. Bellini et al. 2015, Vesperini et al. 2021) and with the findings of the first observational investigations of the kinematic properties of multiple stellar populations (see e.g. Bellini et al. 2015, 2018, Cordoni et al. 2020, Libralato et al. 2022).
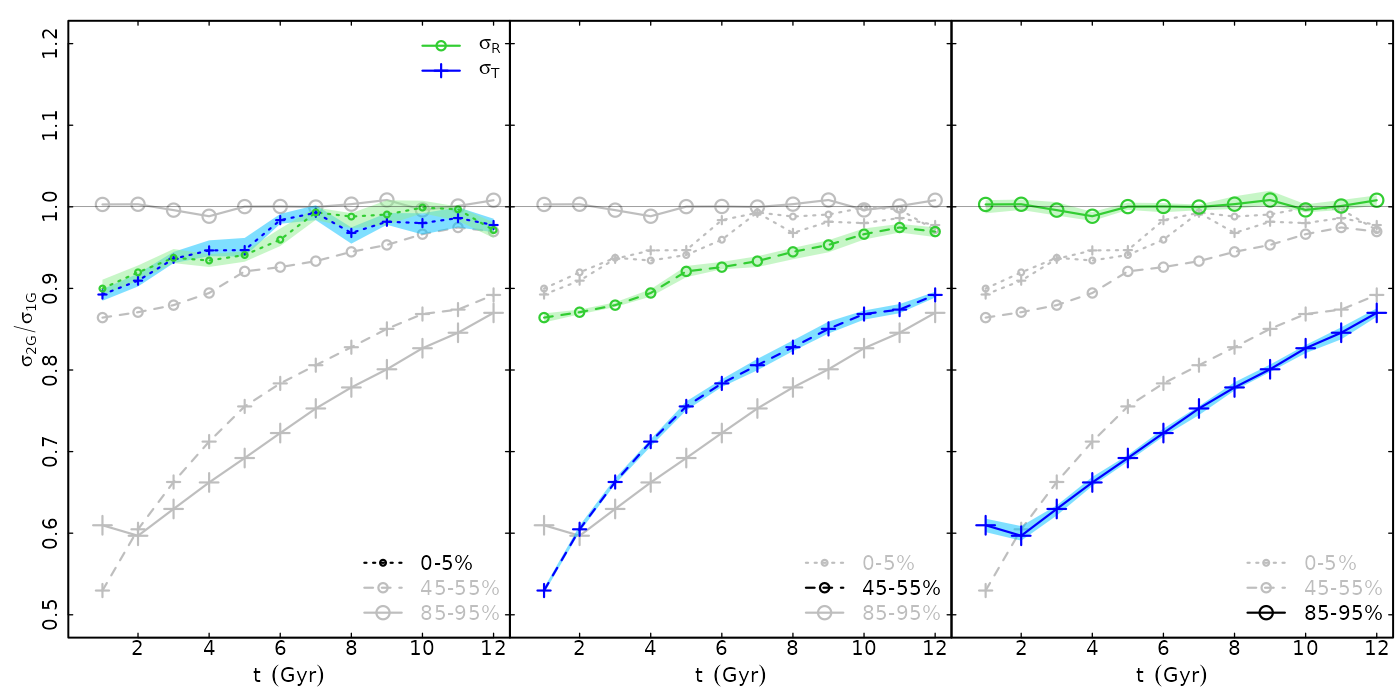
In order to illustrate the evolutionary path leading to the final radial profiles shown in Figure 4, we plot the time evolution of those velocity dispersion ratios for a selection of radial shells in Figure 5 for the N1M model. See Table 3 for the radii of each selected shell at 12 Gyr.
| ID. | |||||
|---|---|---|---|---|---|
| N2M | 0.23 | 1.5 | 2.0 | 4.1 | 5.7 |
| N1M | 0.23 | 1.5 | 1.8 | 3.5 | 4.9 |
| N1M_a | 0.29 | 1.6 | 2.0 | 4.0 | 5.6 |
| N05M | 0.23 | 1.6 | 2.0 | 3.8 | 5.2 |
| N05M_wf | 0.37 | 2.4 | 3.1 | 6.1 | 8.5 |
This shows that as the 2G stars migrate towards the outer regions, they are characterized by a radial velocity dispersion which is close to that of the local 1G stars; the 2G tangential velocity dispersion, on the other hand, is smaller than that of 1G stars and evolves towards the 1G values at a rate dependent on the distance from the cluster’s center. In the intermediate and outer regions (see, respectively, the middle and right-hand panels of Figure 5) the differences between the 2G and the 1G tangential velocity dispersions are still not negligible when the radial velocity components are already mixed. These differences between the tangential velocity dispersions of the two stellar generations are responsible for the stronger radial anisotropy of the 2G population found in previous studies (see e.g. Bellini et al. 2015, Tiongco et al. 2019, Vesperini et al. 2021, Libralato et al. 2023). A detailed investigation of the evolution of the 1G and 2G anisotropy and of the distribution of 1G and 2G stars in phase space will be presented in a future paper (Aros et al., in prep.).
4 Energy equipartition
4.1 Evolution towards energy equipartition
We now turn our attention to the study of the evolution towards energy equipartition of the 1G and 2G populations and how this evolution is affected by the differences in the initial dynamical properties of the two populations.
In our analysis, we evaluate the degree of energy equipartition at a given distance from the cluster’s center using the equipartition mass, , (from Livernois et al. 2022 and Aros & Vesperini 2023, modified from the original definition in Bianchini et al. 2016 to allow for negative equipartition masses). The equipartition mass is a function of the distance from the cluster’s center, and at a given clustercentric distance is defined as follows:
| (1) |
where is the expected velocity dispersion for a given mass, is the limit of the velocity dispersion at mass 0, and is the equipartition mass, corresponding to the value of the stellar mass such that (for ) stars more massive than follow the complete energy equipartition relation. Note that the degree of energy equipartition changes with radius, where the central regions of globular clusters develop a higher degree of equipartition than the intermediate and outer regions (see, e.g. Trenti & van der Marel 2013, Webb & Vesperini 2017, Pavlík & Vesperini 2021, 2022, and Aros & Vesperini 2023; see also Libralato et al. 2018, Watkins et al. 2022 for observational evidence).
We fit the equipartition mass with the radial velocities () and tangential velocities () individually through the following likelihood function:
| (2) |
where and are, respectively, the mass and velocity of each star at a given distance from the cluster’s center. Additionally, we calculate the equipartition mass from both the tangential and radial velocity components combined () using the following likelihood function:
| (3) |
where in this case, represents a singular 1D total velocity dispersion from both tangential and radial velocities. Note that we often use the inverse of the equipartition mass (=1/), where 0 indicates no equipartition, larger values indicate a stronger decline of velocity dispersion with higher masses, and negative values indicate an increase of the velocity dispersion with higher masses (which is a trend opposite to that of clusters evolving towards energy equipartition, see Pavlík & Vesperini 2022 for an example of how clusters can evolve towards an inverted equipartition in the outer regions).
4.1.1 Radial variation of the degree of energy equipartition
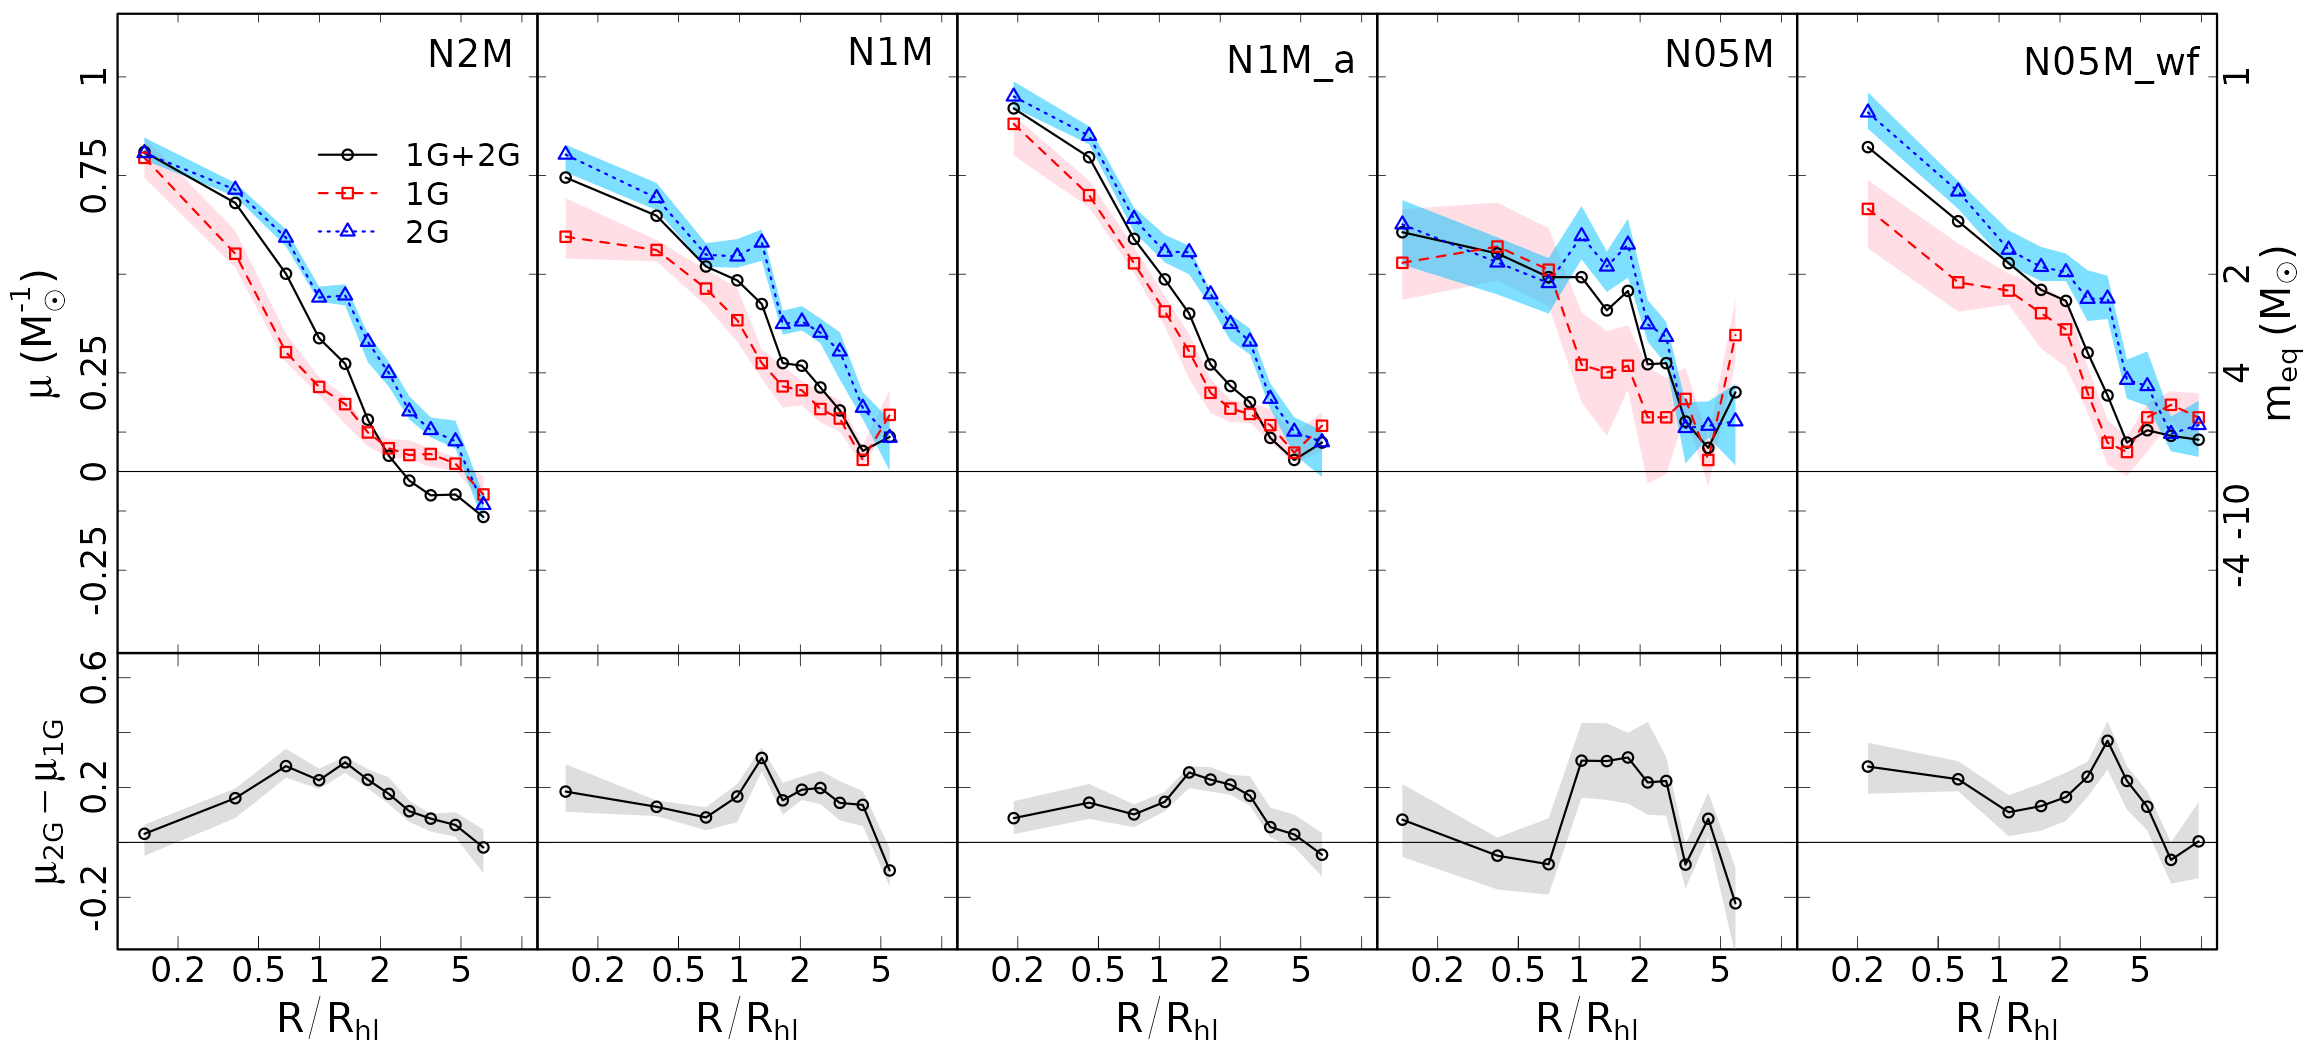
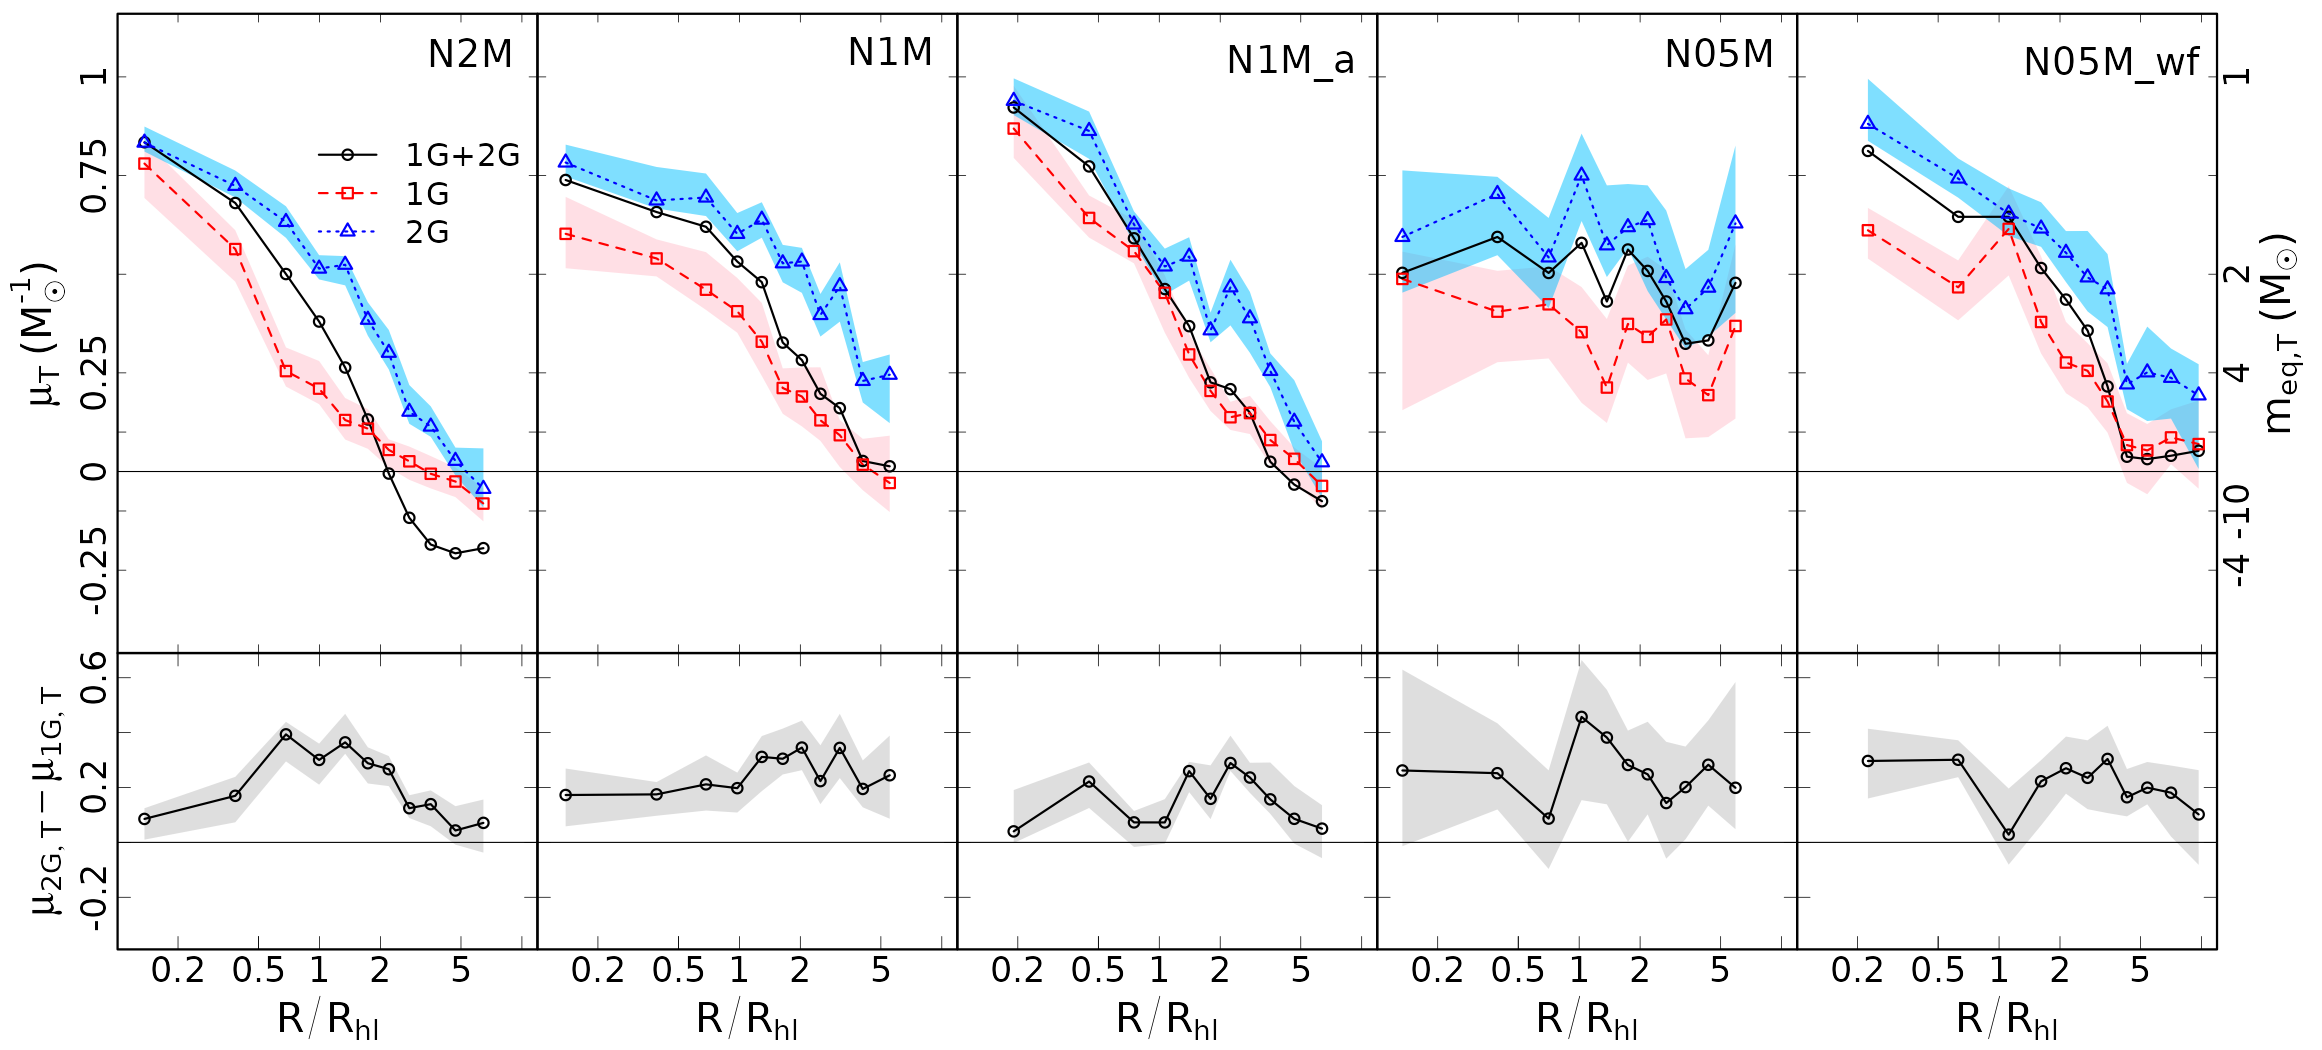
In Figure 6, we plot the radial variation of the degree of equipartition (calculated using both components of the velocity dispersion, see equation 3) for both populations combined and each population separately for all models at 12 Gyr. Additionally, this figure includes a plot of the radial variation of the difference between of the 2G and 1G populations.
We find that the largest differences between the degree of energy equipartition of 1G and 2G stars are typically found in the cluster’s intermediate regions (at ) with the 2G characterized by a stronger equipartition than the 1G; this trend agrees with the initial findings of Vesperini et al. (2021). We interpret this trend as a consequence of the fact that the 2G stars currently in the outer regions formed in a denser inner sub-system where, as they were gradually diffused outwards, they underwent a more rapid evolution towards energy equipartition. The difference between the degree of energy equipartition of 1G and 2G stars in the inner regions is generally smaller than that found in the intermediate regions while no significant differences are found in the outermost regions.
The radial variation of the degree of equipartition for all the stars (i.e. for the 1G and 2G stars selected, combined) depends on the radial variation of the fraction of 1G and 2G stars: in the inner regions, where the 2G population is dominant, it is closer to the degree of energy equipartition of the 2G stars, while in the outermost regions it approaches that of the 1G stars.
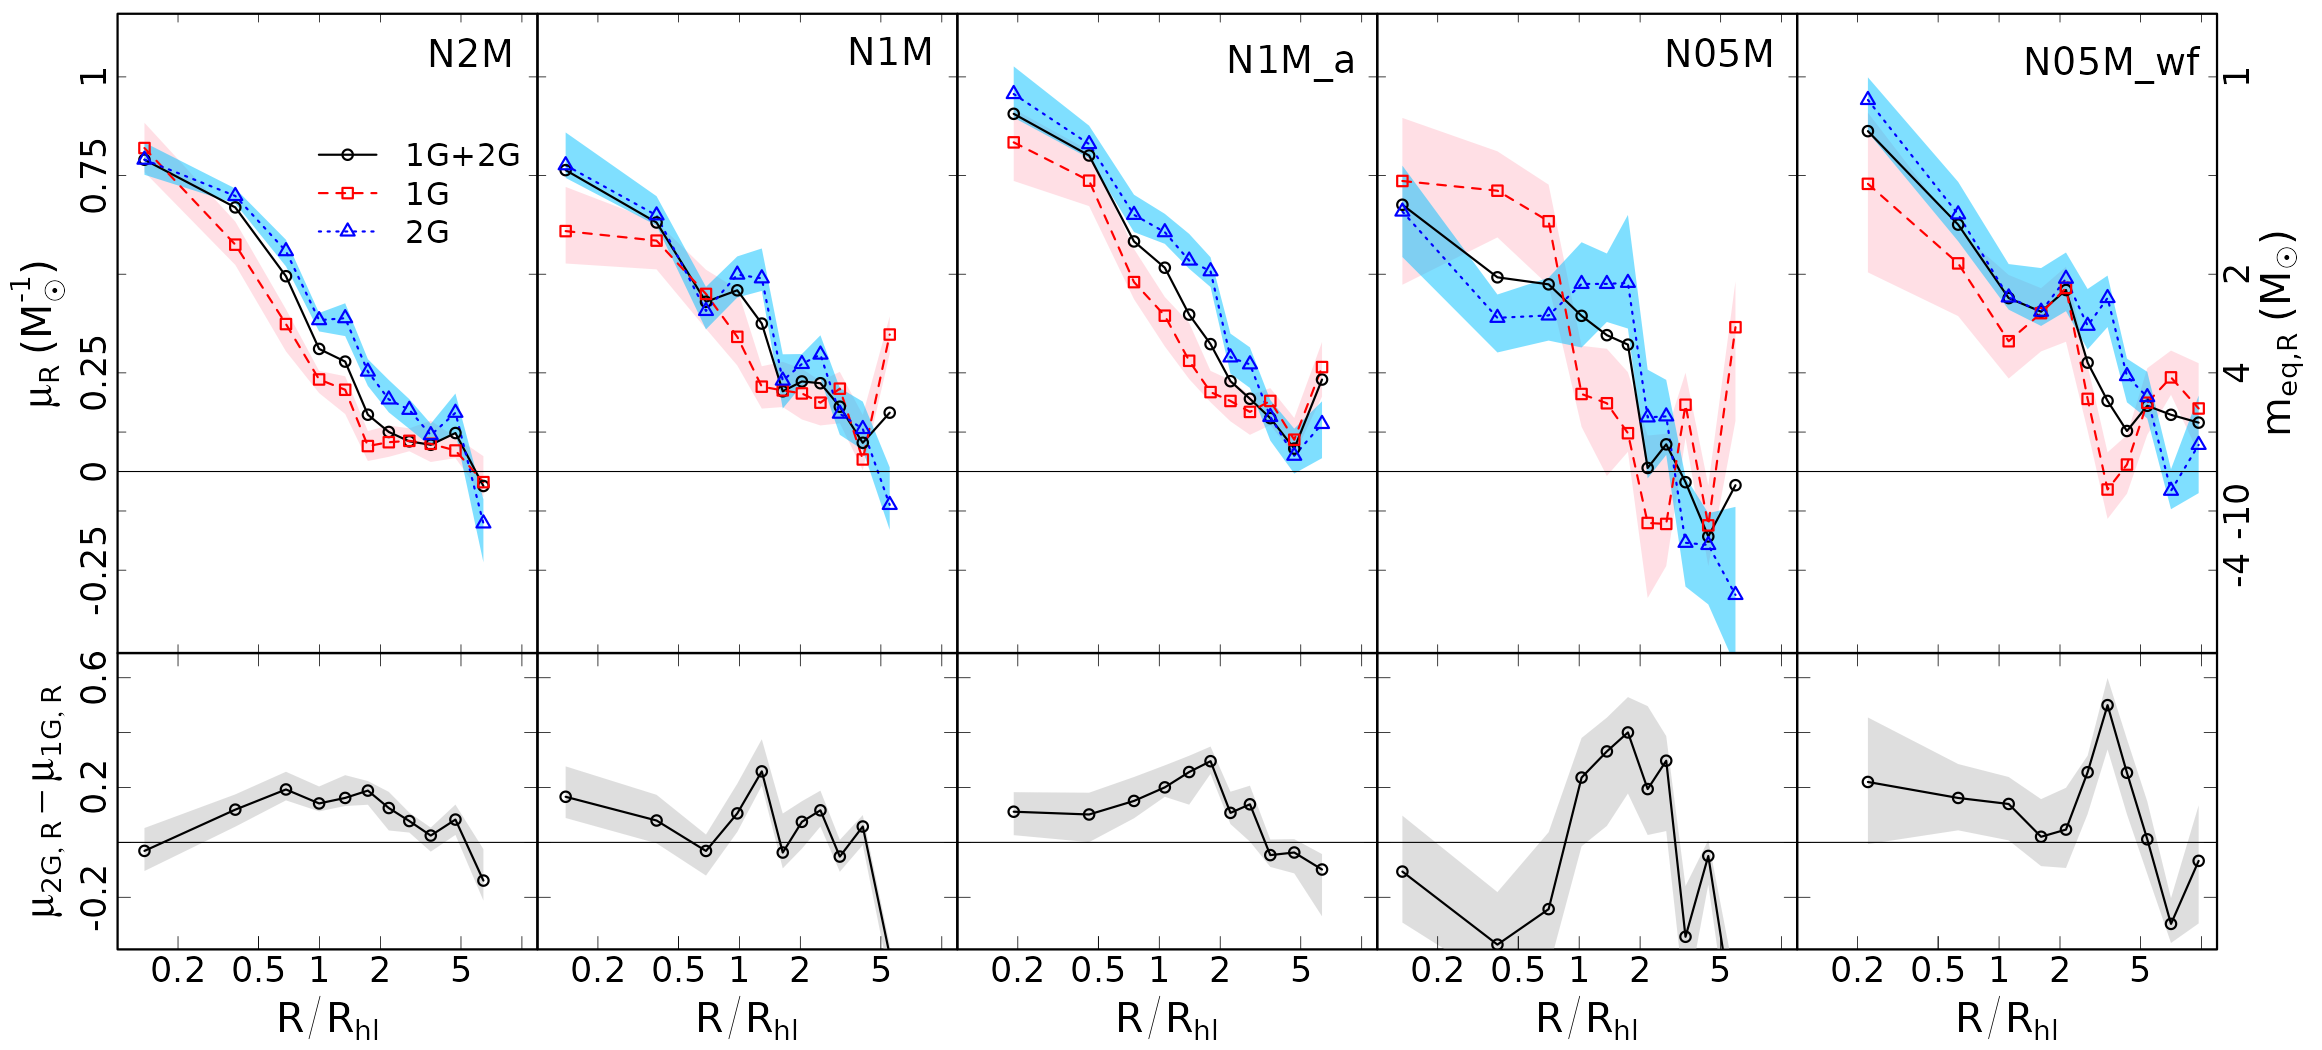
To analyze the role of each velocity component in the degree of energy equipartition, we evaluate separately in Figure 7 the radial component (top panel) and the tangential component (bottom panel) for each population individually and combined. While we find the same radial trend and stronger level of energy equipartition in the 2G population as seen in Figure 6, we also find a stronger degree of energy equipartition in the tangential component than the radial component of the velocity dispersion. In both components, the 2G population is at a more advanced stage of its evolution towards energy equipartition, but the difference between the degrees of energy equipartition is larger in the tangential component as seen in the bottom sub-panels of each panel.
When looking at the N1M and N1M_a models, we find the radial profiles of energy equipartition are different between the models when using both velocity components or the tangential component alone. The difference between the populations is slightly stronger in the radial component in the N1M_a model than the N1M model, and vice-versa when using the tangential component. These results further show that for systems with similar initial structural properties, the development towards energy equipartition depends also on the level of anisotropy in the cluster (see e.g. Pavlík & Vesperini 2021, 2022, Pavlík et al. 2024; see also Livernois et al. 2022 for the dependence on the strength of the initial rotation).
It is interesting to note that in the N05M model the degree of tangential equipartition of the 2G stars at 12 Gyr is still significantly different from that of the 1G stars despite the fact that, as shown in Section 3, the two populations are spatially (Figure 2) and kinematically mixed (Figure 4). This result suggests that energy equipartition may also reveal differences in the dynamical history of the two populations in dynamically old clusters, where the memory of other differences that were imprinted by formation and evolutionary processes have been lost.
4.1.2 The effect of multiple, unidentified kinematic populations on the measure of the energy equipartition
This section will focus on the possible impact of measuring the equipartition mass of the entire stellar content of a multiple-population cluster without first identifying the two populations.
As discussed above, the evolution towards energy equipartition proceeds at different rates for the 1G and the 2G populations. When we measure the degree of energy equipartition without separating the two populations, the combination of the dynamical properties of the two populations may lead to anomalous trends which are not representative of the cluster’s evolutionary history and its present dynamical state. We choose the tangential equipartition profile of the N2M model in Figure 7 to show an example of how the equipartition of the total system can follow a different pattern than that within each population separately.
While in the inner and intermediate regions of the cluster the value of for both populations combined is intermediate between that of the 1G and that of the 2G, in the outermost regions it differs significantly from those of each population and is negative. A negative value of the equipartition mass describes a mass-velocity dispersion trend in which the velocity dispersion increases with the mass, an anomalous behavior opposite to that expected to emerge from the normal evolution towards energy equipartition, but has been found in the outer regions of some models of single-population star clusters (Pavlík & Vesperini 2021, 2022, Livernois et al. 2022, Aros & Vesperini 2023, Pavlík et al. 2024).
In this case, however, this effect is due to a combination of the differences between tangential velocity dispersion of the two populations and the radial variation of the fraction of 2G stars. To visualize how this occurs, we plot the tangential velocity dispersion as a function of mass in the 8595% radial shell of the N2M model for each population separately, as well as both combined in Figure 8. The fraction of 2G stars in the same radial shell is over-plotted to show its dependence on the stellar mass. The velocity dispersion of both populations combined falls in-between the dispersion of the two populations at low stellar masses, but, since the fraction of 2G stars decreases for increasing stellar masses, the combined velocity dispersion approaches that of the 1G population for higher stellar masses.
This results in a positive correlation between the velocity dispersion and the stellar mass, a trend fit by a negative equipartition mass, for a combination of populations that, individually, have little to no trend of velocity dispersion with stellar mass.
Note that this effect is also prevalent in populations that have measurable levels of energy equipartition if the velocity dispersion is different between the two populations and the mass-dependent spatial mixing is not complete, but the effect is most noticeable in cases such as the example shown in N2M model in the bottom panel of Figure 7.
4.1.3 Time evolution of the degree of energy equipartition
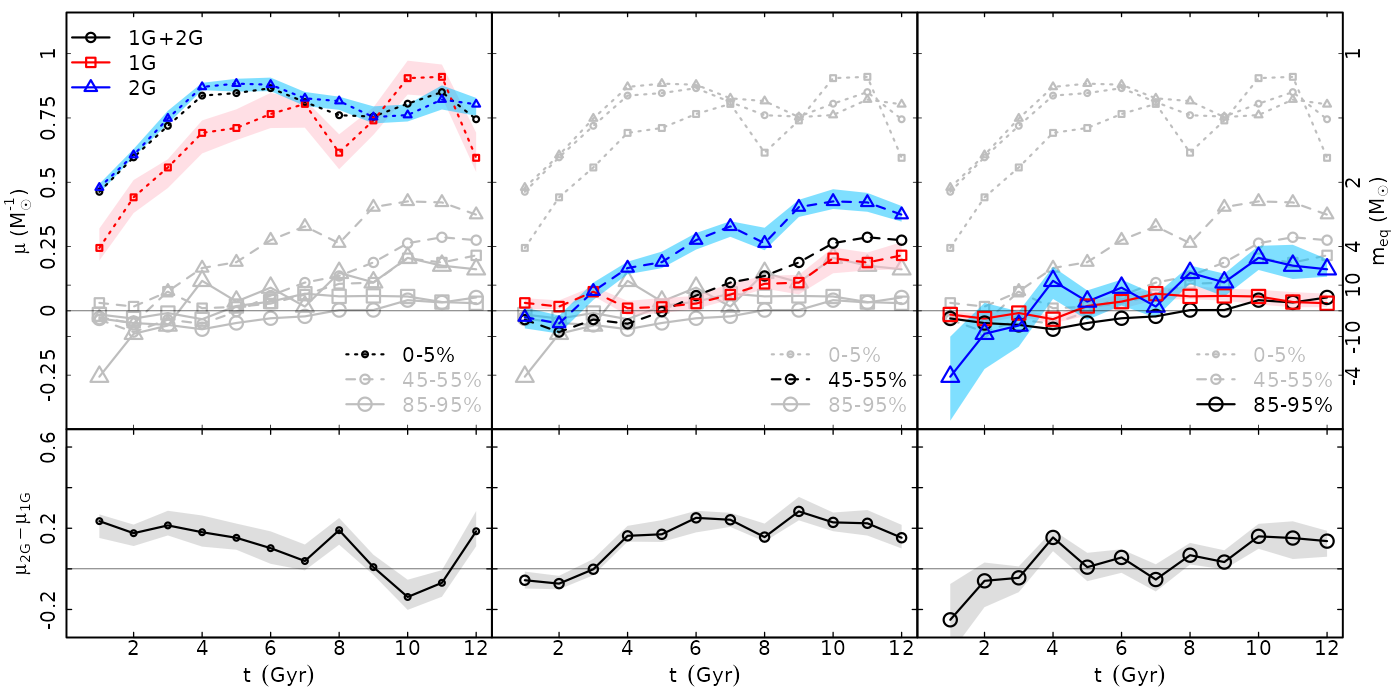
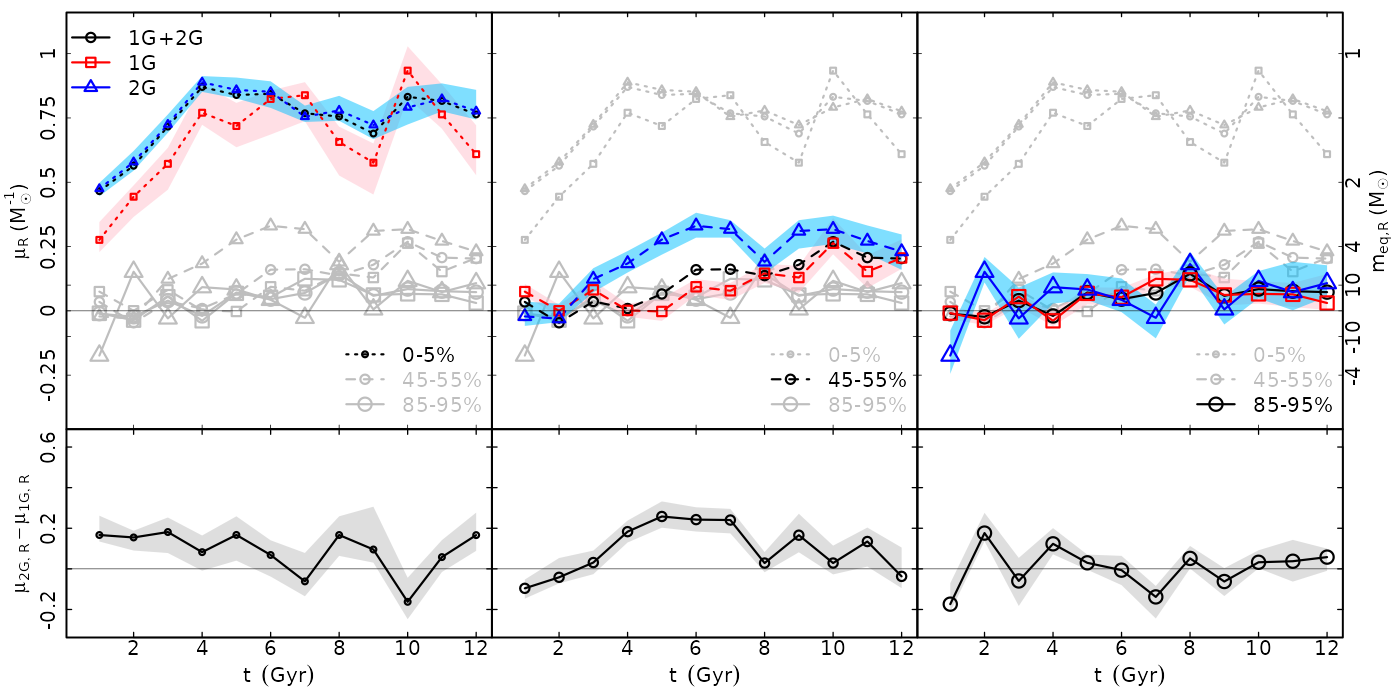
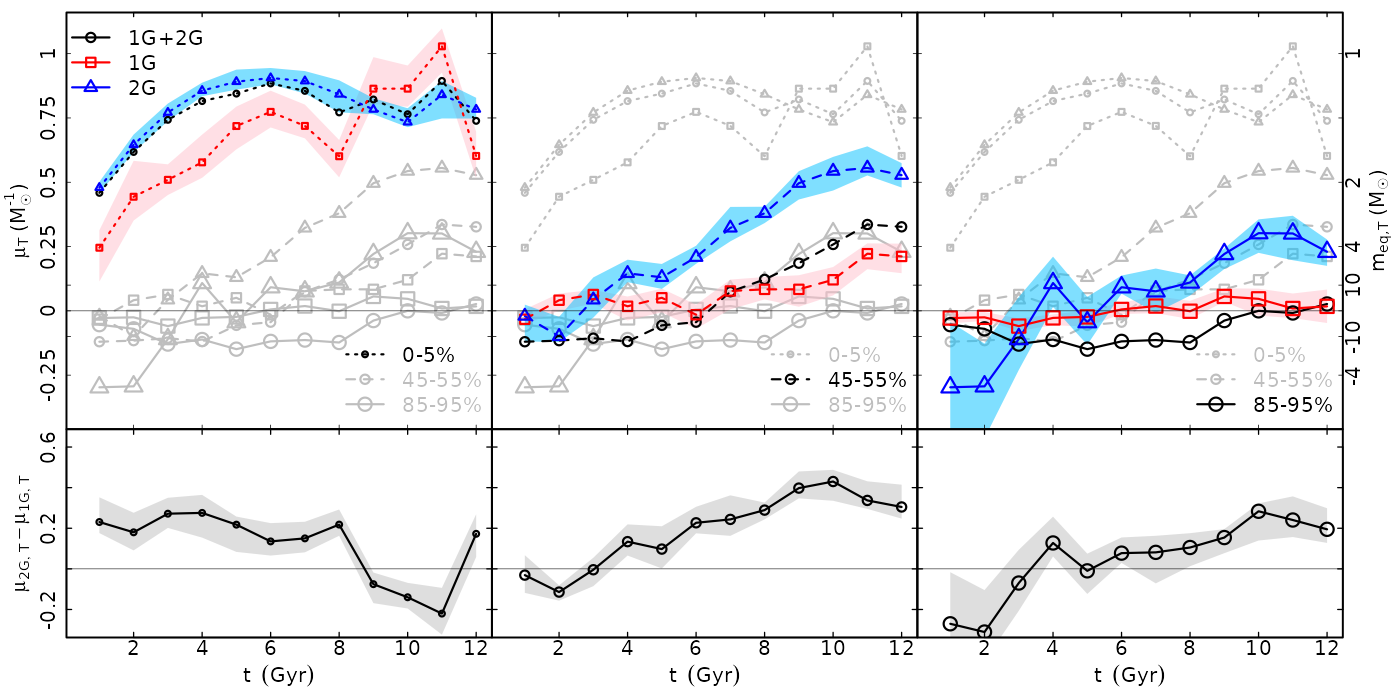
In order to illustrate the evolutionary history leading to the present-day radial variation of the degree of energy equipartition, we plot the time evolution of (Figure 9), (top panel of Figure 10), and (bottom panel of Figure 10) measured at a few selected projected distances from the cluster’s center, as well as the differences between the values for the 2G and 1G populations for the N1M model.
As expected, the inner regions are those characterized by a more rapid evolution towards energy equipartition, and the rate of the evolution towards energy equipartition decreases at larger distances from the cluster’s center.
It is interesting to note that while during the early evolutionary phases differences between the values of of the 1G and the 2G populations are present both in the inner and intermediate regions, as the system evolves these differences persist mainly in the intermediate regions while both the inner and outermost regions of the cluster are characterized by small or negligible differences. In general, the 2G population is characterized by a stronger degree of energy equipartition than the 1G population.
The analysis of the degree of energy equipartition calculated separately for the radial and tangential velocity dispersion components reveal additional interesting aspects of the dynamics of multiple-population clusters. In general the differences between the 1G and 2G values of are smaller than those between the values of . In particular, the radial equipartition mass in the cluster’s outermost regions (top right panel of Figure 10) of the 2G and the 1G are characterized by similar values during the entire cluster evolution.
As for the degree of energy equipartition in the tangential velocity dispersion, we find that during the early evolutionary phases, in the intermediate and outer regions, the 2G population is characterized by a negative equipartition mass. Despite this initial trend, during the subsequent evolution, stars from the inner regions continue their outward diffusion and the 2G population evolves towards equipartition more rapidly than the 1G.
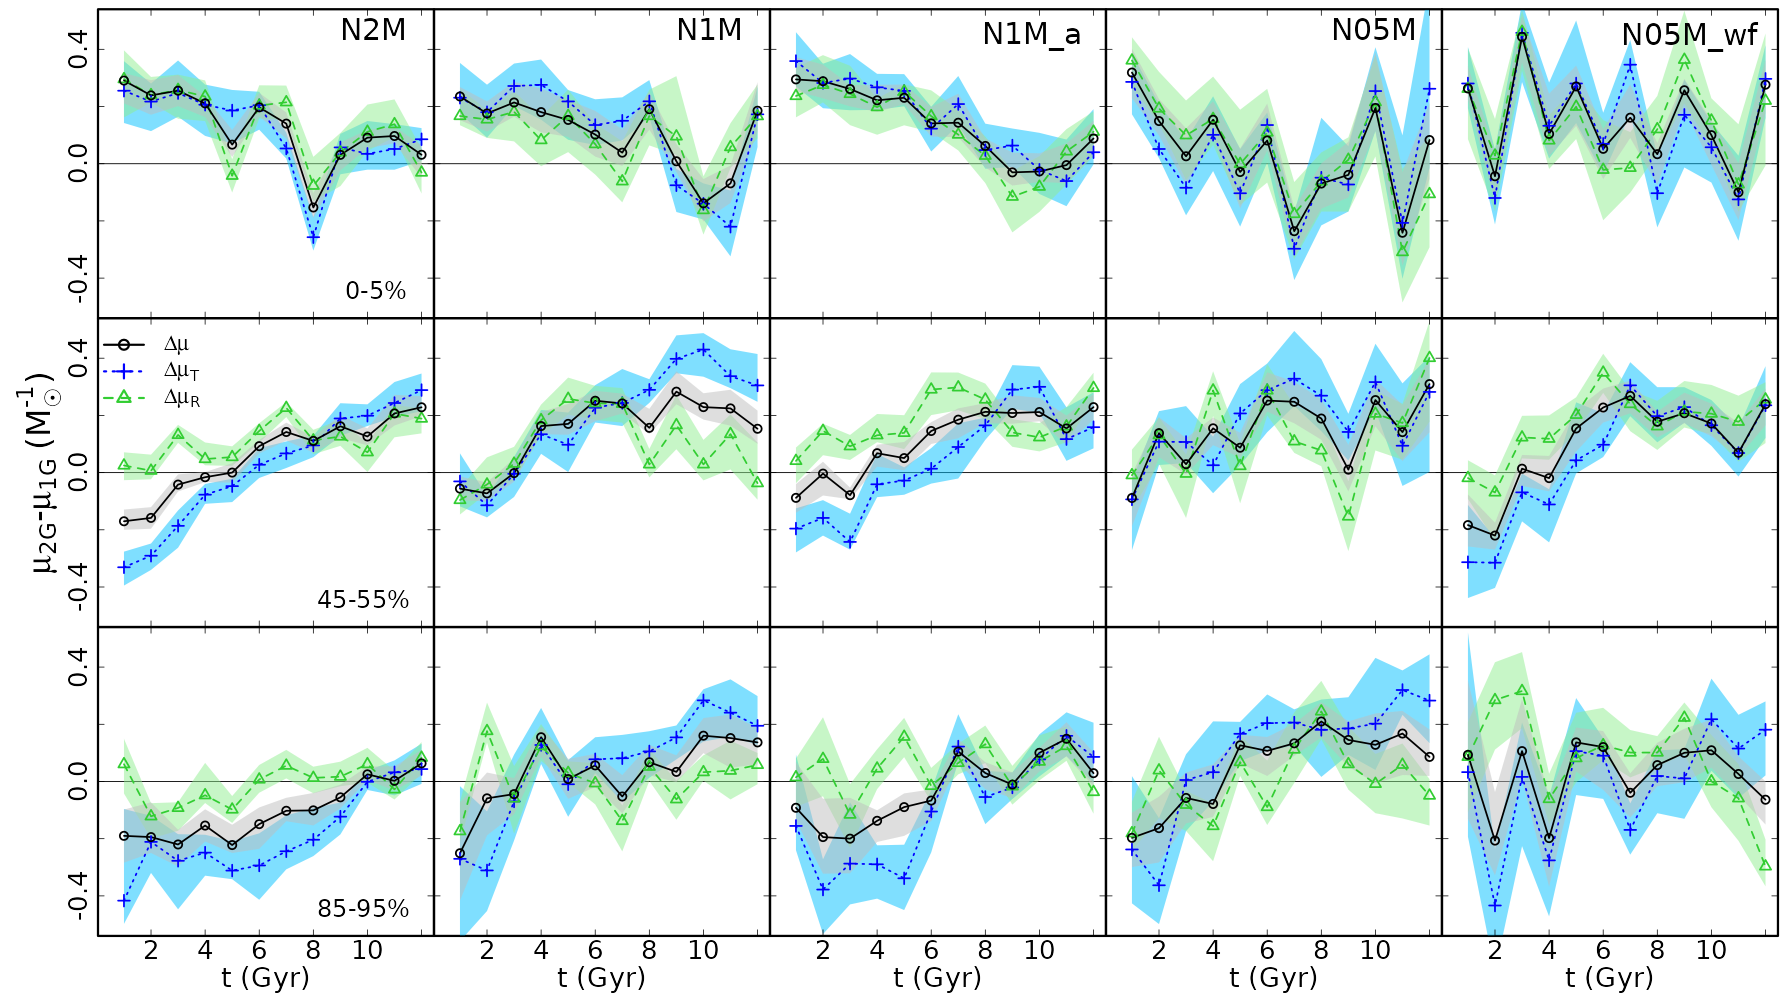
We visualize the time evolution of the differences in the equipartition between the two populations of each component for all of our models in Figure 11. Note that the largest differences at 12 Gyr are those between in the intermediate regions; in the innermost regions of each model, the differences between the values of the equipartition mass of 1G and 2G stars are larger in the early evolutionary phases but are mostly erased by 12 Gyr. All models show stronger differences in the tangential component at later times, although in a few cases the differences in the tangential components are similar to those found in the radial component.
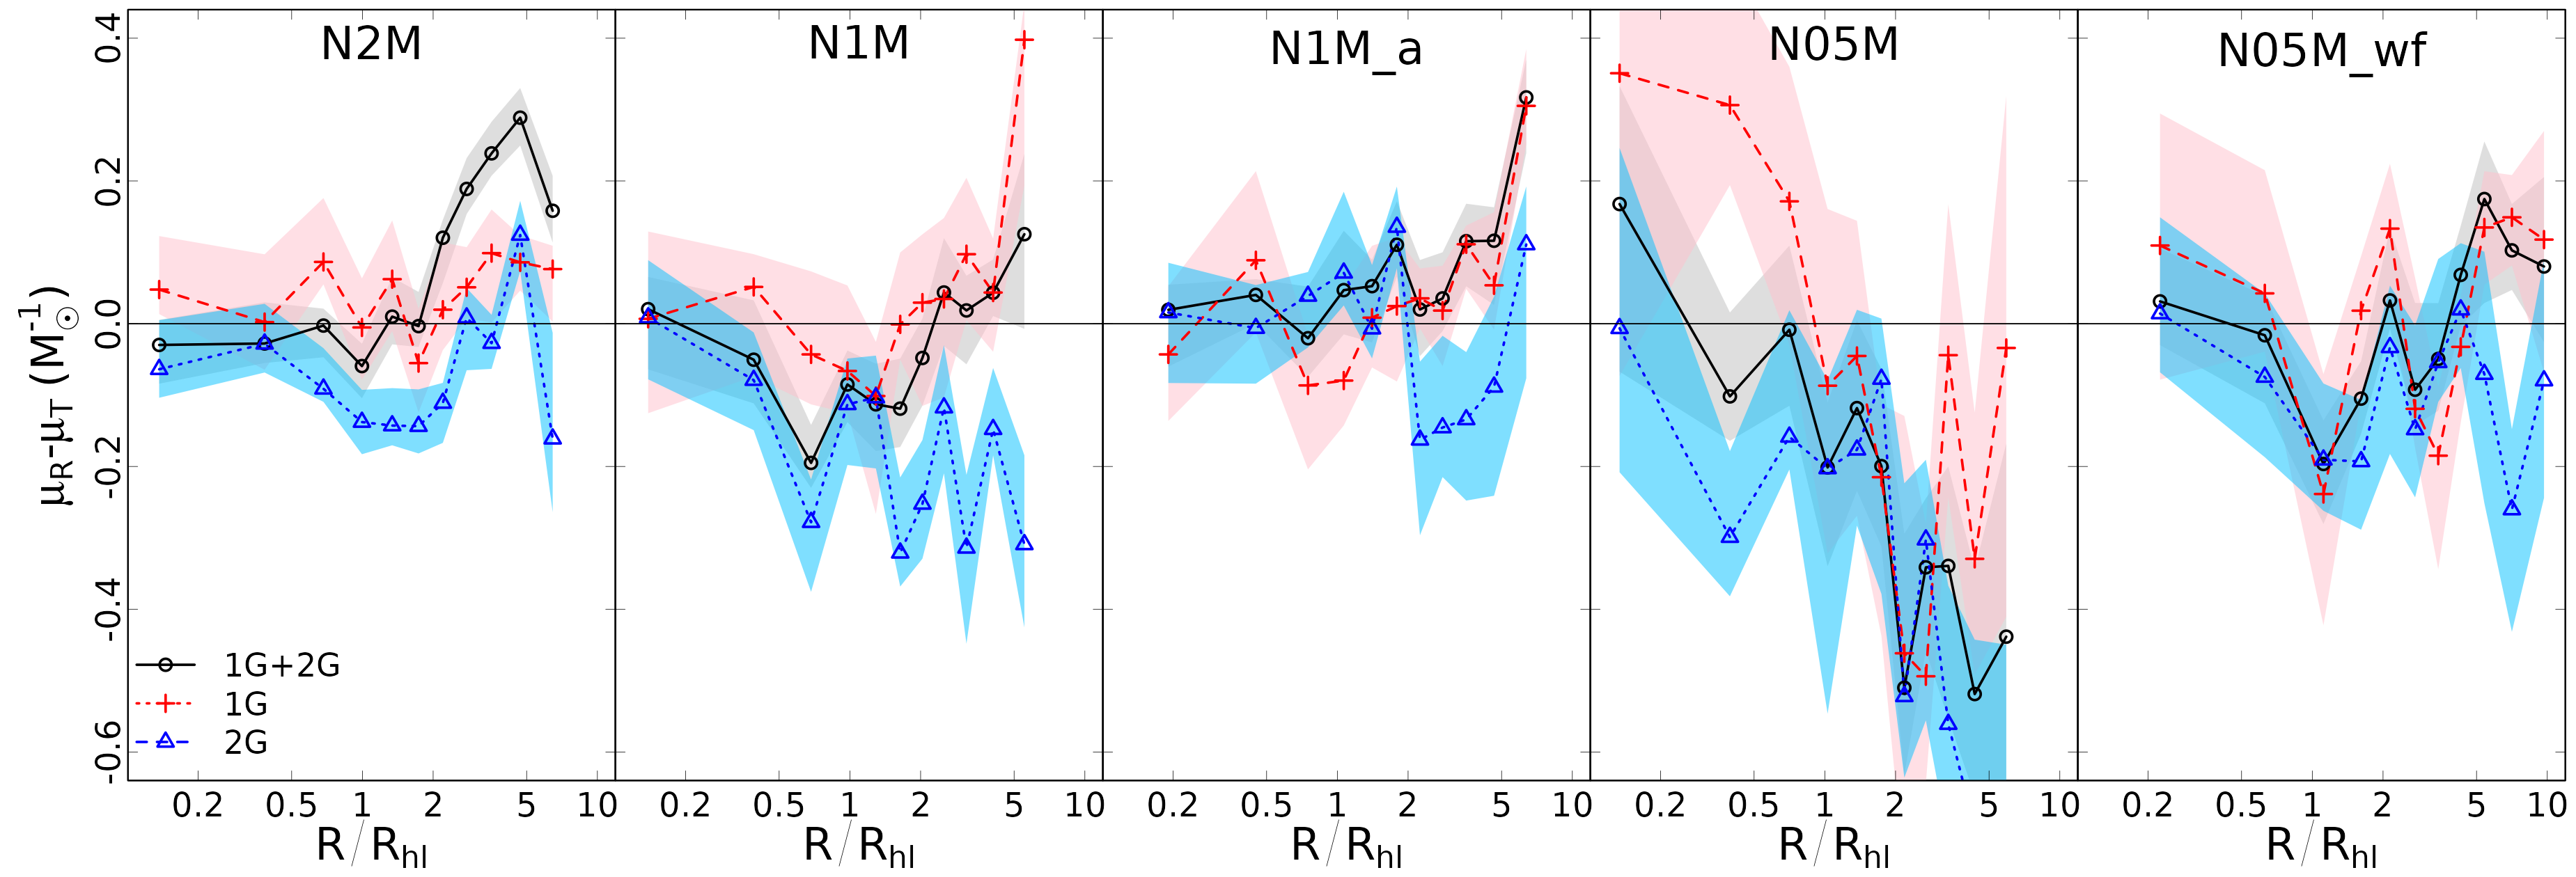
To further explore the differences between the radial and tangential equipartition for each population, we plot the radial profile of the difference in the inverse of the equipartition mass (), in Figure 12 in all of our models at 12 Gyr. This plot shows how, generally, the level of equipartition is "isotropic" in the inner regions, but can be characterized by significant differences between the radial and the tangential components at larger radii. The N05M model shows the most extreme differences between these two components.
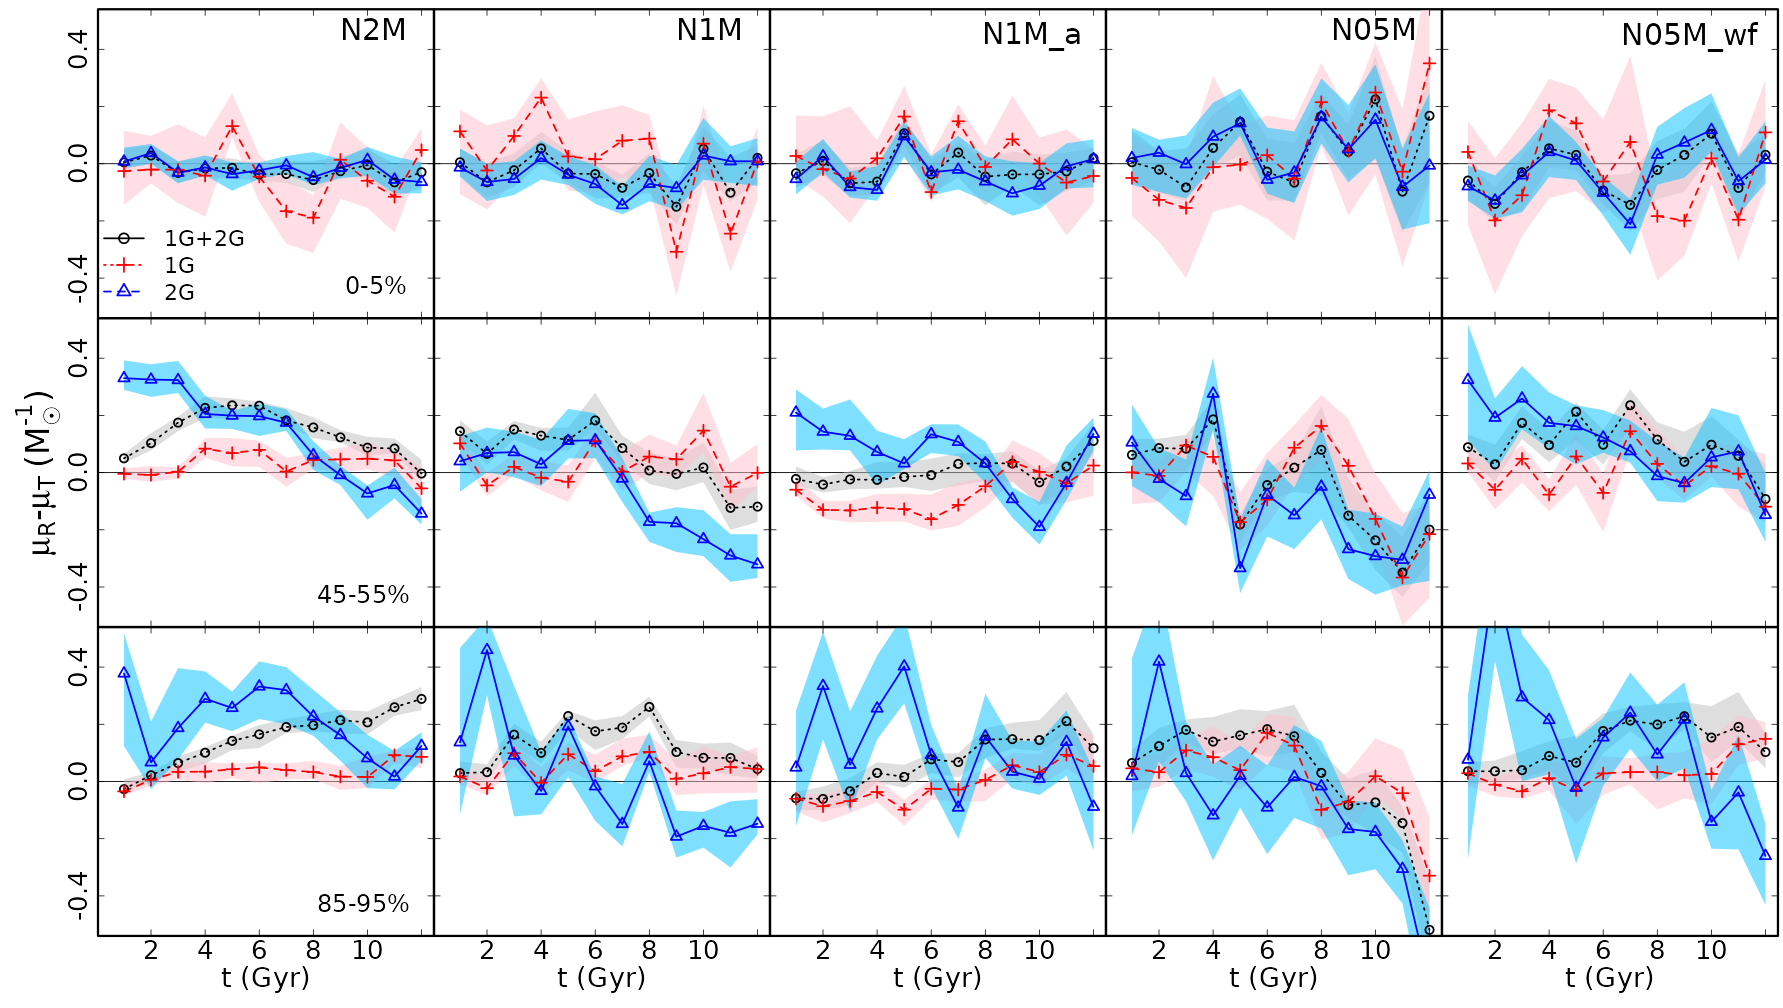
To shed light on the evolution of these differences, we plot the time evolution of and in multiple radial shells in all of our models in Figure 13. These plots show that the inner regions are not in general characterized by strong differences between these two components; in the intermediate and outer regions, during the early evolutionary phases the difference between the radial and the tangential components is positive (corresponding to a stronger degree of energy equipartition in the tangential velocity dispersion) but this difference decreses over time and becomes negative for clusters reaching a more advanced dynamical age. These differences are more significant in the 2G population than in the 1G population.
5 Conclusions
In this paper, we have studied the evolution towards energy equipartition in multiple-population clusters. Our investigation is based on a set of Monte Carlo simulations exploring the evolution of clusters with different initial number of stars, structural and kinematic properties. After a brief overview of the general spatial and kinematic properties of the two populations and the level of dynamical mixing reached after 12 Gyr of evolution (see Figures 1-5), we focused our attention on the characterization of the energy equipartition for 1G and 2G stars and on the implications of the initial differences between the 1G and 2G properties for their evolution towards energy equipartition. Our main conclusions are the following:
-
•
Evolution towards energy equipartition is more rapid for the 2G population, and 2G stars are, in general, characterized by a stronger degree of energy equipartition than 1G stars at 12 Gyr (it is interesting to note that a small difference between the degree of equipartition of 1G and 2G stars consistent with this trend was reported for Cen in Bellini et al. 2018). Even systems where the two populations are essentially spatially mixed at 12 Gyr may still be characterized by some differences between the 2G and 1G degree of energy equipartition (see the N05M model in Figures 2, 4, and 7).
-
•
We have calculated the degree of energy equipartition using the total velocity dispersion or the radial and tangential components of the velocity dispersion separately. The evolution towards energy equipartition is "anisotropic" and proceeds at different rates in the tangential and radial directions. The anisotropy in energy equipartition is more prominent in the 2G population and in the intermediate and outer regions of the cluster.
- •
-
•
During the early evolutionary phases and in the clusters’ outermost regions, the 2G population may develop negative values of the equipartition mass in the tangential component of the velocity dispersion; this corresponds to a trend between velocity dispersion and stellar mass that is in the opposite direction to that of clusters evolving towards energy equipartition. After these early phases, however, the 2G tangential component of the equipartition mass ultimately evolves more rapidly and further towards energy equipartition than the 1G population or the 2G radial component of the equipartition mass (see Figures 9, 10).
-
•
Differences in the degree of energy equipartition of the 1G and the 2G populations concurrent with a dependence of the degree of mixing on the stellar mass may lead to an apparent anomalous dependence of the tangential velocity dispersion on the stellar mass in the total (1G+2G) population (see Figure 8).
In future investigations, we will further extend the investigation presented here to consider a broader range of initial conditions (e.g. exploring different initial 1G and 2G relative concentrations and kinematics, initial 1G-to-2G mass ratios, primordial binary fraction and black hole retention fractions) and carry out a comprehensive study of the dependence of the evolution towards energy equipartition of the 1G and 2G populations on the clusters’ initial dynamical properties.
Acknowledgements
This research was supported in part by Lilly Endowment, Inc., through its support for the Indiana University Pervasive Technology Institute. AB and EV acknowledge support from STScI grants GO-15857 and AR-16157. MG, AH, and AA acknowledge support by the Polish National Science Centre (NCN) grant 2021/41/B/ST9/01191. AA acknowledges support for this research from project No. 2021/43/P/ST9/03167 co-funded by the Polish National Science Center (NCN) and the European Union Framework Programme for Research and Innovation Horizon 2020 under the Marie Skłodowska-Curie grant agreement No. 945339. For the purpose of Open Access, the authors have applied for a CC-BY public copyright license to any Author Accepted Manuscript (AAM) version arising from this submission. TZ acknowledges funding from the European Union’s Horizon 2020 research and innovation programme under the Marie Skłodowska-Curie Grant Agreement No. 101034319 and from the European Union – NextGenerationEU.
DATA AVAILABILITY STATEMENT
The data presented in this article may be shared on reasonable request to the corresponding author.
References
- Aros & Vesperini (2023) Aros F. I., Vesperini E., 2023, MNRAS, 525, 3136
- Bastian & Lardo (2018) Bastian N., Lardo C., 2018, ARA&A, 56, 83
- Bekki (2010) Bekki K., 2010, ApJ, 724, L99
- Bekki (2011) Bekki K., 2011, MNRAS, 412, 2241
- Bekki et al. (2017) Bekki K., Jeřábková T., Kroupa P., 2017, MNRAS, 471, 2242
- Bellini et al. (2009) Bellini A., Piotto G., Bedin L. R., King I. R., Anderson J., Milone A. P., Momany Y., 2009, A&A, 507, 1393
- Bellini et al. (2015) Bellini A., et al., 2015, ApJ, 810, L13
- Bellini et al. (2018) Bellini A., et al., 2018, ApJ, 853, 86
- Bianchini et al. (2016) Bianchini P., van de Ven G., Norris M. A., Schinnerer E., Varri A. L., 2016, MNRAS, 458, 3644
- Bianchini et al. (2018) Bianchini P., Webb J. J., Sills A., Vesperini E., 2018, MNRAS, 475, L96
- Binney & Tremaine (2008) Binney J., Tremaine S., 2008, Galactic Dynamics: Second Edition. Princeton University Press, Princeton, NJ USA
- Cadelano et al. (2024) Cadelano M., Dalessandro E., Vesperini E., 2024, A&A, 685, A158
- Calura et al. (2019) Calura F., D’Ercole A., Vesperini E., Vanzella E., Sollima A., 2019, MNRAS, 489, 3269
- Carretta et al. (2009a) Carretta E., et al., 2009a, A&A, 505, 117
- Carretta et al. (2009b) Carretta E., Bragaglia A., Gratton R., Lucatello S., 2009b, A&A, 505, 139
- Cordero et al. (2014) Cordero M. J., Pilachowski C. A., Johnson C. I., McDonald I., Zijlstra A. A., Simmerer J., 2014, ApJ, 780, 94
- Cordero et al. (2017) Cordero M. J., Hénault-Brunet V., Pilachowski C. A., Balbinot E., Johnson C. I., Varri A. L., 2017, MNRAS, 465, 3515
- Cordoni et al. (2020) Cordoni G., Milone A. P., Mastrobuono-Battisti A., Marino A. F., Lagioia E. P., Tailo M., Baumgardt H., Hilker M., 2020, ApJ, 889, 18
- Cordoni et al. (2024) Cordoni G., et al., 2024, arXiv e-prints, p. arXiv:2409.02330
- D’Ercole et al. (2008) D’Ercole A., Vesperini E., D’Antona F., McMillan S. L. W., Recchi S., 2008, MNRAS, 391, 825
- Dalessandro et al. (2014) Dalessandro E., et al., 2014, ApJ, 791, L4
- Dalessandro et al. (2019) Dalessandro E., et al., 2019, ApJ, 884, L24
- Dalessandro et al. (2024) Dalessandro E., et al., 2024, arXiv e-prints, p. arXiv:2409.03827
- Fregeau et al. (2004) Fregeau J. M., Cheung P., Portegies Zwart S. F., Rasio F. A., 2004, MNRAS, 352, 1
- Giersz et al. (2013) Giersz M., Heggie D. C., Hurley J. R., Hypki A., 2013, MNRAS, 431, 2184
- Gratton et al. (2012) Gratton R. G., Carretta E., Bragaglia A., 2012, A&ARv, 20, 50
- Gratton et al. (2019) Gratton R., Bragaglia A., Carretta E., D’Orazi V., Lucatello S., Sollima A., 2019, A&ARv, 27, 8
- Heggie & Hut (2003) Heggie D., Hut P., 2003, The Gravitational Million–Body Problem: A Multidisciplinary Approach to Star Cluster Dynamics. Cambridge University Press, doi:10.1017/CBO9781139164535
- Hénault-Brunet et al. (2015) Hénault-Brunet V., Gieles M., Agertz O., Read J. I., 2015, MNRAS, 450, 1164
- Hénon (1971) Hénon M. H., 1971, Ap&SS, 14, 151
- Hobbs et al. (2005) Hobbs G., Lorimer D. R., Lyne A. G., Kramer M., 2005, MNRAS, 360, 974
- Hurley et al. (2000) Hurley J. R., Pols O. R., Tout C. A., 2000, MNRAS, 315, 543
- Hurley et al. (2002) Hurley J. R., Tout C. A., Pols O. R., 2002, MNRAS, 329, 897
- Hypki & Giersz (2013) Hypki A., Giersz M., 2013, MNRAS, 429, 1221
- Hypki et al. (2022) Hypki A., Giersz M., Hong J., Leveque A., Askar A., Belloni D., Otulakowska-Hypka M., 2022, MNRAS, 517, 4768
- Hypki et al. (2024) Hypki A., Vesperini E., Giersz M., Hong J., Askar A., Otulakowska-Hypka M., Hellstrom L., Wiktorowicz G., 2024, arXiv e-prints, p. arXiv:2406.08059
- King (1966) King I. R., 1966, AJ, 71, 64
- Kroupa (2001) Kroupa P., 2001, MNRAS, 322, 231
- Lacchin et al. (2021) Lacchin E., Calura F., Vesperini E., 2021, MNRAS, 506, 5951
- Lacchin et al. (2022) Lacchin E., Calura F., Vesperini E., Mastrobuono-Battisti A., 2022, MNRAS, 517, 1171
- Lardo et al. (2011) Lardo C., Bellazzini M., Pancino E., Carretta E., Bragaglia A., Dalessandro E., 2011, A&A, 525, A114
- Leitinger et al. (2023) Leitinger E., Baumgardt H., Cabrera-Ziri I., Hilker M., Pancino E., 2023, MNRAS, 520, 1456
- Libralato et al. (2018) Libralato M., et al., 2018, ApJ, 861, 99
- Libralato et al. (2019) Libralato M., Bellini A., Piotto G., Nardiello D., van der Marel R. P., Anderson J., Bedin L. R., Vesperini E., 2019, ApJ, 873, 109
- Libralato et al. (2022) Libralato M., et al., 2022, ApJ, 934, 150
- Libralato et al. (2023) Libralato M., et al., 2023, ApJ, 944, 58
- Livernois et al. (2022) Livernois A. R., Vesperini E., Varri A. L., Hong J., Tiongco M., 2022, MNRAS, 512, 2584
- Marino et al. (2018) Marino A. F., et al., 2018, ApJ, 859, 81
- Marino et al. (2021) Marino A. F., et al., 2021, ApJ, 923, 22
- Mastrobuono-Battisti & Perets (2013) Mastrobuono-Battisti A., Perets H. B., 2013, ApJ, 779, 85
- Mastrobuono-Battisti & Perets (2016) Mastrobuono-Battisti A., Perets H. B., 2016, ApJ, 823, 61
- McKenzie et al. (2022) McKenzie M., et al., 2022, MNRAS, 516, 3515
- Mehta et al. (2024) Mehta V. J., et al., 2024, arXiv e-prints, p. arXiv:2406.02755
- Merritt (1985) Merritt D., 1985, AJ, 90, 1027
- Milone & Marino (2022) Milone A. P., Marino A. F., 2022, Universe, 8, 359
- Milone et al. (2012) Milone A. P., et al., 2012, ApJ, 744, 58
- Milone et al. (2017) Milone A. P., et al., 2017, MNRAS, 464, 3636
- Milone et al. (2018) Milone A. P., Marino A. F., Mastrobuono-Battisti A., Lagioia E. P., 2018, MNRAS, 479, 5005
- Nardiello et al. (2015) Nardiello D., Milone A. P., Piotto G., Marino A. F., Bellini A., Cassisi S., 2015, A&A, 573, A70
- Onorato et al. (2023) Onorato S., Cadelano M., Dalessandro E., Vesperini E., Lanzoni B., Mucciarelli A., 2023, A&A, 677, A8
- Osipkov (1979) Osipkov L. P., 1979, Soviet Astronomy Letters, 5, 42
- Pavlík & Vesperini (2021) Pavlík V., Vesperini E., 2021, MNRAS, 504, L12
- Pavlík & Vesperini (2022) Pavlík V., Vesperini E., 2022, MNRAS, 509, 3815
- Pavlík et al. (2024) Pavlík V., Heggie D. C., Varri A. L., Vesperini E., 2024, A&A, 689, A313
- Simioni et al. (2016) Simioni M., Milone A. P., Bedin L. R., Aparicio A., Piotto G., Vesperini E., Hong J., 2016, MNRAS, 463, 449
- Sollima (2021) Sollima A., 2021, MNRAS, 502, 1974
- Sollima et al. (2007) Sollima A., Ferraro F. R., Bellazzini M., Origlia L., Straniero O., Pancino E., 2007, ApJ, 654, 915
- Spitzer (1987) Spitzer L. S., 1987, Dynamical Evolution of Globular Clusters. Princeton University Press
- Tiongco et al. (2019) Tiongco M. A., Vesperini E., Varri A. L., 2019, MNRAS, 487, 5535
- Trenti & van der Marel (2013) Trenti M., van der Marel R., 2013, MNRAS, 435, 3272
- Vesperini et al. (2021) Vesperini E., Hong J., Giersz M., Hypki A., 2021, MNRAS, 502, 4290
- Vishniac (1978) Vishniac E. T., 1978, ApJ, 223, 986
- Watkins et al. (2022) Watkins L. L., van der Marel R. P., Libralato M., Bellini A., Anderson J., Alfaro-Cuello M., 2022, ApJ, 936, 154
- Webb & Vesperini (2017) Webb J. J., Vesperini E., 2017, MNRAS, 464, 1977
- Yaghoobi et al. (2022a) Yaghoobi A., Calura F., Rosdahl J., Haghi H., 2022a, MNRAS, 510, 4330
- Yaghoobi et al. (2022b) Yaghoobi A., Rosdahl J., Calura F., Khalaj P., Haghi H., 2022b, MNRAS, 517, 4175