STRUX: An LLM for Decision-Making with Structured Explanations
Abstract
Countless decisions shape our daily lives, and it is paramount to understand the how and why behind these choices. In this paper, we introduce a new LLM decision-making framework called STRUX, which enhances LLM decision-making by providing structured explanations. These include favorable and adverse facts related to the decision, along with their respective strengths. STRUX begins by distilling lengthy information into a concise table of key facts. It then employs a series of self-reflection steps to determine which of these facts are pivotal, categorizing them as either favorable or adverse in relation to a specific decision. Lastly, we fine-tune an LLM to identify and prioritize these key facts to optimize decision-making. STRUX has been evaluated on the challenging task of forecasting stock investment decisions based on earnings call transcripts and demonstrated superior performance against strong baselines. It enhances decision transparency by allowing users to understand the impact of different factors, representing a meaningful step towards practical decision-making with LLMs.
STRUX: An LLM for Decision-Making with Structured Explanations
Yiming Lu,1 Yebowen Hu,2 Hassan Foroosh,2 Wei Jin,1 Fei Liu1 1Emory University 2University of Central Florida {yiming.lu, wei.jin, fei.liu}@emory.edu {yebowen.hu, hassan.foroosh}@ucf.edu
1 Motivation
Decision-making is complex, as it requires the evaluation of various determinants that can influence outcomes Eigner and Händler (2024). This ability is crucial across multiple fields, ranging from healthcare, where decisions can determine patient health outcomes Lehman et al. (2022), to finance, where investment choices can impact financial stability Keith and Stent (2019); Liu et al. (2023). For LLMs to be effective, they must not only identify relevant facts but also weigh the favorable and unfavorable aspects to reach insightful conclusions. To date, it remains unclear whether LLMs can effectively balance multiple factors in complex scenarios to make rational decisions.
LLMs also produce lengthy, plain text explanations that can sometimes overwhelm users with too much information or ambiguity Vafa et al. (2021); Alkhamissi et al. (2023); Sharma et al. (2023); Ye et al. (2023); Wang et al. (2024). As we increasingly rely on those LLMs for critical decision-making, it is important to prioritize transparency and accountability Ludan et al. (2023). We propose structuring these explanations into a table format, where each fact is listed with a ‘strength level’ that measures its influence on the decision-making process. This approach not only facilitates review and modification of various facts by humans, but also enhances the transparency of the decisions made.
Further, a significant advantage of LLMs is their ability to reason through complex scenarios, which can enhance the decision-making processes (Shinn et al., 2023; Yao et al., 2023; Zeng et al., 2024; Band et al., 2024). Notably, DeLLMa Liu et al. (2024) uses classical decision theory to help LLMs make decisions under uncertainty. It infers a utility function through prompting and optimizes the expected utility using Monte Carlo estimation. Feng et al. (2024) calculate decision probabilities using a Bayesian model and present results on datasets such as Common2Sense (Singh et al., 2021) and PlaSma (Brahman et al., 2023). In contrast, our approach involves fine-tuning an LLM with domain-specific knowledge to ensure it prioritizes supporting facts accurately. Training instances are generated via a series of reflection steps, without relying on human annotations.
Our research explores the potential of using earnings call transcripts to forecast stock investment decisions Sawhney et al. (2020); Medya et al. (2022); Lopez-Lira and Tang (2023); Ni et al. (2024). Publicly traded companies in the U.S. are mandated by the Securities and Exchange Commission (SEC) to regularly report their financial performance, often through earnings calls. These calls include presentations from senior executives, such as the CEO and CFO, followed by a Q&A session with financial analysts. The objective is to reassure investors about the company’s management and strategy. With the rise of LLMs in financial services Zhu et al. (2021); Sang and Bao (2022); Cao et al. (2024); Reddy et al. (2024), analyzing earnings call transcripts to guide stock investment decisions presents a promising opportunity to test the effectiveness of LLM-assisted decision-making.
Our research contributions include: (a) we introduce STRUX, a novel framework designed to enhance the decision-making processes of LLMs. STRUX improves accuracy and transparency by meticulously constructing a fact table, analyzing these facts through a series of reflective steps, and fine-tuning the LLM to prioritize crucial information. (b) Our experiments demonstrate that STRUX surpasses strong baselines in forecasting stock investment decisions, proving its effectiveness. Its structured explanations further enhance decision transparency and represent a notable step towards practical decision-making with LLMs.111Our source code will be shared publicly upon acceptance.
2 The STRUX System
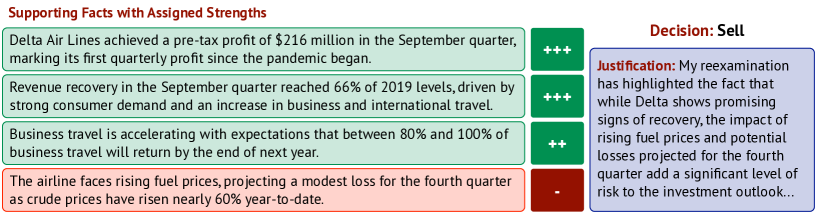
STRUX is tasked with predicting a company’s post-earnings stock trend to inform the investment decision. It is set to select the most relevant facts from a provided fact table, ensuring a balanced representation of positive and negative facts affecting the stock price. Each selected fact must then be evaluated for its potential impact on the stock’s price movement. A “+” symbol indicates a positive impact, with the number of symbols varying from one (+) to three (+++) showing the increasing strength. Conversely, a “-” symbol denotes a negative impact, with one (-) to three (—) symbols reflecting the severity of the negative influence.
Our system then combines and analyzes all the selected facts to forecast the direction of the stock price movement. The outcomes include: Strongly Buy (SB), Buy (B), Hold (H), Sell (S), or Strongly Sell (SS). It also provides a justification elaborating on its rationale, focusing on the key facts that influence this decision. As illustrated in Figure 1, our structured explanations consist of three components: {supporting facts, decision, and brief justification}. Supporting facts can be both favorable and adverse, along with their respective strengths.
2.1 Generating Structured Explanations Through Self-Reflection
We create a fact table from each company’s earnings call transcript to summarize key financial metrics, which are crucial for making informed investment decisions. Following Koa et al. (2024), we input executive speeches from either the Prepared Remarks or Q&A sessions into the LLM. Summaries are proportional in input length. Each speech from the Prepared Remarks is summarized into 3-5 key facts, while those from the Q&A session are condensed into 1-3 key facts. The fact table was generated using OpenAI’s gpt-4o-mini-2024-07-18; refer to the Appendix for the prompt. It distills essential information from a lengthy transcript, highlighting key aspects of a company’s financials Cho et al. (2021, 2022).
Reflection. We use a series of reflective steps to create training instances without requiring human annotations. This reflection was performed by GPT-4o-mini, aiming to help the model learn from its mistakes. When the model makes a poor investment decision, we notify it of the error and prompt it to identify any significant flaws in its fact selection, strength assignment, or reasoning processes. We also provide a list of previous incorrect decisions, including the reasons behind those decisions. Importantly, we ask the model to come up with a different decision from its previous ones without revealing the correct answer. This approach allows us to observe the model’s independent decision-making that emerges from reflection. Our prompt used for reflection can be found in the Appendix.
Demonstrations and Comparisons. Our ‘demonstrations’ data contains training instances where output has a correct decision post-reflection. We utilize this data to fine-tune Llama3, helping it prioritize relevant facts and make accurate decisions. The ‘comparisons’ data consists of paired outputs, and , where is the output with the correct decision, and is the prior model output in a series of reflections which has incorrect decision. These pairwise comparisons help train a reward model to favor outcomes that lead to correct decisions. Training instances that do not yield correct decisions after all reflections are excluded from demonstration or comparison data.
2.2 Fine-tuning LLMs for Decision-Making
STRUX+SFT. We start with the base LLM model, Llama3-8b-Instruct, and fine-tune it using our demonstrations data to develop the SFT model . Specifically, the input is a fact table created from an earnings call transcript, and the output includes structured explanations that contain {supporting facts, a decision, a brief justification}. As illustrated in Equation 1, the fine-tuning process aims to minimize the negative log-likelihood of the data. Here, represents the demonstrations provided by gpt-4o-mini-2024-07-18, each of which contains the correct decision.
| (1) |
STRUX+RL. In reinforcement learning, we start with a policy and fine-tune the policy using a reward function . We employ proximal policy optimization to optimize the expected reward. This process involves repeatedly choosing an instance from our training set, calculating the reward for the model’s response with the reward function, then updating model parameters towards maximizing the reward. Following Ziegler et al. (2020), we include a penalty to the reward to prevent from diverging too far from where the learned reward is valid; is set to 0.2 in our study.
The reward function is trained using ‘comparisons’ data. For every input , a response with the correct decision is paired with , corresponding to the incorrect response prior to a successful reflection. Below, represents the probability that is preferred over , denoted by . We implement the reward as a linear function of the final embedding from the SFT model, and use this reward model to guide the policy learning during RL.
| System | Recall | Prec | F1 | Accu. | |
|---|---|---|---|---|---|
| Llama3-8b (Fact Table) | 17.36 | 13.67 | 12.26 | 16.70 | |
| GPT-4o-mini (Full Trans) | 21.05 | 12.01 | 10.12 | 17.21 | |
| GPT-4o-mini (Fact Table) | 21.81 | 17.61 | 13.31 | 20.27 | |
| DeLLMa Liu et al. (2024) | 38.30 | 23.14 | 16.68 | 22.35 | |
| (Ours) STRUX+SFT | 19.15 | 15.55 | 16.54 | 23.34 | |
| (Ours) STRUX+RL | 23.03 | 19.34 | 19.80 | 25.55 |
| Frequent Paths Leading to Correct Decisions | Frequent Paths Leading to Incorrect Decisions | |||||
|---|---|---|---|---|---|---|
| BH (10.1%) | BHSSB (2.8%) | BHSBSH (2.9%) | BHSSBS (1.5%) | |||
| BHSB (9.0%) | BS (2.5%) | BSHSSH (2.1%) | BSHSSB (1.4%) | |||
| BHSBS (4.7%) | SBH (2.2%) | BHSBSB (2.0%) | SBHBSB (1.1%) | |||
3 Earnings Call Transcripts
Our dataset includes 11,950 quarterly earnings call transcripts from the Motley Fool website, collected by Hu et al. (2024), covering the period from 2017 to 2024. It contains transcripts from 869 companies listed on the NASDAQ 500 and S&P 500, with an average of 10,187 tokens per transcript. Due to resource limits, we construct a balanced training set with 100 transcripts from each of the 11 financial sectors. Our test set consists of 587 transcripts from 2024, carefully chosen to ensure they were not part of the LLM pretraining, which has a cutoff up to December 2023. Our study focuses on the textual information of these transcripts and excludes acoustic features. The ground-truth investment decisions are based on a stock’s performance 30 days post-earnings; they are categorized as Strongly Buy, Buy, Hold, Sell, or Strongly Sell.
| Total Number of Facts Per Transcript | 39.92 |
| Num of Supporting Facts Per Transcript | 9.11 |
| Num of Favorable Supporting Facts | 8.01 |
| Favorable Facts with Strengths 1 to 3 | 1.00 / 4.53 / 2.48 |
| Number of Adverse Supporting Facts | 1.10 |
| Adverse Facts with Strengths 1 to 3 | 0.58 / 0.29 / 0.23 |
4 Experimental Results
We evaluated our STRUX against strong baselines for forecasting stock investment decisions. This includes DeLLMa Liu et al. (2024), which incorporates uncertainty into LLM decision-making using classical decision theory and has been tested on tasks such as agriculture planning and finance. Additionally, we tested gpt-4o-mini-2024-07-18 and Llama3-8b-Instruct by providing either full transcripts or concise fact tables to elicit investment decisions; see Appendix for the prompt.
System Comparisons. Table 1 shows the macro-averaged precision, recall, F-scores, and accuracy for the test set. STRUX outperforms strong baselines in accuracy and F-scores for stock investment decisions. Our findings indicate that adding reinforcement learning (STRUX+RL) leads to stronger performance compared to using the SFT method alone. We also find that direct prompting methods, e.g., GPT-4o-mini with Fact Table, tend to produce overly positive outcomes, often failing to suggest Strong Sell or Sell decisions. This bias can be traced back to the optimistic financial descriptions by company executives, and without fine-tuning, it leads LLMs to display a bias toward bullish predictions. It is also worth mentioning that our test set has an imbalanced label distribution. A random baseline achieves an accuracy of 19.11%, and our STRUX+RL model shows a notable improvement, reaching an accuracy of 25.55%.222We observe that OpenAI’s o1-mini-2024-09-12, which generates a detailed internal thought process, only achieves a 16% accuracy on this task, possibly due to overthinking.
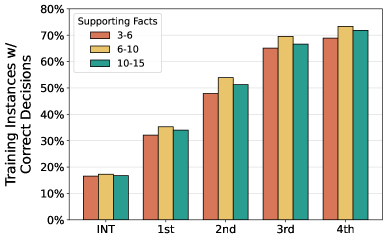
Supporting Facts. We analyzed the supporting facts identified by the model in cases of correct decisions after reflections. Statistics are presented in Table 3. Each transcript is distilled into a table of about 40 facts, from which the model selects 9. The selection is predominantly positive, with 8 positive and 1 negative fact; about half of the negative fact has an impact strength of 2–3. This indicates that adding expert knowledge on potential negative factors such as financial risks could make the fact tables more comprehensive. Figure 2 illustrates our experiment in which the model selects supporting facts from three ranges during self-reflection: 3-6, 6-10, and 10-15. We found that selecting 6-10 facts consistently yielded the highest performance.
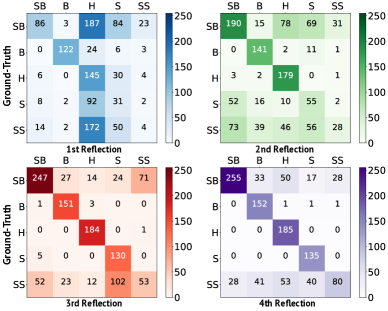
Decision Paths. STRUX performed 4 rounds of self-reflection, because there are 5 ground-truth decisions. Figure 3 presents the confusion matrices, with each round of reflection improving the model’s accuracy. The model initially favored ‘Hold’ as a conservative decision. After two rounds of reflection, it began to predict decisions more accurately. Ultimately, the errors arise from the model’s reluctance to recommend ‘Strong Sell’ likely due to the postive language in executive speeches.
Table 2 shows common decision paths during reflection. Interestingly, reflection can lead to abrupt decision changes, such as a direct jump from Buy to Strong Sell, instead of gradual shifts (e.g., Buy Hold Sell). Moreover, reflection does not always yield perfect outcomes; the model can repeat decisions from previous cycles despite being instructed not to. These observations suggest that guardrails for self-reflection may help stabilize the decision-making process and prevent radical changes.
5 Conclusion
STRUX marks a notable step in using LLMs for decision-making. It integrates structured explanations into the decision-making process through a series of reflective steps. STRUX not only leads to higher accuracy but also improves the transparency of LLM decisions, making it a valuable tool for complex decision-making scenarios.
6 Limitations
STRUX represents a significant advancement in using LLMs for decision-making, particularly in financial contexts. However, it’s crucial to refine its fact extraction capabilities, as inaccuracies in data selection can impact decision quality. Additionally, predicting stock movements is inherently complex and influenced by various external factors like data quality and market nuances. Users are advised to carefully consider these aspects to maximize STRUX’s effectiveness and accuracy in real-world applications. With ongoing enhancements, STRUX has the potential to revolutionize decision-making across diverse sectors.
References
- Alkhamissi et al. (2023) Badr Alkhamissi, Siddharth Verma, Ping Yu, Zhijing Jin, Asli Celikyilmaz, and Mona Diab. 2023. OPT-R: Exploring the role of explanations in finetuning and prompting for reasoning skills of large language models. In Proceedings of the 1st Workshop on Natural Language Reasoning and Structured Explanations (NLRSE), pages 128–138, Toronto, Canada. Association for Computational Linguistics.
- Band et al. (2024) Neil Band, Xuechen Li, Tengyu Ma, and Tatsunori Hashimoto. 2024. Linguistic calibration of long-form generations. Preprint, arXiv:2404.00474.
- Brahman et al. (2023) Faeze Brahman, Chandra Bhagavatula, Valentina Pyatkin, Jena D. Hwang, Xiang Lorraine Li, Hirona J. Arai, Soumya Sanyal, Keisuke Sakaguchi, Xiang Ren, and Yejin Choi. 2023. Plasma: Making small language models better procedural knowledge models for (counterfactual) planning. Preprint, arXiv:2305.19472.
- Cao et al. (2024) Yupeng Cao, Zhi Chen, Qingyun Pei, Fabrizio Dimino, Lorenzo Ausiello, Prashant Kumar, K. P. Subbalakshmi, and Papa Momar Ndiaye. 2024. Risklabs: Predicting financial risk using large language model based on multi-sources data. Preprint, arXiv:2404.07452.
- Cho et al. (2021) Sangwoo Cho, Franck Dernoncourt, Tim Ganter, Trung Bui, Nedim Lipka, Walter Chang, Hailin Jin, Jonathan Brandt, Hassan Foroosh, and Fei Liu. 2021. StreamHover: Livestream transcript summarization and annotation. In Proceedings of the 2021 Conference on Empirical Methods in Natural Language Processing, pages 6457–6474, Online and Punta Cana, Dominican Republic. Association for Computational Linguistics.
- Cho et al. (2022) Sangwoo Cho, Kaiqiang Song, Xiaoyang Wang, Fei Liu, and Dong Yu. 2022. Toward unifying text segmentation and long document summarization. In Proceedings of the 2022 Conference on Empirical Methods in Natural Language Processing, pages 106–118, Abu Dhabi, United Arab Emirates. Association for Computational Linguistics.
- Eigner and Händler (2024) Eva Eigner and Thorsten Händler. 2024. Determinants of llm-assisted decision-making. Preprint, arXiv:2402.17385.
- Feng et al. (2024) Yu Feng, Ben Zhou, Weidong Lin, and Dan Roth. 2024. Bird: A trustworthy bayesian inference framework for large language models. Preprint, arXiv:2404.12494.
- Hu et al. (2024) Yebowen Hu, Xiaoyang Wang, Wenlin Yao, Yiming Lu, Daoan Zhang, Hassan Foroosh, Dong Yu, and Fei Liu. 2024. Define: Enhancing llm decision-making with factor profiles and analogical reasoning. Preprint, arXiv:2410.01772.
- Keith and Stent (2019) Katherine Keith and Amanda Stent. 2019. Modeling financial analysts’ decision making via the pragmatics and semantics of earnings calls. In Proceedings of the 57th Annual Meeting of the Association for Computational Linguistics, pages 493–503, Florence, Italy. Association for Computational Linguistics.
- Koa et al. (2024) Kelvin J.L. Koa, Yunshan Ma, Ritchie Ng, and Tat-Seng Chua. 2024. Learning to generate explainable stock predictions using self-reflective large language models. In Proceedings of the ACM Web Conference 2024, volume 12706 of WWW ’24, page 4304–4315. ACM.
- Lehman et al. (2022) Eric Lehman, Vladislav Lialin, Katelyn Y. Legaspi, Anne Janelle R. Sy, Patricia Therese S. Pile, Nicole Rose I. Alberto, Richard Raymund R. Ragasa, Corinna Victoria M. Puyat, Isabelle Rose I. Alberto, Pia Gabrielle I. Alfonso, Marianne Taliño, Dana Moukheiber, Byron C. Wallace, Anna Rumshisky, Jenifer J. Liang, Preethi Raghavan, Leo Anthony Celi, and Peter Szolovits. 2022. Learning to ask like a physician. Preprint, arXiv:2206.02696.
- Liu et al. (2024) Ollie Liu, Deqing Fu, Dani Yogatama, and Willie Neiswanger. 2024. Dellma: A framework for decision making under uncertainty with large language models. Preprint, arXiv:2402.02392.
- Liu et al. (2023) Xiao-Yang Liu, Guoxuan Wang, Hongyang Yang, and Daochen Zha. 2023. Fingpt: Democratizing internet-scale data for financial large language models. Preprint, arXiv:2307.10485.
- Lopez-Lira and Tang (2023) Alejandro Lopez-Lira and Yuehua Tang. 2023. Can chatgpt forecast stock price movements? return predictability and large language models. Preprint, arXiv:2304.07619.
- Ludan et al. (2023) Josh Magnus Ludan, Yixuan Meng, Tai Nguyen, Saurabh Shah, Qing Lyu, Marianna Apidianaki, and Chris Callison-Burch. 2023. Explanation-based finetuning makes models more robust to spurious cues. In Proceedings of the 61st Annual Meeting of the Association for Computational Linguistics (Volume 1: Long Papers), pages 4420–4441, Toronto, Canada. Association for Computational Linguistics.
- Medya et al. (2022) Sourav Medya, Mohammad Rasoolinejad, Yang Yang, and Brian Uzzi. 2022. An exploratory study of stock price movements from earnings calls. Preprint, arXiv:2203.12460.
- Ni et al. (2024) Haowei Ni, Shuchen Meng, Xupeng Chen, Ziqing Zhao, Andi Chen, Panfeng Li, Shiyao Zhang, Qifu Yin, Yuanqing Wang, and Yuxi Chan. 2024. Harnessing earnings reports for stock predictions: A qlora-enhanced llm approach. Preprint, arXiv:2408.06634.
- Reddy et al. (2024) Varshini Reddy, Rik Koncel-Kedziorski, Viet Dac Lai, Michael Krumdick, Charles Lovering, and Chris Tanner. 2024. Docfinqa: A long-context financial reasoning dataset. Preprint, arXiv:2401.06915.
- Sang and Bao (2022) Yunxin Sang and Yang Bao. 2022. DialogueGAT: A graph attention network for financial risk prediction by modeling the dialogues in earnings conference calls. In Findings of the Association for Computational Linguistics: EMNLP 2022, pages 1623–1633, Abu Dhabi, United Arab Emirates. Association for Computational Linguistics.
- Sawhney et al. (2020) Ramit Sawhney, Piyush Khanna, Arshiya Aggarwal, Taru Jain, Puneet Mathur, and Rajiv Ratn Shah. 2020. VolTAGE: Volatility forecasting via text audio fusion with graph convolution networks for earnings calls. In Proceedings of the 2020 Conference on Empirical Methods in Natural Language Processing (EMNLP), pages 8001–8013, Online. Association for Computational Linguistics.
- Sharma et al. (2023) Mrinank Sharma, Meg Tong, Tomasz Korbak, David Duvenaud, Amanda Askell, Samuel R. Bowman, Newton Cheng, Esin Durmus, Zac Hatfield-Dodds, Scott R. Johnston, Shauna Kravec, Timothy Maxwell, Sam McCandlish, Kamal Ndousse, Oliver Rausch, Nicholas Schiefer, Da Yan, Miranda Zhang, and Ethan Perez. 2023. Towards understanding sycophancy in language models. Preprint, arXiv:2310.13548.
- Shinn et al. (2023) Noah Shinn, Federico Cassano, Edward Berman, Ashwin Gopinath, Karthik Narasimhan, and Shunyu Yao. 2023. Reflexion: Language agents with verbal reinforcement learning. Preprint, arXiv:2303.11366.
- Singh et al. (2021) Shikhar Singh, Nuan Wen, Yu Hou, Pegah Alipoormolabashi, Te-lin Wu, Xuezhe Ma, and Nanyun Peng. 2021. COM2SENSE: A commonsense reasoning benchmark with complementary sentences. In Findings of the Association for Computational Linguistics: ACL-IJCNLP 2021, pages 883–898, Online. Association for Computational Linguistics.
- Vafa et al. (2021) Keyon Vafa, Yuntian Deng, David Blei, and Alexander Rush. 2021. Rationales for sequential predictions. In Proceedings of the 2021 Conference on Empirical Methods in Natural Language Processing, pages 10314–10332, Online and Punta Cana, Dominican Republic. Association for Computational Linguistics.
- Wang et al. (2024) Yikun Wang, Rui Zheng, Haoming Li, Qi Zhang, Tao Gui, and Fei Liu. 2024. Rescue: Ranking LLM responses with partial ordering to improve response generation. In Proceedings of the 62nd Annual Meeting of the Association for Computational Linguistics (Volume 4: Student Research Workshop), pages 365–376, Bangkok, Thailand. Association for Computational Linguistics.
- Yao et al. (2023) Shunyu Yao, Dian Yu, Jeffrey Zhao, Izhak Shafran, Thomas L. Griffiths, Yuan Cao, and Karthik Narasimhan. 2023. Tree of thoughts: Deliberate problem solving with large language models. Preprint, arXiv:2305.10601.
- Ye et al. (2023) Xi Ye, Srinivasan Iyer, Asli Celikyilmaz, Veselin Stoyanov, Greg Durrett, and Ramakanth Pasunuru. 2023. Complementary explanations for effective in-context learning. In Findings of the Association for Computational Linguistics: ACL 2023, pages 4469–4484, Toronto, Canada. Association for Computational Linguistics.
- Zeng et al. (2024) Qingcheng Zeng, Mingyu Jin, Qinkai Yu, Zhenting Wang, Wenyue Hua, Zihao Zhou, Guangyan Sun, Yanda Meng, Shiqing Ma, Qifan Wang, Felix Juefei-Xu, Kaize Ding, Fan Yang, Ruixiang Tang, and Yongfeng Zhang. 2024. Uncertainty is fragile: Manipulating uncertainty in large language models. Preprint, arXiv:2407.11282.
- Zhu et al. (2021) Fengbin Zhu, Wenqiang Lei, Youcheng Huang, Chao Wang, Shuo Zhang, Jiancheng Lv, Fuli Feng, and Tat-Seng Chua. 2021. Tat-qa: A question answering benchmark on a hybrid of tabular and textual content in finance. Preprint, arXiv:2105.07624.
- Ziegler et al. (2020) Daniel M. Ziegler, Nisan Stiennon, Jeffrey Wu, Tom B. Brown, Alec Radford, Dario Amodei, Paul Christiano, and Geoffrey Irving. 2020. Fine-tuning language models from human preferences. Preprint, arXiv:1909.08593.
Appendix A Implementation Details
For STRUX+SFT, we fine-tune the system for three epochs with a learning rate of 1e-5, adjusted using a cosine scheduler. A warm-up ratio of 0.1 is set to ease the model into training, and we use the Adam optimizer configured with betas=(0.9, 0.999) and epsilon=1e-08. Our Reward Model (RM) also runs for three epochs, using a learning rate of 1e-4. It shares the same cosine scheduler and warm-up approach. For our STRUX+RL using Proximal Policy Optimization (PPO), the training lasts two epochs with the learning rate set to 1e-5.
Our summarizer is instructed to focus on significant details that could impact the stock price, including financial performance, future outlooks and guidance, strategic decisions, company direction, market trends, competitive positioning, etc. It also incorporates three historical financial metrics: earnings per share (EPS), revenue trends, and historical stock price, gathered from Alpha Advantage. These metrics are classified into three categories: ‘Bullish’ (indicating strong financial health), ‘Stable’ (showing steady metrics), and ‘Bearish’ (suggesting investor pessimism). We focus on speeches from company executives and omit input from organizers and analysts.