Satisfaction and violation of the fluctuation-dissipation relation in spin ice materials
Abstract
We test the fluctuation-dissipation relation (FDR) in spin ice materials Dy2Ti2O7 and Ho2Ti2O7 by measuring both the magnetic noise and the out-of-phase part of the susceptibility and comparing their ratio. We show that it is satisfied at temperatures well into the non-ergodic region below 600 mK, indicating local equilibrium. In both materials, below 400 mK, low frequency violations develop, showing an excess of noise as in spin glasses, with a frequency threshold of 0.1 Hz. New relaxation pathways and aging properties are unveiled in this frequency range in the ac susceptibility. The FDR remains valid at higher frequencies down to 150 mK.
At thermodynamic equilibrium, the fluctuation-dissipation theorem relates the spontaneous fluctuations in a system and the linear response function through the fluctuation-dissipation relation (FDR) [1]. When the system is not at equilibrium, deviations to the fluctuation-dissipation theorem are expected, and were indeed reported in the context of glasses and liquid crystals [2, 3, 4, 5]. A comprehensive theoretical description of the relation between fluctuations and dissipation in out-of-equilibrium systems nevertheless remains challenging [6].
In the specific context of magnetism, out-of-equilibrium properties have been mainly studied in spin-glasses [7], and more recently in superspin-glasses (assemblies of interacting nanoparticles) [8]. In these systems, simultaneous measurements of magnetic fluctuations and the response function have been performed to directly probe the fluctuation-dissipation relation (FDR). They show that these systems can be described by an effective temperature different from the thermal bath, and which quantifies the deviations from the equilibrium case. This was explained by describing the fluctuations (as well as the response function) through two contributions: the quasi-equilibrium one (or staggered) which respects time translation invariance, and the aging one which represents the fact that the response and correlation functions decay slowly with time. This hypothesis, corresponding to a weak ergodicity breakdown, can be understood by considering that the system needs an infinite time to reach its equilibrium state, but that locally its behavior is governed by equilibrium dynamics [9].
An interesting system where out-of-equilibrium properties are reported and which may break the fluctuation-dissipation relation is spin ice [10, 11]. The spin ice state was originally observed in pyrochlore oxide compounds O7, where the and ions lie on two interpenetrated corner sharing tetrahedron lattices, when Ho, Dy and is a non-magnetic element. It is characterized by the so-called “ice-rule”, which imposes two spins to point inwards and two spins to point outwards on each tetrahedron, and is stabilized experimentally below about 2 K. Contrary to spin-glass systems, spin ice is a macroscopically degenerate state, which is stabilized by geometrical frustration in the absence of structural disorder. Below 650 mK magnetization measurements show a clear bifurcation between the field-cooled and zero field-cooled curves [12, 13], which indicates an ergodicity breaking and suggests that the system enters into an out-of-equilibrium state. This freezing results from the strong slowing down of the dynamics at these temperatures, due to the rarefaction of the excitations in the system, the so-called magnetic monopoles [14] (which correspond to a violation of the local ice-rule, generating a “3-in 1-out” or “3-out 1-in” configuration in a tetrahedron). In addition, the system never reaches the predicted ordered ground state at very low temperature [15], even after months of waiting [16, 17].
In this letter, we address the nature of this low temperature state by probing the FDR in two spin ice systems Dy2Ti2O7 and Ho2Ti2O7. In both compounds, we identifiy three characteristic regions: (i) the “high temperature” region, where the system is trivially in equilibrium, and the FDR is obeyed, as expected. (ii) the intermediate region, where ergodicity breaking is observed in the magnetization, but where we find that the FDR remains obeyed indicating that local equilibrium is preserved. (iii) the “low temperature” region, where the FDR is violated at low frequency, typically below 0.1 Hz, indicating that the system enters an out-of-equilibrium state. Furthermore, we observe a dissipation process that was not reported to date, as well as aging effects.
The FDR in a magnetic system relates the spectral noise density to the dissipative part of the ac magnetic susceptibility . corresponds to the Fourier transformed autocorrelation function of the magnetization in the case of a stationary system (), and is characteristic of the spontaneous fluctuations. The relation is written [18]:
| (1) | |||
where is the temperature, the frequency, the Boltzmann constant and the sample volume.
To probe this relation, we have developed a SQUID magnetometer equipped with a dilution refrigerator, which allows us to measure the spectral noise density and the ac susceptibility of a zero field cooled sample in the same series of measurements in order to compare both unambiguously (See Supplementary material [19]). The experiments were carried out down to 150 mK and 163 mK respectively on two single crystals: a parallelepiped sample of 162Dy2Ti2O7 of mm3 (with zero Dy nuclear moment) [20, 16], and a nearly cylindrical Ho2Ti2O7 sample of 4.8 mm diameter and 8.9 mm length [19].
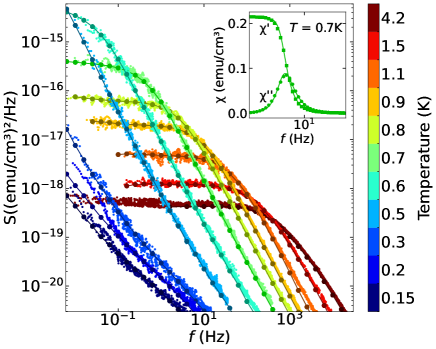
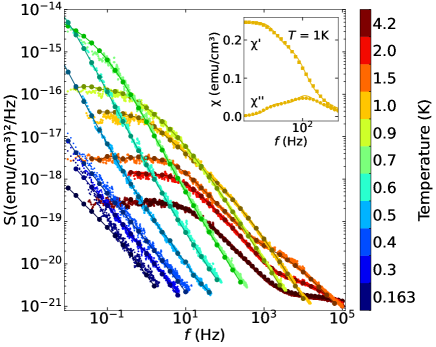
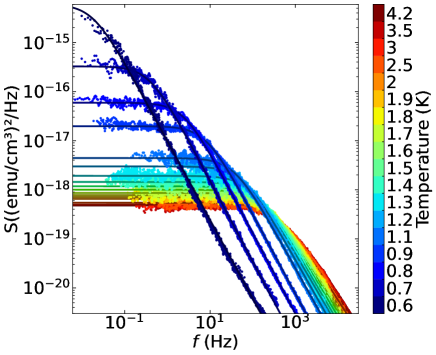
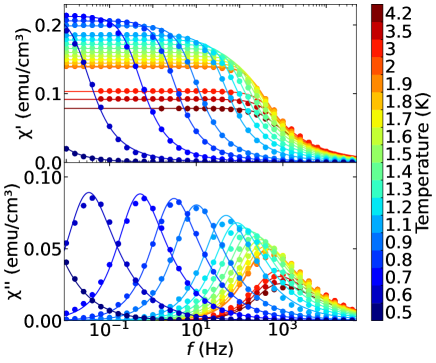
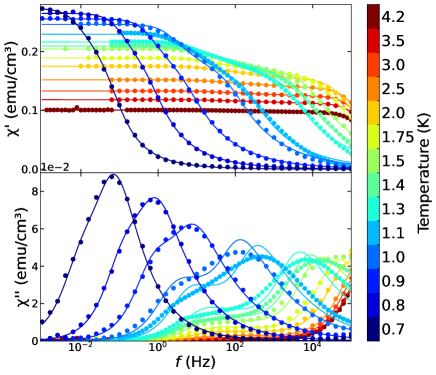
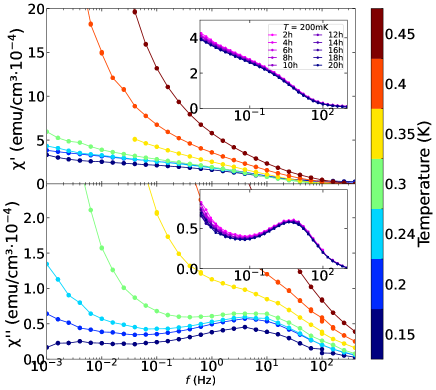
In Figure 1 and Figure 2, the spectral noise density is plotted together with for Dy2Ti2O7 and for Ho2Ti2O7 respectively. In Dy2Ti2O7, the shape of the noise is similar to previous reports [21, 22, 23]. In Ho2Ti2O7, the shape is slightly different with the presence of two shoulders down to 1 K, due the existence of two relaxation times in the system [24], which can be clearly seen in the ac susceptibility (see inset of Figure 2). Despite these differences, in both systems, and overlap down to 300 and 400 mK, in Dy2Ti2O7 and Ho2Ti2O7 respectively, thus well below the freezing temperature (650 mK) measured in magnetization measurements. This means that the FDR (Equation (1)) is obeyed even in the non-ergodic regime, and suggests that while the system fails to evolve towards its equilibrium state when lowering the temperature or applying a magnetic field, the local dynamics of the spin ice state behave as if the system was at equilibrium. This is in agreement with simulations on the dumbbell model of spin ice parameterised for Dy2Ti2O7 and using stochastic dynamics, which find that the FDR is obeyed down to mK, when the system is allowed to reach local equilibrium [10]. This contrasts however with the picture of spin ice behaving as a glass at low temperature [25, 17]. This implies that for all intents and purposes, down to these temperatures, the ac susceptibility and noise measurements are equivalent methods to probe the dynamics and correlation functions in the system. Nevertheless the ease and precision of ac susceptibility measurements make it the better tool.
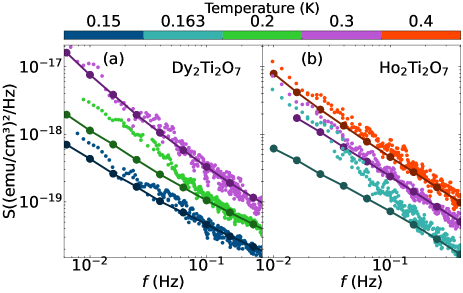
Below 300 mK for Dy2Ti2O7 and 400 mK for Ho2Ti2O7 deep in the non-ergodic regime, an excess noise is observed in compared to at the lowest measured frequencies, typically below 0.1 Hz (see Figure 3). The value of this excess noise is much larger than the noise measured at higher temperatures and in the empty sample holder experiment, which makes us confident that it is intrinsic to the physics of spin ice. The excess noise is associated with an abrupt increase of the slope in the low frequency regime while the dissipation part obtained from the susceptibility increases smoothly. The different behaviour between the fluctuation and the dissipation contributions indicate that the FDR is violated in this low temperature and low frequency regime for both Dy2Ti2O7 and Ho2Ti2O7. The amplitude of the violation is stronger in Ho2Ti2O7 where the fluctuation dissipation ratio, defined as reaches about 7 at 0.01 Hz and 163 mK. This excess can be parameterised by an effective temperature equal to the ratio times the temperature of the heat bath [9].
This scenario is characteristic of out-of-equilibrium systems where multiple time scales are present [26] and has been observed in spin-glasses [7]. In the high frequency regime, above the threshold of approximately 0.1 Hz the FDR is satisfied, indicating local equilibrium over short time and length scales. The breakdown of the FDR with high effective temperature indicates the onset of non-ergodicity over mesoscopic time and length scales. In Ho2Ti2O7 where the effect is stronger, a small temperature dependence is observed in the crossover frequency which moves from 0.05 to 0.16 Hz between 400 and 163 mK.
We have analysed the detailed functional form of and the ac susceptibility, , extracting the characteristic relaxation time and exponents and from expressions
| (2) | ||||
| (3) |
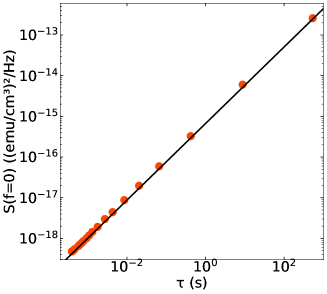
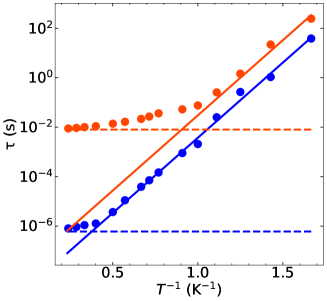
[21, 24]. is the noise at zero frequency, and are the adiabatic and isothermal susceptibilities respectively. As in previous experiments [27, 28, 29, 24, 22], we find (see Figure 4) that the time scale diverges below one Kelvin but clearly above the temperature scale on which FDT violations develop. Hence, while the divergence of is compatible with the loss of global ergodicity and the ZFC-FC splitting for the static susceptibility it does not appear to be relevant for the onset of FDR violations.
For Dy2Ti2O7, three dynamical regimes can clearly be observed from the temperature dependence of the parameter (or for the susceptibility) [22]. Above 2 K and at least up to 4.2 K, when the system is not yet in the spin ice state, is almost constant. It nevertheless remains below 2, the value for a random walk process, which would be expected for paramagnetic magnetic moments with a single relaxation time. When entering the spin ice regime, increases, reaching about 1.6, and revealing correlated, constrained dynamics [23]. When entering the freezing regime below 700 mK decreases once again reaching 1.3 at 300 mK (See Figure 4).
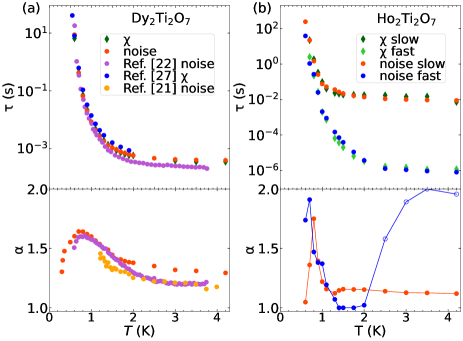
The analysis for Ho2Ti2O7 turns out to be less straightfoward due to the presence of two relaxation times [24]. Using the noise, as well as the in-phase and out-of-phase susceptibility we could determine the relaxation times and parameters (See Figure 4) by assuming a sum of two independent contributions following Equations (S1) for and (3) for . Compared to previous analysis with ac susceptibility only [24], the combination of the two sets of data allows us to deconvolute the contributions of the two relaxation times, especially at low frequency. We find that they have a similar temperature dependence, their relative intensity being almost constant as a function of temperature [19]. These two time scales are thus probably related to the existence of two single spin flip tunneling times resulting from the local spin configurations as proposed theoretically [30, 31]. Qualitatively, the relaxation times have a similar temperature dependence to those in Dy2Ti2O7: they have a nearly constant value above 2.5 K, which corresponds to the intrinsic tunnelling time and strongly increase at low temperature when entering the spin ice regime where slow monopole dynamics are present. The three regimes are also observed in the parameters, especially the drop at low temperature below 700 mK.
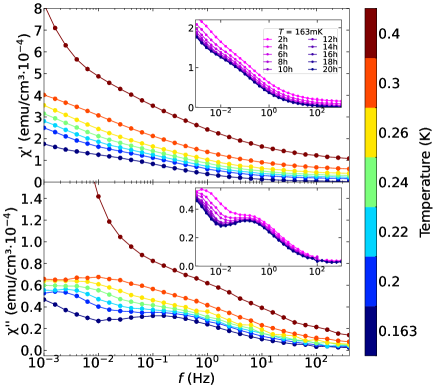
In order to better understand the FDR violation we have studied the ac susceptibility below 400 mK, where the signal is very small. Interestingly, our ac susceptibility data reveal a relaxation phenomenon which appears at very low temperature, and is different from previously identified processes [27, 28, 29, 24]. It manifests itself as two peaks in of very small amplitude, that we could observe thanks to a greatly improved sensitivity (See Figure 5). The peaks appear in both Dy2Ti2O7 and Ho2Ti2O7 samples, at slightly different frequencies [19]. They are not directly visible in the noise but when converting into using the FDR relation, the highest frequency peak, which sits in the frequency range where the relation is satisfied can just be resolved. However, the peak at the lowest frequency (below 0.1 Hz) is not visible, due to the presence of excess noise [19]. This low intensity signal shown in Figure 5 has faster characteristic times (typically a few seconds compared to a few hundreds of seconds for the processes described above) with little temperature dependence compared to the majority relaxation processes. It is thus clearly associated with a new relaxation mechanism, which appears masked at higher temperature, becoming visible only when the other relaxation channels are too slow. In addition to these relaxation processes, ac susceptibility exhibits aging precisely in the regime where the FDR breakdown occurs (See inset of Figure 5) in close analogy with spin glasses in the same regime [7].
The FDR violations and aging could be driven by the presence of non-contractable monopole pairs [10] which can drive the system out of equilibrium following rapid thermal quenches [32, 33, 34, 35], although in ideal conditions such pairs should not be long-lived at 300 mK [32, 10]. However, it is possible that the spin ice materials begin to become sensitive to the degeneracy lifting of the Pauling states induced by the dipole interactions [15, 36] in this temperature range. This finite energy bandwidth, which is a correction to the monopole picture of spin ice could lead to a rough free energy surface that drives FDR violations, as in spin-glasses [37]. These ideas could be tested but the investigation of aging effects in the experimentally observed temperature range would require challenging simulations using the full dipolar spin-ice Hamiltonian [17].
An important remark concerns the role of demagnetizing effects. Because of the ferromagnetic correlations in spin ice, corrections to the susceptibility due to demagnetizing effects can be very important [38, 28]. In particular for the ac susceptibility the corrections affect the shape and the position of the peak as a function of frequency. In the data shown in Figures 1 and 2, no demagnetizing corrections were performed on the susceptibility. It is clear from our data that if corrections were performed, the dissipation part of the FDR could not equal the fluctuation part, at least for temperatures above 600 mK where the real part of the ac susceptibility is sizable. This suggests that to obtain the “intrinsic” noise response, corrections should also be performed on the noise measurements. This is counter-intuitive because noise fluctuations are measured in an almost zero field environment (5 nT) [19] and is especially puzzling since the calculations performed to reproduce noise measurements were done with periodic boundary conditions and Ewald summation, which are supposed to give the “intrinsic” response [22, 23]. Further studies are thus necessary to understand in detail the role of demagnetization effects in noise measurements.
In summary, by measuring the FDR for Dy2Ti2O7 and Ho2Ti2O7 deep into the highly correlated spin ice regime we show that the FDR is satisfied in a large frequency range in both systems, including in the non-ergodic region below 650 mK. We have confirmed the existence of two distinct relaxation times in Ho2Ti2O7, which could be associated with the two tunnelling relaxation times proposed theoretically [31]. Below 300 mK and 400 mK in Dy2Ti2O7 and Ho2Ti2O7 respectively, a clear violation to the FDR develops, with an excess noise appearing below 0.1 Hz in both compounds, leading to a fluctuation-dissipation ratio larger than 1 at 0.01 Hz. Such a deviation can only be explained by the presence of several time scales in the system. This violation of the FDR may be the signature of the sensitivity of the system to the Pauli states bandwidth. It is observed in a regime where the ac susceptibility possesses some low intensity residual relaxation processes and presents aging properties. To further characterize these out-of-equilibrium processes and tune the density of monopoles in the low temperature state, an important step forward would be to probe the FDR after controlled quench protocols which is especially challenging for this kind of experiment. Our study also opens the way to new theoretical developments to understand the nature of the novel relaxation processes in this regime.
I Acknowledgments
This work was supported by ANR, France, Grants No. ANR-15-CE30-0004 and No. ANR-19-CE30-0040. F. Morineau acknowledges financial support from the LANEF PhD Program.
We strongly acknowledge Grégory Garde, Anne Gerardin, Gilles Pont and Olivier Tissot for their technical support in the development of the noise magnetometer.
We acknowledge Ludovic Berthier, Claudio Castelnovo, Bruno Tomasello and Mike Zhitomirsky for helpful discussion.
The crystal growth of Ho2Ti2O7 was performed by using facilities of the Materials Design and Characterization Laboratory in the Institute for Solid State Physics, the University of Tokyo under the Visiting Researcher’s Program. The crystal growth of Dy2Ti2O7 was carried out at the University of Warwick, UK, and the work was funded by EPSRC, UK through Grant EP/T005963.
References
- Kubo [1966] R. Kubo, The fluctuation-dissipation theorem, Rep. Prog. Phys. 29, 255 (1966).
- Grigera and Israeloff [1999] T. S. Grigera and N. E. Israeloff, Observation of fluctuation-dissipation-theorem violations in a structural glass, Phys. Rev. Lett. 83, 5038 (1999).
- L. Bellon and Laroche [2001] S. C. L. Bellon and C. Laroche, Violation of the fluctuation-dissipation relation during the formation of a colloidal glass, Eur. Phys. Lett. 53, 511 (2001).
- Joubaud et al. [1009] S. Joubaud, B. Percier, A. Petrosyan, and S. Ciliberto, Aging and effective temperatures near a critical point, Phys. Rev. Lett. 102, 130601 (1009).
- Oukris and Israeloff [2010] H. Oukris and N. E. Israeloff, Nanoscale non-equilibrium dynamics and the fluctuation–dissipation relation in an ageing polymer glass, Nature Phys. 6, 135 (2010).
- Sarracino and Vulpiani [2019] A. Sarracino and A. Vulpiani, On the fluctuation-dissipation relation in non-equilibrium and non-hamiltonian systems, Chaos 29, 083132 (2019).
- Hérisson and Ocio [2002] D. Hérisson and M. Ocio, Fluctuation-dissipation ratio of a spin glass in the aging regime, Phys. Rev. Lett. 88, 257202 (2002).
- Komatsu et al. [2011] K. Komatsu, D. L’Hôte, S. Nakamae, V. Mosser, M. Konczykowski, E. Dubois, V. Dupuis, and R. Perzynski, Experimental evidence for violation of the fluctuation-dissipation theorem in a superspin glass, Phys. Rev. Lett. 106, 150603 (2011).
- Cugliandolo [2011] L. F. Cugliandolo, The effective temperature, J. Phys. A: Math. Theor. 44, 483001 (2011).
- Raban et al. [2022] V. Raban, L. Berthier, and P. C. W. Holdsworth, Violation of the fluctuation-dissipation theorem and effective temperatures in spin ice, Phys. Rev. B 105, 134431 (2022).
- Udagawa and Jaubert [2021] M. Udagawa and L. D. C. Jaubert, eds., Spin Ice, Springer Series in Solid-State Sciences (Springer Cham, 2021).
- Snyder et al. [2004] J. Snyder, B. Ueland, J. Slusky, H. Karunadasa, R. Cava, and P. Schiffer, Low-temperature spin freezing in the Dy2Ti2O7 spin ice, Phys. Rev. B 69, 064414 (2004).
- Petrenko et al. [2011] O. A. Petrenko, M. R. Lees, and G. Balakrishnan, Titanium pyrochlore magnets: how much can be learned from magnetization measurements?, J. Phys.: Condens. Matter 23, 164218 (2011).
- Castelnovo et al. [2008] C. Castelnovo, R. Moessner, and S. L. Sondhi, Magnetic monopoles in spin ice, Nature 451, 42 (2008).
- Melko and Gingras [2004] R. G. Melko and M. J. P. Gingras, Monte carlo studies of the dipolar spin ice model, J. Phys.: Condens. Matter 16, R1277 (2004).
- Giblin et al. [2018] S. R. Giblin, M. Twengström, L. Bovo, M. Ruminy, M. Bartkowiak, P. Manuel, J. C. Andresen, D. Prabhakaran, G. Balakrishnan, E. Pomjakushina, C. Paulsen, E. Lhotel, L. Keller, M. Frontzek, S. Capelli, O. Zaharko, P. A. McClarty, S. T. Bramwell, P. Henelius, and T. Fennell, Pauling entropy, metastability, and equilibrium in Dy2Ti2O7 spin ice, Phys. Rev. Lett. 121, 067202 (2018).
- Samarakoon et al. [2022a] A. M. Samarakoon, A. Sokolowski, B. Klemke, R. Feyerherm, M. Meissner, R. A. Borzi, F. Ye, Q. Zhang, Z. Dun, H. Zhou, T. Egami, J. N. Hallén, L. Jaubert, C. Castelnovo, R. Moessner, S. A. Grigera, and D. A. Tennant, Structural magnetic glassiness in the spin ice Dy2Ti2O7, Phys. Rev. Research 4, 033159 (2022a).
- Réfrégier et al. [1987] P. Réfrégier, M. Ocio, and H. Bouchiat, Equilibrium magnetic fluctuations in spin glasses: Temperature dependence and deviations from 1/f behaviour, Eur. Phys. Lett. 3, 503 (1987).
- [19] See suplemental material, which includes (i) a description of the experimental set-up and samples, (ii) additional notes on the noise and ac susceptibility analysis. It contains Refs. [20, 16].
- Fennell et al. [2004] T. Fennell, O. A. Petrenko, B. Fåk, S. T. Bramwell, M. Enjalran, T. Yavors’kii, M. J. P. Gingras, R. G. Melko, and G. Balakrishnan, Neutron scattering investigation of the spin ice state in Dy2Ti2O7, Phys. Rev. B 70, 134408 (2004).
- Dusad et al. [2019] R. Dusad, F. K. K. Kirschner, J. C. Hoke, B. R. Roberts, A. Eyal, F. Flicker, G. M. Luke, S. J. Blundell, and J. C. S. Davis, Magnetic monopole noise, Nature 571, 234 (2019).
- Samarakoon et al. [2022b] A. M. Samarakoon, S. A. Grigera, D. A. Tennant, A. Kirste, B. Klemke, P. Strehlow, M. Meissner, J. N. Hallén, L. Jaubert, C. Castelnovo, and R. Moessner, Anomalous magnetic noise in an imperfectly flat landscape in the topological magnet Dy2Ti2O7, Proc. Natl. Acad. Sci. U.S.A. 119, e2117453119 (2022b).
- Hallén et al. [2022] J. N. Hallén, S. A. Grigera, D. A. Tennant, C. Castelnovo, and R. Moessner, Dynamical fractal and anomalous noise in a clean magnetic crystal, Science 378, 1218 (2022).
- Wang et al. [2021] Y. Wang, T. Reeder, Y. Karaki, J. Kindervater, T. Halloran, N. Maliszewskyj, Y. Qiu, J. A. Rodriguez, S. Gladchenko, S. M. Koohpayeh, S. Nakatsuji, and C. Broholm, Monopolar and dipolar relaxation in spin ice Ho2Ti2O7, Sci. Adv. 7, eabg0908 (2021).
- Eyvazov et al. [2018] A. B. Eyvazov, R. Dusad, T. J. S. Munsie, H. A. Dabkowska, G. M. Luke, E. R. Kassner, J. C. S. Davis, and A. Eya, Common glass-forming spin-liquid state in the pyrochlore magnets Dy2Ti2O7 and Ho2Ti2O7, Phys. Rev. B 98, 214430 (2018).
- Cugliandolo et al. [1997] L. F. Cugliandolo, J. Kurchan, and L. Peliti, Energy flow, partial equilibration, and effective temperatures in systems with slow dynamics, Phys. Rev. E 55, 3898 (1997).
- Matsuhira et al. [2011] K. Matsuhira, C. Paulsen, E. Lhotel, C. Sekine, Z. Hiroi, and S. Takagi, Spin dynamics at very low temperature in spin ice Dy2Ti2O7, J. Phys. Soc. Jap. 80, 123711 (2011).
- Quilliam et al. [2011] J. A. Quilliam, L. R. Yaraskavitch, H. A. Dabkowska, B. D. Gaulin, and J. B. Kycia, Dynamics of the magnetic susceptibility deep in the coulomb phase of the dipolar spin ice material Ho2Ti2O7, Phys. Rev. B 83, 094424 (2011).
- Yaraskavitch et al. [2012] L. R. Yaraskavitch, H. M. Revell, S. Meng, K. A. Ross, H. M. L. Noad, H. A. Dabkowska, B. D. Gaulin, and J. B. Kycia, Spin dynamics in the frozen state of the dipolar spin ice material Dy2Ti2O7, Phys. Rev. B 85, 020410 (2012).
- Tomasello et al. [2015] B. Tomasello, C. Castelnovo, R. Moessner, and J. Quintanilla, Single-ion anisotropy and magnetic field response in the spin-ice materials Ho2Ti2O7 and Dy2Ti2O7, Phys. Rev. B 92, 155120 (2015).
- Tomasello et al. [2019] B. Tomasello, C. Castelnovo, R. Moessner, and J. Quintanilla, Correlated quantum tunneling of monopoles in spin ice, Phys. Rev. Lett. 123, 067204 (2019).
- Castelnovo et al. [2010] C. Castelnovo, R. Moessner, and S. L. Sondhi, Thermal quenches in spin ice, Phys. Rev. Lett. 104, 107201 (2010).
- Paulsen et al. [2014] C. Paulsen, M. J. Jackson, E. Lhotel, B. Canals, D. Prabhakaran, K. Matsuhira, S. Giblin, and S. Bramwell, Far-from-equilibrium monopole dynamics in spin ice, Nature Phys. 10, 135 (2014).
- Paulsen et al. [2016] C. Paulsen, S. R. Giblin, E. Lhotel, D. Prabhakaran, G. Balakrishnan, K. Matsuhira, and S. T. Bramwell, Experimental signature of the attractive coulomb force between positive and negative magnetic monopoles in spin ice, Nature Phys. 12, 661 (2016).
- Paulsen et al. [2019] C. Paulsen, S. Giblin, E. Lhotel, D. Prabhakaran, K. Matsuhira, G. Balakrishnan, and S. Bramwell, Nuclear spin assisted quantum tunnelling of magnetic monopoles in spin ice, Nature Commun. 10, 1509 (2019).
- Isakov et al. [2005] S. V. Isakov, R. Moessner, and S. L. Sondhi, Why spin ice obeys the ice rules, Phys. Rev. Lett. 95, 217201 (2005).
- Bouchaud et al. [1998] J.-P. Bouchaud, L. F. Cugliandolo, J. Kurchan, and M. Mezard, Out of equilibrium dynamics in spin-glasses and other glassy systems, Spin glasses and random fields , 161 (1998).
- Bovo et al. [2013] L. Bovo, L. D. C. Jaubert, P. C. W. Holdsworth, and S. T. Bramwell, Crystal shape-dependent magnetic susceptibility and curie law crossover in the spin ices Dy2Ti2O7 and Ho2Ti2O7, J. Phys.: Condens. Matter 25, 386002 (2013).
Supplemental Information :
Satisfaction and violation of the fluctuation-dissipation relation in spin ice materials
II Methods
II.1 Noise and AC-susceptibility SQUID magnetometer
The SQUID magnetometer setup was designed to measure both weak spontaneous noise signals and low-field ac-susceptibility in the same experimental environment. It ensures a minimal external residual magnetic flux in the sample area through the use of several layers of magnetic shielding. Outside the cryostat at room temperature two -metal shields are used, and inside the helium bath, three Cryophy® (a Ni-Fe-Mo alloy treated for low temperature performance) shields are inserted leading to a residual magnetic field of the order 50 nT in the bath.
A miniature dilution refrigerator of the dip-stick variety carrying the probe is inserted into this environment. The probe itself is shielded by a Niobium superconducting shield, and consists of a superconducting pick-up coil wrapped around a cylindrical single crystal silicon sample holder attached to the mixing chamber, which ensures a good thermal contact and a low magnetic noise contribution. If an external field is present in the sample environment, a dc Magnetization vs Temperature (MvsT) response will be measurable. The greater the external field the greater the MvsT response, which will be a source of spurious low frequency noise if the temperature is not perfectly stable. Thus in order to further reduce the residual magnetic field a dc coil was wrapped around the Niobium shield for additional field cancelation. Before the start of an experimental run, measurements of M vs T in the residual field were made. Then by heating the shield above its superconducting critical point with a small field in the dc coil, and then cooling the shield, the residual field could be reduced. By repeating the procedure the field could be adjusted so that the MvsT response of the sample was nearly zero. The final fields were typically less than 5 nT in the sample area.
The pick-up coil is a first order superconducting gradiometer composed of two coils wrapped in opposite directions, with the sample positioned in the center of one of the coils. This gradiometer allows us to measure the magnetic flux contribution from the sample via magnetic induction while canceling out first-order residual magnetic flux. The gradiometer is connected via mutual induction to the input coil of a Magnicon SQUID with a SQUID array preamplifier, which acts as a very low noise amplifier, measuring spontaneous magnetic fluctuations down to 1.6 . The SQUID is thermalized at liquid helium temperature, ensuring that its setup point remains stable throughout the entire measurement.
Inside the sample environment, two excitation coils in a series are wrapped to apply small ac magnetic fields (typically 50 Oe peak to peak) to the sample. The sample response is then detected by the pick-up coil and processed with an SR830 Lock-in Amplifier, giving the ac susceptibility , where is the in-phase response and the out-of-phase response of the sample. When the sample is cooled down to low temperature (typically under 500 mK), the ac susceptibility signal becomes really weak. It is thus necessary to use an adjustable current divider put between the two excitation coils to minimize any offset in in order to reach the required sensitivity. Ac susceptibility is measured for each temperature from 0.001 Hz to 105 Hz.
The noise power spectral density (PSD) is acquired by performing a Fast Fourier Transform (FFT) on the temporal spontaneous noise signal using an HP-35655A spectrum analyzer. Several frequency spans are measured sequentially to cover the entire measurable frequency range (0.002 Hz to 105 Hz). For each temperature, at least three measurements are averaged to improve the statistical accuracy and reduce the standard deviation of the measured noise.
II.2 Calibration
A calibration of the magnetometer was made by measuring the ac susceptibility of Pb spheres resulting in a calibration factor , expressed in emu. However the calibration factor is sensitive to the sample position when it is not perfectly centered in the lower detection coil. In addition, when the sample size is comparable to or greater than the geometry of the pick-up coil, the effective measured volume of the sample is smaller than the actual sample volume which in turn affects the calibration.
In order to alleviate these problems, a scaling of the ac susceptibility (for each sample) measured in the set-up described above (in ) was made to that measured (for each sample) in a homemade SQUID magnetometer. This magnetometer can operate down to 70 mK and makes measurements by the extraction method giving absolute values of the magnetization or susceptibility in emu. The scaling was typically made at 4.2 K and 800 mK in order to have a robust real and imaginary susceptibility. A scaling factor , expressed in emu, is obtained and is typically close to .
The noise (in Hz) is then scaled using the same factor with the following expression , with the sample volume. The calibration is checked using the fluctuation-dissipation relation in the thermodynamic equilibrium regime from 4.2 K to 700 mK. For small samples we found that the relation is obeyed with no free parameters over the entire span. However for large samples a mismatch between and was observed, and was corrected with an additional factor, which accounts for the effective volume of sample measured. For the Ho2Ti2O7 sample, this factor is 2 (the sample is large compared to the coils size) and for the Dy2Ti2O7 sample, this factor is around 2.5 (the sample is larger than the Ho2Ti2O7 one). The two factors, and , are fixed for a given measurement series but need slight adjustments for each new measurement campaign since they depend on the position of the sample within the pick-up coil system.
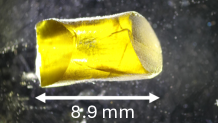
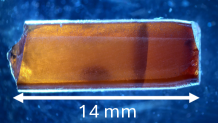
The two samples are shown on Figure S1. The Ho2Ti2O7 sample (left) was prepared at the ISSP Tokyo by the floating-zone method using an infrared furnace equipped with four halogen lamps and elliptical mirrors. The crystals were grown under O2 gas flow to avoid oxygen deficiency. The typical growth rate was 4 mm.h?1. The Dy2Ti2O7 sample (right) was grown in Warwick, and was already measured in Refs. 20, 16.
III Noise and ac susceptibility analysis
III.1 Noise
Before analyzing the noise curves, the background noise PSD and harmonics peaks resulting from external perturbations (such as turbopump rotation at 3 kHz) are removed from the measured data.
The Dy2Ti2O7 magnetization noise spectra are fitted using a least square cost function to the following empirical equation (Figure S2) :
| (S1) |
Three free parameters are extracted from the fit: the noise at zero frequency (corresponding to the noise value on the plateau), the characteristic relaxation time of the system, and the power law exponent .
The dependence of on (see Figure S3) is almost linear, but is much better fitted with a power law with a 0.94 exponent, indicating deviations to the linear behavior predicted for a simple generation-recombination phenomenon.
For the Ho2Ti2O7 noise spectra, two distinct relaxation times are noticeable. They are thus fitted with two sets of three free parameters, leading to the sum of two functions and as follows (Figure S4) :
| (S2) |
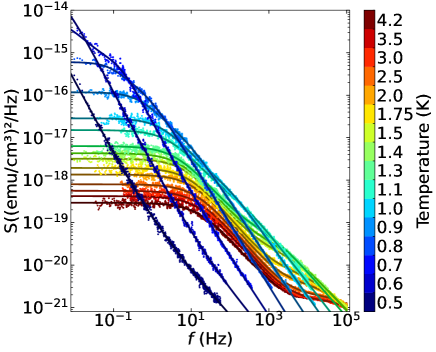
The two relaxation times in Ho2Ti2O7 have a similar temperature dependence on the whole temperature range (see Figure S5). They seem to correspond to two well separated tunneling processes which have a different single spin flip tunneling time depending on the local spin configurations with a similar activation energy.
III.2 Ac susceptibility
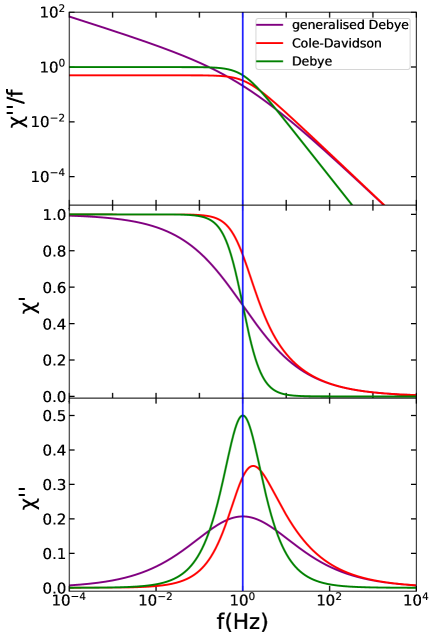
Different empirical response functions are used to fit ac susceptibility measurements. The most straightforward response function one can use is introduced in the Debye model (Figure S6, green curves):
| (S3) |
This expression describes phenomena that relax with a single time scale. However spin ice is a strongly correlated state in which this picture of a single characteristic time scale is insufficient. In this case, it is necessary to introduce a distribution of relaxation times with a characteristic time scale .
A model with a symmetric distribution can be obtained by introducing a new exponent parameter , giving the generalized Debye model (Figure S6, purple curves):
| (S4) |
Another empirical model, the Cole-Davidson model (Figure S6, red curves) possesses an asymmetric distribution and is expressed as:
| (S5) |
For the generalized Debye model, varying the exponent from 1 to 0 broadens the distribution symmetrically around the value. It introduces a factor in the numerator of the expression, resulting in a finite slope behavior at low frequency when considering the noise analog (see top panel, Figure S6). This is incompatible with our noise measurements, which show a flat “white noise” behavior in the low frequency limit. For the Cole-Davidson model, varying from 1 to 0 results in a strong asymmetric broadening for time scales shorter than due to a cutoff in the distribution of relaxation times. This cutoff results in a flat shape at low frequencies of the associated noise, which accords with the noise measurements.
Due to this constraint from the noise behavior, the Cole-Davidson model is chosen for the fitting procedure of the ac susceptibility curves. It is interesting to notice that the Cole-Davidson equation for is not strictly identical to the equation used for the noise measurements, but both share the same overall features. The fit to the Cole-Davidson model is applied to both Dy2Ti2O7 and Ho2Ti2O7. Similarly to noise fitting, the Ho2Ti2O7 fit function consists in the sum of two Cole-Davidson functions. and are fitted jointly to ensure that one set of parameters reproduces both quantities and obeys Kramers-Kronig relations. This analysis accurately describes the Dy2Ti2O7 data (Figure S7) across the entire temperature range.
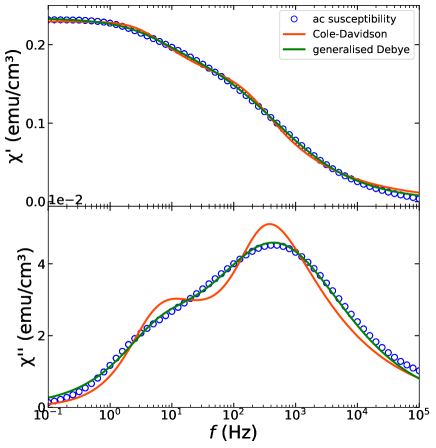
In the case of Ho2Ti2O7 the fits are of a poorer quality in the intermediate temperature range (between 1 and 1.5 K) when the two time scales are well separated (Figure S8). This difficulty is explained by the asymmetric behavior of the model, which induces a non vanishing high frequency contribution for a given broadness. Thus, the low frequency peak in the fit possesses a significant intensity at higher frequencies, which affects the fitting of the higher frequency peak. The fits then need to find an optimum between matching the broadness and the intensities. For the specific case of K, Figure S9 shows that the generalized Debye model does not have this issue. However, for the reasons explained above, this generalized Debye model is incompatible with the noise measurements. These results nevertheless show that the “simple” above equations cannot capture the dynamics of spin ice in the whole temperature and frequency range, and are just approximations to apprehend the dependence of the relaxation times in the system.
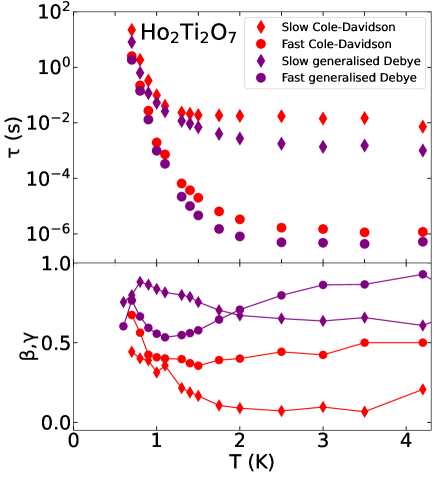
In order to compare the influence of the fit model on the obtained parameters, we have performed the fitting procedure for the ac susceptibility for both generalized Debye and Cole-Davidson model. Figure S10 shows that the overall behavior of the exponent parameters and the relaxation times is similar with both models. It is interesting to stress out that the Cole-Davidson model shifts the values to longer times compared to the generalized Debye model. This is due to the asymmetry of the distribution function of the Cole-Davidson model which results in a maximum in ” located at a higher frequency for a same parameter (Figure S6, bottom panel).
III.3 AC susceptibility aging effect
When cooling down to temperatures below 400 mK, we observe a new dissipative process in the ac susceptibility in both Dy2Ti2O7 and Ho2Ti2O7. It is shown here in Figure S11 for Dy2Ti2O7, and in Figure 5 of the main text for Ho2Ti2O7. This dissipative process is observed below 10 Hz in Dy2Ti2O7 and 1 Hz in Ho2Ti2O7. This dissipative process is associated to an aging effect, which appears to be weaker in Dy2Ti2O7 than in Ho2Ti2O7 (see insets of Figure S11).
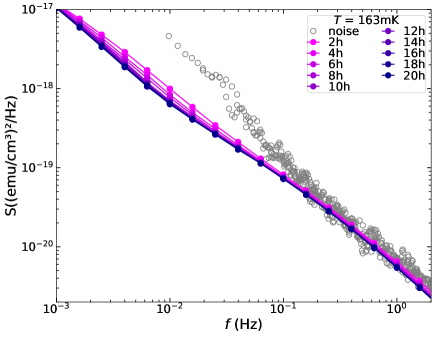
Figure S12 shows how this aging effect relates to the noise fluctuation spectrum at 163 mK in Ho2Ti2O7. Above 0.1 Hz (which corresponds to the frequency below which the FDR is not obeyed), the relaxation of the ac susceptibility remains within the range of the scattering of the noise data. The aging effect is strongest below this frequency, with an equilibration time of 14 hours in Ho2Ti2O7 at 163 mK and of 10 hours in Dy2Ti2O7 at 200 mK.