Characterizing Behavioral Differences and Adaptations of Automated Vehicles and Human Drivers at Unsignalized Intersections: Insights from Waymo and Lyft Open Datasets ††thanks: Disclaimer: This work has been submitted to Transportation Research Record for potential publication.
Abstract
The integration of autonomous vehicles (AVs) into transportation systems presents an unprecedented opportunity to enhance road safety and efficiency. However, understanding the interactions between AVs and human-driven vehicles (HVs) at intersections remains an open research question. This study aims to bridge this gap by examining behavioral differences and adaptations of AVs and HVs at unsignalized intersections by utilizing two comprehensive AV datasets from Waymo and Lyft. Using a systematic methodology, the research identifies and analyzes merging and crossing conflicts by calculating key safety and efficiency metrics, including time to collision (TTC), post-encroachment time (PET), maximum required deceleration (MRD), time advantage (TA), and speed and acceleration profiles. The findings reveal a paradox in mixed traffic flow: while AVs maintain larger safety margins, their conservative behavior can lead to unexpected situations for human drivers, potentially causing unsafe conditions. From a performance point of view, human drivers exhibit more consistent behavior when interacting with AVs versus other HVs, suggesting AVs may contribute to harmonizing traffic flow patterns. Moreover, notable differences were observed between Waymo and Lyft vehicles, which highlights the importance of considering manufacturer-specific AV behaviors in traffic modeling and management strategies for the safe integration of AVs. The processed dataset utilized in this study is openly published to foster the research on AV-HV interactions.
Keywords Autonomous Vehicles Behavioral Difference Behavior Adaptation Intersections Safety
1 Introduction
The advent of automated vehicles (AVs) represents one of the most significant technological advancements in the transportation sector over the past few decades. These vehicles promise to reduce human errors and provide potential benefits, including increased safety, reduced traffic congestion, lower emissions, and improved accessibility. In recent years, the transition of AVs from concept to reality has gained momentum. Companies like Waymo and Motional have already deployed their robotaxi fleets in various U.S. cities, and industry giants such as Tesla and Zoox (Amazon’s self-driving unit) have announced plans to launch their autonomous taxi services in the near future [1, 2]. As AVs evolve from experimental prototypes in research labs to commercially viable products in the real world, it is essential to study and understand their interactions with human-driven vehicles and their potential impacts on the behavior of human drivers and the transportation system [3, 4]. This understanding is important for ensuring the safe and efficient integration of AVs into existing transportation networks, facilitating legislation and regulating their deployment [5], and fostering public acceptance and trust in these technologies.
Luckily, the emergence of real-world AV datasets in recent years has opened up unprecedented opportunities to study the intricate dynamics and interactions between autonomous and human-driven vehicles. Studies utilizing these datasets can be broadly categorized into two classes: those exploring the behavioral adaptations of human drivers in the presence of AVs [3, 6, 7, 8, 9, 10] and those investigating the operational characteristics of AVs navigating alongside conventional vehicles [11, 7]. Although these studies provide a unique perspective on the complex interactions among AVs and HVs, they have been mainly limited to one-dimensional, longitudinal interactions, also known as car-following scenarios. These longitudinal interactions, while informative, cannot comprehensively capture the complex and multi-dimensional nature of AV-HV interactions in real-world traffic scenarios. A prime example of this complexity is when vehicles encounter each other at unsignalized intersections and engage in intricate, multi-directional maneuvers. These scenarios demand a higher level of decision-making, negotiation, and prediction of other road users’ intentions, making them critical areas of study for understanding AV-HV interactions [12, 13]. Despite their significance, these multi-dimensional interactions have been largely unexplored in the existing literature. Moreover, most studies to date have relied on a single AV dataset, which limits the generalizability of their findings and constrains comparative behavioral analysis across different AV platforms. This narrow focus fails to account for the diversity in design philosophies, sensor technologies, and decision-making algorithms employed by various AV manufacturers. Conducting such comparisons is essential for informing traffic modeling and management strategies, as it highlights the importance of considering manufacturer-specific AV behaviors to ensure the safe and efficient integration of AVs into existing transportation systems.
In response to these gaps, the present study conducts a comprehensive analysis of AV-HV interactions at unsignalized intersections using two large-scale AV datasets. By examining both merging and crossing conflicts, we aim to capture the intricate dynamics of these interactions. We utilize various safety and efficiency metrics—including time to collision (TTC), post-encroachment time (PET), maximum required deceleration (MRD), time advantage (TA), speed distributions at the conflict point, and acceleration and speed profiles—to provide a detailed characterization of AV and HV behaviors in these settings. To our knowledge, this is the first study to offer such an extensive analysis of AV-HV interactions at unsignalized intersections using multiple datasets. The main contributions of this study can be summarized as follows:
-
•
Comprehensive Analysis of AV-HV Interactions at Unsignalized Intersections: We provide a thorough and detailed examination of the interactions between autonomous vehicles (AVs) and human-driven vehicles (HVs) at unsignalized intersections, focusing on both merging and crossing conflicts. By employing a variety of safety and efficiency metrics, we offer a comprehensive understanding of the behavioral differences between AVs and HVs, as well as the behavior adaptation of HVs when interacting with AVs, in these complex traffic scenarios. To our knowledge, this is the first study focusing on behavioral differences between AVs and HVs at unsignalized intersections.
-
•
Utilization of Multiple Real-World Datasets: Unlike previous studies that have primarily relied on a single dataset, we utilize two large-scale, real-world AV datasets, which allows us to examine the potential behavioral variations between different AV platforms and the possible adaptations of human drivers to AVs with different appearances and driving styles. through this, we contribute to a more generalizable and nuanced understanding of AV-HV interactions.
-
•
Provision of a High-Quality Conflict Dataset for Unsignalized Intersections: We meticulously preprocess the raw datasets by identifying the locations and types of interactions at unsignalized intersections, identifying merging and crossing conflicts, and denoising the raw data. This results in a high-quality conflict dataset including both merging and crossing scenarios. By publishing this processed dataset, we provide a valuable resource for the research community, fostering further studies on AV-HV interactions at unsignalized intersections111https://github.com/SaeedRahmani/Unsignalized_AV_HV.
Through these contributions, this study provides a better understanding of AV-HV dynamics in complex traffic scenarios and aims to advance the growing body of knowledge on AV-HV interactions, by offering valuable insights for improving AV algorithms, enhancing traffic management strategies, and ultimately fostering safer, more efficient mixed-autonomy traffic environments.
The remainder of the paper is as follows. In the next section, the related studies are reviewed. Next, the methodology is described, including the data preprocessing, scenario selection, and metrics calculations. Finally, the results are presented and discussed.
2 Related Works
Previous research on AV-HV interactions generally falls into two main categories: studies exploring the behavioral differences between AVs and HVs, and studies investigating the behavior adaptation of HVs when interacting with AVs. In this section, we overview these studies and highlight the gaps in the existing literature.
The initial studies utilized “field data” to research the behavior of human drivers in mixed traffic. [3] conducted car-following experiments using Texas A&M University’s automated Chevy Bolt and observed that human drivers felt more comfortable following the AV and kept shorter headways. [14] performed a Wizard of Oz experiment in the Netherlands focusing on car-following and overtaking behaviors. They found that human drivers can potentially exploit AVs in their interactions by making abrupt merges in front of AVs. [15] doubted these findings and argued that drivers’ reactions to autonomous vehicles depend on their subjective trust in AV technologies rather than the actual driving behavior. They categorized humans as AV-believers and AV-skeptics, where only AV-believers followed AVs with lower headways. [6] observed a similar pattern in the interactions between HVs and AVs, where only aggressive and moderate drivers showed increased aggressive behavior. Additionally, aggressive drivers were more prone to exploit AVs while driving.
With the availability of “real-world” datasets of AVs, such as Waymo Open Dataset [16, 17], Lyft Level 5 [18], and Argoverse [19], researchers began to characterize the behavior AVs and HVs in mixed traffic. [7] and [8] noted that human drivers following AVs exhibit lower driving volatility, shorter time headways, and higher time-to-collision values. This finding is confirmed by [9] and [10], who observed that human drivers maintain shorter spacing and time gaps when following AVs compared to human-driven vehicles. on the other side, and focusing on the behavior of AVs among HVs, [11] found that AVs demonstrate significantly larger time headways than HVs, suggesting higher safety measures. They also noted longer response times for AVs to various stimuli. Despite these relatively consistent findings from real-world datasets, [4] cast doubt upon these findings and propose alternative explanations for these observed behavioral differences. They highlight potential observation biases in AV-collected data, driver heterogeneity, and distinct driving patterns between AVs and HVs and argue that these behavioral insights from non-behavioral data require further scrutiny. All in all, these studies collectively underscore the behavior adaptation of HVs when interacting with AVs, and the different behavior of AVs compared to human drivers. However, they have mainly focused on car-following scenarios and neglected the intricate and multi-dimensional interactions at urban intersections.
Recently, a few studies have gone beyond analyzing car-following scenarios. [7] studied the behavior of AVs and HVs when approaching signalized intersections. However, they only focused on longitudinal behaviors of AVs and HVs before the intersection, such as approaching a queue or starting a maneuver after a traffic light turns green, and did not investigate the interactions of vehicles inside the intersections. [20] identified crossing conflicts within the Argoverse 2 dataset [19] to study the conflict resolution behavior of AVs and HVs in AV-free and AV-included scenarios. Although this study includes two-dimensional interactions, it does not differentiate between unsignalized intersections and other conflicts, such as vehicles exiting parking areas or situations where one vehicle has a clear right of way. Mixing these scenarios with unsignalized intersections can lead to biased estimations, as they involve different levels of complexity and decision-making. Additionally, the study is limited by its reliance on a single dataset, which questions its generalizability and restricts the ability to investigate behavioral differences across AVs from different companies, and potential different behavioral adaptations of human drivers when facing AVs with different driving styles. Last but not least, the study primarily focuses on crossing maneuvers, without comparing the outcomes of merging and crossing conflicts, which limits a more comprehensive understanding of these different types of interactions.
This study addresses these limitations by identifying unsignalized intersections with equal right of way for all their approaches, utilizing two real-world AV datasets from Waymo and Lyft, and comprehensively analyzing both crossing and merging conflicts.
Through these contributions, we offer a more robust and diverse analysis of AV-HV interactions. allowing us to explore not only the behavioral differences between AVs and HVs but also between AVs from different manufacturers. Furthermore, the published dataset is the first dataset focusing on unsignalized intersections, which facilitates targetted research in this domain, such as calibrating microsimulation models [13, 12] and development of safer, more efficient, and socially-compliant autonomous driving systems.
3 Methodology
3.1 Framework Description
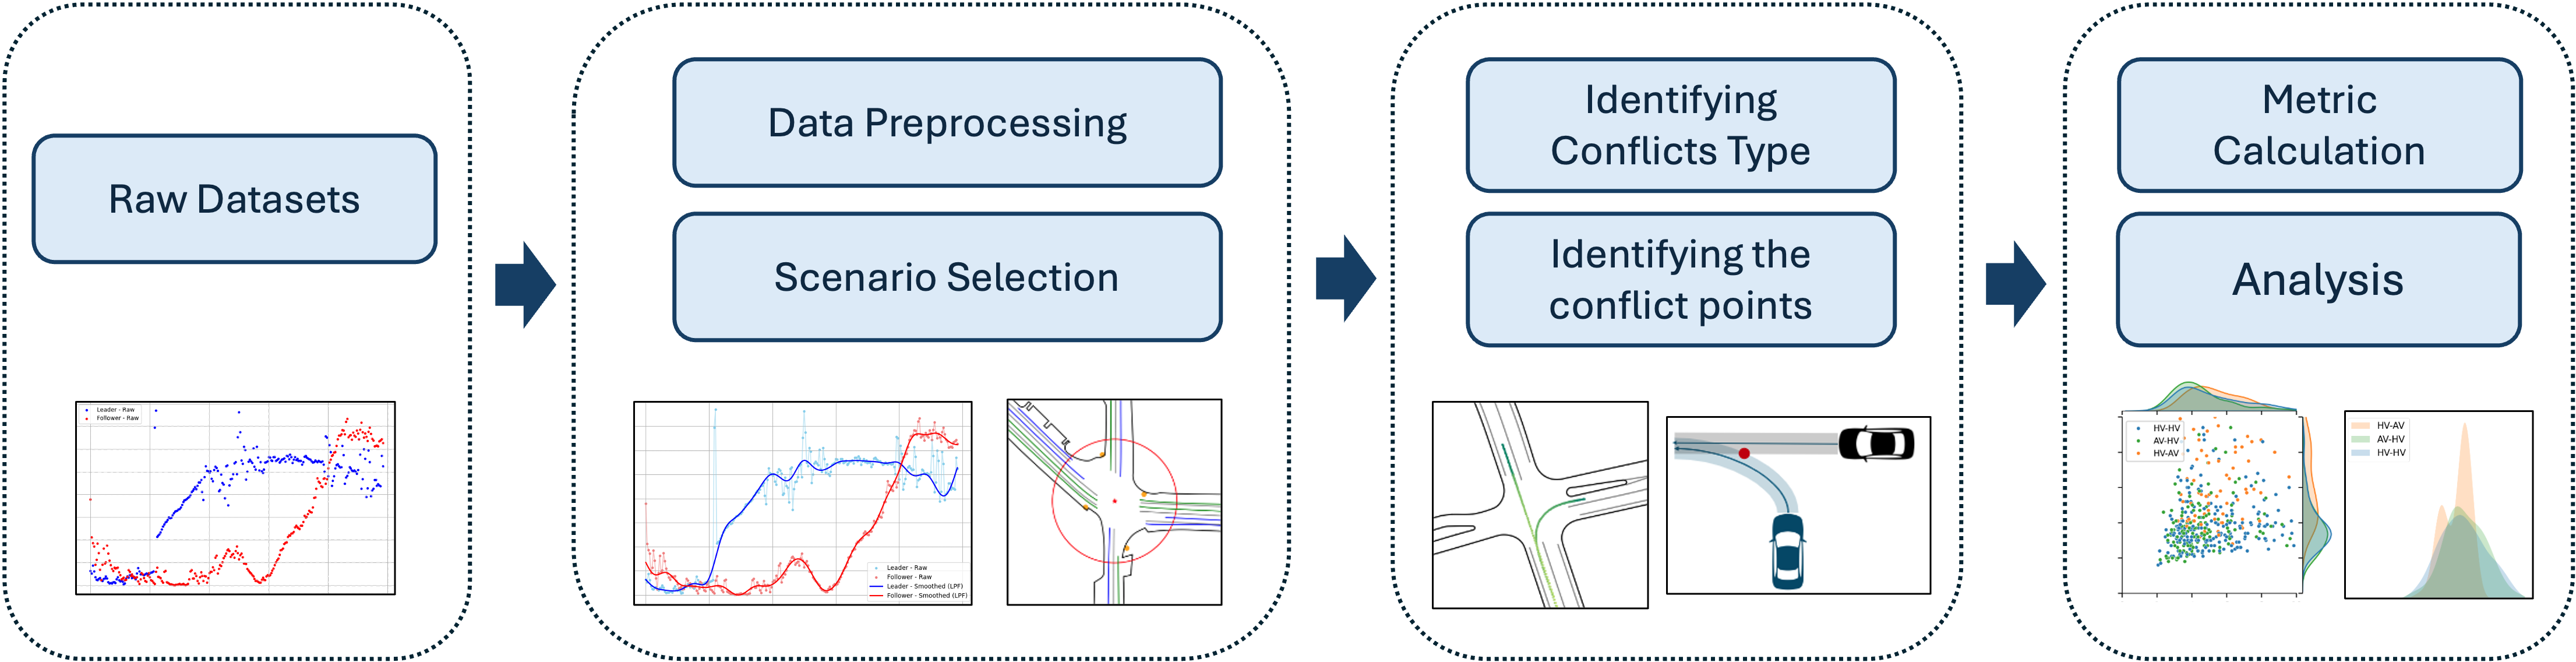
This study employs a systematic approach to process the datasets, identify relevant scenarios, and analyze interactions between autonomous vehicles (AVs) and human-driven vehicles (HVs). The procedure includes four main steps, depicted in Figure 1. In the first step, the dataset is selected based on the objectives of the study. The second step concerns data preparation, which includes developing an algorithm for identifying unsignalized intersections and preprocessing the data to address noises and outliers. In the third step, algorithms are developed to detect and classify conflicts into crossing and merging, find the potential conflict point, and calculate the desired metrics for analyzing and characterizing the HVs and AVs behaviors and their interactions. Finally, the analyses are conducted using the defined metrics and statistical analysis. Our analysis encompasses both qualitative and statistical comparative analysis.
3.2 Dataset selection and Introduction
Our criteria for dataset selection included several key characteristics: the availability of long trajectories to capture the behavior of AVs and HVs before and within the intersection, the presence of autonomous vehicles operating in fully autonomous mode (and not with a human driver), and the availability of comprehensive trajectory data for detailed analysis. Table 1 presents a comparison of four popular AV datasets. Among these datasets, nuPlan data is collected by an equipped vehicle driven by a human driver, and the trajectories within the Argoverse 2 dataset are 11 seconds. Therefore, this study utilizes Lyft Level 5 and Waymo Open Datasets. Both datasets provide rich information on autonomous vehicle operations in diverse traffic scenarios, making them suitable for our analysis of AV-HV interactions at unsignalized intersections.
| Dataset | Duration | Trajectory Data | Operation Mode | Length of Scenarios |
|---|---|---|---|---|
| Waymo | 570 hours | Yes (10Hz) | Autonomous | 10 & 20 seconds |
| Lyft Level 5 | 1000 hours | Yes (10Hz) | Autonomous | 20 seconds |
| nuPlan | 1100 hours | Yes (10Hz) | Human Driver | 25 seconds |
| Argoverse 2 | 763 hours | Yes (10Hz) | Autonomous | 11 seconds |
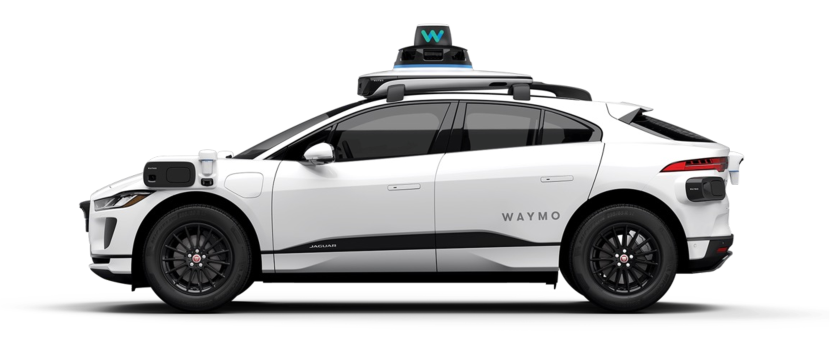
The Waymo Open Dataset222https://github.com/waymo-research/waymo-open-dataset provides approximately 570 hours of driving data, collected across six cities, including San Francisco, Phoenix, Mountain View, Los Angeles, Detroit, and Seattle. We utilize version 1.2.1 of the motion dataset (April 2024), which includes 20-second scenarios and provides the labels for the AV, as well as for other agents in each scene. This dataset employs a fleet of Jaguar I-PACE electric SUVs, which are distinguishable from regular vehicles due to their advanced sensor arrays, including roof and side-mounted LiDAR units and multiple high-definition cameras (Figure 2(a)). This dataset provides high-resolution trajectory data at 10 Hz, and a length of 20 seconds for each scenario, enabling precise analysis of vehicle interactions.
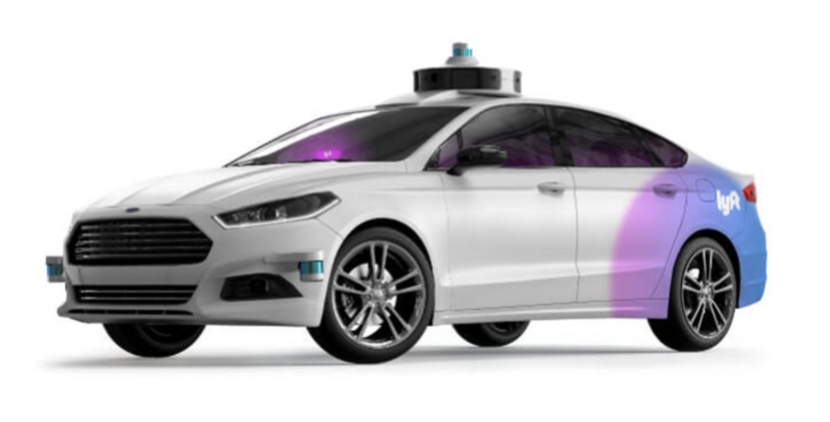
The Lyft Level 5 dataset 333https://woven-planet.github.io/l5kit/dataset.html comprises over 1,000 hours of driving data collected in Palo Alto, California. It features a fleet of 20 autonomous vehicles equipped with a sensor suite including LiDAR, radar, and cameras. The vehicles, Ford Fusion models retrofitted with Lyft’s autonomous driving technology, are visually distinct from standard human-driven vehicles due to their roof and bumper-mounted sensor arrays (Figure 2(b)). This dataset also provides detailed trajectory data for both autonomous vehicles and surrounding traffic, including human-driven vehicles, with a temporal resolution of 10 Hz and a length of 20 seconds for each scenario.
3.3 Dataset Preparation
The dataset preparation is comprised of two steps: preprocessing the data by removing outliers and reducing noises in the datasets, and identifying relevant scenarios where vehicles interact with each other at an unsignalized intersection. These steps are detailed as follows.
3.3.1 Data Smoothing
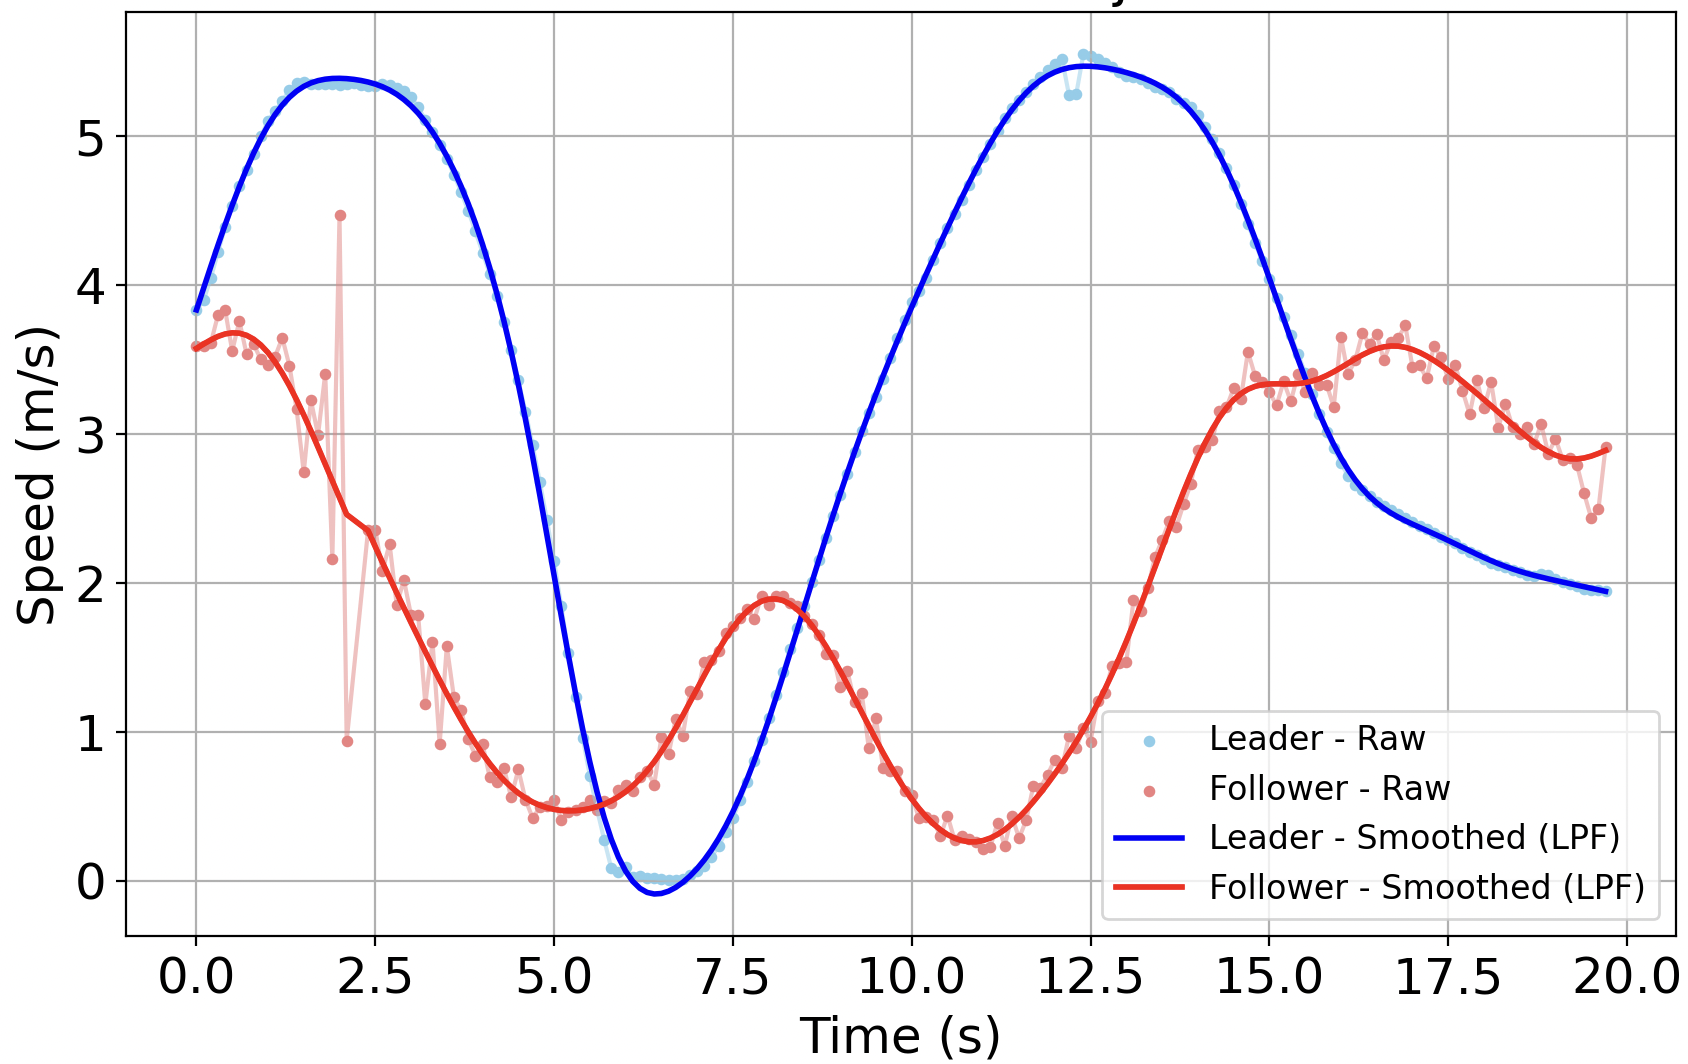
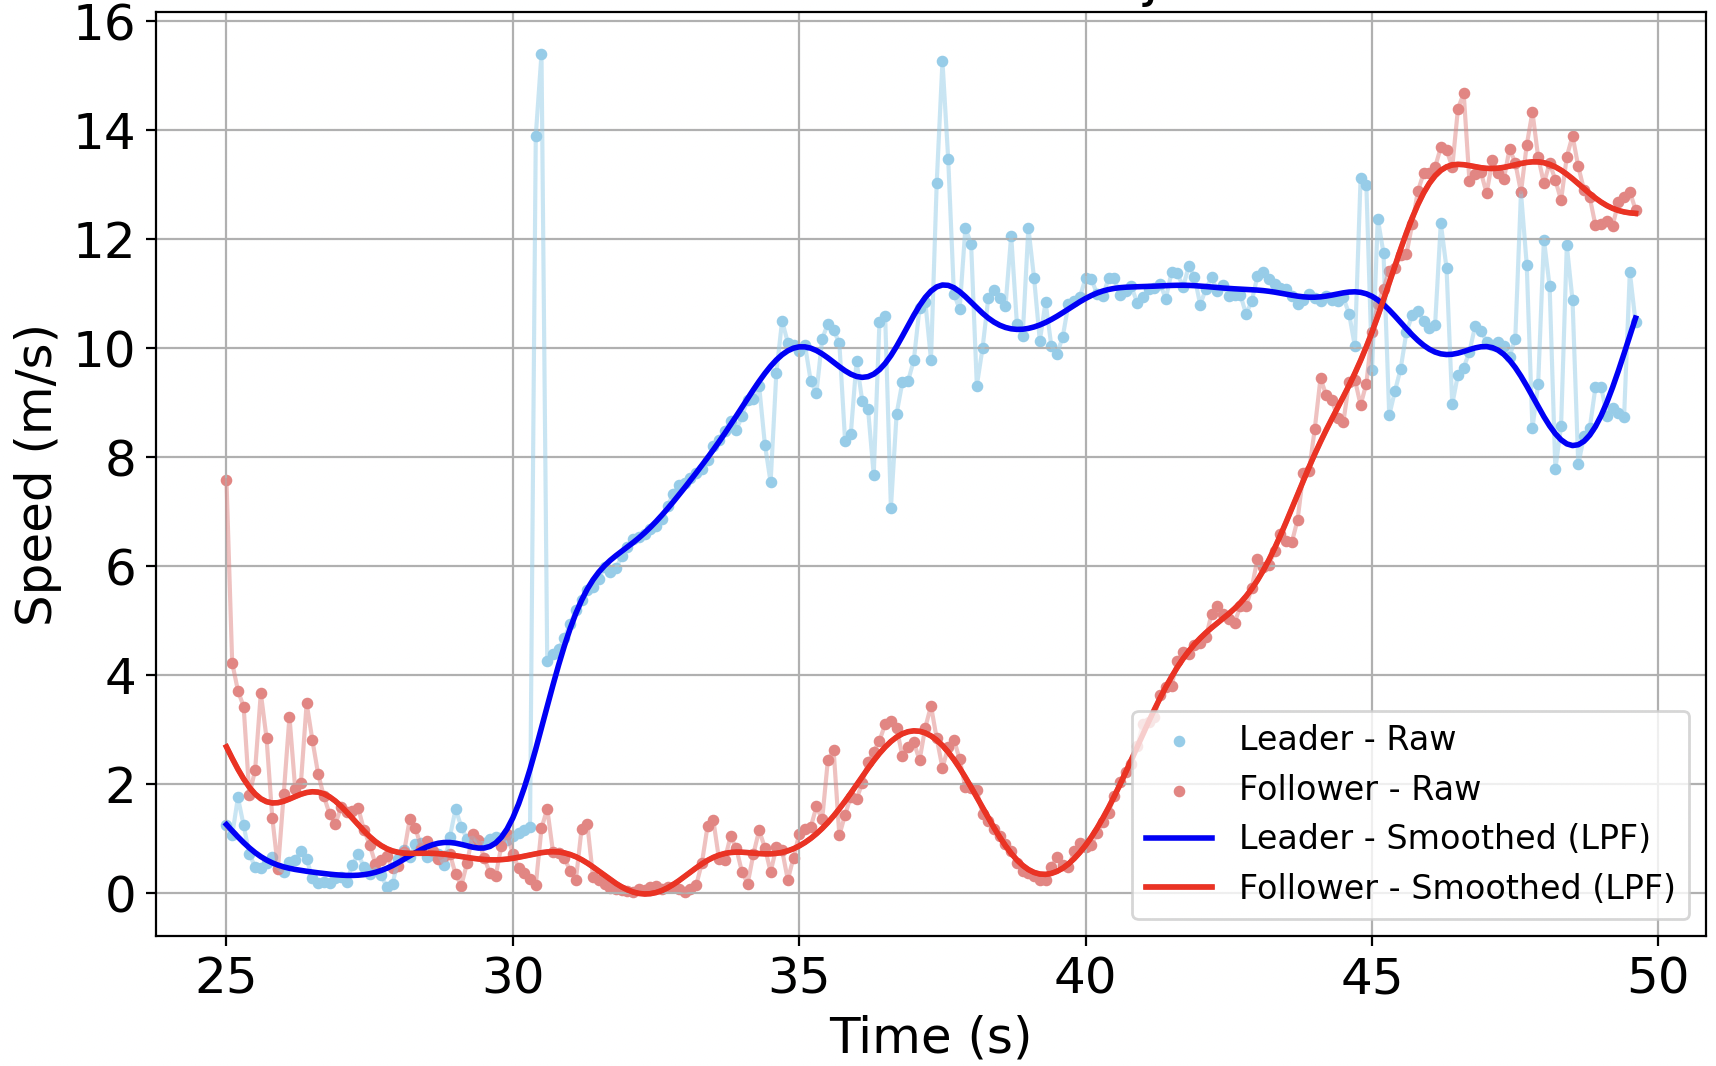
We observed different types of noises and outliers in the dataset. Most of the noises were apparently due to measurement errors also reported by [4]. However, in some cases, we observed high jumps in the speed profiles, which seemed to be due to inaccurate interpolation between scenarios or frames, which was also observed by [10]. To alleviate such outliers, we first filtered out the data points that required accelerations higher than or decelerations lower than and replaced them with the average observed values of the previous five and next five frames. Next, we applied a low-pass Butterworth filter to smooth the high-frequency fluctuations in our velocity data. The low-pass filter is designed to allow low-frequency components of the signal to pass through while attenuating higher-frequency components, effectively smoothing the data [21]. This approach is particularly useful for reducing noise and revealing the underlying trends in our time-series data. It is characterized by its maximally flat frequency response in the passband, which means it doesn’t distort the desired part of the signal. The Butterworth filter is characterized by its transfer function:
| (1) |
where is the complex frequency variable, is the cutoff angular frequency, and is the filter order. To apply this filter to our discrete-time velocity data, we used a digital implementation by utilizing the SciPy library in Python. The digital Butterworth filter was designed using the following parameters: a cutoff frequency () of 0.5 Hz, a sampling frequency () of 10.0 Hz, and a filter order () of 4. Figure 3 shows the results of applying the designed filter and outlier detection to both Waymo and Lyft datasets. As it is presented, the smoothing process has successfully removed the outliers and noises in the datasets, resulting in smooth speed profiles.
3.3.2 Scenario Selection
The next step is to select the relevant scenarios where the ego vehicle passes an uncontrolled, all-stop, unsignalized intersection. To this end, we developed a systematic approach, where firstly, the HD map data is utilized to locate all the stop signs on the map. Then, a distance-based clustering approach is used to cluster the stop signs whose Euclidean distance is less than a certain threshold. This distance threshold was determined through an iterative process of trial and error. The purpose of this step is to cluster the stop signs of individual intersections to find unique unsignalized intersections. Finally, those clusters (intersections) that included three or more stop signs are identified as unsignalized intersections. The minimum number of three stop signs is chosen to include T-intersections in the analysis but exclude prioritized intersections with one or two stop signs where one approach has the right of way.
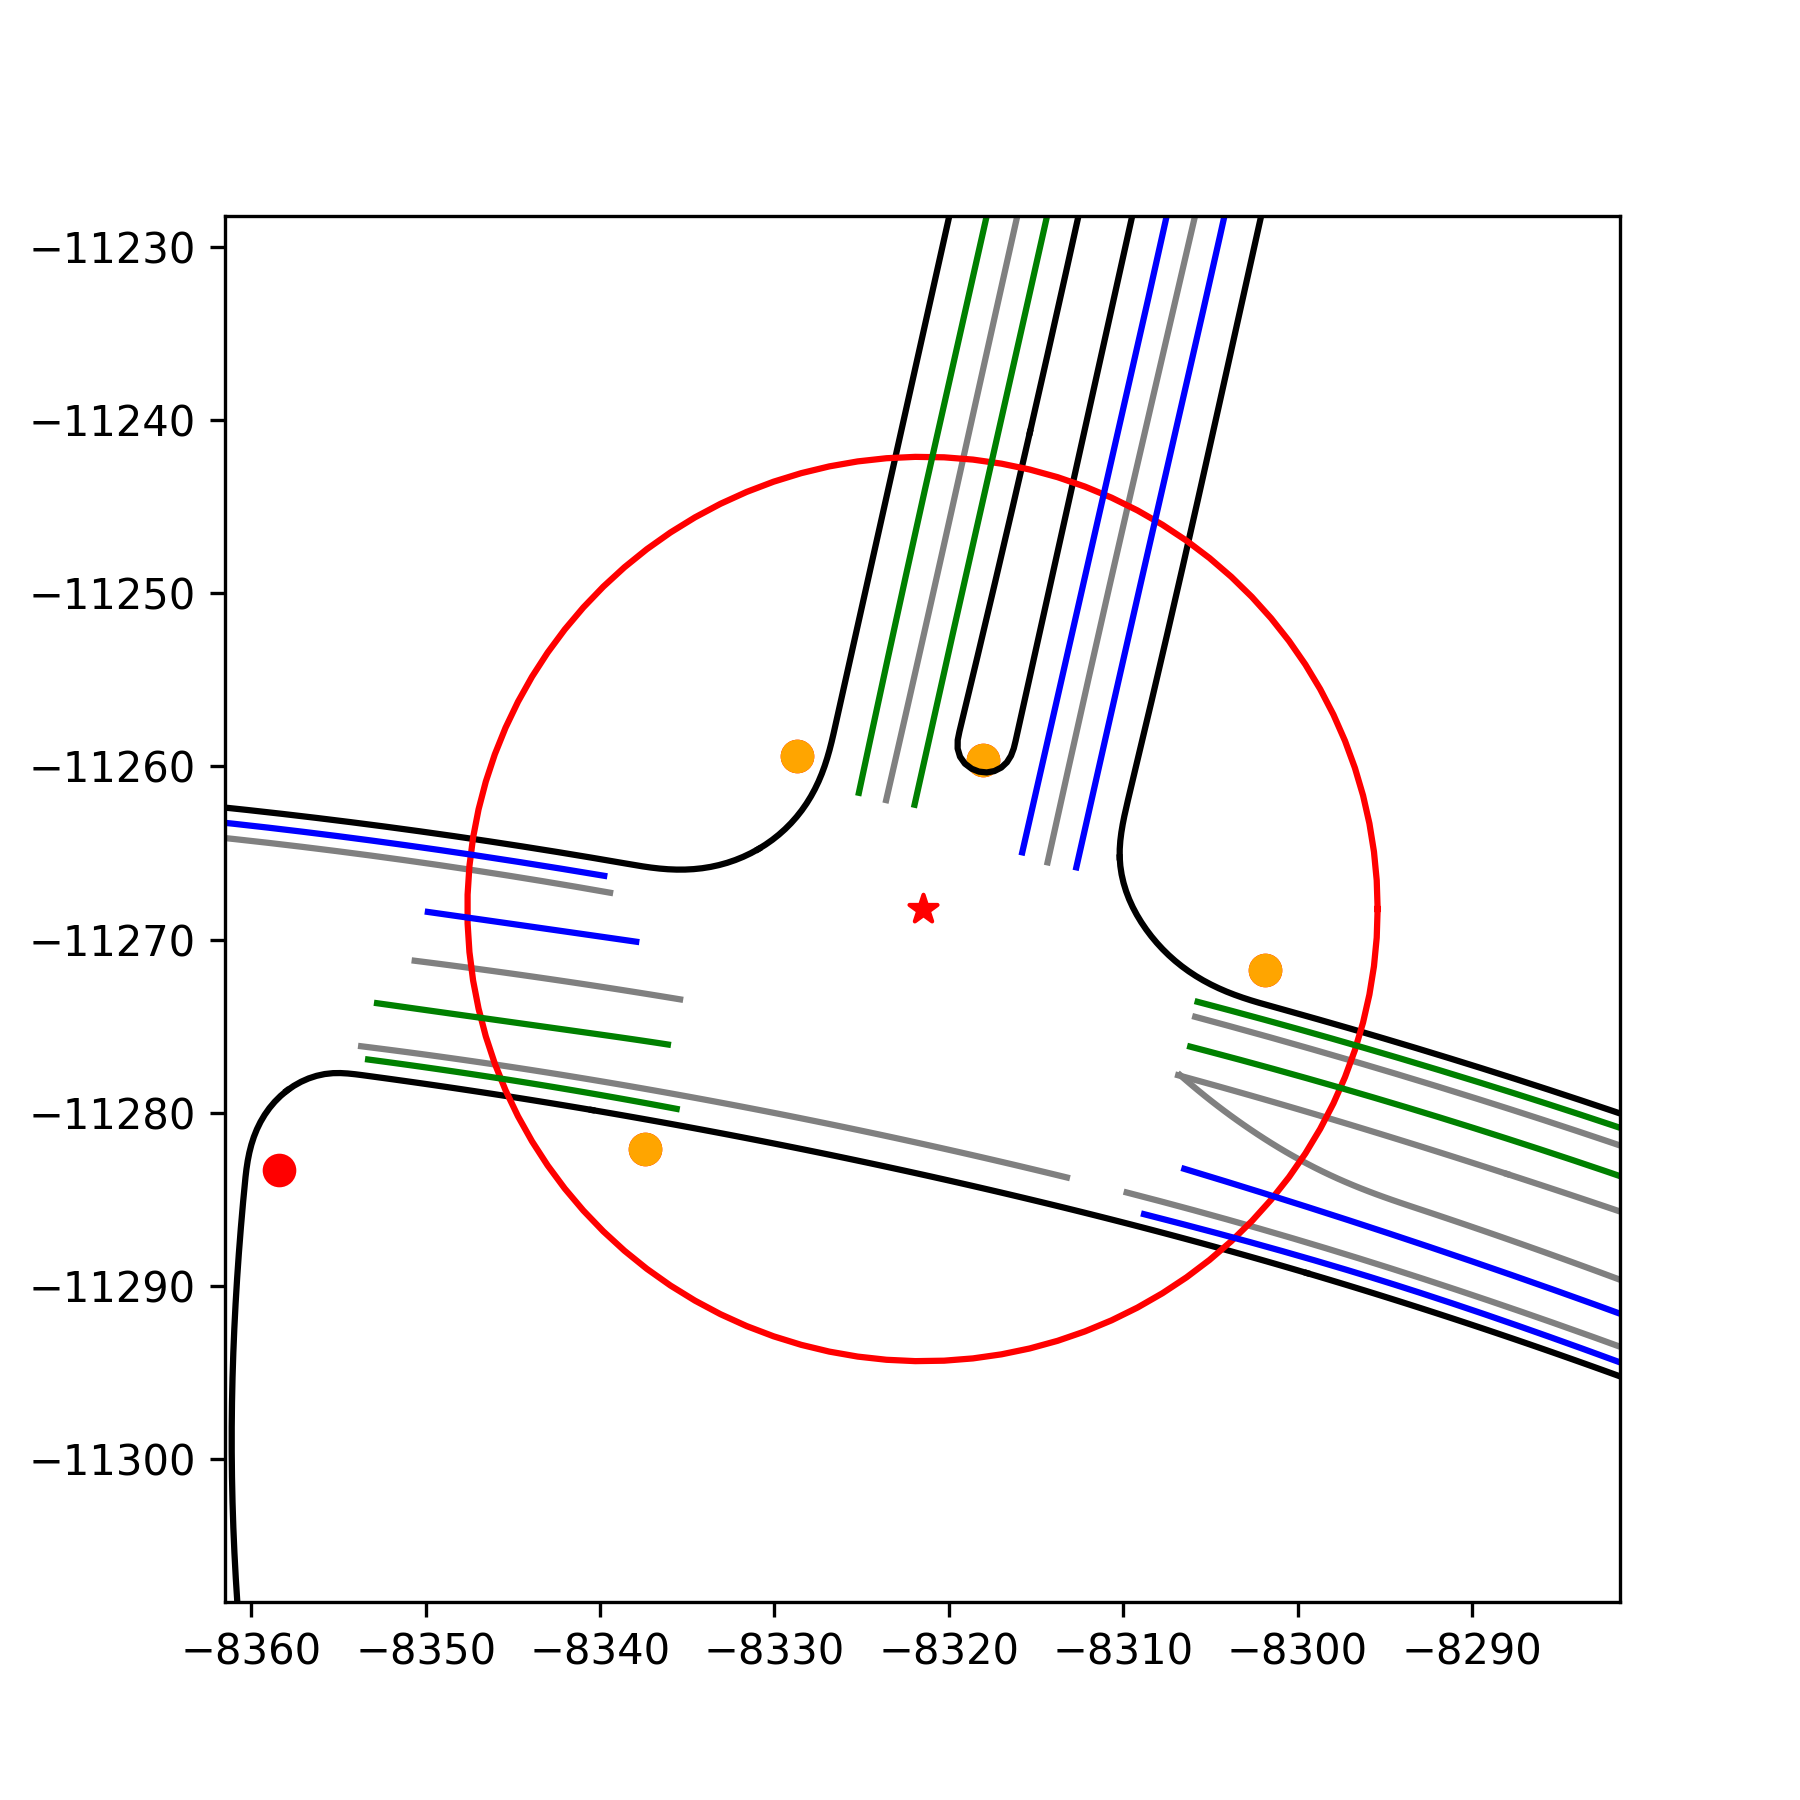
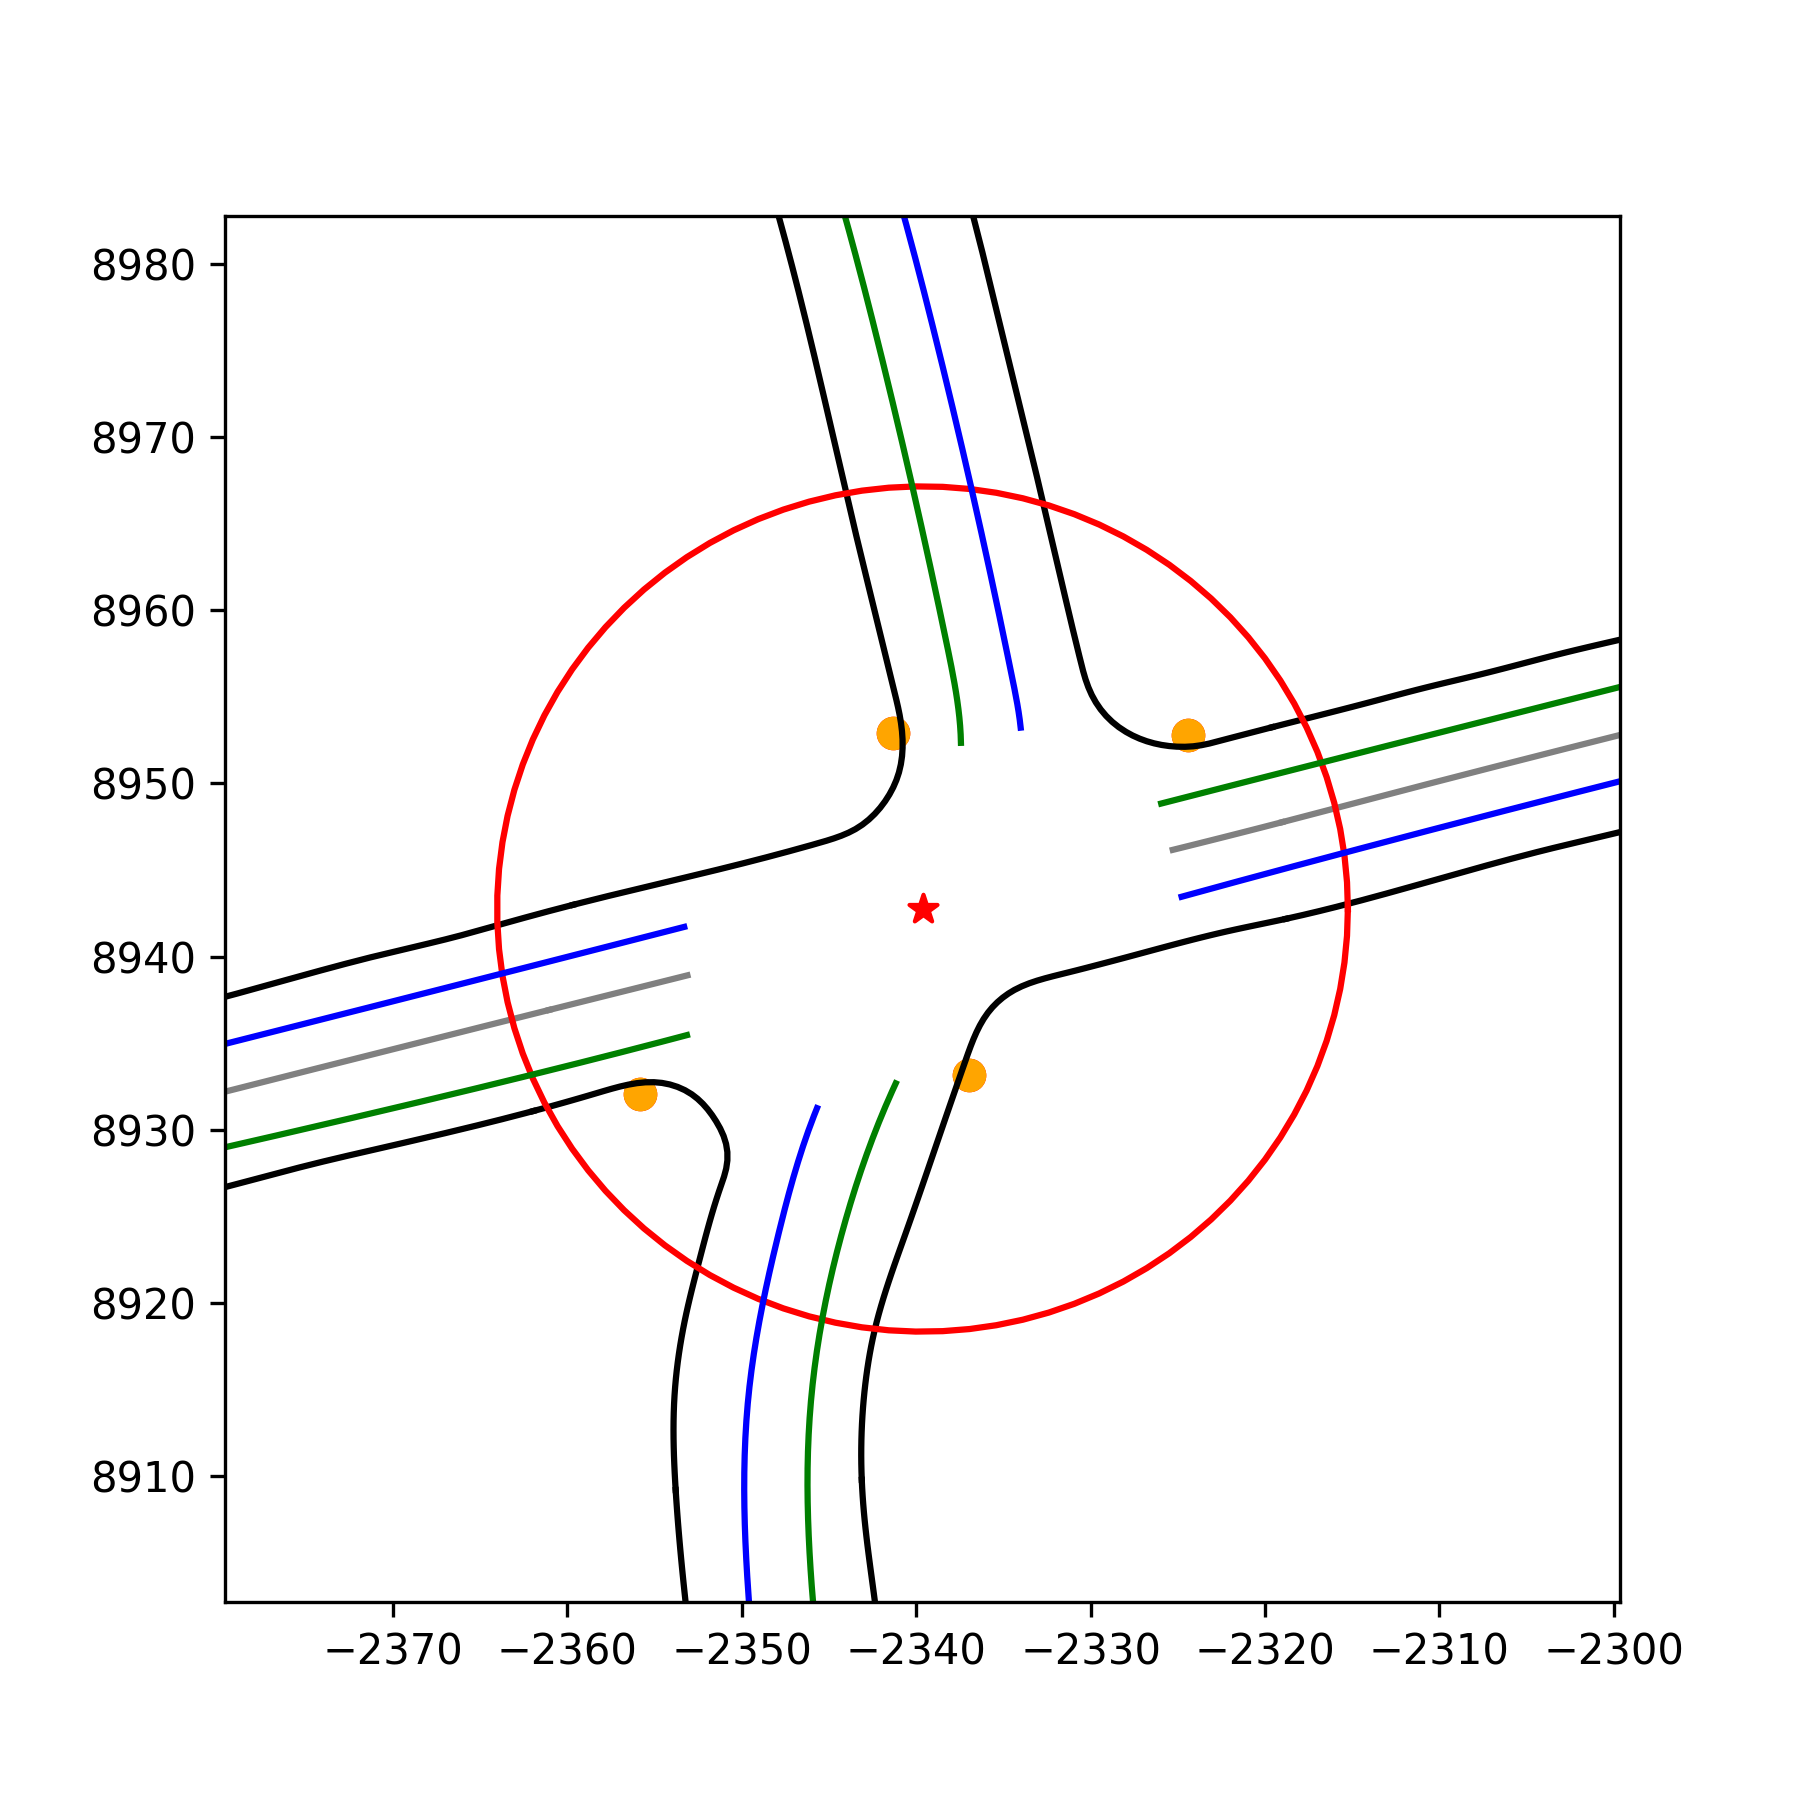
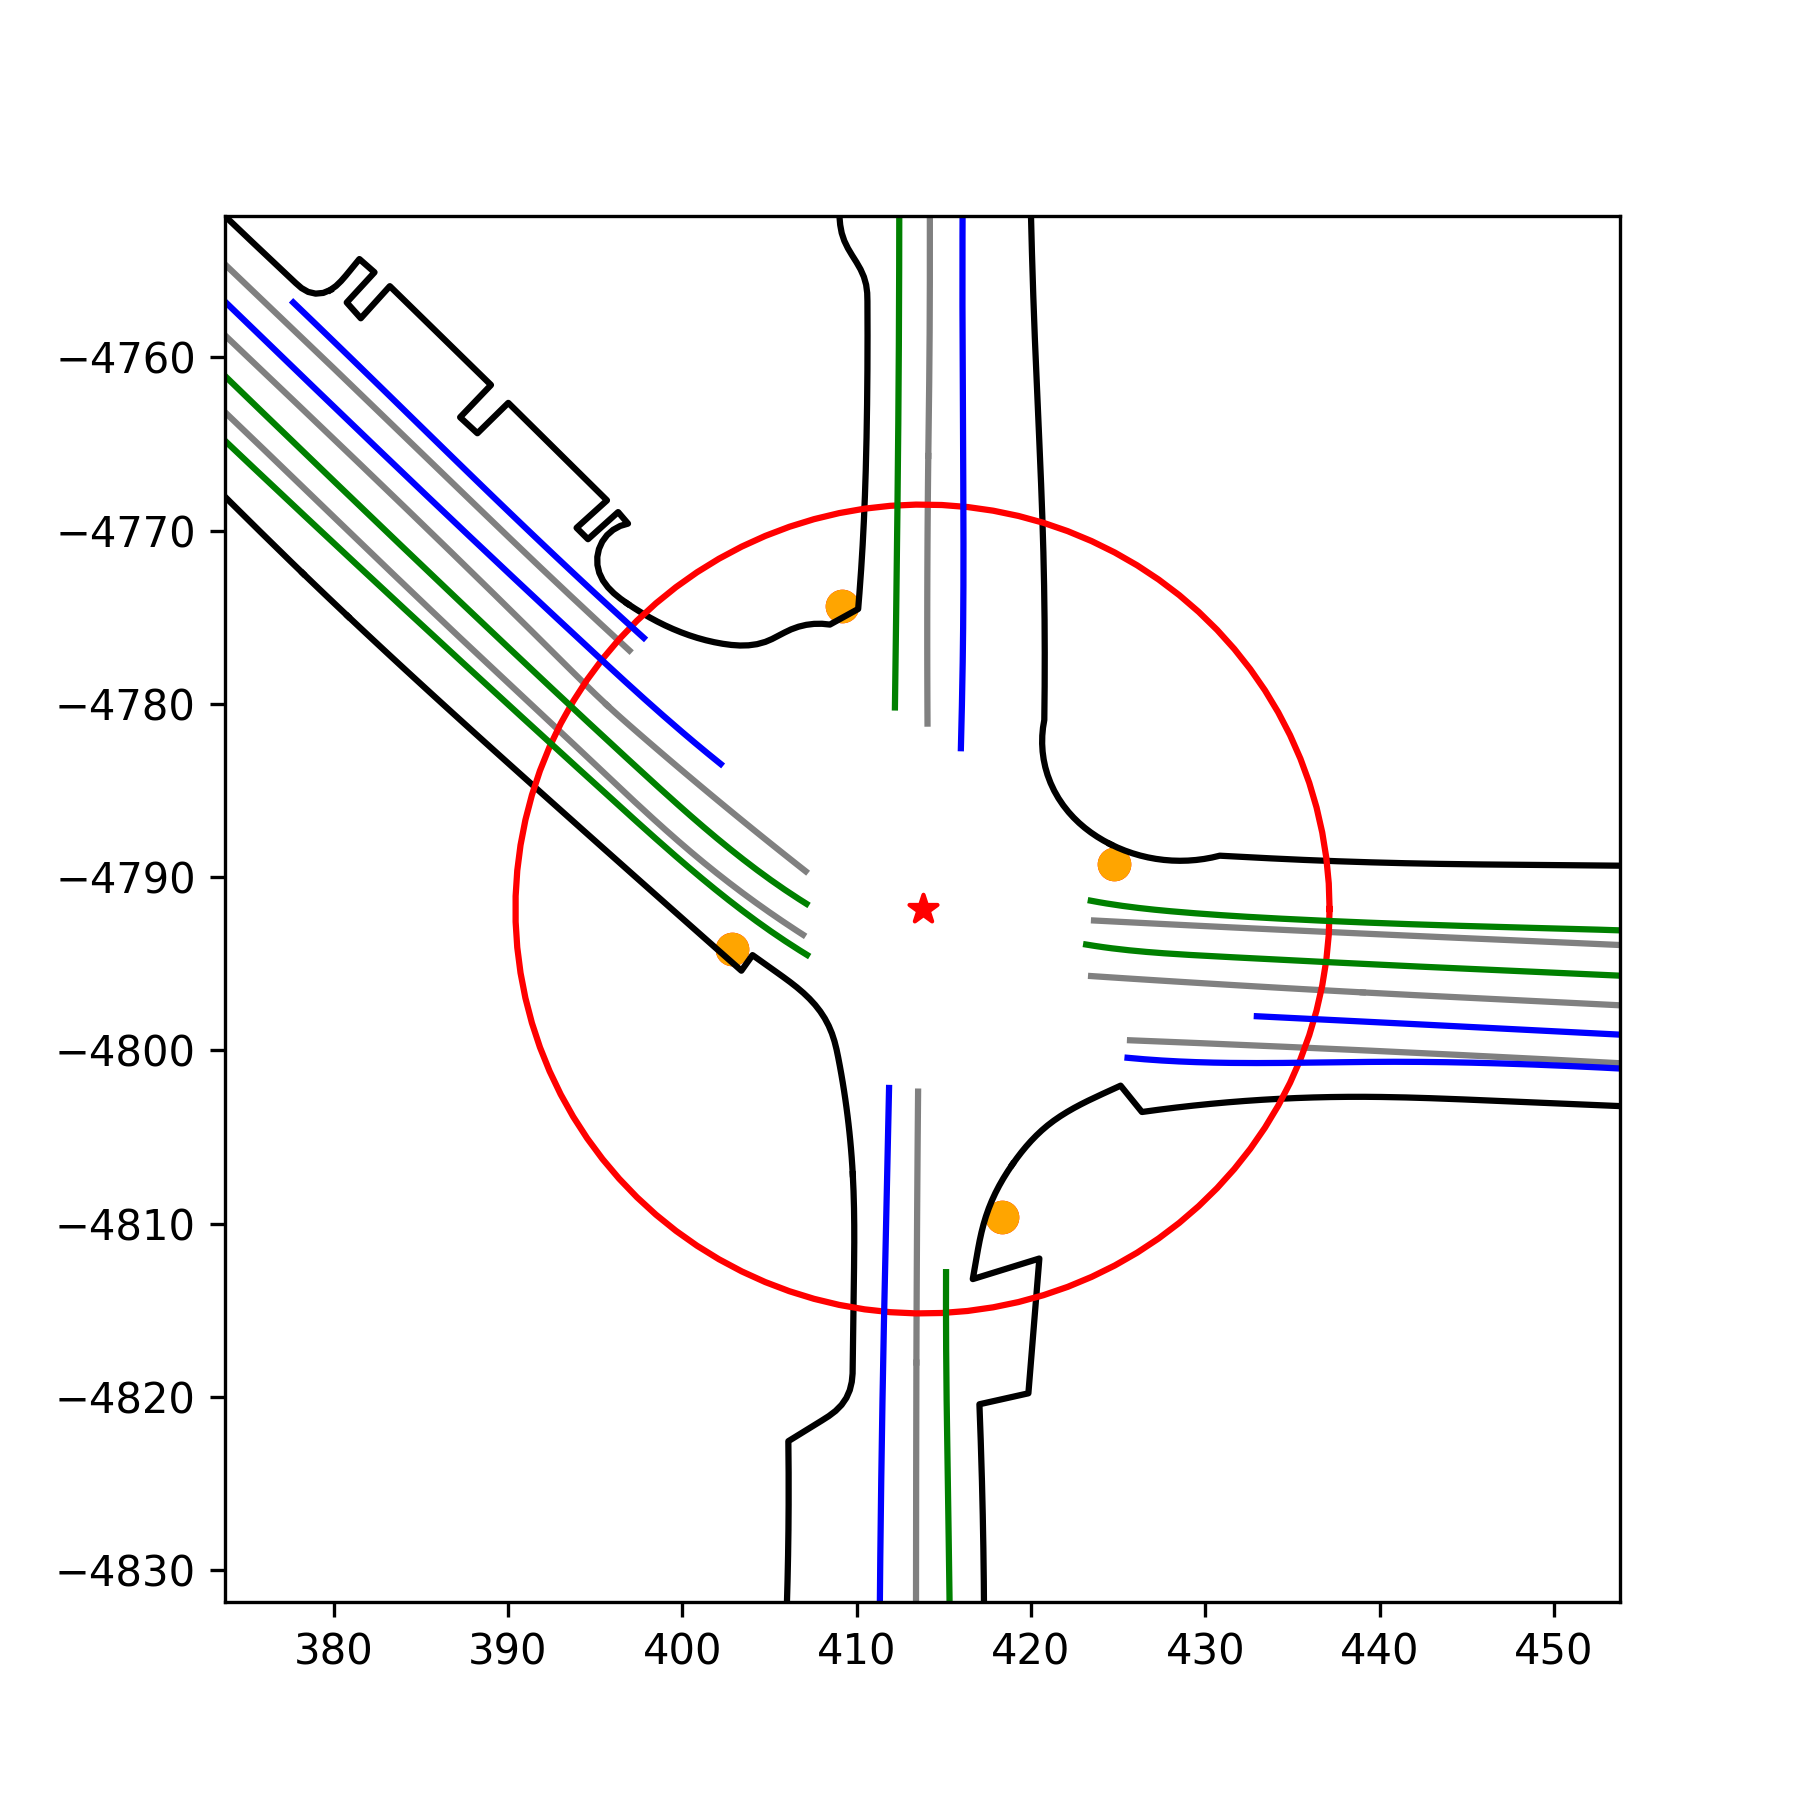
Once the intersections are identified, a further step is taken to estimate the size and center of the intersection. This is achieved by calculating the centroid of the stop signs within that cluster and defining a radius based on the maximum distance between them plus a buffer. This adaptive approach provided a reasonable estimate of the intersection’s size and extent and enabled the identification of the entering and exiting lanes to/from an intersection. By establishing these key geographical features, we laid the groundwork for the subsequent identification and analysis of merging and crossing conflicts within these intersection areas.
Figure 4 shows a few examples of identified intersections, their estimated area, and entering and exiting lanes. These examples demonstrate the capability of the proposed method to correctly identify different types of intersections, from simple intersections to more complex asymmetric ones.
3.3.3 Conflict Identification and Classification
The next step is to identify the merging and crossing conflicts. As a broad definition, a conflict refers to a “situation where two or more road users approach each other in space and time to such an extent that there is a risk of collision if their movements remain unchanged” [22]. In this study, we take a similar approach proposed by [20] with a slight modification. we identify any interaction between two vehicles as a conflict if: 1) the post encroachment time (PET) for that interaction is less than 10 seconds (as opposed to 5 seconds proposed in [20], and the speed of at least one of the vehicles has changed greater than . We released the 5 seconds to 10 seconds in this study since a significant number of the HV-AV merging interactions in the Lyft dataset resulted in PET values greater than 5 seconds because of the conservative behavior of the Lyft AV. After filtering the desired interactions, they are classified as merging and crossing conflicts using the following criteria:
-
•
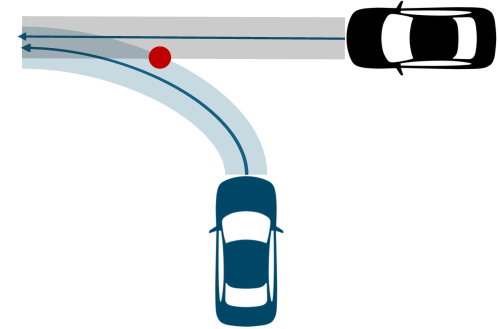
Merging conflicts: When two vehicles start from different lanes before the intersection and end up in the same lane after the intersection area.
-
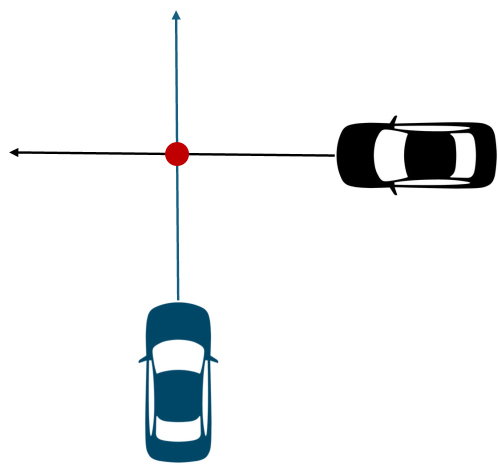
•
Crossing conflicts: When two vehicles start from different lanes before the intersection and end up in different lanes after the intersection area.
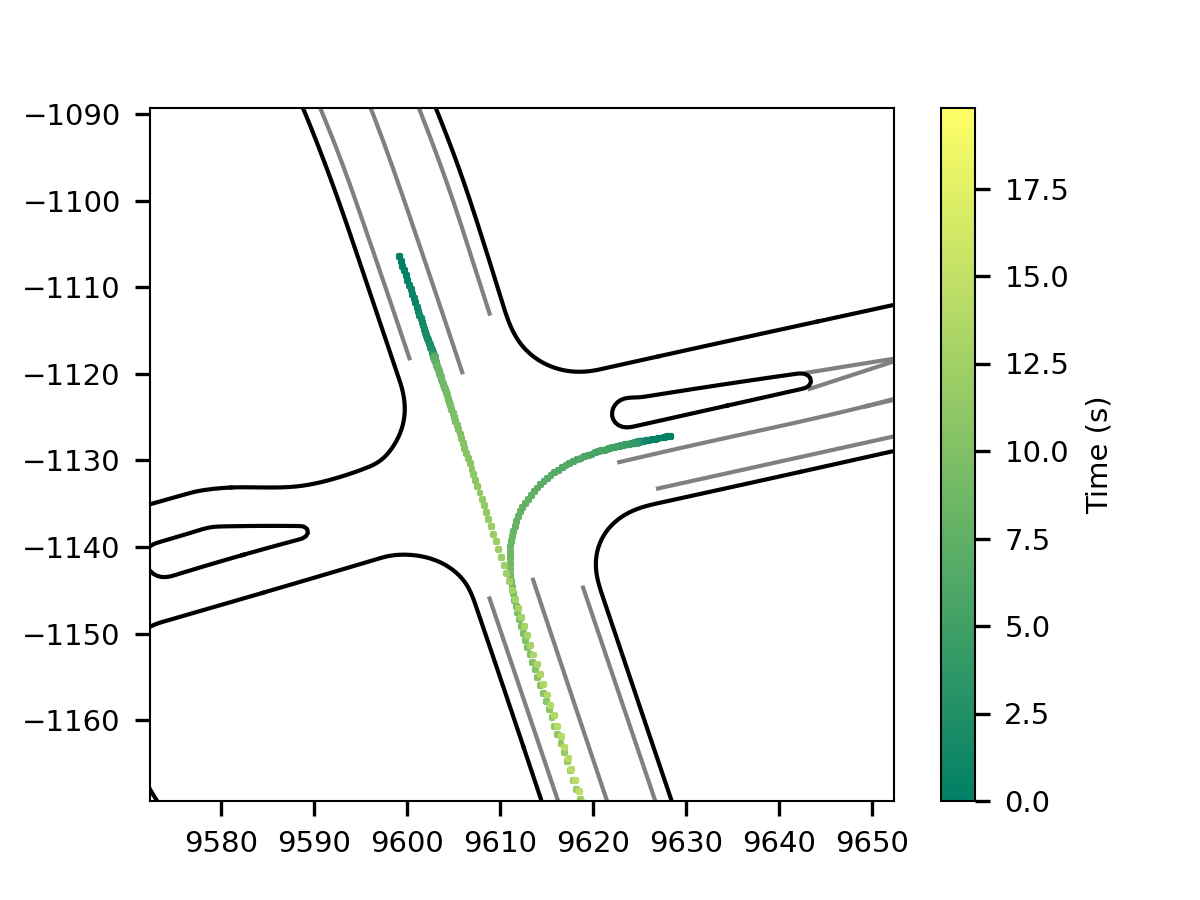
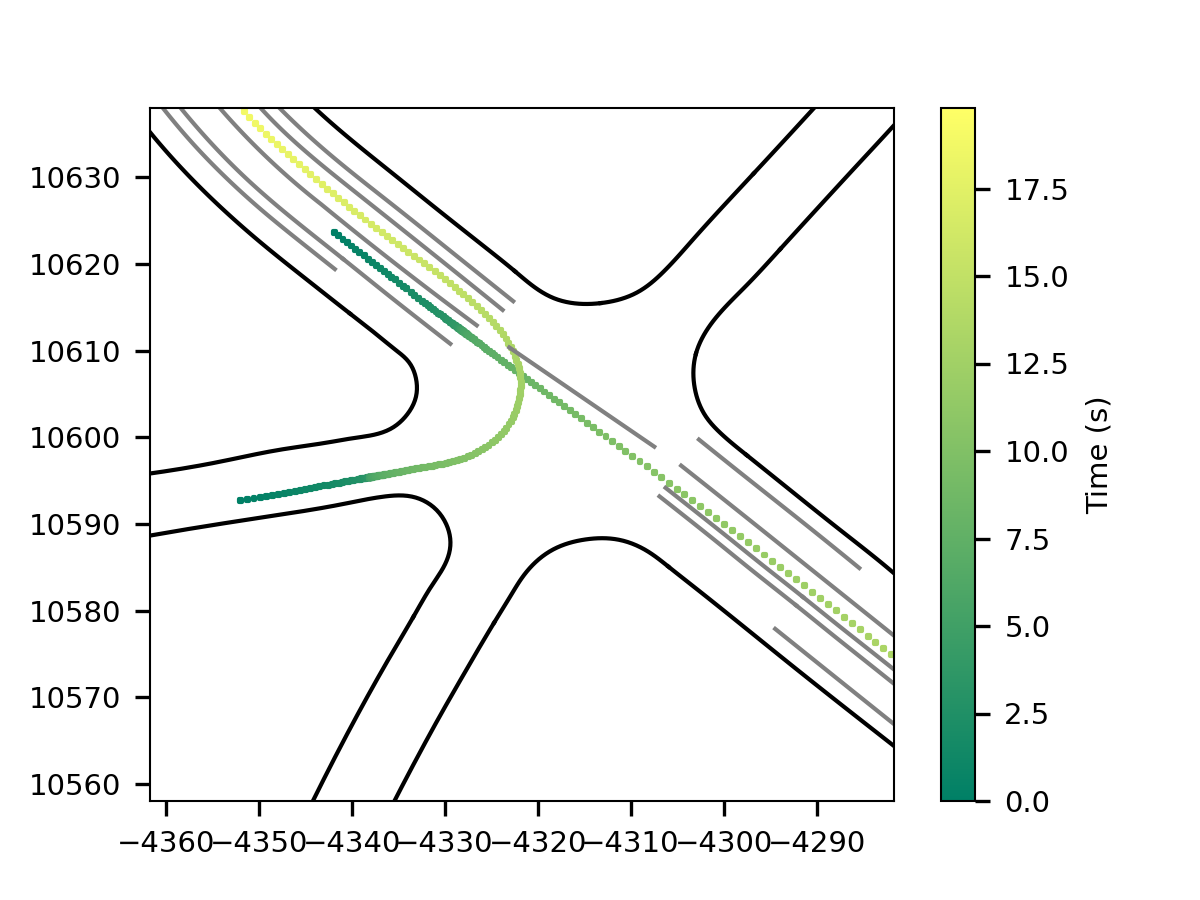
Figure 5 depicts two examples of identified merging and crossing interactions. The color of the points on the trajectory shows the time from the start of the scenario; therefore, the start of the scenario is indicated by a dark green color and the end of the scenario is identified by the light green color. After all, 916 merging conflicts and 807 crossing conflicts at unsignalized intersections were identified in the two datasets. Table 2 presents the number of conflicts per dataset and conflict type. HV-HV refers to conflicts where both interacting vehicles are human-driven vehicles, HV-AV refers to the scenarios where the second vehicle in the conflict (follower) is the autonomous vehicle, and AV-HV refers to the cases where the follower is a human-driven vehicle, but the leader is an AV.
| Crossing | Merging | |||||||
|---|---|---|---|---|---|---|---|---|
| Total | HV-HV | HV-AV | AV-HV | Total | HV-HV | HV-AV | AV-HV | |
| Waymo | 574 | 283 | 142 | 149 | 290 | 107 | 48 | 135 |
| Lyft | 233 | 129 | 66 | 38 | 626 | 330 | 167 | 129 |
| Total | 807 | 412 | 208 | 187 | 916 | 437 | 215 | 264 |
3.3.4 Identifying the Conflict Point
For calculating most of the metrics in this study, we first needed to identify the potential conflict point for each interaction. For crossing scenarios, this process is straightforward as the conflict point occurs where the trajectories of the two vehicles intersect. However, for merging scenarios, the trajectories of the two vehicles might not intersect due to their lateral offset within the lane. To address this, a buffer of 2 meters (1 meter on each side) was added to each vehicle’s trajectory and the first point of contact between the two buffers was identified as the conflict point. This is shown by the red dot in Figure 6.
3.4 Definition of Metrics
In this section, and before diving into the results, we overview the different metrics used for characterizing the driving and conflict resolution behavior of AVs and HVs:
3.4.1 Time to Collision (TTC):
TTC measures the time remaining before a collision would occur if both vehicles maintained their current speed and trajectory. We use the approach proposed by [5] for calculating two-dimensional TTC for merging and crossing interactions. For crossing scenarios, we calculate TTC as:
| (2) |
For merging scenarios:
| (3) |
Where is the distance of the follower to the conflict point, and and are the speeds of the following and leading vehicles, respectively. This approach is consistent with methods employed by the Joint Research Centre of the European Commission [23]. Also, minimum TTC (minTTC), an indicator of conflict severity and risk, is calculated as the minimum value of TTC recorded for an interaction over the duration of the interaction untill the second vehicle passes the conflict point.
3.4.2 Post-Encroachment Time (PET):
PET measures the time difference between the moment the first vehicle leaves the conflict point and the second vehicle arrives at it:
| (4) |
Where is the time the following vehicle arrives at the conflict point, and is the time the leading vehicle leaves the conflict point.
3.4.3 Maximum Required Deceleration to Avoid Collision (MRD):
In this study, we introduce a new metric—MRD—to capture the most critical deceleration required by the following vehicle during its approach to the conflict point. MRD represents the highest deceleration needed by the following vehicle to safely avoid a potential collision while approaching the conflict point. It is calculated based on the required deceleration values at each time instance from when the potential conflict is first observed until the leading vehicle has passed the conflict point. The MRD is defined as the maximum of the required deceleration values during this period:
| (5) |
Where is the speed of the following vehicle and is the distance to the conflict point at each time instance .
Using the maximum value is preferable to aggregating deceleration over time because it highlights the peak demand placed on the vehicle’s braking capabilities. The maximum required deceleration directly reflects the highest risk point in the interaction, making it more informative for safety assessments. In contrast, an aggregated value might smooth out critical moments, potentially underestimating the severity of the situation.
3.4.4 Time Advantage (TA):
TA indicates the time differences between the estimated arrival of the first and the second vehicle at the intersection. Time advantage defines which vehicle arrives first at the conflict point assuming that the two vehicle keep their current speed.
| (6) |
4 Results and Discussions
In this section, we present the results from our analysis of the behavioral adaptations and differences between HVs and AVs at unsignalized intersections. For our analysis, we classify the interactions into three groups:
-
•
HV-HV interactions: These are interactions where both vehicles are human-driven. We analyze these as the baseline to understand typical human driving behaviors at unsignalized intersections. This comparison provides a reference point for evaluating how the introduction of AVs may alter driver behavior and intersection dynamics.
-
•
AV-HV interactions: In these interactions, the first vehicle is autonomous, while the second is human-driven. This configuration is critical for examining how AVs may influence the behavior of human drivers who follow them.
-
•
HV-AV interactions: Here, the first vehicle is human-driven, and the second is autonomous. These interactions allow us to observe how AVs behave when following human drivers. This setup is especially important for understanding how AVs handle situations where they must yield or adjust to the uncertain behaviors of human drivers, providing insights into the adaptability of AV algorithms in mixed traffic.
This classification allows us to systematically explore how AVs and human drivers interact in mixed traffic at unsignalized intersections. By isolating these scenarios, we can assess the impact of AVs on driving behaviors, traffic flow, and safety.
4.1 Post Encroachment Time and Time-to-Collision
PET and TTC are the two most popular safety surrogate measures that are widely used for the safety analysis of interactions and driving behaviors [24, 25]. Low values of PET and TTC are associated with a higher risk of collisions. TTC acts as a proactive measure, providing an estimation of the criticality of the conflict, while PET serves as a retrospective analysis tool, offering insights into near-miss incidents by measuring the observed time gap between vehicles at a conflict point. Figure 7 depicts a joint distribution of PET and minimum observed TTC in HV-HV, AV-HV, and HV-AV interactions.
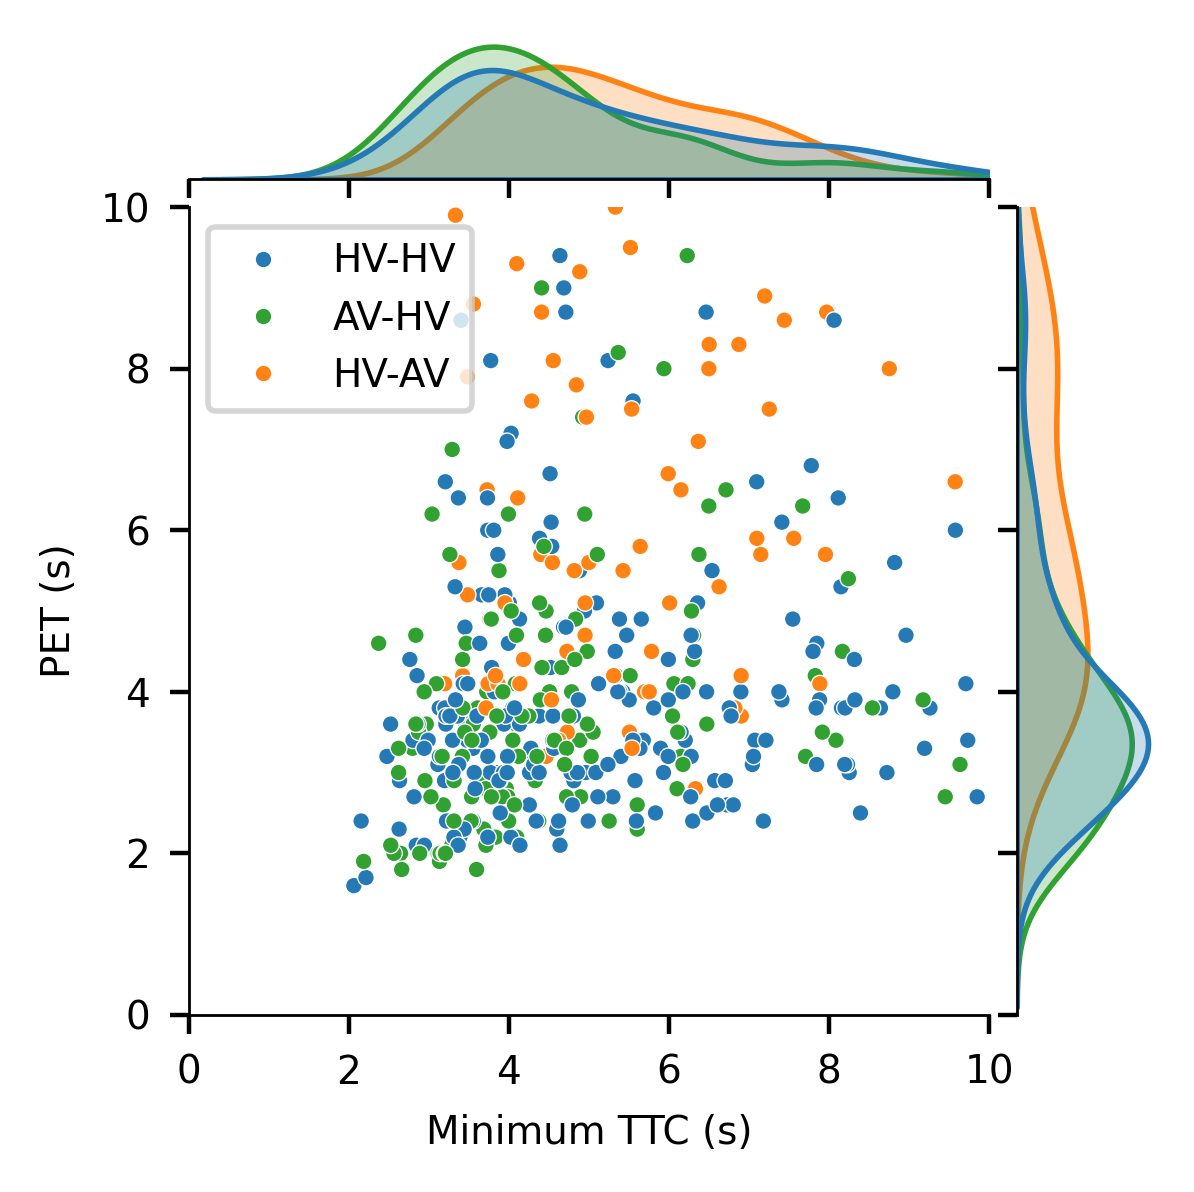
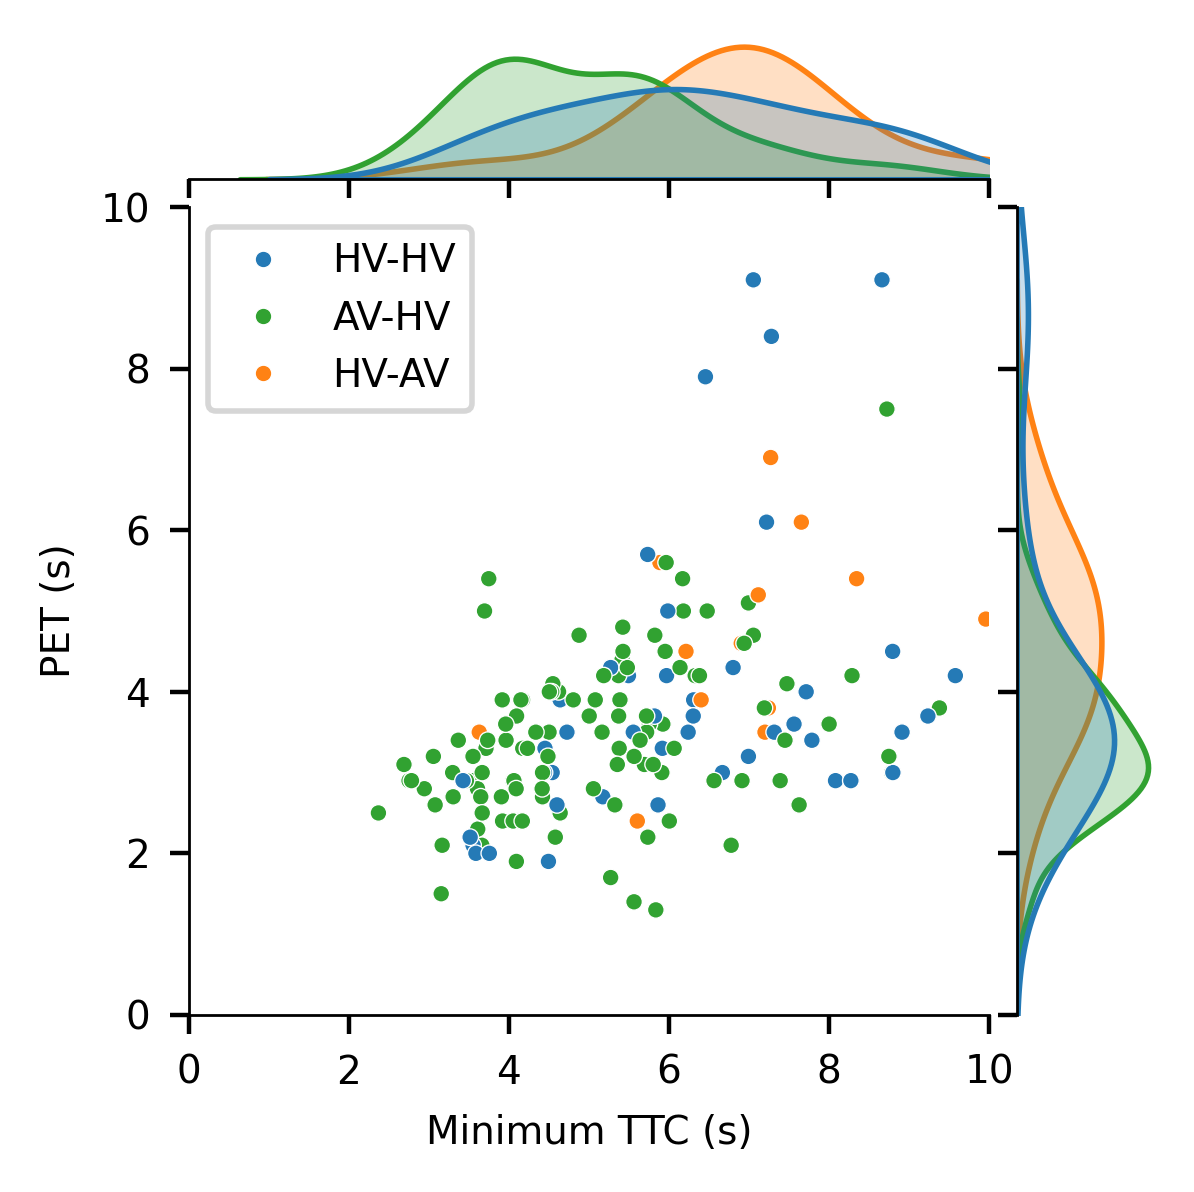
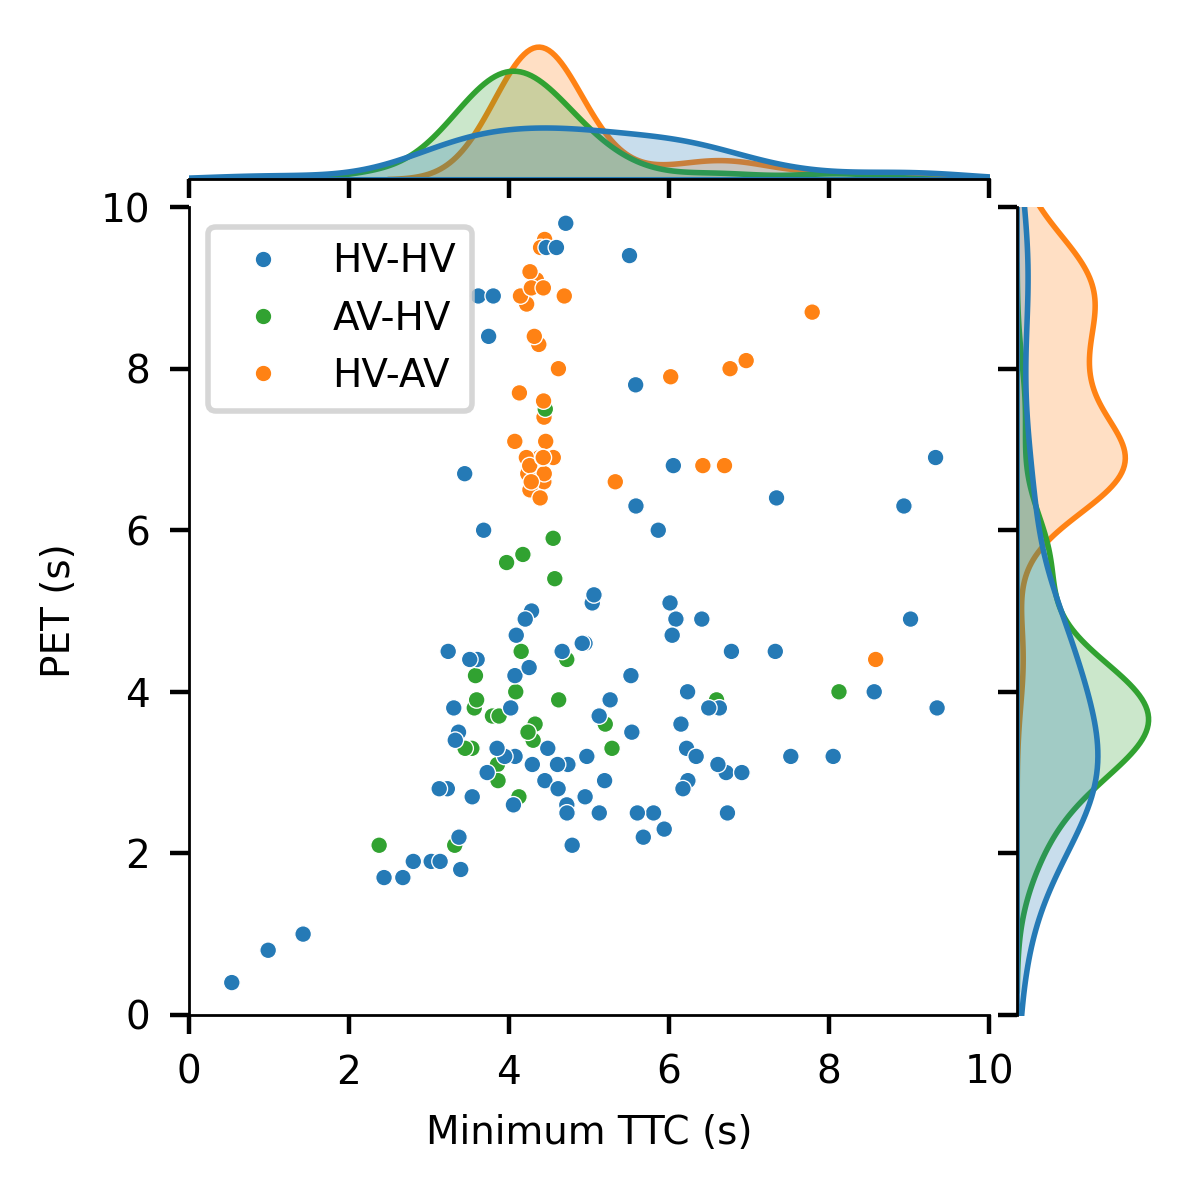
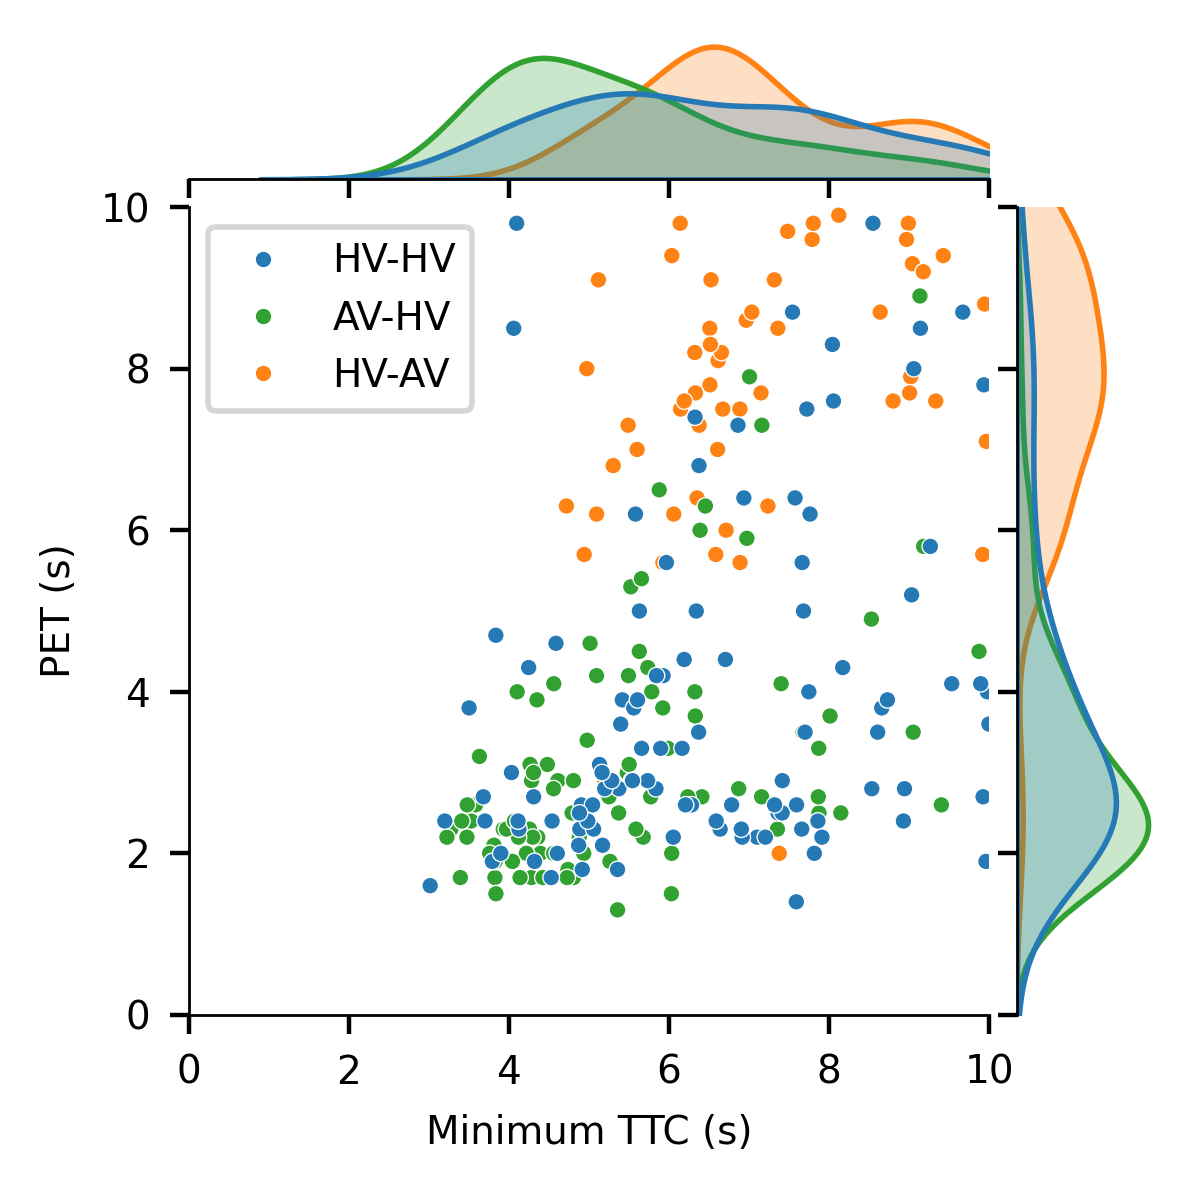
The visual inspection of these plots, accompanied by the results of statistical analysis presented in Table 3 reveal interesting findings. In general, in scenarios where an AV follows an HV (orange dots), higher values of PET and minTTC are observed compared to other conflict types. This trend is evident in both merging and crossing scenarios, indicating that AVs maintain larger safety buffers and show more conservative driving behaviors when trailing HVs. These findings highlight the potential of AVs to enhance safety at unsignalized intersections by maintaining larger safety margins. Nevertheless, this benefit comes with a cost of possible lower efficiency due to larger gaps between the vehicles [10]. This is in line with the observations from the Argoverse dataset proposed by [20].
Interestingly, the differences between AV-HV and HV-HV interactions are less apparent, which suggests that human drivers still show similar and relatively aggressive driving styles when interacting with AVs. However, we observed greater heterogeneity in HV behaviors when interacting with other HVs compared to their interactions with AVs. This encourages the argument that the presence of AVs may contribute to reducing variability in HV behavior at intersections, potentially standardizing traffic flow patterns. This finding aligns with observations from car-following scenarios in the literature [7, 8]. However, such a conclusion needs further investigation into a wider range of scenarios and datasets. All in all, the investigation of PET-minTTc metrics indicates that HV-HV and AV-HV conflicts are more prone to observing safety criticality, which highlights the important of studying the behavior of human drivers in mixed traffic.
| Waymo | Lyft | |||||||
| Crossing | Merging | Crossing | Merging | |||||
| Test | () | p-value | () | p-value | () | p-value | () | p-value |
| PET (s) | ||||||||
| HV-HV | 4.08 (1.52) | 3.97 (1.88) | 4.55 (2.14) | 4.72 (2.45) | ||||
| AV-HV | 3.83 (1.46) | <0.01 | 3.43 (0.97) | <0.01 | 4.03 (1.08) | <0.01 | 3.39 (1.70) | <0.01 |
| HV-AV | 5.33 (1.74) | 4.73 (1.69) | 7.28 (1.08) | 7.14 (1.91) | ||||
| minTTC (s) | ||||||||
| HV-HV | 5.08 (1.84) | 6.30 (1.73) | 4.99 (1.70) | 6.46 (1.81) | ||||
| AV-HV | 4.53 (1.58) | <0.01 | 5.05 (1.49) | <0.01 | 4.30 (1.07) | 0.09 | 5.44 (1.61) | <0.01 |
| HV-AV | 5.37 (1.47) | 6.88 (1.49) | 4.87 (1.10) | 7.09 (1.43) | ||||
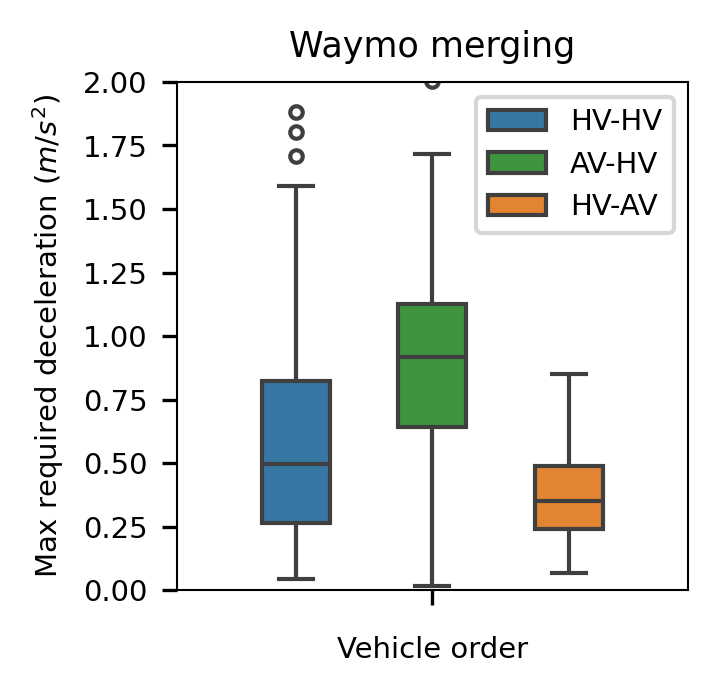
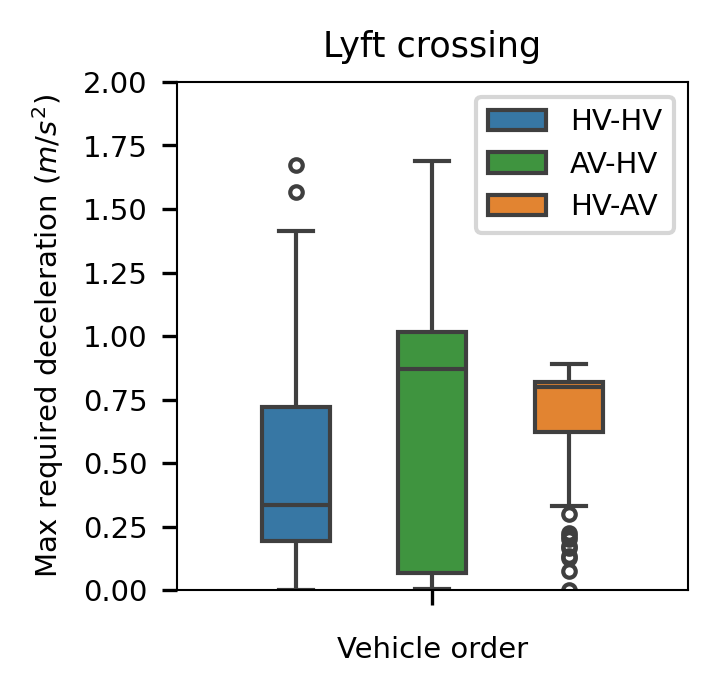
4.2 Maximum Required Deceleration
We employ maximum required deceleration (MRD) as another indication of scenario criticality. Higher values of MRD indicate a harsher possible reaction from the follower considering its current speed and distance to the leader in order to avoid a potential collision. Figure 8 depicts the boxplots of estimated MRD values for the followers before reaching the conflict point, and Table 4 presents the results of statistical tests for evaluating the significance of observed differences. Interestingly, AV-HV interactions show higher values of MRD compared to other interaction types for both merging and crossing scenarios. This might be related to the unexpected behavior of AVs, which can lead to misunderstandings by human drivers. Specifically, human drivers may be uncertain whether the AV is yielding or proceeding, causing hesitation and delayed deceleration. This uncertainty can result in human drivers delay their deceleration, leading to higher MRD values. This observation aligns with reports on crashes involving automated vehicles, where the unexpected behavior of AVs has been identified as a key factor in AV-HV collisions, particularly in rear-end collisions in car-following scenarios [26]. Our findings at unsignalized intersections suggest that similar issues could arise in more complex traffic scenarios as AVs become more prevalent. Moreover, the high dispersion of MRD values in HV-HV and AV-HV scenarios compared to HV-AV scenarios emphasizes the heterogeneity if the following behavior of HVs compared to AVs. This has been reported in studies related to car-following scenarios as well [15, 6].
Comparing the MRD values between the Waymo and Lyft datasets reveals a key distinction. Lyft vehicles, when following HVs, exhibit higher MRD values, suggesting that human drivers are more likely to force Lyft vehicles to yield, often pushing them to decelerate more harshly. This could lead to potentially unsafe situations. In contrast, Waymo vehicles show significantly lower MRD values in HV-AV interactions, indicating they are less often bullyed by human drivers, likely due to their more human-compatible driving style. This observation provides two important insights: First, it highlights the variability in AVs behavior across differetnt manufacturers and its potential impact on traffic safety and dynamics, and second, it underscores the importance of human-predictable decision-making in AVs for their safe and effective integration into mixed traffic environments.
All in all, the MRD analysis, along with PET and TTC observations, indicates that while automated vehicles generally behave more safely and conservatively than human drivers, their decisions and actions may not fully align with human expectations. This misalignment can cause confusion for human drivers, potentially leading to unsafe situations. Furthermore, the overly cautious behavior of AVs can inadvertently provoke aggressive driving styles in human drivers. These findings highlight the need for AVs to adopt behavior that is not only safe but also predictable to human drivers to ensure smooth and safe integration into traffic.


| Waymo | Lyft | |||||||
| Crossing | Merging | Crossing | Merging | |||||
| () | p-value | () | p-value | () | p-value | () | p-value | |
| MRD () | ||||||||
| HV-HV | 0.53 (0.47) | 0.58 (0.41) | 0.47 (0.40) | 0.57 (0.39) | ||||
| AV-HV | 0.69 (0.47) | <0.01 | 0.89 (0.43) | <0.01 | 0.68 (0.48) | <0.01 | 0.83 (0.39) | <0.01 |
| HV-AV | 0.39 (0.28) | 0.38 (0.18) | 0.67 (0.25) | 0.54 (0.23) | ||||
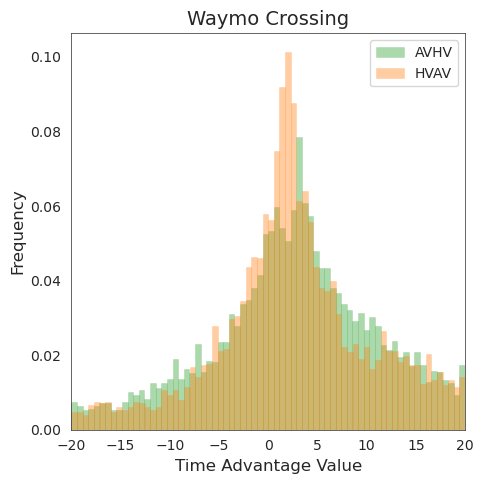
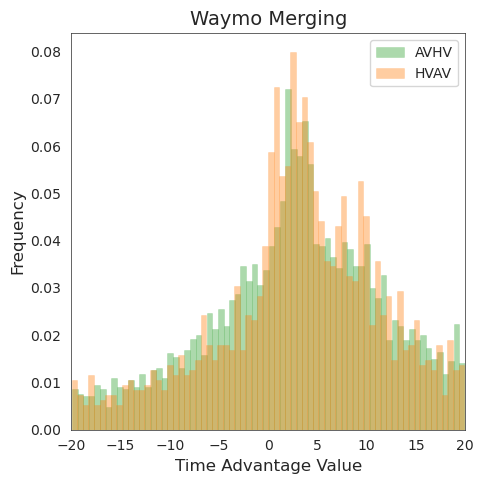
4.3 Time Advantage
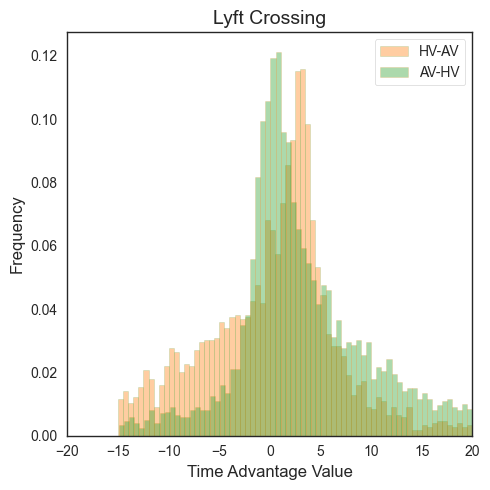
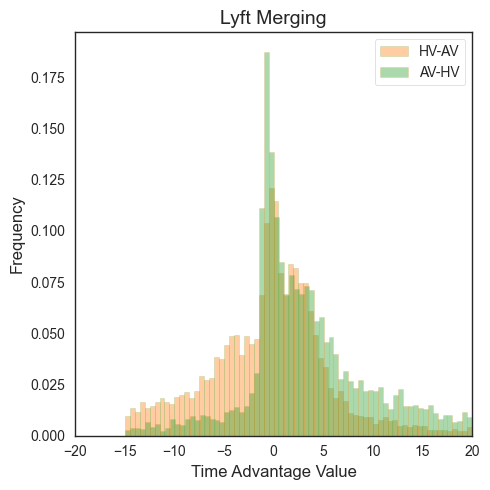
In this study, we propose a novel approach to identify potentially aggressive driving behavior by the “lead vehicle” at intersections. To this end, we utilize the metric called "time advantage" (TA) to estimate which vehicle will reach the intersection first at each time step from when the conflict is detected until the first vehicle finally passes the conflict point. Tracking the TA values as the vehicles approach the intersection allows us to determine which vehicle established a positional advantage during the interaction. For instance, observing frequent negative TA values for the leading vehicle at an interaction suggests that the lead vehicle was initially at a disadvantage (negative TA values) but may have accelerated or otherwise acted aggressively to gain the lead at the conflict point. This allows us to quantify aggressive maneuvers, such as speeding up or forcing the other vehicle to yield.
The TA distributions for HV-AV and AV-HV interactions for both Waymo and Lyft vehicles are depicted in Figure 9. Also, the statistical tests for comparing these distributions are provided in Table 5. These analyses reveal interesting patterns: The distribution of TA values for Waymo vehicles when being the leader in an interaction closely resembles that of human drivers in comparable situations. This suggests that Waymo vehicles show human-comparable behaviors during the negotiation phase when approaching the intersection. In contrast, the distribution of TA values for Lyft vehicles differs significantly from human drivers (Table 5. Visual inspection of the distributions suggests that human drivers tend to take advantage of Lyft vehicles more often than Waymo vehicles in both merging and crossing conflicts (as shown by the more frequent occurrence of negative TA values when the human driver ultimately becomes the leader in the interaction (HV-AV)). This could be due to Lyft’s more conservative driving style. These observations about the behavior of Waymo and Lyft vehicles are in line with previous observations in Section 4.2, where Lyft vehicles often exhibited higher MRD values, indicating a need for harder braking to avoid collisions, likely due to more aggressive driving from human drivers.
| Waymo | Lyft | |||||||
| Crossing | Merging | Crossing | Merging | |||||
| Test | Statistic | p-value | Statistic | p-value | Statistic | p-value | Statistic | p-value |
| Kolmogorov- | ||||||||
| Smirnov | 0.133 | 0.825 | 0.147 | 0.863 | 0.184 | 0.000 | 0.250 | 0.000 |
| Anderson- | ||||||||
| Darling | -0.179 | 0.250 | -0.701 | 0.250 | 173.958 | 0.001 | 500.884 | 0.001 |
4.4 Speed and Acceleration Analysis
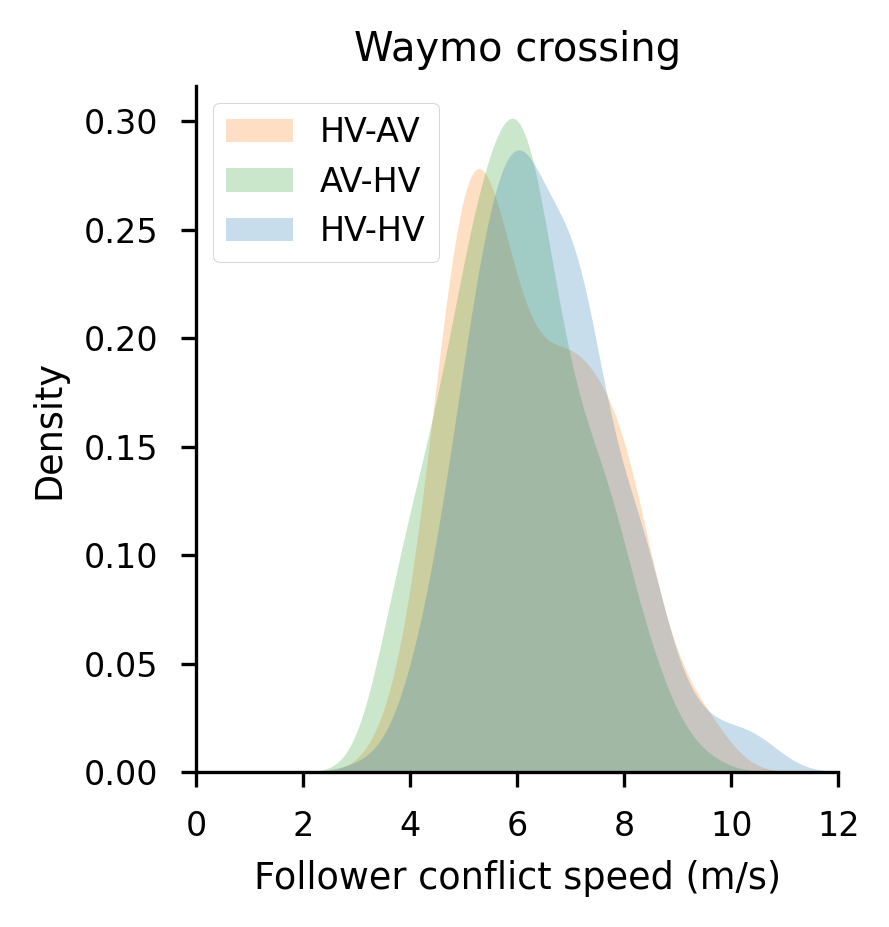
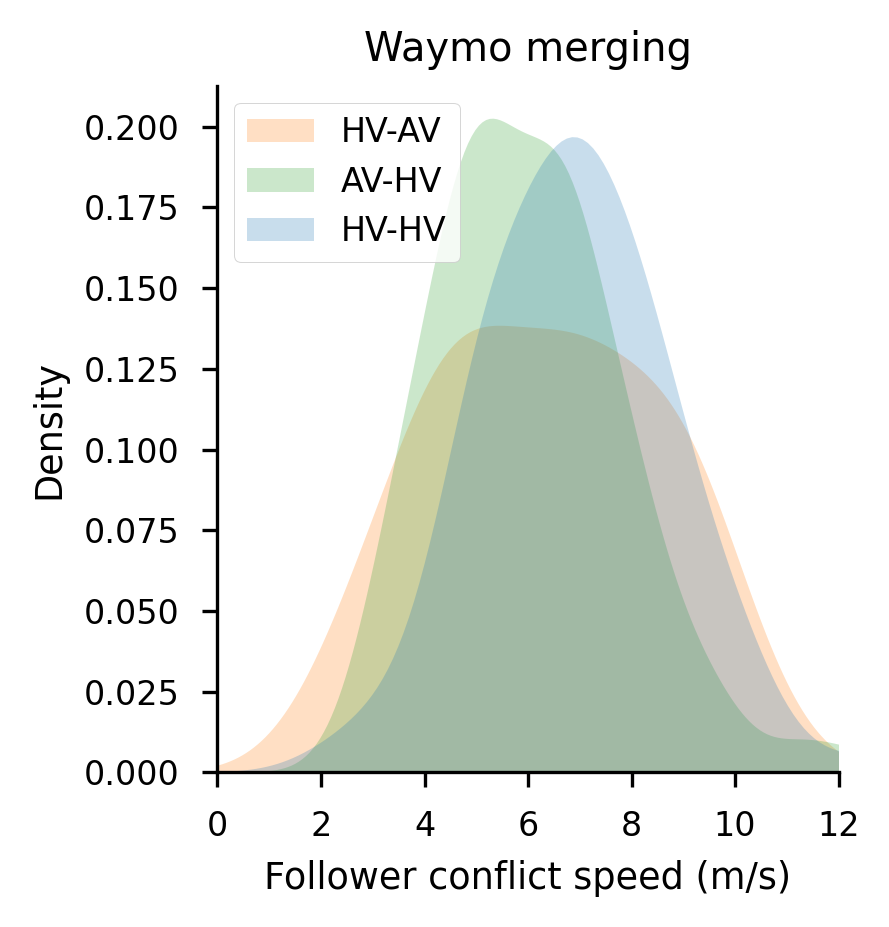
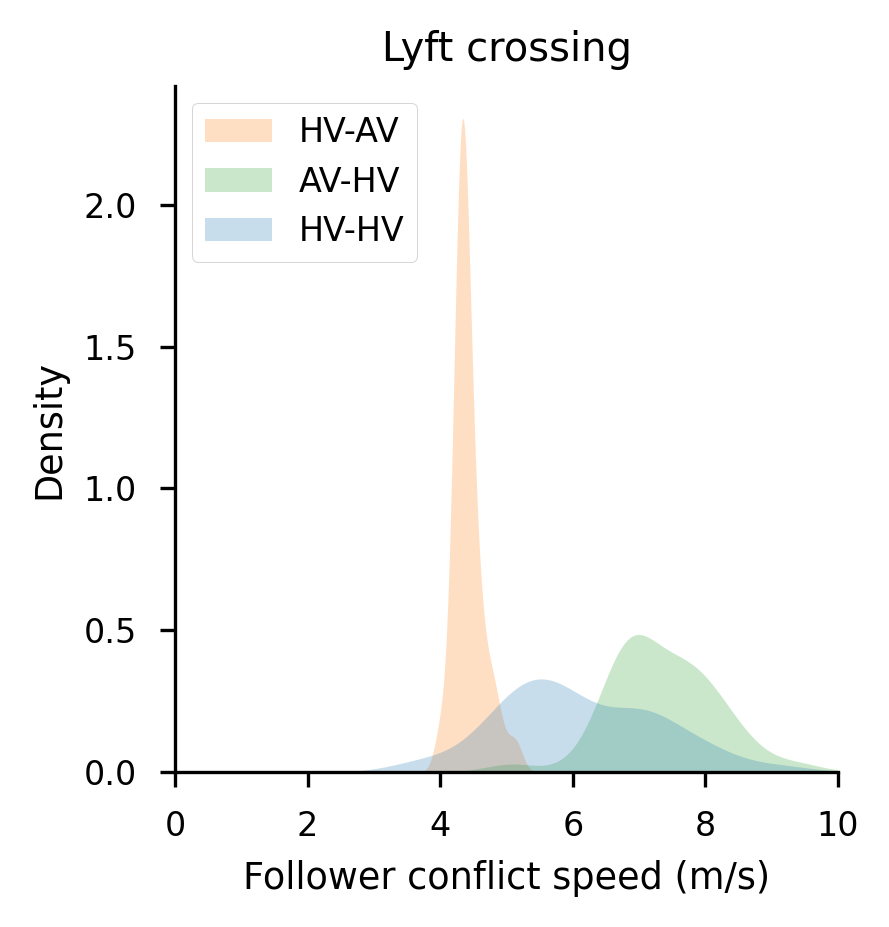
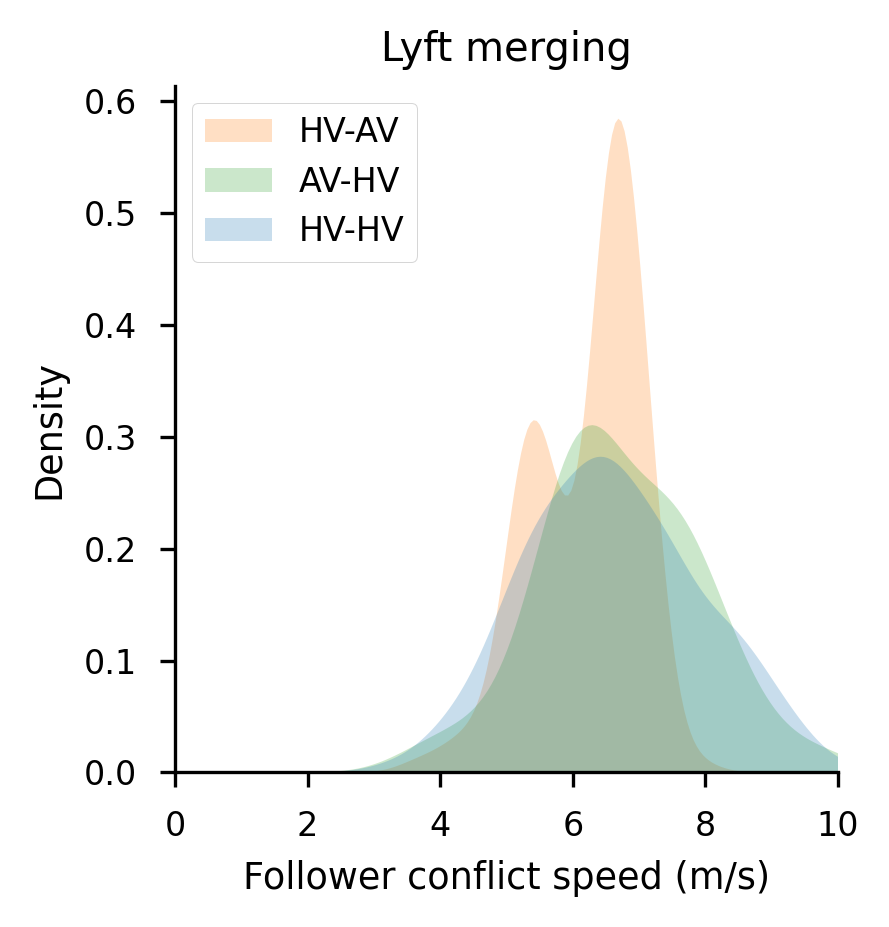
The speed of vehicles within the intersection and their acceleration behavior are important aspects that can be used both for studying the safety and efficiency of the intersection and for the calibration of microscopic traffic flow models. Our analysis of these metrics focuses on two aspects: the follower’s speed at the conflict point, which serves as an indicator of the aggressiveness of the following vehicle in an interaction; and the speed and acceleration profiles from a standstill, which influence traffic efficiency and performance.
The analysis of follower speed at the conflict point, depicted in Figure 10 and Table 6 reveals differences not only between AVs and HVs but also between the Waymo and Lyft vehicles. In the Lyft dataset, we observe that the speed of AVs at the conflict point is generally lower and more harmonized compared to HVs, especially for crossing conflicts. Conversely, Waymo’s autonomous vehicles exhibited speeds similar to those of human drivers, with comparable levels of heterogeneity. This finding suggests that Lyft’s autonomous vehicles adopt a more conservative approach when navigating unsignalized intersections and entering the conflict zone, while the Waymo vehicle shows a more human-like behavior. These contrasting findings highlight the ongoing debate in AV development between prioritizing safety through conservative behavior or maintaining traffic efficiency by mimicking human driving styles. The Lyft approach may lead to potentially increased safety but could negatively impact traffic flow if widely adopted. On the other hand, Waymo’s approach may facilitate smoother integration with human-driven traffic but might not fully leverage the potential safety benefits of AVs.
| Waymo | Lyft | |||||||
| Crossing | Merging | Crossing | Merging | |||||
| Test | () | p-value | () | p-value | () | p-value | () | p-value |
| Speed of the Follower (m/s) | ||||||||
| HV-HV | 6.53 (1.36) | 7.08 (2.16) | 6.12 (1.20) | 6.64 (1.36) | ||||
| AV-HV | 5.99 (1.26) | <0.01 | 6.06 (1.82) | <0.01 | 7.36 (0.80) | <0.01 | 6.80 (1.39) | <0.01 |
| HV-AV | 6.28 (1.37) | 6.34 (2.23) | 4.43 (0.22) | 6.25 (0.87) | ||||
| Average Speed (m/s) | ||||||||
| HV-HV | 3.40 (0.71) | 4.00 (3.76) | 3.25 (1.08) | 3.81 (1.38) | ||||
| AV-HV | 3.20 (0.67) | 0.01 | 3.70 (1.36) | 0.18 | 3.80 (1.77) | <0.01 | 4.04 (2.28) | <0.01 |
| HV-AV | 3.20 (0.40) | 3.50 (1.34) | 2.29 (0.03) | 2.91 (0.16) | ||||
| Average Acceleration () | ||||||||
| HV-HV | 1.20 (0.62) | 0.60 (0.48) | 0.80 (0.45) | 0.54 (0.46) | ||||
| AV-HV | 0.80 (0.62) | <0.01 | 0.60 (0.66) | <0.01 | 0.83 (0.69) | 0.94 | 0.48 (0.44) | <0.01 |
| HV-AV | 1.30 (0.12) | 1.00 (0.29) | 0.81 (0.01) | 0.93 (0.01) | ||||
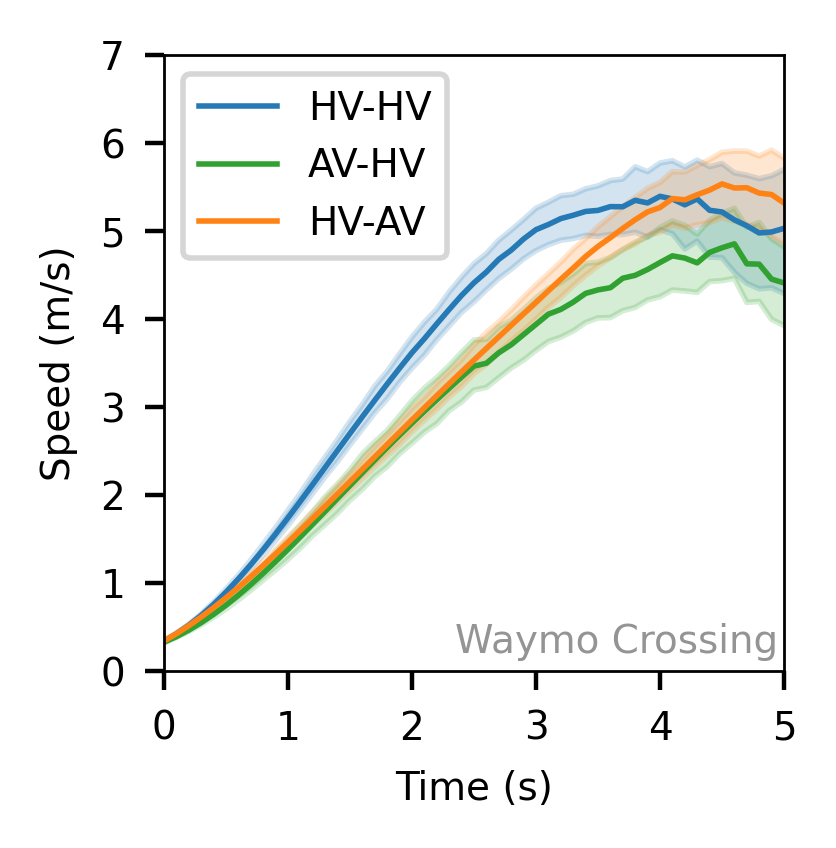
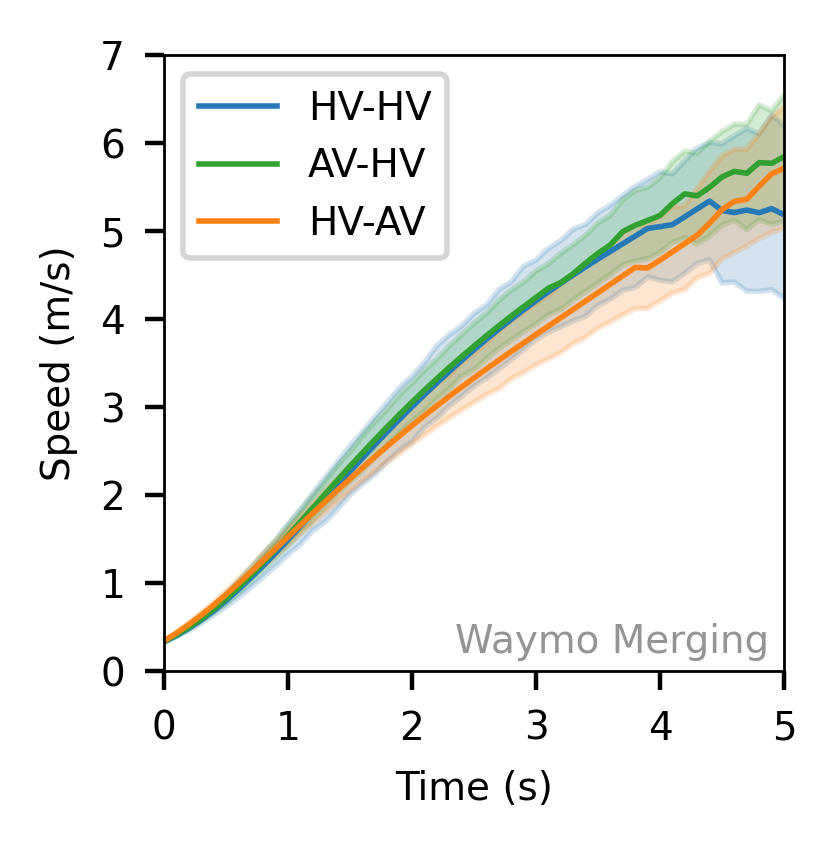
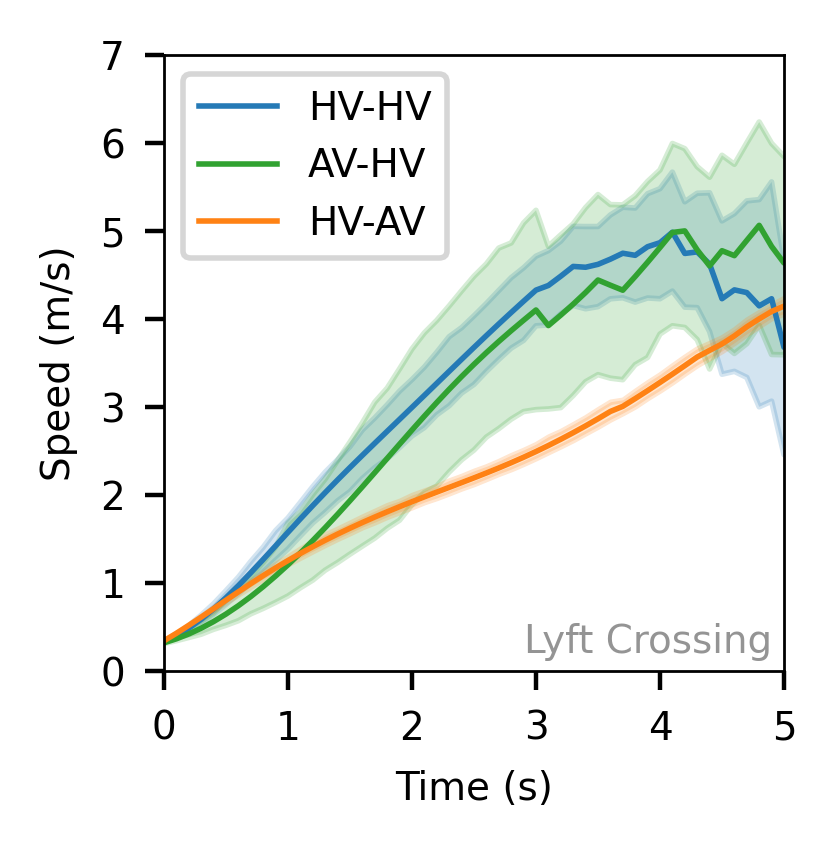
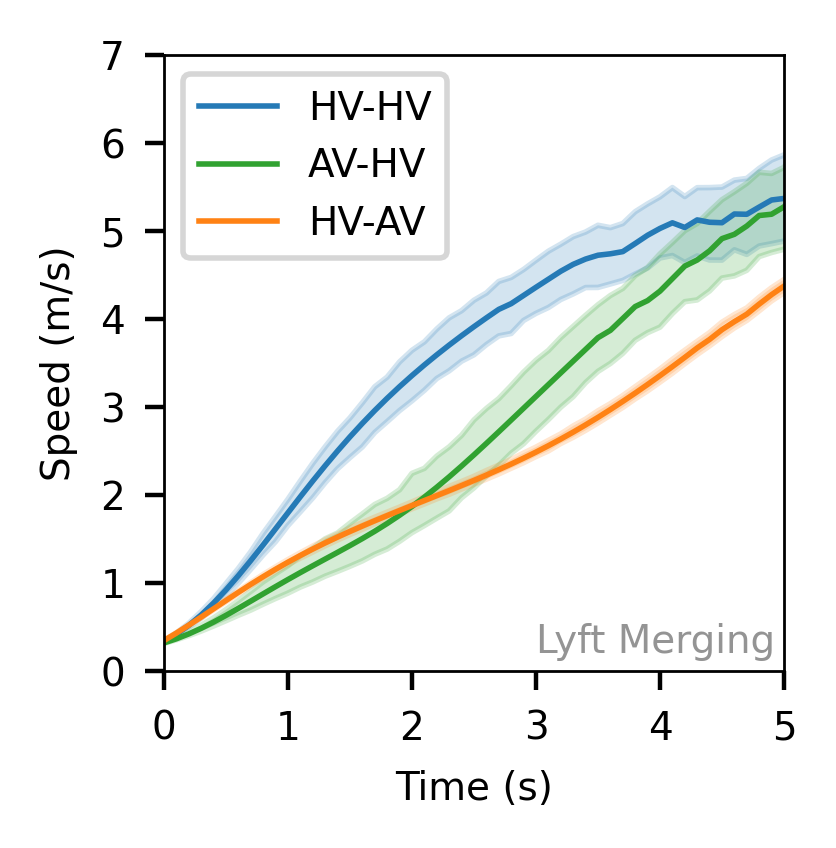
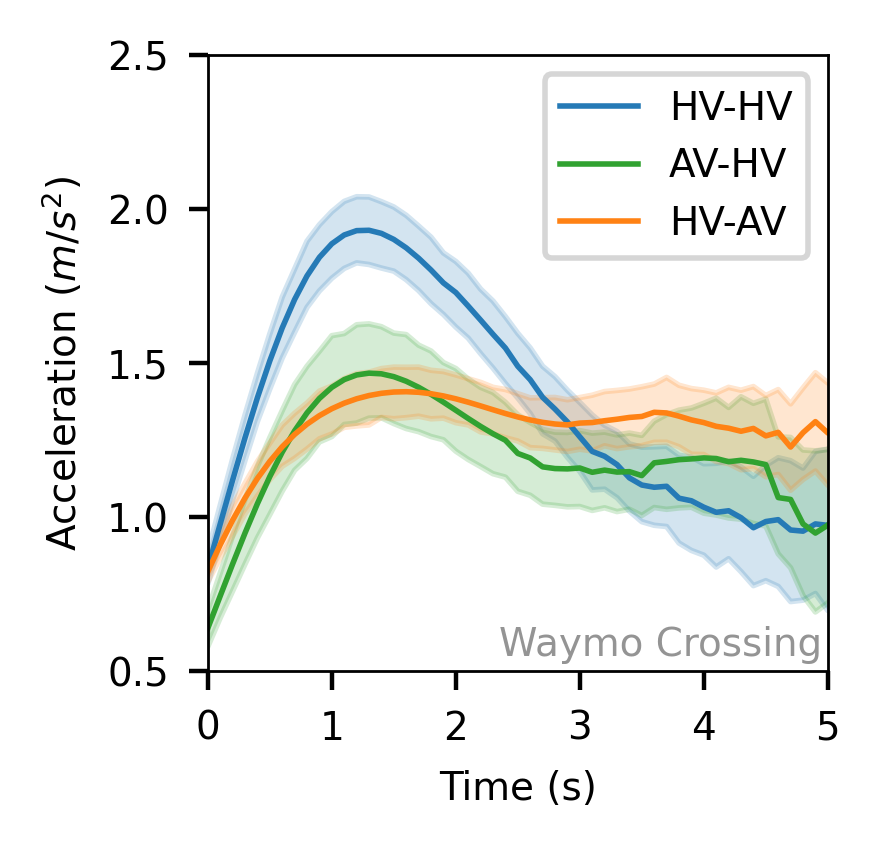
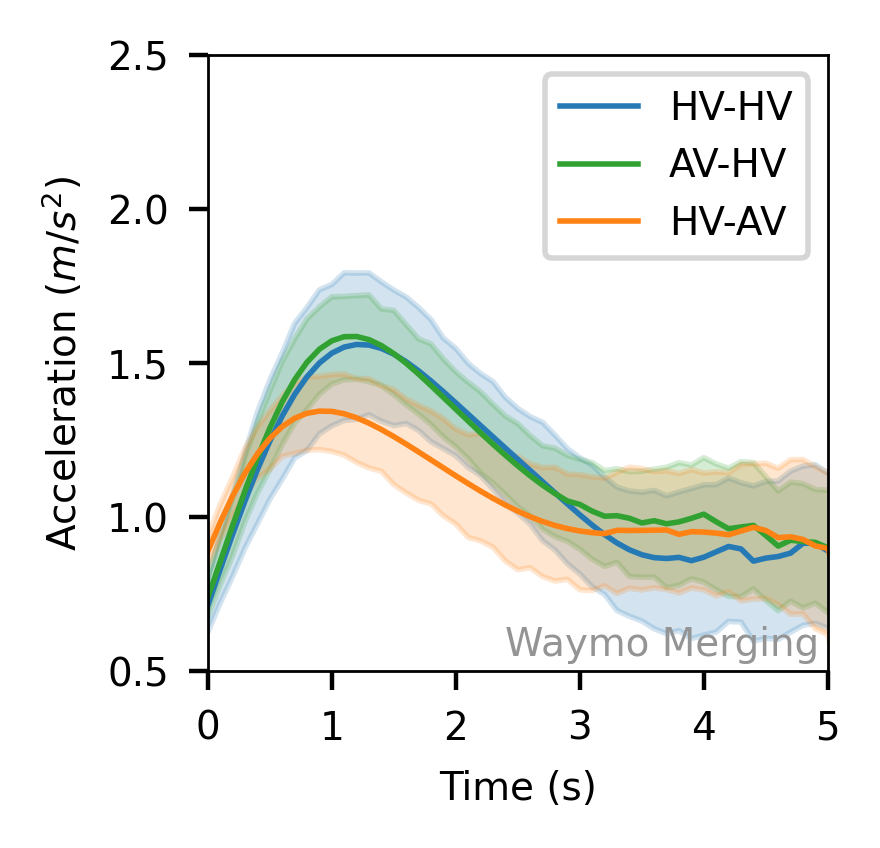
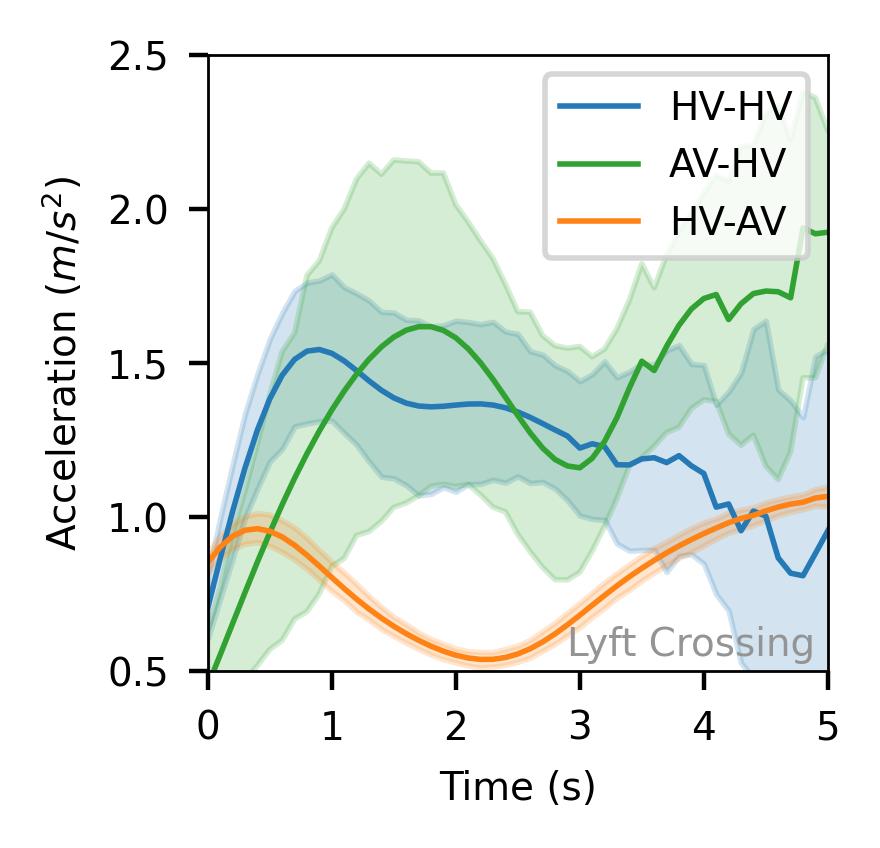
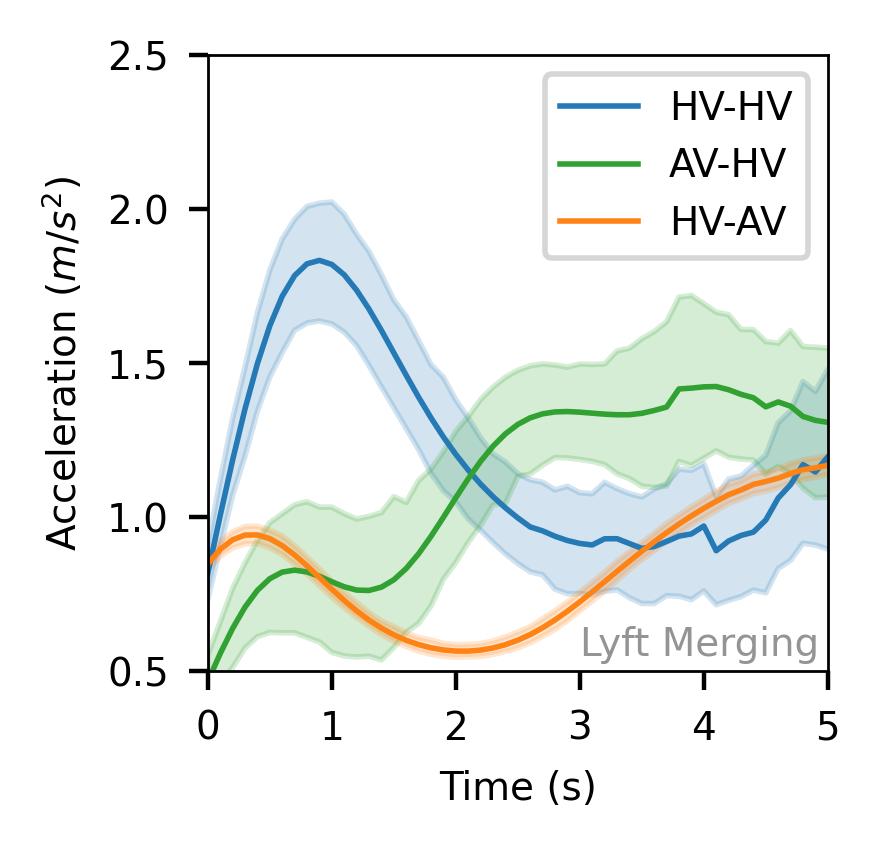
In the next step, the speed and acceleration profiles of the following vehicle when starting from a standstill are investigated. Figure 11 presents these profiles, along with 95% confidence intervals, and Table 6 provides the statistical tests evaluating the significance of the observed differences. The results indicate that the speed and acceleration profiles of Waymo vehicles are more closely aligned with those of human drivers, while Lyft vehicles exhibit significantly different patterns. Additionally, the Lyft vehicles show more uniform speed profiles with a gentler slope compared to both human drivers and Waymo vehicles.
Examination of the acceleration profiles yields noteworthy insights as well. Waymo vehicles display an overall acceleration pattern similar to human-driven vehicles, characterized by a rapid initial increase followed by sustained low acceleration. In contrast, Lyft vehicles exhibit a unique acceleration profile. It begins with significantly lower acceleration, experiences a slight decrease midway through the profile, and ends with a mild increase. This unique behavior is probably related to the cautious behavior of the Lyft vehicles to make sure the intersection is safe to pass. Additionally, the acceleration profiles of human-driven vehicles in AV-HV interactions within the Lyft dataset indicate greater variability and uncertainty when interacting with Lyft vehicles. This may stem from the unfamiliar and overly cautious behavior of Lyft AVs, which human drivers might find harder to predict.
Overall, the speed and acceleration analysis from the Waymo and Lyft datasets reveals both contrasting and consistent behaviors. While AVs generally exhibit more uniform and stable behavior, which could improve traffic efficiency, the overly cautious driving style observed in Lyft vehicles raises concerns about whether such conservative behavior might undermine efficiency and provoke unexpected responses from human drivers.
5 Summary of Findings
This section summarizes the main findings of this study. The analysis of two large-scale AV datasets revealed that AVs generally maintain larger safety margins compared to HVs, especially when interacting as followers. This is evidenced by higher Post-Encroachment Time and minimum Time to Collision values when AVs trail HVs. This conservative approach by AVs can potentially contribute to increased safety at intersections; however, this benefit might come with the cost of some reduction in traffic efficiency. The findings also suggest that although human drivers may tend to exhibit more consistent and less variable behavior when interacting with AVs, this consistency appears to be influenced by the specific behavior of the AVs themselves. Therefore, a general statement cannot be made across all AV types. The extent to which AVs contribute to standardizing traffic flow patterns and improving safety and efficiency at intersections is likely dependent on how predictable and human-compatible the AV’s driving style is.
This study also highlights potential challenges associated with the integration of AVs into mixed traffic. Analysis of the maximum required deceleration (MRD) reveals that human drivers following AVs (HV-AV) frequently need to apply more abrupt deceleration rates compared to HV-HV interactions. This observation may be attributed to the unfamiliar or unexpected behavior of AVs, which can potentially lead to misinterpretations and elevated risks for human drivers. These findings highlight a paradox in the analysis of mixed traffic flow: while AVs generally maintain larger safety margins, their different driving style can lead to unexpected situations for human drivers, potentially causing unsafe situations. Also, overly cautious driving style from AVs can lead to aggressive driving from human drivers.
Finally, this study reveals remarkable differences between the behavior of Waymo and Lyft vehicles when interacting with HVs at unsignalized intersections. While Lyft AVs demonstrated more conservative behaviors, Waymo AVs exhibited behaviors more similar to human drivers and less conservative compared to the Lyft vehicle. Moreover, although the behavior of AVs was shown to be more harmonized and homogeneous in different scenarios compared to HVs, Lyft vehicles showed more consistent and harmonized behaviors compared to Waymo vehicles. These findings underscore the importance of considering manufacturer-specific AV behavior in traffic modeling and management strategies, which is often negelected when evaluating the impacts of AVs on traffic flow efficiency and performance.
6 Conclusion
This study provides an in-depth examination of the interactions between AVs and HVs at unsignalized intersections by utilizing real-world large-scale datasets from Waymo and Lyft. The research underscores the intricate dynamics present in mixed traffic environments, highlighting the importance of understanding the mutual influence of AVs and human drivers. By evaluating key safety metrics such as Time to Collision (TTC), Post-Encroachment Time (PET), Maximum Required Deceleration (MRD), and Time Advantage (TA), this study sheds light on the behavioral differences and adaptations between AVs and HVs. One of the key findings of this study is that AVs tend to maintain larger safety margins than HVs, which enhances safety but may also reduce traffic efficiency. However, the research also reveals that human drivers exhibit more consistent behavior when interacting with AVs, suggesting that AVs could standardize traffic flow patterns at intersections. This potential for hormonization indicates a positive influence of AVs on overall traffic dynamics. The study further identifies significant differences between the behaviors of Waymo and Lyft AVs. Waymo vehicles tend to mimic human driving behaviors more closely, leading to smoother integration with human traffic. In contrast, Lyft vehicles display more conservative driving patterns, which may increase safety but at the cost of potential inefficiencies in traffic flow. These differences underscore the importance of considering manufacturer-specific behaviors in traffic modeling and management strategies. Despite the promising findings, the study also highlights potential challenges. The unexpected behaviors of AVs can lead to misunderstandings and increased risk for human drivers, as indicated by higher MRD values in AV-HV interactions. This paradox of maintaining safety margins while potentially causing unsafe situations due to unpredictability underscores the need for improved AV algorithms that align more closely with human expectations.
While this study provides valuable insights into the interactions between AVs and HVs at unsignalized intersections, several limitations must be acknowledged. The findings are based solely on two datasets from Waymo and Lyft, which, while comprehensive, may not fully represent the diverse range of driving behaviors and conditions present in real-world traffic environments. These datasets primarily capture urban driving scenarios and may not account for variations in traffic density, road types, or regional driving habits. To build on these findings, future research should incorporate more diverse datasets that include a broader spectrum of traffic and environmental conditions. This would enable a more robust understanding of AV-HV interactions across various contexts.
References
- [1] Reuters Staff. Tesla delays robotaxi launch to october from august: Bloomberg news reports, 2024. Accessed: 2024-09-08.
- [2] Bloomberg News. Amazon’s zoox is almost ready to launch its robotaxi service, 2024. Accessed: 2024-09-08.
- [3] Yalda Rahmati, Mohammadreza Khajeh Hosseini, Alireza Talebpour, Benjamin Swain, and Christopher Nelson. Influence of autonomous vehicles on car-following behavior of human drivers. Transportation research record, 2673(12):367–379, 2019.
- [4] Yiru Jiao, Guopeng Li, Simeon C Calvert, Sander van Cranenburgh, and Hans van Lint. Beyond behavioural change: Investigating alternative explanations for shorter time headways when human drivers follow automated vehicles. Transportation Research Part C: Emerging Technologies, 164:104673, 2024.
- [5] Giovanni Albano, Konstantinos Mattas, Riccardo Donà, Sandor Vass, Ricardo Suarez-Bertoa, Maria Cristina Galassi, and Biagio Ciuffo. Drivers’ behavior at unsignalized intersections: An empirical analysis and derivation of requirements for the european regulation 1426/2022 concerning the type-approval of automated driving systems. Data Science for Transportation, 6(1):3, 2024.
- [6] Zheng Ma and Yiqi Zhang. Driver-automated vehicle interaction in mixed traffic: Types of interaction and drivers’ driving styles. Human factors, 66(2):544–561, 2024.
- [7] Xiao Wen, Zhiyong Cui, and Sisi Jian. Characterizing car-following behaviors of human drivers when following automated vehicles using the real-world dataset. Accident Analysis & Prevention, 172:106689, 2022.
- [8] Ruixuan Zhang, Sara Masoud, and Neda Masoud. Impact of autonomous vehicles on the car-following behavior of human drivers. Journal of transportation engineering, Part A: Systems, 149(3):04022152, 2023.
- [9] Xiao Wen, Sisi Jian, and Dengbo He. Modeling the effects of autonomous vehicles on human driver car-following behaviors using inverse reinforcement learning. IEEE Transactions on Intelligent Transportation Systems, 2023.
- [10] Guopeng Li, Yiru Jiao, Victor L Knoop, Simeon C Calvert, and JWC Van Lint. Large car-following data based on lyft level-5 open dataset: Following autonomous vehicles vs. human-driven vehicles. In 2023 IEEE 26th International Conference on Intelligent Transportation Systems (ITSC), pages 5818–5823. IEEE, 2023.
- [11] Xiangwang Hu, Zuduo Zheng, Danjue Chen, and Jian Sun. Autonomous vehicle’s impact on traffic: Empirical evidence from waymo open dataset and implications from modelling. IEEE Transactions on Intelligent Transportation Systems, 24(6):6711–6724, 2023.
- [12] Jing Zhao, Victor L Knoop, and Meng Wang. Two-dimensional vehicular movement modelling at intersections based on optimal control. Transportation Research Part B: Methodological, 138:1–22, 2020.
- [13] Saeed Rahmani, Jan Neumann, Lucas Elbert Suryana, Christiaan Theunisse, Simeon C Calvert, and Bart Van Arem. A bi-level real-time microsimulation framework for modeling two-dimensional vehicular maneuvers at intersections. In 2023 IEEE 26th International Conference on Intelligent Transportation Systems (ITSC), pages 4221–4226. IEEE, 2023.
- [14] Shubham Soni, Nagarjun Reddy, Anastasia Tsapi, Bart van Arem, and Haneen Farah. Behavioral adaptations of human drivers interacting with automated vehicles. Transportation research part F: traffic psychology and behaviour, 86:48–64, 2022.
- [15] Xiangmo Zhao, Zhen Wang, Zhigang Xu, Yu Wang, Xiaopeng Li, and Xiaobo Qu. Field experiments on longitudinal characteristics of human driver behavior following an autonomous vehicle. Transportation research part C: emerging technologies, 114:205–224, 2020.
- [16] Xiangwang Hu, Zuduo Zheng, Danjue Chen, Xi Zhang, and Jian Sun. Processing, assessing, and enhancing the waymo autonomous vehicle open dataset for driving behavior research. Transportation Research Part C: Emerging Technologies, 134:103490, 2022.
- [17] Jieru Mei, Alex Zihao Zhu, Xinchen Yan, Hang Yan, Siyuan Qiao, Liang-Chieh Chen, and Henrik Kretzschmar. Waymo open dataset: Panoramic video panoptic segmentation. In European Conference on Computer Vision, pages 53–72. Springer, 2022.
- [18] John Houston, Guido Zuidhof, Luca Bergamini, Yawei Ye, Long Chen, Ashesh Jain, Sammy Omari, Vladimir Iglovikov, and Peter Ondruska. One thousand and one hours: Self-driving motion prediction dataset. In Conference on Robot Learning, pages 409–418. PMLR, 2021.
- [19] Benjamin Wilson, William Qi, Tanmay Agarwal, John Lambert, Jagjeet Singh, Siddhesh Khandelwal, Bowen Pan, Ratnesh Kumar, Andrew Hartnett, Jhony Kaesemodel Pontes, et al. Argoverse 2: Next generation datasets for self-driving perception and forecasting. arXiv preprint arXiv:2301.00493, 2023.
- [20] Guopeng Li, Yiru Jiao, Simeon C Calvert, and JWC van Lint. A comparative conflict resolution dataset derived from argoverse-2: Scenarios with vs. without autonomous vehicles. arXiv preprint arXiv:2308.13839, 2023.
- [21] Shuoxuan Dong, Yang Zhou, Tianyi Chen, Shen Li, Qiantong Gao, and Bin Ran. An integrated empirical mode decomposition and butterworth filter based vehicle trajectory reconstruction method. Physica A: Statistical Mechanics and its Applications, 583:126295, 2021.
- [22] A Shahana and Vedagiri Perumal. Spatiotemporal variation of traffic conflict at signalized intersections under non-lane-based traffic condition. Transportation research record, 2677(1):326–340, 2023.
- [23] Biagio Ciuffo, Riccardo Donà, Maria Cristina Galassi, Walter Giannotti, Calogero Sollima, Fulvio Terzuoli, Sandor Vass, et al. Interpretation of eu regulation 2022/1426 on the type approval of automated driving systems. Technical report, EU: European Union, 2024.
- [24] Chen Wang, Yuanchang Xie, Helai Huang, and Pan Liu. A review of surrogate safety measures and their applications in connected and automated vehicles safety modeling. Accident Analysis & Prevention, 157:106157, 2021.
- [25] Kaan Ozbay, Hong Yang, Bekir Bartin, and Sandeep Mudigonda. Derivation and validation of new simulation-based surrogate safety measure. Transportation research record, 2083(1):105–113, 2008.
- [26] Alexandra M Boggs, Behram Wali, and Asad J Khattak. Exploratory analysis of automated vehicle crashes in california: A text analytics & hierarchical bayesian heterogeneity-based approach. Accident Analysis & Prevention, 135:105354, 2020.