Direct High-resolution Observation of Feedback and Chemical Enrichment in the Circumgalactic Medium at Redshift 2.8
Abstract
Context. Although the circumgalactic medium (CGM) plays a vital role in galaxy evolution, studying the emission from CGM is challenging due to its low surface brightness and the complexities involved in interpreting resonant lines like Lyman-alpha (Ly ).
Aims. The near-infrared coverage, unprecedented sensitivity, and high spatial resolution of the James Webb Space Telescope (JWST) enable us to study the optical strong lines associated with the extended Ly “nebulae” at redshift 2–3. These lines serve as diagnostic tools to infer the physical conditions in the massive CGM gas reservoir of these systems.
Methods. In deep medium-band images taken by the JWST, we serendipitously discover the [O iii] emission from the CGM surrounding a massive interacting galaxy system at redshift , known to be embedded in a bright extended (100 kpc) Ly “nebula”.
Results. This is the first time that the [O iii] lines are detected from a Ly “nebula”, and the JWST images reveal that the CGM gas actually resides in narrow ( 2.5 kpc) filamentary structures with strong [O iii] emission, tracing the same extent as the Ly emission. Analysis of the [O iii] suggests that the emitting CGM is fully ionized and is energetically dominated by mechanical heating. We also find that the inferred density and pressure are higher than those commonly predicted by simulations of the CGM.
Conclusions. We conclude that the observed CGM emission originates from the gas expelled by the episodic feedback processes, cooling down and enriching the CGM, while travelling to a distance of at least 60 kpc. These observations demonstrate how fierce feedback processes shape gas distribution and properties in the CGM around massive halos. While the deep high-resolution imaging opens up a new discovery space for investigating the CGM, it also challenges numerical simulations to explain and reproduce the exquisitely complex structures revealed by the observations.
Key Words.:
ISM: jets and outflows – Galaxies: intergalactic medium – Galaxies: active – Galaxies: interactions1 Introduction
The circumgalactic medium fuels the growth of the host galaxies and recycles the material ejected by feedback due to star formation or active galactic nucleus (AGN) feedback. The physical conditions and chemical enrichment of the CGM therefore reflect the evolutionary history of the galaxy and herald its further growth (Oppenheimer et al., 2010; Tumlinson et al., 2017). Using the Ly line, past studies have had great success in finding the “cool” ( K) phase of the CGM (e.g. Cantalupo et al., 2014; Martin et al., 2015; Borisova et al., 2016; Wisotzki et al., 2016), which is hypothesized to be the gas being accreted onto the host galaxies (Kereš et al., 2005; Sancisi et al., 2008). The extended Ly emission is now routinely found around galaxies at redshift where the Ly line is accessible from the ground, and can extend to beyond 100 kpc (Ly “nebulae”) around quasars (Borisova et al., 2016; Arrigoni Battaia et al., 2019; Cai et al., 2019; Farina et al., 2019) or galaxy clusters and protoclusters (Matsuda et al., 2011; Umehata et al., 2019; Daddi et al., 2022).
However, the interpretation of Ly is complicated by its resonant nature, and efforts have been invested in exploring other lines, including UV resonant lines such as He ii , C iv , Mg ii , and optical strong lines including H , [O ii] , [O iii] , to study the “cool” CGM gas (e.g. Rupke et al., 2019; Helton et al., 2021; Li et al., 2021; Zhang et al., 2023; Langen et al., 2023; Johnson et al., 2024). With a clear dependence of line intensity on the collisional rate between gas particles, the optical strong lines can be used to estimate the physical condition of the CGM gas.
Among these optical lines, [O iii]4959,5007Å are frequently used in finding the spectral signatures of AGN outflows (Zakamska & Greene, 2014; Zakamska et al., 2016; Vietri et al., 2018; Perrotta et al., 2019). However, the direct observations of spatially extended [O iii] emission are sparse, and mainly at low redshifts (Greene et al., 2012; Liu et al., 2013; Husemann et al., 2014; Fischer et al., 2018; Helton et al., 2021). At high redshifts up to the cosmic noon, the [O iii] outflows are occasionally seen on spatial scales up to 20 kpc (e.g. Nesvadba et al., 2008; Alexander et al., 2010; Cano-Díaz et al., 2012; Harrison et al., 2012; Carniani et al., 2015; Wylezalek et al., 2022). But the spatial scales of these [O iii] outflows are still much smaller than the cool CGM gas reservoir revealed by Ly , due to the limited observational capability in terms of near-infrared coverage, surface brightness sensitivity, spectral resolution, and field-of-view. However, such observations can now be achieved with JWST narrow- or medium-band imaging, filling the gap between the Ly “nebulae” and the tell-tale optical strong lines.
The target of this paper is the galaxy system SMM J02399-0136 (R.A. = 02h39m51.9s, Dec = -01d35m59s) at redshift = 2.808. It is lensed by the galaxy cluster Abell 370 ( = 0.375) with a magnification factor = 2.38 (Ivison et al., 2010). The lensing shear is orthogonal to the direction towards Abell 370, only stretching the shape of the observed image in the shear direction as labelled in Fig. 1 while preserving the intrinsic surface brightness. The system is known to be comprised of a broad absorption line quasar (L1), a dusty star-forming galaxy (DSFG; L2SW), an irregular companion galaxy (L2), and a projected companion (L1N1) (Vernet & Cimatti, 2001; Ivison et al., 2010; Aguirre et al., 2013). Originally discovered as a sub-millimeter galaxy (Ivison et al., 1998), this system is forming stars at a rate of at least 400 M⊙ yr-1, taking place mostly in the DSFG (Ferkinhoff et al., 2015). The kinematics traced by molecular gas (Frayer et al., 2018) and the shape of the stellar continuum suggest the DSFG has a rotating disk viewed edge-on, and the extended diffuse stellar light to the east is likely the tidal remnant of the ongoing merging between the DSFG and the quasar. A large amount of “cool” CGM has been discovered surrounding this system, including a 100 kpc scale Ly “nebula” (Ivison et al., 1998; Li et al., 2019), as well as multiple evidences for extended ionized (Ferkinhoff et al., 2015) and molecular gas (Genzel et al., 2003; Ivison et al., 2010; Frayer et al., 2018; Vidal-García et al., 2021).
In this letter, we report a serendipitous discovery of [O iii] emission in the CGM of SMM J02399, which shows a spatial extension comparable to the Ly nebula, and a surprising filamentary morphology with high intrinsic surface brightness. The Observational data of [O iii] and Ly are described in Sec. 2. Sec. 3 describes the main discovery in the JWST data and its comparison to the Ly map. The implication of the discovery including the physical condition of the emitting gas, source of Ly photon in the Ly nebula, as well as the processes that may be responsible for the morphology and power of the CGM emission, are discussed in Sec. 4. The detailed calculations or elaborate descriptions are accommodated in the Appendix, of which the conclusions are used in the discussion in Sec. 4. We conclude the paper with a brief summary in Sec. 5.
2 Observational Data
This work utilizes the medium-band images obtained in the program GO 3538 (PI: Edoardo Iani) and the wide-band images taken by GTO 1208 (PI: Chris Willott), both using the JWST/NIRCam instruments and targeting the Abell 370 cluster. The [O iii]4959,5007Å and H lines are covered in the F182M filter image (=4522–5168 Å), and the H line is covered in the F277W filter image (=6363–8225 Å). A detailed description of the data reduction can be found in Appendix A. The line emission maps of [O iii] and H are made by subtracting the line-bearing images by the continuum maps that are interpolated from the images taken in the neighboring filters. The spatial resolution of NIRCam at 1.8 m is 0.06” with pixel scale 0.03”/pixel. The pixel-wise surface brightness sensitivity of the [O iii] map is . Appendix B provides a full description of the continuum-subtraction procedure.
The Ly nebula is observed with the Keck Cosmic Web Imager (KCWI), and the details of the observation are described in Li et al. (2019). The seeing on the date of the observation is about 1.5”. The astrometry of the Ly data is corrected by the alignment to the central position of the quasar (L1) and the foreground elliptical galaxy SDSS J023952.03-013549.8 (Ahumada et al., 2020) to the north of the system. The emission line map is constructed by pixel-wise continuum-subtraction and integration over a 25Å bandwidth, as is described in (Li et al., 2019) and Appendix B.
3 Results
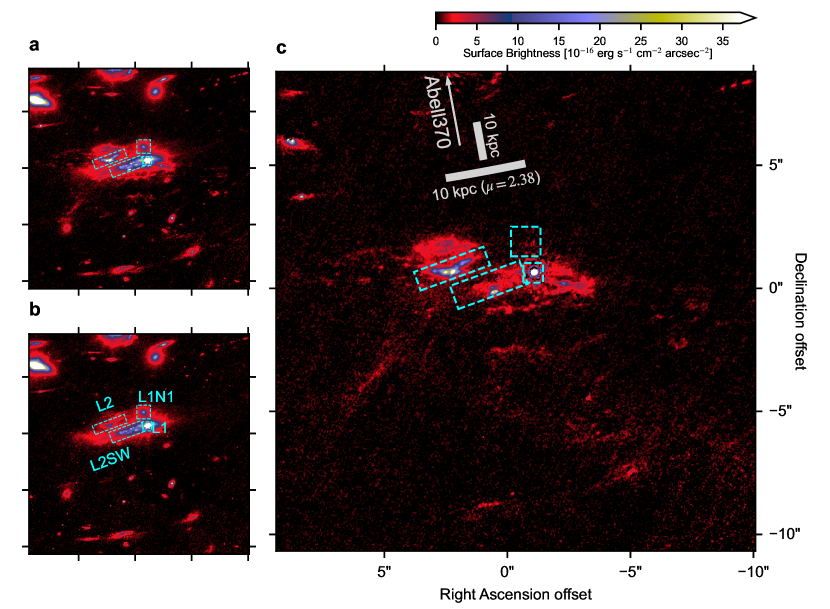
In Fig. 1, we show the extended emission features that are unique to the F182M images, compare them to the stellar continuum and highlight the line emission in the continuum-subtracted image which we identify as [O iii] with H contribution . (Appendix C). Due to the small fraction and large uncertainty of the H flux, in addition to the partial coverage of the H map, we do not make the correction for H in the F182M continuum-subtracted image, and refer to the image as the [O iii] map.
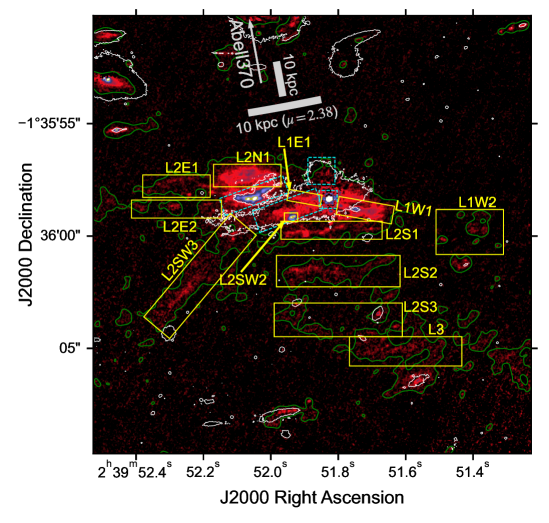
Thanks to the high spatial resolution and sensitivity, the [O III] line map resolves exquisite details of the CGM gas distribution. Contrary to the previous views of faint and diffuse CGM emission, the [O iii] emission from the CGM appears bright and arise from several narrow filamentary structures. The decomposition and naming of the [O iii] complex is shown in Fig. 2 with detailed description in Appendix D. In the vicinity of the system, there are two plumes (L1W1, L1E1) connected to the quasar, a bright compact source to the south (L2SW2), and clumpy gas clouds in the north of L2 (L2N1). The westwards plume (L1W1) extends for at least 8 kpc, and could be linked to the tail at a projected distance of 25 kpc (L1W2). On large scales, fainter and filamentary features are found in several directions. East to L2, two narrow filaments extend for about 10 kpc (L2E1, L2E2). In the southeast, a bright filament (L2SW3) stretches from the DSFG (L2SW) with an extent of roughly 35 kpc. Directly to the south of the quasar (L1), three filaments (L2S1, L2S2, L2S3&L3) lie parallel to the DSFG-quasar system, with a projected separation of 15–20 kpc between each other. The patchy [O iii] emission at a projected distance 60 kpc to the southwest (L3) coincides with a Ly emitting source (Li et al., 2019, see also Fig. 3).
Most of the filaments show high surface brightness up to . They also show similar length (3–5”, 10–20 kpc) and width (0.3”, 2.5 kpc). Following the parallel filaments (stripes) to the south from the one closest to the host galaxies outwards, these emitting structures decrease in surface brightness and appear more spread out and clumpy. It is also worth noting that the emission appears mainly in the southern half of the field, indicating asymmetric powering or matter distribution in the CGM.
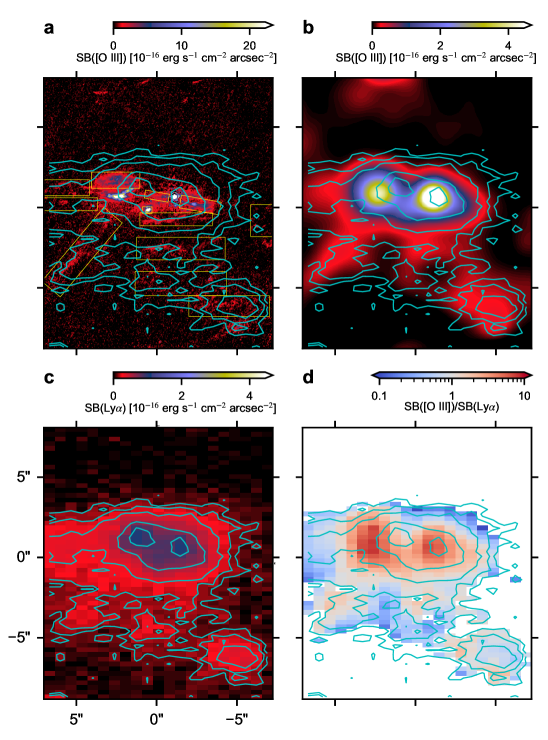
This newly discovered extended [O iii] emission has both spatial scale ( 100 kpc) and extension similar to those of the known Ly “nebula” (Fig. 3), which extends towards east and south, and shows a tertiary peak at the southwest (L3) location. After smoothing the [O iii] map to 1.5” resolution to match with that of the Ly map, it can be seen that both [O iii] and Ly display nearly identical morphology on large scales. In addition to the morphology, the [O iii] surface brightness also varies along with the Ly levels in the CGM. In the smoothed [O iii] -to-Ly surface brightness ratio map in Fig. 3, the regions in the outskirts of the host galaxies consistently show a ratio of unity, with variation less than 0.3 dex. This ratio becomes much higher within the host galaxies (L1&L2), and the [O iii] peak is offset from the Ly peak in L2, due to the low fraction of Ly photons that can escape form the interstellar medium (ISM).
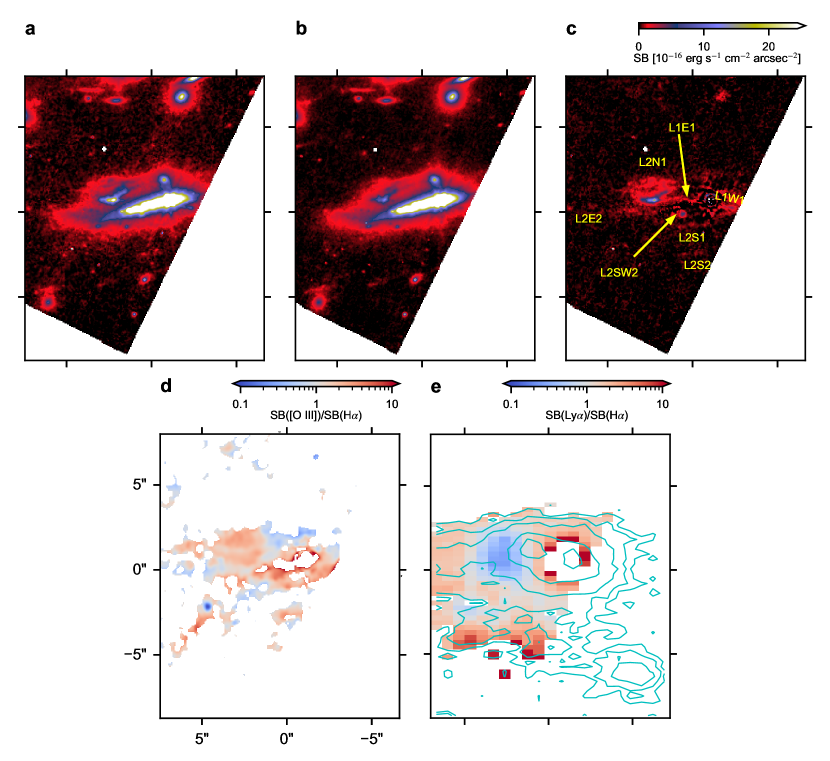
Some of the features identified in the [O iii] map can also be seen in the H map (Fig. 4) which has lower sensitivity and only partial coverage of the field. The surface brightness ratio between the [O iii] and H images proves that the line emission of the extended regions in the F182M continuum-subtracted image is dominated by [O iii] , with the potential contamination of H being less than (Appendix C).
4 Discussion
The high intrinsic surface brightness and the collisional excitation of the [O iii] lines enable us to place unprecedented constraints on the physical conditions of the “cool” CGM gas. The [O iii] line surface brightness is dependent on several parameters, including the gas column density , the absolute metallicity O/H, the ionization fraction of the emitting ion O2+/O, the electron density , and the electron temperature . However, a combination of the surface brightness level, the ratio of [O iii] /Ly , and assumptions on the ionization fraction and geometry can significantly reduce the number of degrees of freedom, placing the constraints in Eqn. 1 below. The individual dependence of the observed properties and the assumptions are detailed in Appendix E.
| (1a) | |||
| (1b) | |||
The strong [O iii] emission shows chemical enrichment at a large distance from the host galaxies. The joint constraints in Eqn. 1 is a strong function of in the emitting gas, with an absolute lower limit for metallicity (5% Z⊙ ) at high end, while it increases to (80 % Z⊙ ) if is only . The almost equal brightness of [O iii]4959,5007 and Ly emphasises the important role of metal lines in the cooling of CGM gas, especially in the surroundings of massive active galaxies or quasars that are enriched by feedback material. Despite the degeneracy, a reasonable solution to Eqn. 1 also requires high density up to and pressure , at least one order of magnitude larger than that of the cool CGM gas in typical cosmological simulations (e.g. Nelson et al., 2020).
The line maps of [O iii] and H (Fig. 4) help us solve the long-standing debate on the origin of Ly photons in the CGM–distinguishing between scattering and recombination. One direct indication is the small value of Ly -to-H surface brightness ratio (Ly /H ), which reaches in the extended region and strongly disfavors the scattering scenario. This small value is consistent with the long-slit spectrum results on other Ly “nebulae” (Leibler et al., 2018; Langen et al., 2023), but the fact that it is smaller than the expected value of 8.7 implies either the limited sensitivity the H map skews the derived ratio, the strong [N ii] and/or [S ii] contamination in the same filter, or a fraction of Ly photons are scattering off the line-of-sight (LoS) due to the geometry, or the presence of considerable amount of dust obscuration in the CGM. More detailed discussion can be found in Appendix F). On the other hand, the high [O iii] /Ly and the high metallicity derived above indicates that most of the Ly photons are emitted in-situ from the same ionized medium, as any contribution from the scattered Ly of the host galaxies would lead to a solution of even higher metallicity by decreasing the intrinsic Ly surface brightness in Eqn. 1 and lowering for a medium where neutral hydrogen could exist. Therefore, we conclude that most of the Ly photons in this Ly “nebula” are produced by recombination, and the lack of the scattered Ly from the host galaxies suggests the “cool” CGM around this system is dominantly in the ionized phase.
The extraordinary morphology and physical conditions further enable us to infer the processes that shape the CGM distribution and power the large-scale emission. Though photoionization is commonly hypothesised to be the powering source for the nebulae around quasar (Cantalupo et al., 2014; González Lobos et al., 2023), it is unfavored in this system because of the high [O iii] /H line ratio, the geometry, and the small cross section of gas filaments to reprocess the quasar radiation (details in Appendix G). On the other hand, the high density and pressure require the gas to be either bounded by self gravity, or pressurized externally by processes like shocks or magnetic field. One evidence of shock heating in powering the CGM emission is the irregular galaxy L2 and the surrounding gas structures, where the radio jet L1E1 likely collide with L2 and disrupt its ISM, resulting in bright line emissions enhanced by shocks as well as large clumps and tails of stripped gas. (description in Appendix H). In the south, the parallel stripes suggests past episodic feedbacks separated by 20 Myr. However, the exact processes that shape and power these stripes is not clear, as scenarios including shock heating by the quasar jet, outflows driven by the starburst in DSFG, and the DSFG-quasar merger, are all consistent in terms of the expected morphology and timescale (calculations and comparisons in Appendix I).
We also note that the filaments surrounding SMM J02399-0136 resemble the H filaments found around local bright cluster galaxies (BCGs) that can also extend to beyond 50 kpc (Appendix J; Conselice et al., 2001; Fabian et al., 2003; Olivares et al., 2019). These gas filaments play important role in galaxy evolution as hosting large reservoir of cool gas that may feed the ongoing or future star formation (Canning et al., 2014; Olivares et al., 2019). The morphology and the need for energy input also hints the importance of large-scale magnetic fields (Fabian et al., 2008, 2011; Fabian, 2012; Fabian et al., 2016; Tremblay et al., 2018; Olivares et al., 2019; Vigneron et al., 2024). However, SMM J02399-0136 CGM gas are in higher ionization states than typical BCG filaments (Tremblay et al., 2018), suggesting that it may represent a more energetic or earlier phase of the feedback compared with the latter.
The inferred properties lead to a very different picture for this Ly “nebula”. The “cool” CGM in this system actually resides in high density and high pressure filaments with low filling factor, in contrast to the commonly accepted idea of moderately dense clouds widespread in CGM that fill up to of the circumgalactic space. The gas is also fully ionized through mainly collisional ionization, at a temperature higher than . Instead of tracing the accretion flow into the galaxy, the “cool” CGM gas in this system unveils the past feedbacks.
The importance of mechanical heating in shaping and powering CGM also poses challenges to numerical simulations, as the localized discontinuity created by shocks requires high spatial and time resolution in computation, in addition to the complex physical processes involved in outflows and jets (Bennett & Sijacki, 2020; Talbot et al., 2024). Even though shocks induced by feedback processes are common in cosmological simulations, the limitation in resolution and a lack of complete treatment of radiative cooling made previous studies mainly associate shocks with the “hot” () phase of CGM. Due to these limitations, simulations also tend to underestimate the density of the CGM while overestimating the cloud size and the photoionization rates in the feedback driven shocks. Contrary to the results of past simulations on cool accretion in the CGM (e.g. Rosdahl & Blaizot, 2012), this observation shows that dense clouds in the CGM could be dominantly ionized.
The discovery of [O iii] filaments around SMM J02399-0136 show an unprecendented view of the “cool” CGM gas, but it is unclear whether this is common among the Ly “nebulae” around quasars or rather represents a rare example of recent strong feedback. Nevertheless, this study demonstrates the power of deep and high-resolution medium-band imaging with JWST in discovering and characterizing CGM emissions. While a systematic survey targeting known Ly “nebulae” will teach us about the prevalence of such feedback driven CGM structures, dedicated observations using high-resolution integral field unit (IFU) instruments, such as JWST/NIRSpec IFU or ground based IFU equipped with adaptive optics like VLT/ERIS (Davies et al., 2018), are required to obtain a comprehensive understanding of the CGM properties and its kinematics.
5 Summary
Surrounding the massive galaxy system SMM J02399-0136 at redshift 2.808, we serendipitously discover large-scale [O iii] emission arising from the CGM. Making use of the unprecedented resolution and depth of the JWST images, we find
-
•
The extended [O iii] emission displays the same spatial extension as the Ly “nebula”. The intrinsic [O iii] surface brightness reaches up to , and is equally important for cooling as the Ly line.
-
•
The “cool” CGM gas in this system actually reside in filamentary structures.
-
•
Based on [O iii] and Ly emissions, we infer the emitting gas are dense, enriched in metal, and experience high pressure in the CGM.
-
•
The feedback processes shape and power the CGM gas distributions and emissions.
Acknowledgements.
This work is based on observations made with the NASA/ESA/CSA James Webb Space Telescope. The data were obtained from the Mikulski Archive for Space Telescopes at the Space Telescope Science Institute, which is operated by the Association of Universities for Research in Astronomy, Inc., under NASA contract NAS 5-03127 for JWST. These observations are associated with the program #1208 and #3538. EI acknowledges funding from the Netherlands Research School for Astronomy (NOVA). C.F. is partially supported by NSF Grant #1847892. G.S. was partially supported by NSF Grant AAG-1910107. We would like to thank Guinevere Kauffmann, Eugene Churazov, and Edith Falgarone for the helpful discussions.References
- Aguirre et al. (2013) Aguirre, P., Baker, A. J., Menanteau, F., Lutz, D., & Tacconi, L. J. 2013, ApJ, 768, 164
- Ahumada et al. (2020) Ahumada, R., Allende Prieto, C., Almeida, A., et al. 2020, ApJS, 249, 3
- Alexander et al. (2010) Alexander, D. M., Swinbank, A. M., Smail, I., McDermid, R., & Nesvadba, N. P. H. 2010, MNRAS, 402, 2211
- Allen et al. (2008) Allen, M. G., Groves, B. A., Dopita, M. A., Sutherland, R. S., & Kewley, L. J. 2008, ApJS, 178, 20
- Arrigoni Battaia et al. (2015) Arrigoni Battaia, F., Hennawi, J. F., Prochaska, J. X., & Cantalupo, S. 2015, ApJ, 809, 163
- Arrigoni Battaia et al. (2019) Arrigoni Battaia, F., Hennawi, J. F., Prochaska, J. X., et al. 2019, MNRAS, 482, 3162
- Bagley et al. (2023) Bagley, M. B., Finkelstein, S. L., Koekemoer, A. M., et al. 2023, ApJ, 946, L12
- Baldwin et al. (1981) Baldwin, J. A., Phillips, M. M., & Terlevich, R. 1981, PASP, 93, 5
- Bennett & Sijacki (2020) Bennett, J. S. & Sijacki, D. 2020, MNRAS, 499, 597
- Borisova et al. (2016) Borisova, E., Cantalupo, S., Lilly, S. J., et al. 2016, ApJ, 831, 39
- Cai et al. (2019) Cai, Z., Cantalupo, S., Prochaska, J. X., et al. 2019, ApJS, 245, 23
- Calzetti et al. (2000) Calzetti, D., Armus, L., Bohlin, R. C., et al. 2000, ApJ, 533, 682
- Canning et al. (2014) Canning, R. E. A., Ryon, J. E., Gallagher, J. S., et al. 2014, MNRAS, 444, 336
- Cano-Díaz et al. (2012) Cano-Díaz, M., Maiolino, R., Marconi, A., et al. 2012, A&A, 537, L8
- Cantalupo et al. (2014) Cantalupo, S., Arrigoni-Battaia, F., Prochaska, J. X., Hennawi, J. F., & Madau, P. 2014, Nature, 506, 63
- Carniani et al. (2015) Carniani, S., Marconi, A., Maiolino, R., et al. 2015, A&A, 580, A102
- Chevance et al. (2020) Chevance, M., Kruijssen, J. M. D., Vazquez-Semadeni, E., et al. 2020, Space Sci. Rev., 216, 50
- Conselice et al. (2001) Conselice, C. J., Gallagher, John S., I., & Wyse, R. F. G. 2001, AJ, 122, 2281
- Daddi et al. (2022) Daddi, E., Rich, R. M., Valentino, F., et al. 2022, ApJ, 926, L21
- Davies et al. (2018) Davies, R., Esposito, S., Schmid, H. M., et al. 2018, in Society of Photo-Optical Instrumentation Engineers (SPIE) Conference Series, Vol. 10702, Ground-based and Airborne Instrumentation for Astronomy VII, ed. C. J. Evans, L. Simard, & H. Takami, 1070209
- De Cia et al. (2013) De Cia, A., Ledoux, C., Savaglio, S., Schady, P., & Vreeswijk, P. M. 2013, A&A, 560, A88
- Dijkstra et al. (2019) Dijkstra, M., Prochaska, J. X., Ouchi, M., & Hayes, M. 2019, Saas-Fee Advanced Course, 46
- Dopita et al. (2005) Dopita, M. A., Groves, B. A., Fischera, J., et al. 2005, ApJ, 619, 755
- Draine (2003) Draine, B. T. 2003, ARA&A, 41, 241
- Draine (2011) Draine, B. T. 2011, Physics of the Interstellar and Intergalactic Medium
- Eilers et al. (2024) Eilers, A.-C., Mackenzie, R., Pizzati, E., et al. 2024, arXiv e-prints, arXiv:2403.07986
- Fabian (2012) Fabian, A. C. 2012, ARA&A, 50, 455
- Fabian et al. (2008) Fabian, A. C., Johnstone, R. M., Sanders, J. S., et al. 2008, Nature, 454, 968
- Fabian et al. (2003) Fabian, A. C., Sanders, J. S., Crawford, C. S., et al. 2003, MNRAS, 344, L48
- Fabian et al. (2011) Fabian, A. C., Sanders, J. S., Williams, R. J. R., et al. 2011, MNRAS, 417, 172
- Fabian et al. (2016) Fabian, A. C., Walker, S. A., Russell, H. R., et al. 2016, MNRAS, 461, 922
- Farber & Gronke (2022) Farber, R. J. & Gronke, M. 2022, MNRAS, 510, 551
- Farina et al. (2019) Farina, E. P., Arrigoni-Battaia, F., Costa, T., et al. 2019, ApJ, 887, 196
- Ferkinhoff et al. (2015) Ferkinhoff, C., Brisbin, D., Nikola, T., et al. 2015, ApJ, 806, 260
- Feruglio et al. (2015) Feruglio, C., Fiore, F., Carniani, S., et al. 2015, A&A, 583, A99
- Fischer et al. (2018) Fischer, T. C., Kraemer, S. B., Schmitt, H. R., et al. 2018, ApJ, 856, 102
- Frayer et al. (2018) Frayer, D. T., Maddalena, R. J., Ivison, R. J., et al. 2018, ApJ, 860, 87
- Genzel et al. (2003) Genzel, R., Baker, A. J., Tacconi, L. J., et al. 2003, ApJ, 584, 633
- Gledhill et al. (2024) Gledhill, R., Strait, V., Desprez, G., et al. 2024, arXiv e-prints, arXiv:2403.07062
- González Lobos et al. (2023) González Lobos, V., Arrigoni Battaia, F., Chang, S.-J., et al. 2023, A&A, 679, A41
- Greene et al. (2012) Greene, J. E., Zakamska, N. L., & Smith, P. S. 2012, ApJ, 746, 86
- Harrison et al. (2012) Harrison, C. M., Alexander, D. M., Swinbank, A. M., et al. 2012, MNRAS, 426, 1073
- Helton et al. (2021) Helton, J. M., Johnson, S. D., Greene, J. E., & Chen, H.-W. 2021, MNRAS, 505, 5497
- Hummer & Storey (1987) Hummer, D. G. & Storey, P. J. 1987, MNRAS, 224, 801
- Husemann et al. (2014) Husemann, B., Jahnke, K., Sánchez, S. F., et al. 2014, MNRAS, 443, 755
- Ivison et al. (1998) Ivison, R. J., Smail, I., Le Borgne, J. F., et al. 1998, MNRAS, 298, 583
- Ivison et al. (2010) Ivison, R. J., Smail, I., Papadopoulos, P. P., et al. 2010, MNRAS, 404, 198
- Johnson et al. (2024) Johnson, S. D., Liu, Z. W., Li, J. I. H., et al. 2024, ApJ, 966, 218
- Kereš et al. (2005) Kereš, D., Katz, N., Weinberg, D. H., & Davé, R. 2005, MNRAS, 363, 2
- Kewley et al. (2006) Kewley, L. J., Groves, B., Kauffmann, G., & Heckman, T. 2006, MNRAS, 372, 961
- Kruijssen et al. (2019) Kruijssen, J. M. D., Schruba, A., Chevance, M., et al. 2019, Nature, 569, 519
- Lagattuta et al. (2019) Lagattuta, D. J., Richard, J., Bauer, F. E., et al. 2019, MNRAS, 485, 3738
- Langen et al. (2023) Langen, V., Cantalupo, S., Steidel, C. C., et al. 2023, MNRAS, 519, 5099
- Lau et al. (2016) Lau, M. W., Prochaska, J. X., & Hennawi, J. F. 2016, ApJS, 226, 25
- Leibler et al. (2018) Leibler, C. N., Cantalupo, S., Holden, B. P., & Madau, P. 2018, MNRAS, 480, 2094
- Li et al. (2019) Li, Q., Cai, Z., Prochaska, J. X., et al. 2019, ApJ, 875, 130
- Li et al. (2021) Li, Q., Wang, R., Dannerbauer, H., et al. 2021, ApJ, 922, 236
- Liu et al. (2013) Liu, G., Zakamska, N. L., Greene, J. E., Nesvadba, N. P. H., & Liu, X. 2013, MNRAS, 430, 2327
- Luridiana et al. (2015) Luridiana, V., Morisset, C., & Shaw, R. A. 2015, A&A, 573, A42
- Martin et al. (2015) Martin, D. C., Matuszewski, M., Morrissey, P., et al. 2015, Nature, 524, 192
- Martin et al. (1989) Martin, N., Maurice, E., & Lequeux, J. 1989, A&A, 215, 219
- Martini (2004) Martini, P. 2004, in Coevolution of Black Holes and Galaxies, ed. L. C. Ho, 169
- Matsuda et al. (2011) Matsuda, Y., Yamada, T., Hayashino, T., et al. 2011, MNRAS, 410, L13
- Mazzotta et al. (1998) Mazzotta, P., Mazzitelli, G., Colafrancesco, S., & Vittorio, N. 1998, A&AS, 133, 403
- Ménard et al. (2010) Ménard, B., Scranton, R., Fukugita, M., & Richards, G. 2010, MNRAS, 405, 1025
- Nelson et al. (2020) Nelson, D., Sharma, P., Pillepich, A., et al. 2020, MNRAS, 498, 2391
- Nesvadba et al. (2008) Nesvadba, N. P. H., Lehnert, M. D., De Breuck, C., Gilbert, A. M., & van Breugel, W. 2008, A&A, 491, 407
- Olivares et al. (2019) Olivares, V., Salome, P., Combes, F., et al. 2019, A&A, 631, A22
- Oppenheimer et al. (2010) Oppenheimer, B. D., Davé, R., Kereš, D., et al. 2010, MNRAS, 406, 2325
- Oppenheimer & Schaye (2013) Oppenheimer, B. D. & Schaye, J. 2013, MNRAS, 434, 1043
- Osterbrock & Ferland (2006) Osterbrock, D. E. & Ferland, G. J. 2006, Astrophysics of gaseous nebulae and active galactic nuclei
- Peek et al. (2015) Peek, J. E. G., Ménard, B., & Corrales, L. 2015, ApJ, 813, 7
- Perrotta et al. (2019) Perrotta, S., Hamann, F., Zakamska, N. L., et al. 2019, MNRAS, 488, 4126
- Predehl & Schmitt (1995) Predehl, P. & Schmitt, J. H. M. M. 1995, A&A, 293, 889
- Richard et al. (2010) Richard, J., Kneib, J. P., Limousin, M., Edge, A., & Jullo, E. 2010, MNRAS, 402, L44
- Richie et al. (2024) Richie, H. M., Schneider, E. E., Abruzzo, M. W., & Torrey, P. 2024, arXiv e-prints, arXiv:2403.03711
- Rosdahl & Blaizot (2012) Rosdahl, J. & Blaizot, J. 2012, MNRAS, 423, 344
- Rudnick et al. (2022) Rudnick, L., Brüggen, M., Brunetti, G., et al. 2022, ApJ, 935, 168
- Rupke et al. (2019) Rupke, D. S. N., Coil, A., Geach, J. E., et al. 2019, Nature, 574, 643
- Sancisi et al. (2008) Sancisi, R., Fraternali, F., Oosterloo, T., & van der Hulst, T. 2008, A&A Rev., 15, 189
- Strawn et al. (2023) Strawn, C., Roca-Fàbrega, S., & Primack, J. 2023, MNRAS, 519, 1
- Talbot et al. (2024) Talbot, R. Y., Sijacki, D., & Bourne, M. A. 2024, MNRAS, 528, 5432
- Thompson et al. (2016) Thompson, T. A., Quataert, E., Zhang, D., & Weinberg, D. H. 2016, MNRAS, 455, 1830
- Tombesi et al. (2015) Tombesi, F., Meléndez, M., Veilleux, S., et al. 2015, Nature, 519, 436
- Tremblay et al. (2018) Tremblay, G. R., Combes, F., Oonk, J. B. R., et al. 2018, ApJ, 865, 13
- Tumlinson et al. (2017) Tumlinson, J., Peeples, M. S., & Werk, J. K. 2017, ARA&A, 55, 389
- Umehata et al. (2019) Umehata, H., Fumagalli, M., Smail, I., et al. 2019, Science, 366, 97
- Vernet & Cimatti (2001) Vernet, J. & Cimatti, A. 2001, A&A, 380, 409
- Vidal-García et al. (2021) Vidal-García, A., Falgarone, E., Arrigoni Battaia, F., et al. 2021, MNRAS, 506, 2551
- Vietri et al. (2018) Vietri, G., Piconcelli, E., Bischetti, M., et al. 2018, A&A, 617, A81
- Vigneron et al. (2024) Vigneron, B., Hlavacek-Larrondo, J., Rhea, C. L., et al. 2024, ApJ, 962, 96
- Wisotzki et al. (2016) Wisotzki, L., Bacon, R., Blaizot, J., et al. 2016, A&A, 587, A98
- Wold et al. (2012) Wold, I. G. B., Owen, F. N., Wang, W.-H., Barger, A. J., & Keenan, R. C. 2012, ApJS, 202, 2
- Wylezalek et al. (2022) Wylezalek, D., Vayner, A., Rupke, D. S. N., et al. 2022, ApJ, 940, L7
- Zakamska & Greene (2014) Zakamska, N. L. & Greene, J. E. 2014, MNRAS, 442, 784
- Zakamska et al. (2016) Zakamska, N. L., Hamann, F., Pâris, I., et al. 2016, MNRAS, 459, 3144
- Zhang et al. (2023) Zhang, S., Cai, Z., Xu, D., et al. 2023, Science, 380, 494
Appendix A JWST Data Reduction and the Robustness of detections
We downloaded the raw data from the Mikulski Archive for Space Telescopes (MAST) portal, and processed them using the JWST pipeline version 1.14.0 and Calibration References Data System (CRDS) version 1223. Customized processing were implemented in different stages of the pipeline reduction, including snowball, wisp and stripe subtraction, following the procedures detailed in Bagley et al. (2023). The Abell 370 catalog (Lagattuta et al. 2019) is used for the astrometric alignment before combining all the dithered exposures.
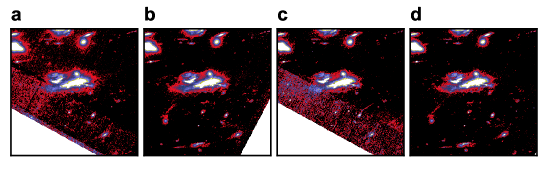
Because the noise and the scattered light could strongly affect the low surface brightness features in the NIRCam image, we also show the four individual observations in Fig. 5 for the F182M filter, with the data association codes o011 (a), o012 (b), o015 (c), o016 (d) in MAST, that have exposure time of 4638, 5068, 4638, and 5068 seconds, respectively. Although the galaxies are too close to the edge in the o011 and o015 exposures, and the southeast regions of the system show significantly higher noise due to the lower number of coverages in dithering for these observations associations. It can be seen that the faint filamentary features discussed in the paper are present in all four exposures when the target is placed at different positions on the detector, confirming them as astrophysical features instead of ghost images due to scattered light or artefacts introduced in the data reduction.
Appendix B Continuum Subtraction
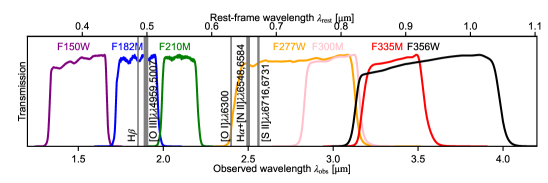
The stellar continuum is subtracted from the JWST images to show the distribution and the levels of the line emission. The continuum map for the F182M image ( 4800 Å) is interpolated as an average of the images in the neighboring bands F150W and F210M (Fig. 6). Because the F150W image does not cover the southwest part of the field, the F210M image is scaled down by a factor of 0.85 to fill in this region. The scaling factor is estimated by comparing the interpolated continuum to the original F210M image in regions of common coverage. This rest-frame 4800 Å continuum is subsequently subtracted from the F182M image, effectively removing most of the continuum emission as shown in Fig. 1.
A similar procedure is performed on the F277W image ( 7300 Å), while the continuum is interpolated as a weighted average of F210M, F300M, F335M, F356W images with weighting factors 0.5, 0.07, 0.07, and 0.36, respectively (Fig. 6). The inclusion of several images accounts for the fact that although the F300M and F335M images are close to the F277W image in wavelength, the two exposures are short compared with the F210M and F356W images, leading to much noisier continuum image and are thus weighted down. The F210M data has higher resolution than the rest of the images used, partly because it is taken on the short wavelength detector, and partly because of the more dithered exposures than the other images. In addition, the pixel size of the short wavelength detection is only half of that of the long wavelength detector. Therefore the F210M image is smoothed and resampled to match with the resolution and the pixel size of the rest of the data when constructing the rest-frame 7300 Å continuum.
For the Ly cube, the continuum is modelled by averaging the spectral cube between the wavelength range = 4450–5000 Å, excluding 4515–4826 Å. The continuum image is then subtracted from the Ly spectral cube, and the channels between = 4615–4640 Å (=1211.9–1218.5 Å) are collapsed to create the Ly map.
The pixel-wise surface brightness sensitivity are measured to be and for the F182M and F277W continuum-subtracted images. We note that the sensitivity degraded rapidly near the edge of the F277W image due to a lack of coverage in dithered exposures. For the Ly cube, we use the sensitivity measured in Li et al. (2019), corresponding to = measured with a 1.5” aperture.
Appendix C Line Identification
The F182M filter covers the wavelengths of two strong optical line complexes [O iii] doublet and H (Fig. 6). This degeneracy is solved by the comparison with the F277W data. As shown in Fig. 4, the surface brightness of the line emission in the F182M continuum-subtracted image ([O iii] &H ) is about three times that of the H in the F277W continuum-subtracted image in the extended regions discussed in this work. As the H /H flux ratio is expected to be 2.87 for the case-B recombination at (Hummer & Storey 1987), we can constrain the contribution from H in the F182M continuum-subtracted image to be , and conclude that the dominant line emission is from the [O iii] doublet.
The F277W image could be similarly contaminated by the neighboring [N ii]6548,6584Å , and [S ii]6717,6731Å lines (Fig. 6), with [N ii] doublets being often the brightest lines. However, the [N ii] /H flux ratio is typically less than unity in star forming galaxies, reaching beyond one only in the high metallicity gas in the vicinity of AGNs Baldwin et al. (1981); Kewley et al. (2006). Given that the CGM abundance is estimated to be order of magnitude lower than the AGN host galaxies ( solar metallicity), lines other than H , especially [N ii] , could only account for percent levels of the line emission in the F277W continuum-subtracted image.
Appendix D [O III] Distribution
| Name | Right Ascension | Declination | Position Angle | Integrated Line Fluxa𝑎aa𝑎aTotal flux of all the emission lines in F182M image; not corrected for gravitational lensing. |
|---|---|---|---|---|
| h:m:s (J2000) | d:m:s (J2000) | degree | ||
| L1W1 | 2:39:51.72 | -01:35:58.85 | -10 | 4.220.02b𝑏bb𝑏bPartial confusion with quasar emission. |
| L1W2 | 2:39:51.41 | -01:35:59.82 | 0.4140.012 | |
| L1E1 | 2:39:51.90 | -01:35:58.30 | -10 | 1.440.004b𝑏bb𝑏bPartial confusion with quasar emission. |
| L2N1 | 2:39:52.07 | -01:35:57.31 | 5.970.008 | |
| L2SW2 | 2:39:51.94 | -01:35:59.17 | 2.090.002 | |
| L2E1 | 2:39:52.28 | -01:35:57.78 | 0.8770.008 | |
| L2E2 | 2:39:52.28 | -01:35:58.80 | 0.7550.008 | |
| L2SW3 | 2:39:52.21 | -01:36:01.78 | 50 | 2.580.014 |
| L2S1 | 2:39:51.82 | -01:35:59.74 | 1.970.029 | |
| L2S2 | 2:39:51.80 | -01:36:01.56 | 1.590.013 | |
| L2S3 | 2:39:51.80 | -01:36:03.73 | 0.8730.014c𝑐cc𝑐cExcluding the line emitting galaxies in the same aperture. | |
| L3 | 2:39:51.60 | -01:36:05.13 | 1.520.012 |
Fig. 2 illustrates the features in and around SMM J02399-0136 as traced by the [O iii] emission. The position and the [O iii] fluxes of the extended regions are summarized in Table 1. The fluxes are integrated over the yellow boxes shown in Fig. 2.
The quasar (L1) appears as a point source in the [O iii] map and dominates the flux in the quasar-DSFG merger system, while the [O iii] emission from the DSFG (L2SW) is weak except for a few small clumps, most likely due to dust attenuation. At the south of the DSFG at a projected distance of 0.25” (2 kpc), there is a small but bright elliptical source that does not have obvious continuum counterpart (L2SW2). The companion galaxy to the northeast (L2) displays complex morphology in [O iii] . The galaxy brightens significantly, showing two clumps in the central region. A prominent narrow extension towards northwest also exhibits strong line emission with only very weak continuum emission. Large amount of [O iii] emitting gas lies at the north of the galaxy (L2N1) with high surface brightness and clumpy morphology. These bright clumps of gas extends for about 4 kpc across, comparable to the size of the galaxy L2 itself.
Near the quasar, a collimated plume of gas (L1W1) appears to stem from the quasar nucleus towards the west direction. The plume shows a bright knot at a distance of 1.3” ( 5 kpc after correction for lensing) from the quasar, which turns into a more extended geometry at beyond 2” ( 8 kpc). Some [O iii] gas clouds also exist in the same direction at a distance of 6–7” ( 25–30 kpc) (L1W2). These distant clouds resemble the tail of the same gas plume, based on their alignment and the morphology. In the opposite direction to the quasar, another stripe of [O iii] emission (L1E1) extends from quasar towards L2 and L2N1. The direction of L1E1 and its spatial coincidence with the radio detection (Ivison et al. 2010; Wold et al. 2012) suggest it may be the gas plume opposite to L1W1 launched by the radio jet. The lower surface brightness of L1E1 than L1W1 may be caused by the higher dust attenuation associated with the DSFG in this direction.
More [O iii] emitting gas exists to the east of L2, forming two east-west filaments L2E1 and L2E2. L2E1 shows an arc-like geometry and seems to connect with L2N1. L2E2 comprises mainly of three clumps separated by 1.5” (5 kpc). In the context of jet-L2 interaction, these structures near L2 could be formed by the gas stripped from the galaxy ISM (L2-L2E2) and the northwest extension (L2-L2N1-L2E1).
A prominent [O iii] structure (L2SW3) extends from the tidal tail of the DSFG towards southeast. The maximal extent of L2SW3 reaches a projected distance of 6” (35 kpc) from the DSFG. L2SW3 shows mainly a bright filament for a length 4” (24 kpc) and width 0.3” (2.5 kpc). The far end of L2SW3 coincides with an elliptical galaxy lying at a lower redshift.
Directly to the south of the DSFG-quasar merger, several bright filaments (stripes) can be seen. L2S1 lies at 1.3” (10 kpc) south of the quasar, parallel to the DSFG-quasar system. It has a length of 4” ( 15 kpc) and width less than 3” (2.5 kpc). The filament displays complex structures, including a few clumps and discontinuities. The west end of L2S1 appears to connect with L1W1 at an acute angle. L2S2 lies 2” (16 kpc) south of L2S1, showing very similar geometry but at lower surface brightness. Its extension towards west appears to be in association with L1W2. Further 2.5” (20 kpc) to the south, a filament extends in the northeast-southwest direction (L2S3 and L3). This structure is divided into two parts based on the Ly observation, as L3 coincide with a peak in the Ly map (Li et al. 2019), while L2S3 region traces a distinct component in the spatial-velocity space connecting L2SW3 to L2 (Vidal-García et al. 2021). Though L2S3 appears much dimmer than other filaments, the L3 has comparable surface brightness and geometry as L2S2.
In addition to the structures surrounding SMM J02399-0136, more line emitting galaxies can be seen in the F182M continuum-subtracted image. Some of them display clear elongated shape similar to that of SMM J02399-0136, such as the smaller galaxies in the northwest of L2E1, the one directly south to L1W2, and the one south to L3. The galaxy to the northwest of L2E1 also shows up in the F277W continuum-subtracted image, assuring its association with SMM J02399-0136. But redshift confirmation of these galaxies requires dedicated spectroscopic observations. In addition to the small galaxies, some large () galaxies also show traces of residual emission after subtraction of their stellar continuum. Judging from their sizes, brightness of the continuums and lines, as well as the mostly elliptical morphologies, it is highly unlikely that they are field galaxies at comparable redshifts. We speculate that the residual line emission may correspond to the Paschen line for the local galaxies, or the Paschen line for the galaxies in the Abell 370 cluster.
Appendix E The Physical Conditions in the CGM
The [O iii] surface brightness is dependent on five physical properties (Osterbrock & Ferland 2006; Draine 2003; Luridiana et al. 2015), namely gas column density , metallicity or oxygen abundance O/H, ionization fraction of the doubly ionized oxygen ion (), electron density , and electron temperature , as
| (2) |
Assuming the Ly photons as in-situ emission from the recombination of the ionized gas, the [O iii] -to-Ly line ratio can be approximated as a function of O/H, , and . Using case-B recombination coefficients (Hummer & Storey 1987; Draine 2011) and PyNeb (Luridiana et al. 2015), the line ratio can be approximated as
| (3) |
The choice of the reference values in the formula are partly based on the consistency with the conditions inferred from other arguments, for example, beyond 20,000 K collisional ionization starts to become relevant in producing O2+ ions (Strawn et al. 2023), and partly based on the typical assumptions of CGM gas, such as an O/H value lower than the solar value (Lau et al. 2016). However, we present this scaling relation for the ease in numerical calculation and comparison, instead of showing a final solution.
To further constrain the physical conditions in the emitting gas, we can make some heuristic assumptions. The first assumption is that the ionization fraction of the doubly ionized oxygen is unity
| (4) |
This is hardly the case in collisionally ionized gas (Mazzotta et al. 1998), and deviation from unity is more obvious when non-equilibrium collisional ionization is considered (Oppenheimer & Schaye 2013). This naive assumption is a compromise due to the limited amount of information available, and future spectroscopic observations could enable us to better estimate . Because of this assumption, many of the derived properties are actually lower limits. The second assumption concerns the morphology of the filamentary structure of the emitting CGM gas. All these filaments share a common narrow and elongated shape, despite different orientations relative to the quasar or the DSFG. Therefore, we can assume their intrinsic shape is also cylindrical filaments with width of about 3 kpc, which is far more likely than being all sheets viewed edge-on. This assumption enables us to relate the column density to the electron density, so that the width corresponds to
| (5) |
Combining the discussion above, we can place joint constraints on the physical conditions shown in Eqn. 1.
Appendix F Ly /H and the Effect of Dust Extinction
Following the discussion of the small value of Ly /H , we explore the potential scenarios that could lead to the difference between the observed Ly /H and the theoretical value which varies only in the range 8.1–11.6 as a function of temperature and electron density (Hummer & Storey 1987; Dijkstra et al. 2019; Langen et al. 2023). Firstly, the Milky Way foreground dust attenuation is expected to have negligible effect at the observed sky position at near-infrared wavelengths. But the observation sensitivity could severely bias the line ratio map to a lower value, as the signal-to-noise ratio threshold sets a ceiling for the 1/SB(H ) term, and the value changes across the map due to degradation of sensitivity near the edge of the field. For example, the ratio of the threshold cuts is approximately 8 after being smoothed to the same spatial resolution, and the value further decreases in the edge pixels. Thus the value of Ly /H bears large uncertainty, and the interpretation of this value should be taken with caution. In addition, [N ii] and [S ii] lines fall in the same filter as H (Fig. 6), and they could reach a similar level and even beyond in solar to super-solar metallicity strongly shocked medium (c.f. Dopita et al. 2005; Allen et al. 2008). The strong low-ionization metal lines poses an explanation that is aligned with multiple evidences pointing towards mechanical heating, yet it is also non-trivial to coordinate with the metallicity estimated in the CGM gas.
Despite the low fidelity and possible line confusion, the observed Ly /H 3 could also result from two astrophysical effects, which are the scattering of Ly photon off the LoS and the dust extinction. In the first scenario, considering that the emitting gas in filaments is optically thick for Ly , cylindrical filaments with elliptical cross-section, such that the major- and minor-axis are along and orthogonal to the LoS respectively with a ratio of 5:1, would be able to reproduce the fraction of Ly lost to scattering. This would increase our simple estimation for the gas column density in Eqn. 5, while changing other parameters accordingly.
If the loss of Ly is solely attributed to the dust extinction, at least 60% of the Ly would be absorbed by dust based on the theoretical lower limit Ly /H 8.1. On one hand, it strengthens the arguments on the recombination dominated Ly production and the feedback enrichment in the CGM, and lifting the gas heating budget for the powering mechanism. However, this additional degree of freedom adds to the complexity of the quantitative characterization of the conditions in the CGM, especially the ones based on [O iii] /Ly . Assuming that the intrinsic Ly is a factor of 3 higher, the parametric constraints in Eqn. 1b and 3 would be relaxed accordingly, e.g. O/H = -4.5 (6% Z⊙ ) if and remain unchanged. Because [O iii] /Ly = 1 is used in Eqn. 3 to derive Eqn. 1a, the latter would need to increase by a factor of 3 on the right hand side. Therefore, the metallicity estimation for the system can be lower, but an even higher pressure is required.
Taking this assumed extinction of Ly and our simple estimation of ionized gas column density, we can estimate the dust column density as well as an upper-limit for the dust-to-gas ratio. Again, comparing Ly /H 3 to the lower limit of 8.1, we can derive . The type of dust surviving in the outflow to CGM is highly uncertain and is subject to active research (e.g. Farber & Gronke 2022; Richie et al. 2024), so we use the extinction curve derived in Calzetti et al. (2000) ( = 4.05) that is widely used for DSFGs. This translates to = 0.12 mag, though it is worth noting that because different extinction curves diverge significantly in the far-ultraviolet wavelength range, this value can change by a factor of 3 if a different type of dust is adopted. This extinction value is significantly higher than the typical excess of 0.003–0.005 mag measured for = 0.05–0.3 galaxies at impact parameter 60 kpc (Ménard et al. 2010; Peek et al. 2015). Whereas the division to the estimated ionized gas column density gives a dust-to-gas ratio (DTG) , which is 50 times lower than those of the Milky Way and Large Magellanic Cloud, and 20 times lower than the Small Magellanic Cloud DTG (Predehl & Schmitt 1995; Martin et al. 1989; Draine 2003). Using the metallicity estimation of 6% Z⊙ after the correction for dust extinction, the dust to metal ratio is estimated to be about 35% that of the Milky Way, albeit comparable to the measurements of the high-z damped Ly absorbers (De Cia et al. 2013). The small DTG is also aligned with the theoretical calculation that DTG can decrease by one order of magnitude in hot winds (Richie et al. 2024). Because only the ionized column is estimated and used in the calculation, we remind the reader that the total gas column density could be underestimated, making the derived DTG an upper-limit.
Due to the limited information in imaging data, it is up to the future spectroscopic observations to distinguish between different scenarios.
Appendix G Inconsistency with Photoionization.
Even though it is strongly argued in the previous section that the extended [O iii] , H and Ly emission arise from ionized gas, the exact mechanism that powers these emissions is not clear. Photoionization from the quasar has been widely conjectured as the powering source for CGM emissions, especially for the large Ly “nebulae” around quasars (Cantalupo et al. 2014; González Lobos et al. 2023). However, multiple features observed in this system unfavor the role of quasar photoionization.
For the CGM gas in the south, we can reject the quasar photoionization as a major powering source based on the high surface brightness observed at large distance. An upper-limit can be placed on the radiative energy corresponding to the photoionization powered CGM emission. Using the magnification corrected 5000Å continuum, we can estimate the luminosity of the quasar to be , modulo the unknown dust attenuation effects. For our estimation, we assume an extreme case such that the central quasar ionizing luminosity that enters the CGM () is (corresponding to ), which is an extreme combination of the quasar luminosity, spectral energy distribution, and the ionizing photon escape fraction for a broad absorption line quasar like SMM J02399-0136, or that the CGM is illuminated by photons escaping through unobscured lines of sight in the quasar. Consider the furthest feature L3 at a projected distance of 60 kpc, which is a lower limit for the physical distance between the quasar and L3. Assuming a cylindrical geometry with width 3 kpc, the incident ionizing photon energy per 1 kpc length is .
However, the observed high [O iii] surface brightness translates into a luminosity in every 1 kpc length segment, after correcting for gravitational lensing. The actual unit luminosity of the filament is at least twice the value above when adding up all the line emissions, e.g. Ly which is about as bright as [O III]. Therefore, even with the unlikely assumption that all the energy of the ionizing photon are converted to line emission, the quasar photoionization is only able to account for a small fraction of the observed bright CGM emission, falling short by at least 70%. The photoionization scenario is fundamentally limited by the small filling factor of the gas clouds which makes them less effective in reprocessing the quasar radiation. (Appendix E). The problem is further worsened when considering the large amount of very hard photons (¿ 35.1 eV) and high ionization parameters needed to keep oxygen in the O2+ forms.
In addition, the observed value of [O iii] /H is significantly higher than the predictions expected from the photoionization even for solar metallicity gas (Arrigoni Battaia et al. 2015), while it could only be explained by the shock models at solar metallicity (Allen et al. 2008). It is even more challenging to invoke quasar illumination as the powering source for the extended emission to the southwest and to the west, since they are potentially blocked by the dust in the DSFG from the quasar sight lines. Therefore, in contrast to the previous studies on Ly “nebulae” that focused on quasar illumination, mechanical heating plays an non-negligible role in the CGM of SMM J02399-0136 system even at 60 kpc projected distance from the quasar.
Appendix H Heating in L2.
L2 and the features surrounding it provide an example how the shock can directly shape and power the observed [O iii] and Ly line emission. A previous radio survey at 1.4 GHz identifies an extended (4” 1.1”) radio source between the quasar (L1) and the irregular galaxy (L2) (Ivison et al. 2010; Wold et al. 2012). This radio source is elongated in the east-west direction and coincident with the eastward plume (L1E1). Therefore, we conjecture L1 launches a jet towards the direction of L2, traced by both the radio emission and the narrow [O iii] plume L1E1.
Several lines of evidence, including the presence of the jet, the irregular shape of the companion galaxy L2, the brightened Ly and [O iii] from the northwest extension of L2, the [O iii] emission extending to the north (L2N1) and to the east (L2E1, L2E2), taken together support the view that the observations we present here are an aftermath of a relativistic jet clashing with and disrupting the ISM in L2. The northwest extension is the location of the direct interaction which shows enhanced [O iii] brightness and peaks in the Ly map, while the clumps in the north (L2N1) are the ISM that is shock heated, blown away, and cooling through the [O iii] line emission T the filaments further to the east (L2E1, L2E2) are the tails of the gas that is stripped away. The offset in the Ly and [O iii] peak near L2 is most likely a result of the low escape fraction of Ly photons from the ISM in L2.
Appendix I Heating, Cooling, and the Outflow Rate in the Parallel Stripes.
There are several mechanisms that may be responsible for the parallel filaments (stripes) seen in the south, including shock heating by the quasar jet, outflows driven by the starburst in DSFG, and the DSFG-quasar merger.
Morphologically, the possible connections between the stripes (L2S1 & L2S2) and the [O iii] plume (L1W1 & L1W2) could suggest that they are the shock fronts (cone) of the propagating jet. On the other hand, the parallel alignment between these stripes, the DSFG disk, as well as the DSFG-quasar merger, are also consistent with either the starburst or tidal interaction driven outflows.
We can further estimate the timescale and outflow rate associated with the parallel stripes. We assume a typical speed 1000 km s-1 for an [O iii] wind, which is consistent with the linewidth of the Ly “nebula”, the linewidths of the ultraviolet (UV) emission lines of this quasar, as well as the velocity of a broad absorption line system in the (UV) spectrum of the quasar (Vernet & Cimatti 2001; Li et al. 2019). Taking the projected distance 60 kpc, the travel time for the furthest point (L3) is about 60 Myr. Assuming a density of 1 cm-3 and cylindrical geometry, each of the filamentary structures of size 2.5 kpc 15 kpc contains ionized gas. Therefore, by considering only the three parallel stripes as the feedback remnants from the DSFG-quasar system, we can estimate an upper-limit for the outflow rate as 130 .
In the context of quasar feedback, the separation of the stripes represents the episodic nature of the AGN activity at an interval of about 15–30 Myr, and the ratio between the width and the separation can be naively interpreted as a duty cycle = 8–16 %. These values are roughly consistent with estimations based on quasar number density and growth history (e.g. Martini 2004; Eilers et al. 2024), though with large uncertainties. This timescale also agrees with the molecular cloud lifetime observed in nearby galaxies(Kruijssen et al. 2019; Chevance et al. 2020) as well as the gas depletion time estimated for this galaxy (Vidal-García et al. 2021), and the estimated outflow rate is within a factor of 3 compared to the star formation rate. Thus, the parallel stripes can also be explained by either the scenario of episodic star formation such that the molecular clouds are destroyed by the stellar feedback and a certain period elapses before the gas is cooled down again for another round of star formation, or the episodic starburst scenario where the galaxy is alternating between fast accumulation of molecular gas and intense star formation that consumes the former and halts inflow from CGM.
In the outflow scenario, the kinetic energy in the gas matches roughly as the radiative energy over the outflow timescale. Using the outflow rate estimated before, we can infer a kinetic energy of in each stripe when it was launched in the galaxy. On the other hand, cooling in each stripe through [O iii] and Ly lines has at least a luminosity , and the corresponding radiative cooling timescale is less than 55 Myr, comparable to the estimated travel time. However, this simple calculation ignores the fraction of the initial kinetic energy that would be used in work against gravity to reach such distance, and it also assumes that the physical distance between the objects is the same as the projected distance on the sky. The estimation also bears a large uncertainty in the initial outflow velocity, as doubling the initial velocity would quadruple the kinetic energy while halving the expected travel time, making the radiative dissipation a smaller fraction of the total energy budget.
Besides, the estimated orbital period for the DSFG-quasar merger also falls into the same range as the stripe separation (Appendix I). The dynamical mass of the DSFG can be estimated from the CO(=3-2) observation (Frayer et al. 2018). Using a linewidth and observed CO disk radius 3 kpc ( 1”), the dynamical mass of L2SW is estimated as , twice of the estimated molecular gas mass. Based on multi-band images and various gas tracers, the quasar does not account for a significant fraction of mass in the system. Thus taking a conservative estimation that dark matter mass is equal to the baryon within the sphere spanning from L2SW center to L1, we can derive a reduced mass for the merging system as . As a heuristic calculation, we use a semi-major axis = 3 kpc and zero eccentricity, then the orbital period for the DSFG-quasar merger can be estimated as
| (6) |
Therefore, it is difficult to pin down the exact process responsible for the observed CGM gas distribution in this system, and the AGN activity and starburst may be fundamentally driven by the merging process. Future spectroscopic observations can help us learn the kinematics of these filaments, and test these scenarios with the linewidths as well as their connections to the host galaxies in the velocity space.
Appendix J Comparison with BCG Filaments
We note that similar filaments of ionized gas have been found through H emission surrounding local BCGs such as Perseus A, extending for 10 to 50 kpc (Conselice et al. 2001; Fabian et al. 2003). The origin of these filaments is still subject to active study, while the morphology and kinematics of the gas favor the scenario that they are compressed by the active galactic nuclear (AGN) feedback, though other heating mechanisms including magnetic fields and cosmic rays may also be important in powering these filaments (Fabian et al. 2008, 2011; Fabian 2012; Fabian et al. 2016; Tremblay et al. 2018; Olivares et al. 2019; Vigneron et al. 2024). In addition, low frequency radio observations have found synchrotron-emitting filaments at intracluster medium (ICM) scale ( 200 kpc), as a result of the interaction between radio jets with the magnetic filaments in the ICM (Rudnick et al. 2022). Therefore, we suggest that high-resolution, low-frequency radio observations can help us better understand the nature of these filaments, by revealing the exact location of the quasar jets as well as the potential existence of radio filaments around this system. From a theoretical point of view, these cooling stripes are also reminiscent of recent numerical studies (e.g. Thompson et al. 2016) picturing the cooling shocks and the rebirth of “cool” clouds as feedback gas mixes with hot CGM while decelerating at the same time.
These filaments play important roles in the evolution of the host galaxy system. The estimated outflow rate already accounts for 1/3 of the star formation rate in the system. And given the previous studies that find the outflow mass is often dominated by molecular gas (Tombesi et al. 2015; Feruglio et al. 2015), the feedback revealed by the stripes is able to expel a significant fraction of gas in the host galaxies and quench the star formation. Around local BCGs, extended massive molecular filaments or clumps are found in close spatial correlation with the H filaments, hypothesized as gas clouds that are uplifted by feedback and will flow back onto the host galaxies, fuelling future star formation (Olivares et al. 2019). Besides, streaks of young stars or star clusters exist at locations near but offset from the BCG H filaments, which are likely results of in-situ star formation of the gas filaments, and could feed the growth the stellar halos of the host galaxies (Canning et al. 2014). Although [O iii] filaments around SMM J02399-0136 are different from the BCG H filaments in several ways, including their higher ionization state, the larger extent with respect to the mass of the group or cluster system, as well as the absence of stellar continuum near the filaments; these [O iii] filaments observed at redshift 2.8 could be at an earlier and/or more energetic stage of the CGM gas filaments formation dominated by recent feedback events, while the local BCG H filaments represent an evolved and cooler phase that is able to refuel the AGN and star formation activities in and around the host galaxies (Tremblay et al. 2018).