Flagellar damage and recovery in soil bacteria exposed to shear in long microchannels
Abstract
The outermost structure of the bacterial flagellar motor is a long helicoidal filament, whose protein building blocks are produced and injected from the base, progressively elongating the filament and regenerating it in case it breaks. Here, we study the evolution of flagellar filaments in the soil bacterium Bradyrhizobium diazoefficiens after being exposed to shear flows, for shear rates between and , and for durations between tens of milliseconds and minutes. We demonstrate that the average swimming speed and fraction of swimming cells decrease after exposition to shear, but both parameters can recover, at least partially, with time. These observations support the hypothesis that flagellar filaments are cut by shear flows, but that reversibly damaged flagellar motors can be restored thanks to filament regeneration. By fitting our observations with phenomenological expressions, we obtain the individual growth rates of the two different flagellar filaments that B. diazoefficiens possesses, showing that the lateral filaments have a recovery time of about while the subpolar one requires more than to regrow. Our work demonstrates that a simple monitoring of bacterial motility after exposition to shear can be used to characterise the process of flagellar filament growth.
I Introduction
The bacterial flagellar motor is a complex protein-based structure responsible for swimming motility. Despite the large diversity among different species, the basic structure is highly conserved, and consists of a basal body that includes a stator and a rotor, and a long helicoidal filament, joined to the basal body through a flexible hook [1]. The formation of the flagellar motor proceeds from the inside-out, in a wonderfully orchestrated process [2]. Once the basal body and hook are formed, the filament grows through an injection-diffusion mechanism [3, 4], in which flagellin proteins are injected through the export apparatus and diffuse in single line through the hollow structure of the filament until they reach the free tip, where they immediately crystallise, progressively extending the filament. After its assembly, the motive force of the flagellar motor are protons or ions crossing the membrane that cause conformational changes of the stator and the consequent rotation of the rotor. Such rotation is transmitted to the hook and the helical filament, resulting in the propulsion of the cell in the surrounding viscous medium [5].
In contrast to the rest of the components of the motor, which have a precisely defined number and relative stoichiometry of the conformational proteins, the filament grows continuously and can be formed by a variable number of flagellins. The resulting swimming speed of the bacteria is then proportional, not only to the rotational frequency of the flagella, but also to their number and the length of their filaments, at least as long as their length is below an optimal value [6, 7, 8, 9, 10].
Long flagellar filaments can be easily broken due to environmental factors such as shear or attachment to solid boundaries or debris [11, 12]. For example, soil bacteria are constantly exposed to external flows produced by rainfall or irrigation systems, which can cut their flagella. In such cases, continuous growth of the flagellar filament enables a recovery mechanism to ensure sustained motility. To study the flagellar damage and recovery, in this work we conducted experiments where bacteria were exposed to a controlled shear flow, and its effect on motility, specifically on the fraction of swimming bacteria and their swimming speed, was observed.
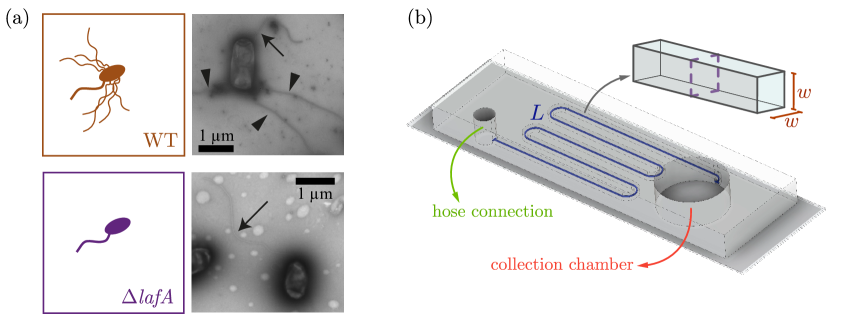
Our experiments were performed using a natural soil bacterium, the nitrogen-fixing symbiont of the soybean, Bradyrhizobium diazoefficiens. Besides its relevance in sustainable agriculture as a biofertilizer [13], B. diazoefficiens is an interesting model microswimmer as it possesses two different flagellar systems: the subpolar system, consisting of a single thick flagellum, constitutively expressed, located near one pole of the bacterium body, and the lateral one, consisting of several thin and long flagella peritrichously located on the bacterium body that can be expressed depending on the available carbon source and viscosity of the medium [14, 15]. Although evolutionarily distinct, both flagellar systems crosstalk, with the subpolar flagellum acting as mechanosensor that regulates the expression of the lateral flagella [16]. The presence of both flagellar systems appears to confer B. diazoefficiens an advantage for swimming motility, at least far from solid boundaries, as the average swimming speed is reduced in mutants devoid of one of the two flagellar systems and specially in the absence of the subpolar flagellum [17, 14, 18]. These evidence suggests that both types of flagella can have different responses to environmental conditions and regeneration rates. To test this hypothesis, we expose to shear two different strains of B. diazoefficiens, the wild type (WT) expressing both flagellar systems, and a mutant strain (lafA) that only has the subpolar flagellar system, and monitor their behaviour after various shearing conditions (Fig. 1). In this way, we decouple the recovery of both flagellar systems. Overall, our study gives insight into the damage that fluid shear can cause on the bacterial flagellar motor, and enables a simple yet powerful means to monitor the flagellar growth from the main motility parameter of the bacterial population.
II Methods
II.1 Culture protocols
Two different strains of B. diazoefficiens USDA 110, obtained from the United States Department of Agriculture, Beltsville, were used: the WT has both flagellar systems, while the lafA is a mutant with a genomic deletion that can only express the subpolar flagellum [17] (Fig. 1(a)). For routine use, bacterial stocks were maintained at in solid yeast extract mannitol-agar medium (YEM agarized at ) [19], which were renewed every three months. For the WT strain, Chloramphenicol () was used for the semi-solid medium. For the experiments, cultures in liquid growth medium HMY-arabinose [16] were initiated from a single colony in the agar plates and grown at a temperature of and 180 rpm of agitation to late log phase, until reaching an optical density at wavelength [20]. Bacteria were then diluted in of the same medium, setting the initial to 0.1. This reculture was grown at the same temperature and agitation until it reached . Finally, a 1:5 dilution of the reculture in HM-salts supplemented with L-arabinose and PVP-40 (Polyvinylpyrrolidone-40, Sigma Aldrich) at w/v (HM-Ara-PVP) was kept at rest without agitation at for before inoculation into the microfluidic device for an optimal motility. By using PVP-40 in the minimal medium solution, adhesion of the bacteria to the walls was prevented and self-agglutination was reduced [21]. Despite observations indicating that lateral flagella are adapted for swimming in viscous media [16], we expect that the small concentration of PVP-40 used here affected negligibly the bacterial behaviour.
II.2 Microfluidic devices and shearing conditions
Microfluidic devices were fabricated using maskless optical lithography and soft lithography [22, 23]. They consist of thin microchannels of square cross section, in width/height, and a controlled length that ranges between and . For lengths longer than , the microchannels are bent as a serpentine to fit in a microscope slide. A schema of a serpentine microchannel geometry is shown in Fig. 1(b).
In a first set of experiments, bacteria were exposed to flows over a constant distance in a straight microchannel of length . The injection flow rate was varied in order to regulate the mean shear rate [24]. Since to increase the flow rate was increased, the time for which the microorganisms were sheared varied in each case, decreasing for increasing .
In the second set of experiments, the samples were sheared in microchannels of different lengths, which were designed for each target average shear rate in order to maintain a constant shear time, as explained next. The shearing time depends on the flow as , which in terms of the mean shear rate is . Thus, in order to maintain a constant shear time , the length of the microchannel had to be proportional to the desired . The shearing time was fixed at , and the microchannel lengths were adjusted accordingly.
A summary of experimental condition, i.e., mean shear rates , channel lengths , injection flow rates and shearing times , are shown in Tab. 1. Note that the maximum shear rate that we could attain in the experiments with constant shearing time was lower than in the experiments with constant shearing distance. The limitation was technical: the longest channel was over in length, requiring a very high pressure for its operation. For longer channel lengths the tubing used for injection did not withstand such high operating pressures and disconnected from the microchannels.
| Constant shearing distance | Constant shearing time | |||||
| () | () | () | () | () | (nL/s) | (s) |
| 45 | 0.0168 | 600 | 4.5 | 0.0168 | 60 | |
| 45 | 0.168 | 60 | 45 | 0.168 | 60 | |
| 45 | 1.68 | 6 | 450 | 1.68 | 60 | |
| – | – | – | 2250 | 8.44 | 60 | |
| 45 | 16.8 | 0.6 | – | – | – | |
| 45 | 168 | 0.06 | – | – | – | |
For the control , the motility was measured directly in the cylindrical microfluidic cavity without exposing bacteria to flow.
II.3 Inoculation and data acquisition
To prepare the microfluidic device for the experiments, one end of a hose was connected to the microchannel, while HM-Ara-PVP was injected through the other end of the hose using a glass syringe and syringe pump (neMESYS Base 120 and low pressure module V2, Cetoni). Once the microchannel was filled, making sure that no air bubbles were left inside, the injection was stopped and the collection chamber was emptied, so that only the microchannel was flooded. Then, the syringe was disconnected and replaced by another one containing the bacterial suspension used in the experiment. Finally, the bacterial suspension was injected through the hose with a constant flow rate, going through the microchannel until it arrived at the collection chamber (Fig. 1). Once filled, the sheared suspension was transferred to a large cylindrical cavity, in order to avoid flow, where bacterial swimming was observed.
The bacteria in the cylindrical microfluidic cavity was observed with a Nikon Eclipse TS100 microscope in bright field, a 40/0.6 NA objective and an Andor Zyla sCMOS camera. Videos were recorded at 50 fps (frames per second), with an extension of 1000 frames and a resolution of 1024 1024 pixels2. Calibration for the optical system indicates a ratio of 6.24 pixel/, this implies that the imaged regions have an area of 164 164 .
Measurements for all shear rates were performed with three biological replicas of each strain.
II.4 Fraction of active bacteria and swimming speed
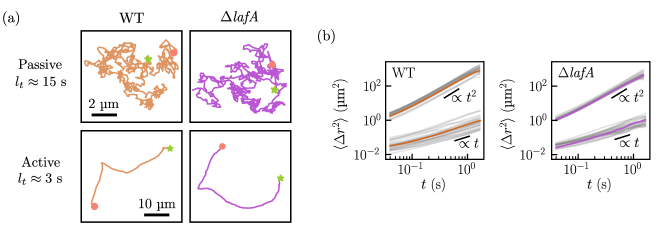
The videos obtained from the experiments were processed with Fiji (ImageJ) software [25] to enhance their brightness and contrast, and then analysed with our open source software Biotracker [26, 27, 28] to obtain the trajectories of the bacteria. Trajectories revealed two markedly different bacterial motility patterns. The “active” bacteria evidently self-propelled and swam for considerable distances in little time intervals, whereas the “passive” bacteria showed erratic and fluctuating movement reminiscent of Brownian motion (see Fig. 2(a)). This is consistent with previously reported swimming behaviour of B. diazoefficiens [14, 29, 30] and also common in other bacterial species [31].
To distinguish between active and passive bacteria, we computed the mean-squared displacement (MSD) for each trajectory, as
| ((1)) |
where represents an average over all possible initial times in the trajectory, . The MSDs of active and passive bacteria were clearly segregated, and grew quadratically and linearly with time lag , respectively, as shown in Fig. 2(b). This allowed us to establish a robust criterium to distinguish between active and passive bacteria. Accordingly, the fraction of active bacteria was defined as
| ((2)) |
where and were the number of active and passive bacteria in the suspension, respectively.
The behaviour of the MSD curves was consistent with the theoretical MSD of a self-propelled particle subjected to thermal noise in two dimensions [32, 33]
| ((3)) |
where is the diffusion coefficient associated with thermal fluctuations in the liquid medium, is the self-propulsion speed and is the characteristic reorientation time, which combines effects of thermal rotational diffusion and bacterial reorientations. For passive particles, and , thus allowing us to obtain a diffusion coefficient , consistent with the expected diffusion coefficient of a Brownian particle of diameter (the error corresponds to the standard deviation of all diffusion coefficients measured for passive bacteria). For active particles, provided that , one obtains
| ((4)) |
Thus, by fitting each of the MSD curves of active bacteria (grey curves in Fig. 2(b)), their individual swimming speed was obtained.
III Results
III.1 Motility decay
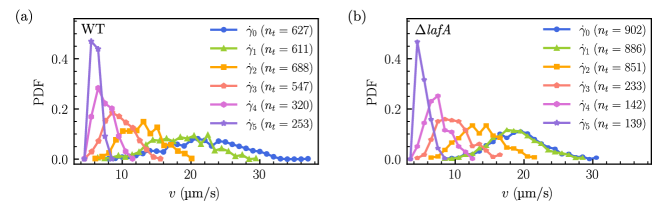
The probability density function (PDF) of the swimming speed for active bacteria sheared for constant length with varying mean shear rate are shown in Fig. 3. A qualitatively similar result was obtained for constant shearing time (not shown). For both strains, both the mean and standard deviation of the swimming speed distributions decreased as the mean shear rate increased. That is, as the shear stresses to which the bacteria were subjected increased, they swam slower and the variability between the swimming speeds of the bacteria in the suspension also decreased. Since only the swimming speed of active bacteria were considered for the construction of the distributions shown in Fig. 3, the decrease in the mean swimming speed was not due to an increase in the number of passive bacteria in the suspension, instead the active bacteria were self-propelled with lower speed.
The averages of the swimming speed distributions, , are shown in Fig. 4(a) for both constant shearing length (solid symbols) and constant shearing times (open symbols). Up to the highest mean shear rate studied in the experiments with constant shearing time, no systematic differences were apparent in the drop of mean swimming speed between the experiments with constant shearing length versus constant shearing time.
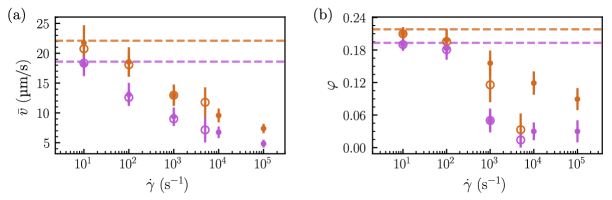
On the other hand, Fig. 4(b) shows the active fraction, , of each strain as a function of the mean shear rate of the flow to which they were exposed. It can be seen that for both strains there was a slow decay of up to shear rates , and once this critical shear rate was exceeded, the active fraction decayed rapidly for both strains. When comparing the experiments performed with constant shearing distance versus constant shearing time, a notorious difference between strains was observed. The decrease in active fraction of WT was much more pronounced when the shearing was applied for a constant time in comparison with a constant shearing length, whereas the active fraction of the lafA decayed in a similar way, independent of the shearing conditions.
In these experiments it was only possible to visualise the body of the bacteria moving while they swam, i.e., it was not possible to see their flagella. However, based on the results reported in other works [6, 8, 34, 11, 9], a plausible hypothesis can be put forward to explain the decrease in the mean swimming speed and active fraction observed in both strains with increasing (Fig. 4). Considering that the swimming speed is proportional to the length and number of flagellar filaments, at least part of the bacteria’s flagellar motors may have been damaged, either reversibly by a partial or total cut of the flagellar filaments, or irreversibly because of a compromise of the more internal flagellar structures. Since the WT strain possesses two flagellar systems, complete cut of filaments and/or irreversible flagellar damage on some (but not all) of the flagellar motors of a cell would still enable it to swim, albeit with a lower speed. Conversely, a WT cell with all of its flagellar filaments completely cut and/or flagellar motors irreversible damaged, would become a passive bacterium. The lafA strain, on the other hand, has a single flagellum, thus a partial filament breakup would decrease its swimming speed while a complete filament cut or an irreversible damage on the flagellar motor of a cell would render it passive. The fundamental difference between a completely cut filament and an irreversibly damaged motor is, of course, the possibility of recovery of the broken filament. Thus, a bacterium that became passive following the complete mutilation of all of its flagellar filaments but whose internal flagellar structures remained intact, would eventually recover motility and become an active bacterium again.
Based on this hypothesis, we postulate that higher shear rates may have cut more flagellar filaments and/or irreversibly damaged more flagellar motors, causing a larger drop in the bacteria’s swimming speed and active fraction. In the case of the WT strain, both effects could explain the decreased in swimming speed, while in the case of the lafA mutant, the reduction of swimming speed shown in Fig. 4(a) would reflect only the partial breakup of its flagellar filament. The similarity of the velocity decrease in the experiments with constant shearing distance and constant shearing time suggests that, for both types of flagella, the general length and number distribution of remaining filaments does not depend on the time and distance of exposure to the flow, but only on its shear rate.
On the other hand, the drop in the fraction of active bacteria in WT and lafA suspensions as a function of shear rates (Fig. 4(b)) could be understood as an increase in bacteria whose flagella were completely damage, either reversibly or irreversibly. In general, the drop in active fraction for the WT strain was less pronounced than for the lafA mutant with increasing shear rates, which suggests that the presence of lateral flagella helped protect bacteria from completely losing their motility when exposed to external flows, either, for example, because their lateral flagella are more resistant to shear stresses or because they modify the coupling with the flow, reducing the probability of flagellar damaged. This is consistent with the observation that the decrease in active fraction for the lafA was comparable in the experiments with constant shearing distance and constant shearing time, suggesting that the mere exposition to shear can produce important damage to the subpolar flagellum if it is not protected by the lateral flagella, independent of the duration of the shearing. In the case of the WT strain, on the other hand, the decrease in active fraction was significantly higher in the experiments with constant shearing time, suggesting an increased damage to lateral flagella if the shearing is sustained for a considerable amount of time, in this case for .
III.2 Motility recovery
Because the broken flagellar filaments of bacteria are able to regenerate [3, 4, 12], the hypothesis that the shear on bacteria exposed to an external flow can cut their flagella, decreasing their swimming speed, can be tested by studying the evolution of the motility of a sheared suspension. Then, if indeed the flagellar filaments of bacteria were cut by their exposure to the flow, causing the drop of and , a recovery of motility should be observed as the filaments regenerate, which could be quantified by measuring the time evolution of these parameters after being sheared.
In accordance with the above, the time evolution of the motility parameters and was studied in the suspensions that were exposed to the flows with the highest mean shear rates ( in the experiments with constant shearing distance and in the experiments with constant shearing time), since they corresponded to the cases with the highest loss of motility. For both strains, partial recovery of the fraction of active bacteria in the suspensions and of their mean swimming speed was observed, as shown in Fig. 5.
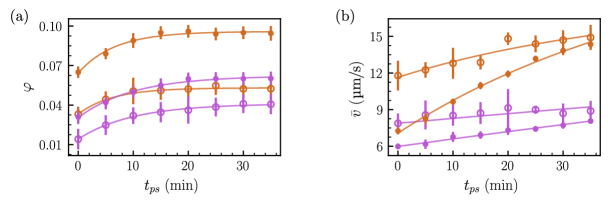
Measurements of the active fraction of these suspensions as a function of post-shearing time, , exhibited partial recovery, which saturated at lower values than the control (see Fig. 5(a)). The saturation values were consistently lower for the experiments with constant shearing times, implying that a larger number of cells had all of their flagella irreversibly damaged when the shearing was sustained for longer time. Similarly, the mean swimming speed of the sheared suspensions of both strains was recovered with post-shear time (see Fig. 5(b)). In this case, no saturation of the mean swimming speed was observed for the duration of the experiment (). However, the curves seemed to converge to similar saturation values for each strain, irrespectively of the shearing conditions. This suggests that bacteria that retain functional flagella after the shearing would eventually recover similar levels of motility, irrespective of the shearing conditions.
To characterise the recovery of active fraction of bacteria for each strain, the following empirical expression was proposed to fit the experimental data:
| ((5)) |
where is the fraction of active bacteria in the control, non-sheared suspensions. In this model, , thus is the fraction of initially active bacteria that remain active immediately after the shearing process. Also, , thus is the fraction of bacteria that recover motility with time, conversely, , is the percentage of initially active bacteria in the suspensions whose flagellar motors were permanently damaged in the shearing process, making it impossible for them to recover their motility by regenerating their flagella.
The fitting parameters for each strain and for the different experimental conditions is presented in Tab. 2. The fraction of remaining active bacteria, and the fraction of recovered bacteria, varied depending on the strain and shearing conditions, reflecting the effect of shear on the flagellar motors. Consistent with the observations in the previous section, we observed that, in both experiments, a larger fraction of WT bacteria remained active after the shearing process () in comparison with the lafA mutant, presumably thanks to the protective effect of the lateral flagella, as proposed above. Similarly, the recovery percentage of active bacteria () was also larger for the WT strain. Again, this suggests that the presence of lateral flagella provided some degree of protection to the bacterial body, not only to the decrease in filament breakup but also against permanent damage to the flagella.
The regeneration times should be interpreted as the characteristic time necessary for a bacterium whose flagellar filaments were completely, but reversibly, cut, to regain motility, i.e., the time necessary for the flagellar motors of a cell to become functional again after a complete filament cut. The characteristic regeneration times of the active fraction obtained from the fitted curves were independent, within error bars, of the shearing conditions, and shorter for the WT than for the lafA. This suggests that the flagella regeneration rate of the WT strain is higher than that of lafA. This can be verified by studying the recovery of the bacteria’s mean swimming speed, which is proportional to flagellar filament length [6, 7, 8, 9].
| Exp | () | () | () | () | () | () | () | () | () |
|---|---|---|---|---|---|---|---|---|---|
| WT-d | 30 | 43 | 289* | ||||||
| WT–t | 15 | 24 | 261* | ||||||
| lafA-d | 18.59 | 16 | 31 | – | – | ||||
| lafA-t | 7 | 21 | – | – |
*Obtained from the recovery curve of lafA.
The mean swimming speed of the sheared suspensions of both strains was also recovered with post-shear time (see Fig. 5(b)). Based on the hypothesis that the speed recovery occurs thanks to the elongation of the filaments of flagellar motors that were reversibly damaged, and assuming that those bacteria will eventually recover, on average, their original speed, then the expression that we propose is:
| ((6)) |
where is the reference average swimming speed in the non-sheared suspensions. In Eq. ((6)) there are now two characteristic times: associated with the regeneration of filaments in the lateral flagella and associated with the regeneration of the filament of the subpolar flagellum. In contrast with , these times quantify the time required for a full regeneration of the flagella, not only to regain functionality. Accordingly, and are the relative decrease in swimming speed associated with the cut of the subpolar and lateral flagella, respectively. Since the mutant strain lafA only possesses the subpolar flagellum, it is possible to assume that the regeneration time is just and that in this case. For the WT strain, on the other hand, we assume that the subpolar flagellum recovers at the same rate that for the mutant strain, and only , and are left as adjustable parameters.
The fitting curves are shown as solid lines in Fig. 5(b), and the fitted parameters are presented in Tab. 2. The characteristic recovery time of each type of flagellar filaments was comparable in the different shearing conditions, although they were systematically longer when the cells were sheared for a constant distance and shorter time. The reason behind this is unclear, although at least for the WT, one possible reason is that the hypothesis of full speed recovery is not fulfilled due to irreversible damage of some of the flagella. Comparing the two different flagellar types, the filament regeneration time was notoriously shorter for the lateral flagella than for the subpolar one. This explains why the WT strain, that possesses both flagellar systems, recovers its motility faster than the lafA, which possesses only a subpolar flagellum.
Finally, we note that for the WT in experiments with constant shearing distance, was significantly lower than , meaning that the loss of swimming speed was mainly attributable to the damage in the lateral flagella in that case. In contrast, for constant shearing time, was larger than . This would indicate a more important damage in the subpolar flagellum due to the sustained shearing, despite the protection of the lateral flagella. For the lafA strain, the percentage of swimming speed loss, , in both shearing conditions was larger than for the WT. The fact that it was smaller for constant shearing time than for constant shearing distance ( vs. ) could be due to the smaller shear used in the experiments with constant shearing time. This is consistent with the observations in the previous section, where the loss in swimming speed and active fraction for the lafA was independent of the shearing conditions and only depended on the value of shear.
IV Discussion
The picture that emerges from our experimental results is one where soil bacteria, usually exposed to shear flows that partially cut their flagellar filaments, possess a recovery mechanisms to maintain the efficiency of swimming motility. Of the two flagellar systems that B. diazoefficiens can express, the subpolar flagellum is thicker and appears to be the fundamental actuator for swimming motility, as suggested by the poor swimming behaviour of the mutants lacking it [14, 18]. At the same time, our observations with the lafA mutant suggest that this flagellum is highly sensitive to shear, with this strain being rapidly affected by shear even for very short time periods of merely for sufficiently large shear rates, displaying a dramatic drop of actively swimming bacteria and a lower recovery fraction. In comparison, motility is better conserved in the WT strain when exposed to shear, suggesting that, contrary to our original expectations, the thin and long lateral flagella can better stand sustained shear than the thicker subpolar flagellum.
On the other hand, our measurements of motility recovery demonstrate a much shorter recovery time for the lateral flagella than for the subpolar one. This is consistent with the lower molecular weight of lateral flagellins ( for lateral flagellins vs. for the subpolar flagellins) [14], making their diffusion much faster. This observation can also be related to the fact that the metabolic rate of the WT is approximately three times higher than the metabolic rate of the lafA mutant, since the WT has to continuously regenerate 3 to 5 lateral flagella more than the lafA mutant, which only regenerates the subpolar flagellum [35]. It is possible that these filaments may undergo continuous breakup, countered by filament growth, even in presence of moderate shear rates such as the continuous shaking during incubation, and this difference in metabolic rate reflects the continuous synthesis of lateral flagellins.
It has been observed that the subpolar flagellum acts as a mechanosensor that regulates the induction of lateral flagella, i.e., destabilisation of the subpolar flagellum induces a higher synthesis of lateral flagella [16]. This stimulus is unidirectional, and damage of lateral flagella does not influence the expression of the subpolar flagellum. Taken together, these observations suggest that lateral flagella act as a protection mechanism for the subpolar flagellum.
In brief, this work at the interface between physics and microbiology of soil bacteria, demonstrates that simple measurements of bacteria motility under shear flows in microdevices with long and thin microchannels can be helpful to better understand the two flagellar systems of B. diazoefficiens, a bacterium widely used as a biofertilizer. With these tools, we hope to inspire new microfluidic applications in sustainable agriculture.
Ethics
This work did not require ethical approval from a human subject or animal welfare committee.
Declaration of AI use
We have not used AI-assisted technologies in creating this article.
Authors’ contributions
JPCM: Conceptualisation, methodology, investigation, formal analysis, writing – original draft, writing – review & editing; MPM: Conceptualisation, supervision; ARL: Conceptualisation, writing – review & editing; VIM: Conceptualisation, software, writing – review & editing; MLC: Conceptualisation, supervision, writing – original draft, writing – review & editing.
Conflict of interest declaration
We declare we have no competing interests.
Funding
This research was funded by ANID - Millennium Science Initiative Program NCN19_170. VIM acknowledges support from grants: SeCyT-UNC: 33620230100298CB; FONCyT: PICT-2020-SERIEA-02931; CONICET: PIP-2023-11220220100509CO. Fabrication of microfluidic devices was possible thanks to ANID Fondequip grants Nos. EQM140055 and EQM180009. JPCM acknowledges funding from ANID Beca de Magíster Nacional No. 22221639. MPM acknowledges the postdoctoral Fondecyt Grant No. 3190637.
References
- Minamino and Imada [2015] T. Minamino and K. Imada, The bacterial flagellar motor and its structural diversity, Trends Microbiol. 23, 267 (2015).
- Macnab [2003] R. M. Macnab, How bacteria assemble flagella, Annu. Rev. Microbiol. 57, 77 (2003).
- Renault et al. [2017] T. T. Renault, A. O. Abraham, T. Bergmiller, G. Paradis, S. Rainville, E. Charpentier, C. C. Guet, Y. Tu, K. Namba, J. P. Keener, T. Minamino, and M. Erhardt, Bacterial flagella grow through an injection-diffusion mechanism, Elife 6, e23136 (2017).
- Chen et al. [2017] M. Chen, Z. Zhao, J. Yang, K. Peng, M. A. B. Baker, F. Bai, and C.-J. Lo, Length-dependent flagellar growth of Vibrio alginolyticus revealed by real time fluorescent imaging, Elife 6, e22140 (2017).
- Lauga and Powers [2009] E. Lauga and T. R. Powers, The hydrodynamics of swimming microorganisms, Rep. Prog. Phys. 72, 096601 (2009).
- Qin et al. [2012] F.-H. Qin, W.-X. Huang, and H. J. Sung, Simulation of small swimmer motions driven by tail/flagellum beating, Comput. Fluids 55, 109 (2012).
- Higdon [1979a] J. J. L. Higdon, A hydrodynamic analysis of flagellar propulsion, J. Fluid Mech. 90, 685 (1979a).
- Higdon [1979b] J. J. L. Higdon, The hydrodynamics of flagellar propulsion: helical waves, J. Fluid Mech. 94, 331 (1979b).
- Lisevich et al. [2024] I. Lisevich, R. Colin, H. Y. Yang, B. Ni, and V. Sourjik, Physics and physiology determine strategies of bacterial investment in flagellar motility, bioRxiv:2024.03.30.587422 10.1101/2024.03.30.587422 (2024).
- Nguyen and Graham [2018] F. T. M. Nguyen and M. D. Graham, Impacts of multiflagellarity on stability and speed of bacterial locomotion, Phys. Rev. E 98, 042419 (2018).
- Turner et al. [2012] L. Turner, A. S. Stern, and H. C. Berg, Growth of flagellar filaments of Escherichia coli is independent of filament length, J. Bacteriol. 194, 2437 (2012).
- Paradis et al. [2017] G. Paradis, F. F. V. Chevance, W. Liou, T. T. Renault, K. T. Hughes, S. Rainville, and M. Erhardt, Variability in bacterial flagella re-growth patterns after breakage, Sci. Rep. 7, 1282 (2017).
- Catroux et al. [2001] G. Catroux, A. Hartmann, and C. Revellin, Trends in rhizobial inoculant production and use, Plant Soil 230, 21 (2001).
- Quelas et al. [2016] J. I. Quelas, M. J. Althabegoiti, C. Jimenez-Sanchez, A. A. Melgarejo, V. I. Marconi, E. J. Mongiardini, S. A. Trejo, F. Mengucci, J.-J. Ortega-Calvo, and A. R. Lodeiro, Swimming performance of Bradyrhizobium diazoefficiens is an emergent property of its two flagellar systems, Sci. Rep. 6, 23841 (2016).
- Garrido-Sanz et al. [2019] D. Garrido-Sanz, M. Redondo-Nieto, E. Mongiardini, E. Blanco-Romero, D. Durán, J. I. Quelas, M. Martin, R. Rivilla, A. R. Lodeiro, and M. J. Althabegoiti, Phylogenomic analyses of Bradyrhizobium reveal uneven distribution of the lateral and subpolar flagellar systems, which extends to Rhizobiales, Microorganisms 7, 50 (2019).
- Mengucci et al. [2020] F. Mengucci, C. Dardis, E. J. Mongiardini, M. J. Althabegoiti, J. D. Partridge, S. Kojima, M. Homma, J. I. Quelas, and A. R. Lodeiro, Characterization of FliL proteins in Bradyrhizobium diazoefficiens: lateral FliL supports swimming motility, and subpolar FliL modulates the lateral flagellar system, J. Bacteriol. 202, 10 (2020).
- Althabegoiti et al. [2011] M. J. Althabegoiti, J. M. Covelli, J. Pérez-Giménez, J. I. Quelas, E. J. Mongiardini, M. F. López, S. L. López-García, and A. R. Lodeiro, Analysis of the role of the two flagella of Bradyrhizobium japonicum in competition for nodulation of soybean, FEMS Microbiol. Lett. 319, 133 (2011).
- Pires Monteiro et al. [2023] M. Pires Monteiro, J. P. Carrillo, N. Gutiérrez, S. Montagna, A. R. Lodeiro, M. L. Cordero, and V. I. Marconi, Soils-on-a-chip reveal unforeseen motility parameters of microconfined Bradyrhizobium diazoefficiens, bioRxiv:2023.12.29.573673 10.1101/2023.12.29.573673 (2023).
- Dardis et al. [2021] C. Dardis, J. I. Quelas, F. Mengucci, M. J. Althabegoiti, A. R. Lodeiro, and E. J. Mongiardini, Dual control of flagellar synthesis and exopolysaccharide production by FlbD-FliX class II regulatory proteins in Bradyrhizobium diazoefficiens, J. Bacteriol. 203, 10 (2021).
- Beal et al. [2020] J. Beal, N. G. Farny, T. Haddock-Angelli, V. Selvarajah, G. S. Baldwin, R. Buckley-Taylor, M. Gershater, D. Kiga, J. Marken, V. Sanchania, A. Sison, C. T. Workman, and iGEM Interlab Study Contributors, Robust estimation of bacterial cell count from optical density, Commun. Biol. 3, 512 (2020).
- Jiang et al. [2023] P. Jiang, Y. Ye, J. Liu, and F. Wang, Metformin promotes bacterial surface aggregation by inhibiting the swimming motility of flagellated Escherichia coli, J. Basic Microbiol. 63, 897 (2023).
- Menon et al. [2005] R. Menon, A. Patel, D. Gil, and H. I. Smith, Maskless lithography, Mater. Today 8, 26 (2005).
- Qin et al. [2010] D. Qin, Y. Xia, and G. M. Whitesides, Soft lithography for micro-and nanoscale patterning, Nat. Protoc. 5, 491 (2010).
- Figueroa-Morales et al. [2015] N. Figueroa-Morales, G. L. Miño, A. Rivera, R. Caballero, E. Clément, E. Altshuler, and A. Lindner, Living on the edge: transfer and traffic of E. coli in a confined flow, Soft Matter 11, 6284 (2015).
- Schindelin et al. [2012] J. Schindelin, I. Arganda-Carreras, E. Frise, V. Kaynig, M. Longair, T. Pietzsch, S. Preibisch, C. Rueden, S. Saalfeld, B. Schmid, J.-Y. Tinevez, D. J. White, V. Hartenstein, K. Eliceiri, P. Tomancak, and A. Cardona, Fiji: an open-source platform for biological-image analysis, Nat. Methods 9, 676 (2012).
- Sánchez et al. [2016] J. A. Sánchez, P. A. Pury, and V. I. Marconi, Un algoritmo modular para el seguimiento de partículas en videos de microscopía, Mecánica Computacional 34, 3443 (2016).
- Reyes and Sánchez [advisor] M. G. Reyes and J. A. Sánchez (advisor), Particle tracking on videos of microscopy, Master’s thesis, Universidad Nacional de Córdoba, Argentina (2017).
- Credit: et al. [2017] Credit:, M. G. Reyes, J. A. Sánchez, and V. I. Marconi, Biotracker software. Microswimmers tracker with Automatic change of directions, https://github.com/jadrs/biotracker (2017).
- Moyano Cortéz and Marconi [2014] H. N. Moyano Cortéz and V. I. a. Marconi, Bacteria Dynamics on micro-designed substrates, Master’s thesis, Universidad Nacional de Córdoba, Argentina (2014).
- Montagna et al. [2018] S. Montagna, Advisor:, and V. Marconi, Master Thesis in Physics: “Soil Bacteria Dynamics" (Universidad Nacional de Córdoba, Argentina, March, 2018).
- Miño et al. [2011] G. Miño, T. E. Mallouk, T. Darnige, M. Hoyos, J. Dauchet, J. Dunstan, R. Soto, Y. Wang, A. Rousselet, and E. Clément, Enhanced diffusion due to active swimmers at a solid surface, Phys. Rev. Lett. 106, 048102 (2011).
- Howse et al. [2007] J. R. Howse, R. A. L. Jones, A. J. Ryan, T. Gough, R. Vafabakhsh, and R. Golestanian, Self-motile colloidal particles: From directed propulsion to random walk, Phys. Rev. Lett. 99, 048102 (2007).
- Martens et al. [2012] K. Martens, L. Angelani, R. Di Leonardo, and L. Bocquet, Probability distributions for the run-and-tumble bacterial dynamics: An analogy to the Lorentz model, Eur. Phys. J. E 35, 84 (2012).
- Magariyama et al. [1995] Y. Magariyama, S. Sugiyama, K. Muramoto, I. Kawagishi, Y. Imae, and S. Kudo, Simultaneous measurement of bacterial flagellar rotation rate and swimming speed, Biophys. J. 69, 2154 (1995).
- Cogo et al. [2018] C. Cogo, J. Pérez-Giménez, C. B. Rajeswari, M. F. Luna, and A. R. Lodeiro, Induction by Bradyrhizobium diazoefficiens of different pathways for growth in D-mannitol or L-arabinose leading to pronounced differences in CO2 fixation, O2 consumption, and lateral flagellum production, Front. Microbiol. 9, 1189 (2018).