Fine-tuning the ESM2 protein language model to understand the functional impact of missense variants
Abstract
Elucidating the functional effect of missense variants is of crucial importance, yet challenging. To understand the impact of such variants, we fine-tuned the ESM2 protein language model to classify 20 protein features at amino acid resolution. We used the resulting models to: 1) identify protein features that are enriched in either pathogenic or benign missense variants, 2) compare the characteristics of proteins with reference or alternate alleles to understand how missense variants affect protein functionality. We show that our model can be used to reclassify some variants of unknown significance. We also demonstrate the usage of our models for understanding the potential effect of variants on protein features.
1 Introduction
Recent advancement in sequencing technologies and bioinformatic analyses have enhanced their usability in clinical settings (Bagger et al., 2024). This has led to the generation of vast amounts of clinical-grade, personal genetic data. Many of the putatively deleterious variants identified in the coding regions of the genome are missense variants that may alter the protein function (Chen et al., 2023). Determining the clinical significance and potential impact of each variant poses significant challenges (Miosge et al., 2015).
In the context of diagnostic genetic testing, a commonly used approach is to follow the ACMG/AMP guidelines (Richards et al., 2015), which propose a standardized framework for the interpretation of sequence variants. It provides a set of criteria to gather various evidences such as population data (Chen et al., 2023; Auton et al., 2015) and computational data (Cheng et al., 2023; Ioannidis et al., 2016).
One criterion that is used in the classification of missense variants, with grade PM1 (moderate evidence of pathogenicity), is “location in a mutational hot spot and/or critical and well-established functional domain (e.g. active site of an enzyme) without benign variation” (Richards et al., 2015). However, the determination of such regions is challenging since it requires the careful identification of functional domains and the quantification of pathogenic/benign enrichment (Harrison et al., 2019). Previous studies have used disease databases such as ClinVar (Landrum et al., 2013) along with population data (Chen et al., 2023; Auton et al., 2015) to identify regions that are enriched with pathogenic variants (Quinodoz et al., 2022; Iqbal et al., 2020; Pérez-Palma et al., 2019). However, only a small portion of proteins were analyzed due to incomplete annotation of the human proteome. Moreover, there was no attempt at understanding the impact of missense variants on protein features.
In this study we aim to harness the power of protein language models (Bepler & Berger, 2021), ESM2 in particular (Lin et al., 2023), for variant classification and interpretation. Previous studies have shown the effective fine-tuning of ESM2 for various tasks (Schmirler et al., 2023; Schreiber, 2023). Here, we fine-tune the model for identification of various protein features at amino acid resolution, then utilize it to: 1) find features that are enriched in pathogenic/benign variants, which can be considered as critical functional regions, 2) compare the characteristics of proteins with reference or alternate alleles to understand how missense variants affect protein functionality. We show the application of our models to reclassify variants of unknown significance (VUS) in gnomAD (Chen et al., 2023). We also demonstrate how we can use our models to gain insight into the protein- and feature-specific impact of missense variants.
2 Methods
2.1 Data collection
We selected 20,434 human proteins from UniProtKB/Swiss-Prot (Boutet et al., 2007) and extracted their amino acid sequence as well as their protein family membership. We annotated the proteins with 20 features including:
-
•
Functional features: active site, binding site, and DNA binding site
-
•
Sub-cellular location: topological domain and trans-membrane
-
•
Post-transcriptional modification (PTM) and processing: disulfide bond, modified residue, propeptide, signal peptide, and transit peptide
-
•
Structure: -strand, -helix, and turn
-
•
family and domain: coiled coil, compositional bias, domain, motif, region, repeat, and zinc finger
2.2 Fine-tuning
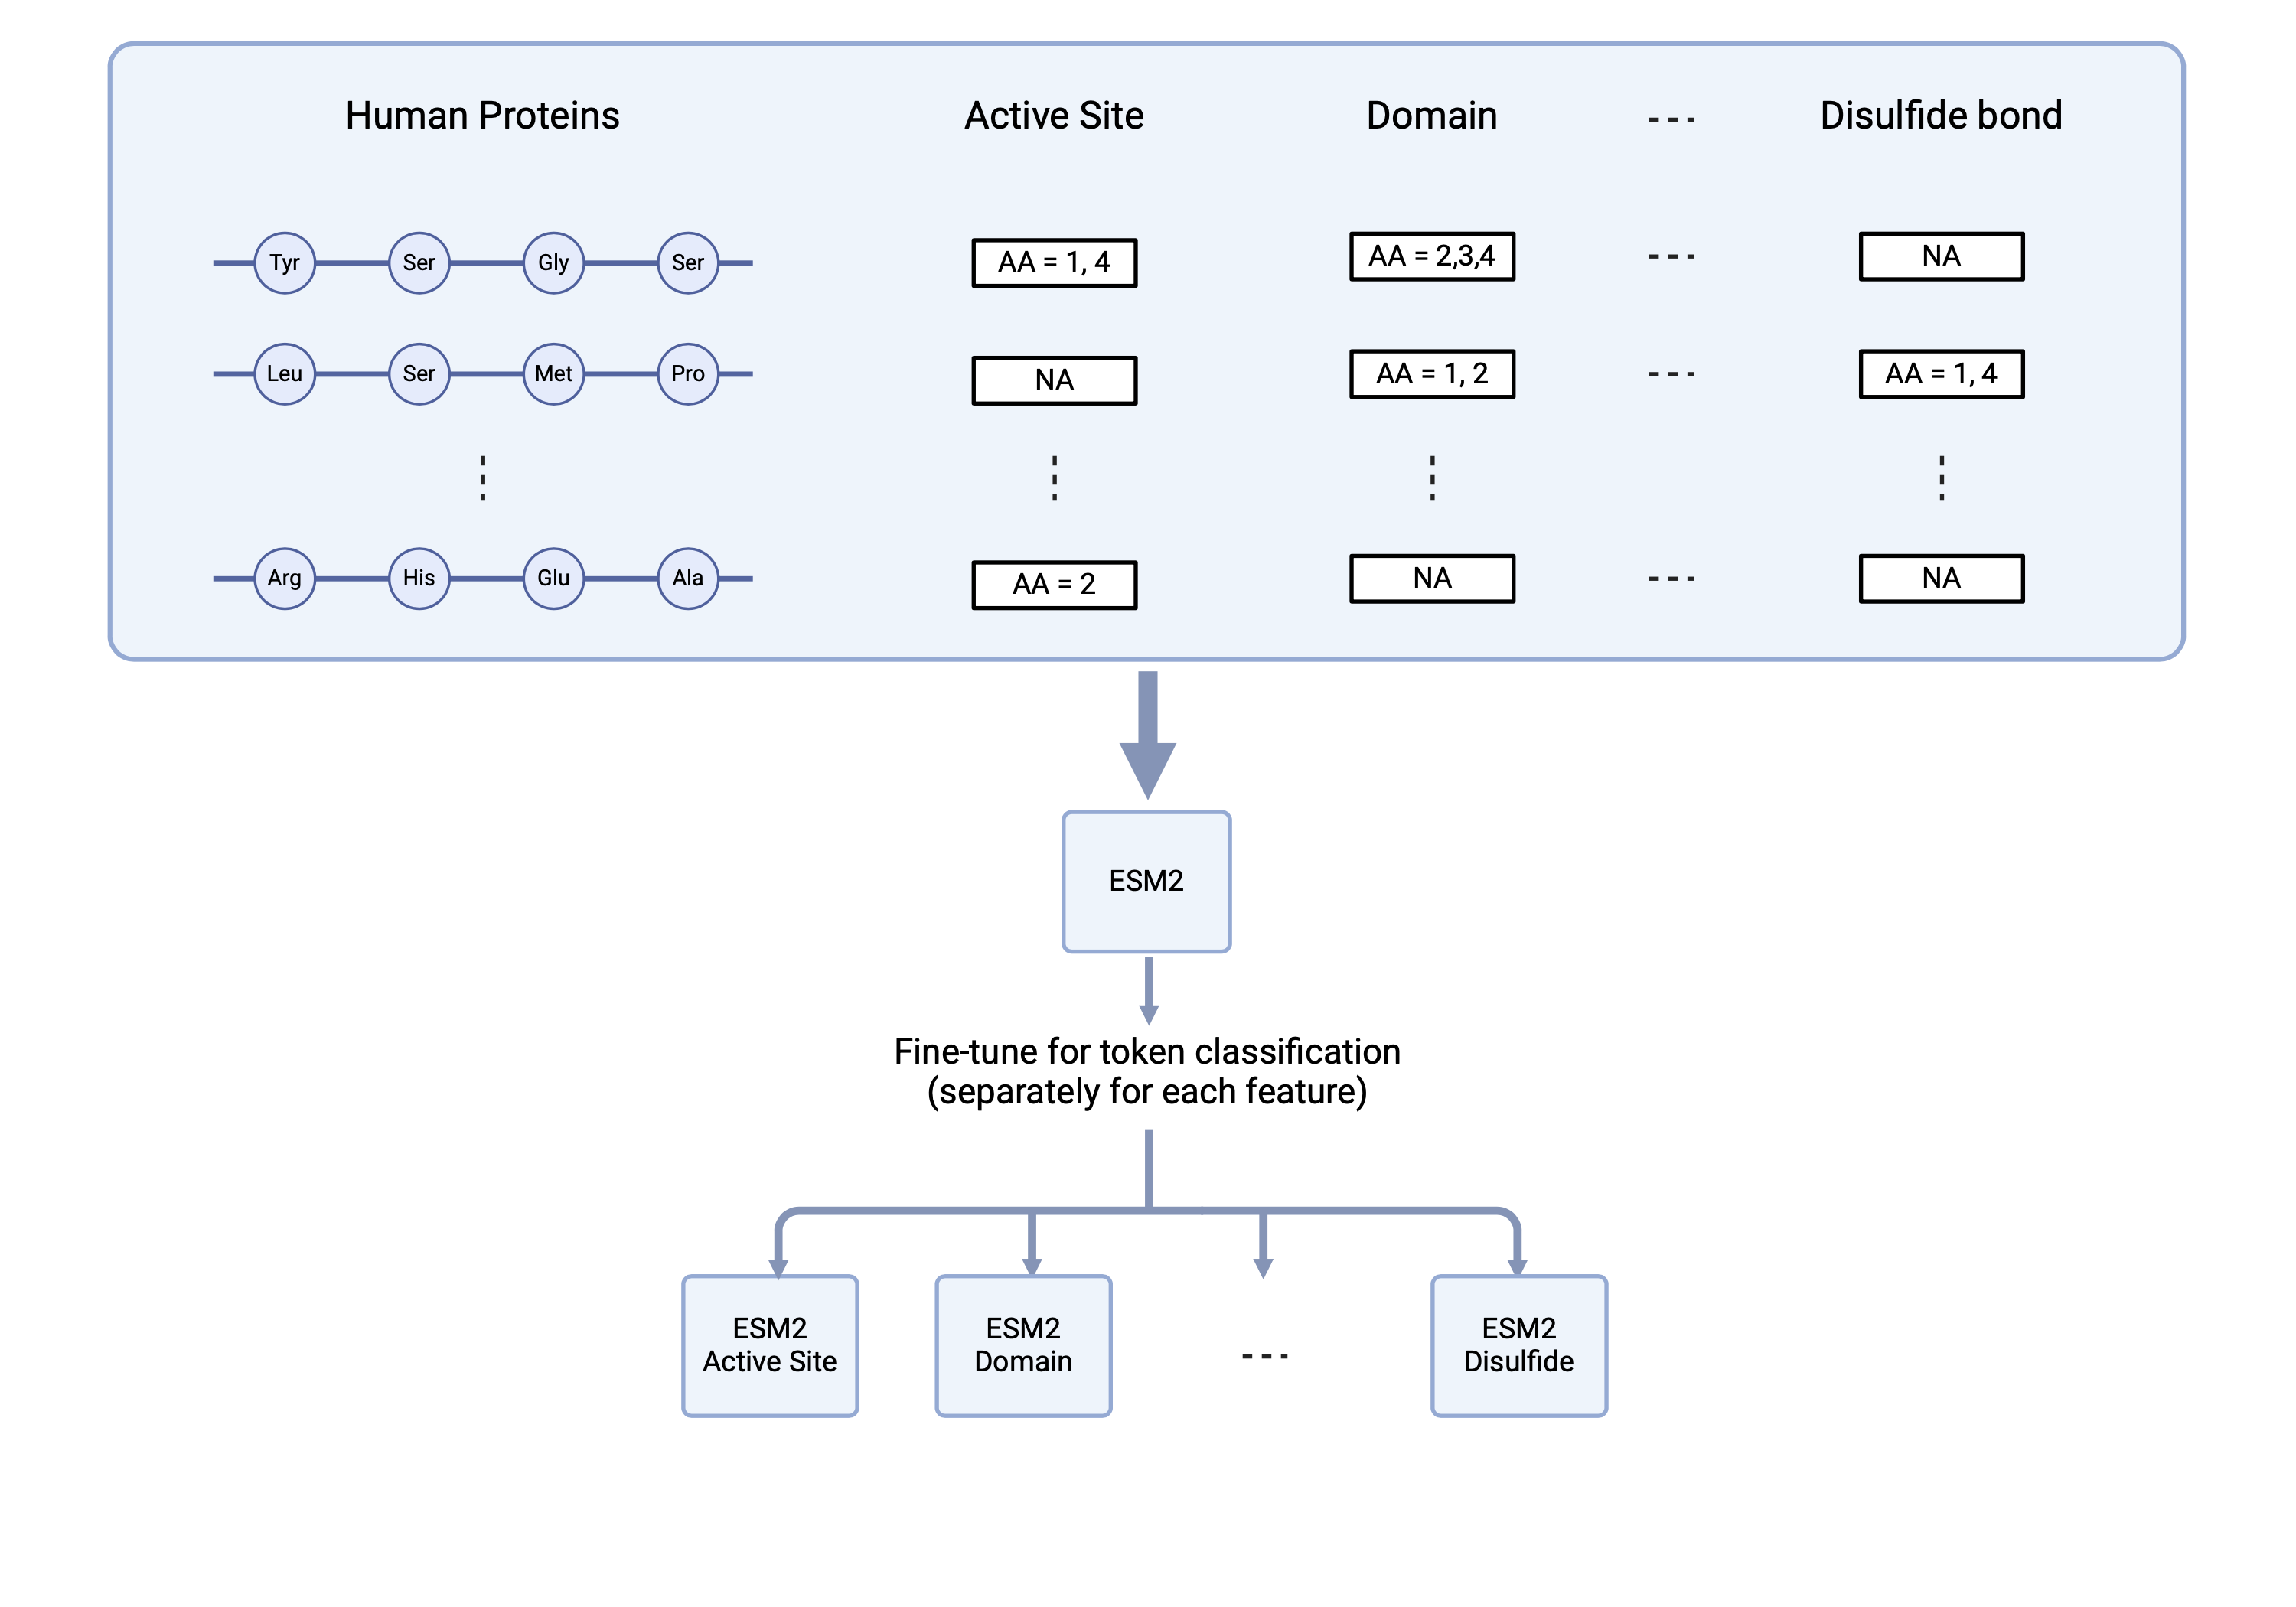
For each feature, we split the annotated proteins into 70% training, 15% validation, and 15% testing. To minimize the data leakage, we split the data based on the UniProt protein family membership, which accounts for protein sequence similarity. Afterwards, we fine-tuned ESM2 (12 layers, 35M parameters) for each feature separately to perform amino acid classification based on absence/presence of the feature. We trained each model for 5 epochs, and kept the checkpoint with lowest validation loss. We used one Nvidia L4 (24GB) GPU for training. This workflow resulted in 20 fine-tuned models, each one specialized in amino acid classification for the corresponding feature. We evaluated each model on their test set using various metrics including precision, recall, , area under curve (AUC), and Matthews correlation coefficient (MCC). For the next steps, we kept only the models with . Figure 1 summarizes the fine-tuning workflow.
2.3 Protein annotation inference
For each feature, we extracted the amino acid sequences from all proteins that lacked information about that feature. We utilized the corresponding fine-tuned model to predict presence or absence of the feature at each amino acid. To check the quality of predictions, we compared the distribution of phyloP conservation scores (Siepel et al., 2005) and REVEL pathogenicity scores (Ioannidis et al., 2016) between labeled and predicted amino acids.
2.4 Applications
-
•
Variant classification: according to the ACMG/AMP guidelines (Richards et al., 2015), missense variants that are located in a mutational hot spot and/or critical functional domains are more likely to be pathogenic (moderate evidence of pathogenicity, PM1). To identify such regions, we obtained 41,749 missense pathogenic and 50,975 missense benign variants from ClinVar (Landrum et al., 2013) (variants with conflicting classification were removed). We also extracted 46,832 non-redundant missense variants with minor-allele frequency 0.02 from gnomAD (Chen et al., 2023), and added them to the set of benign variants (they are considered benign due to high frequency in population, BS1 criteria Appendix A). We performed two-sided Fisher’s exact test to identify protein features that are significantly enriched in pathogenic or benign variants. After detecting regions with enrichment of pathogenic variants, we used them to reclassify variants of unkown significance (VUS) in gnomAD. To do so, we extracted all missense variants from gnomAD, and assigned a probability of pathogenicity (PoP) without using PM1 (full description in Appendix A). Then we focused on VUS and calculated a new PoP score by adding the PM1 evidence which is applied for missense variants located in regions with high enrichment of pathogenic variants. Finally, we calculated the fraction of VUS that were reclassified by adding PM1.
-
•
Variant interpretation: to understand the potential impact of a missense variant on the protein, we designed a workflow that can provide insight into the variant mechanism (Figure 2). In summary, we pass the reference and alternate protein sequences into ESM2 fine-tuned models. Then we subtract the prediction probabilities of alternate features from reference features. To detect a gain or loss of a certain feature upon mutation, amino acid label must change and the absolute value of differential score should exceed a threshold (we chose 0.5 as the threshold but it is possible to have a lower threshold to increase sensitivity or a higher threshold to increase specificity). By doing so, we can predict the changes in protein features at amino acid resolution, which can be helpful for designing follow-up functional studies. To demonstrate this application, we downloaded 6,974 curated variants across 107 genes from ClinGen (Rehm et al., 2015), and kept genes with at least one pathogenic and one benign missense variants. Then we applied the variant interpretation workflow (Figure 2) for all the selected variants.
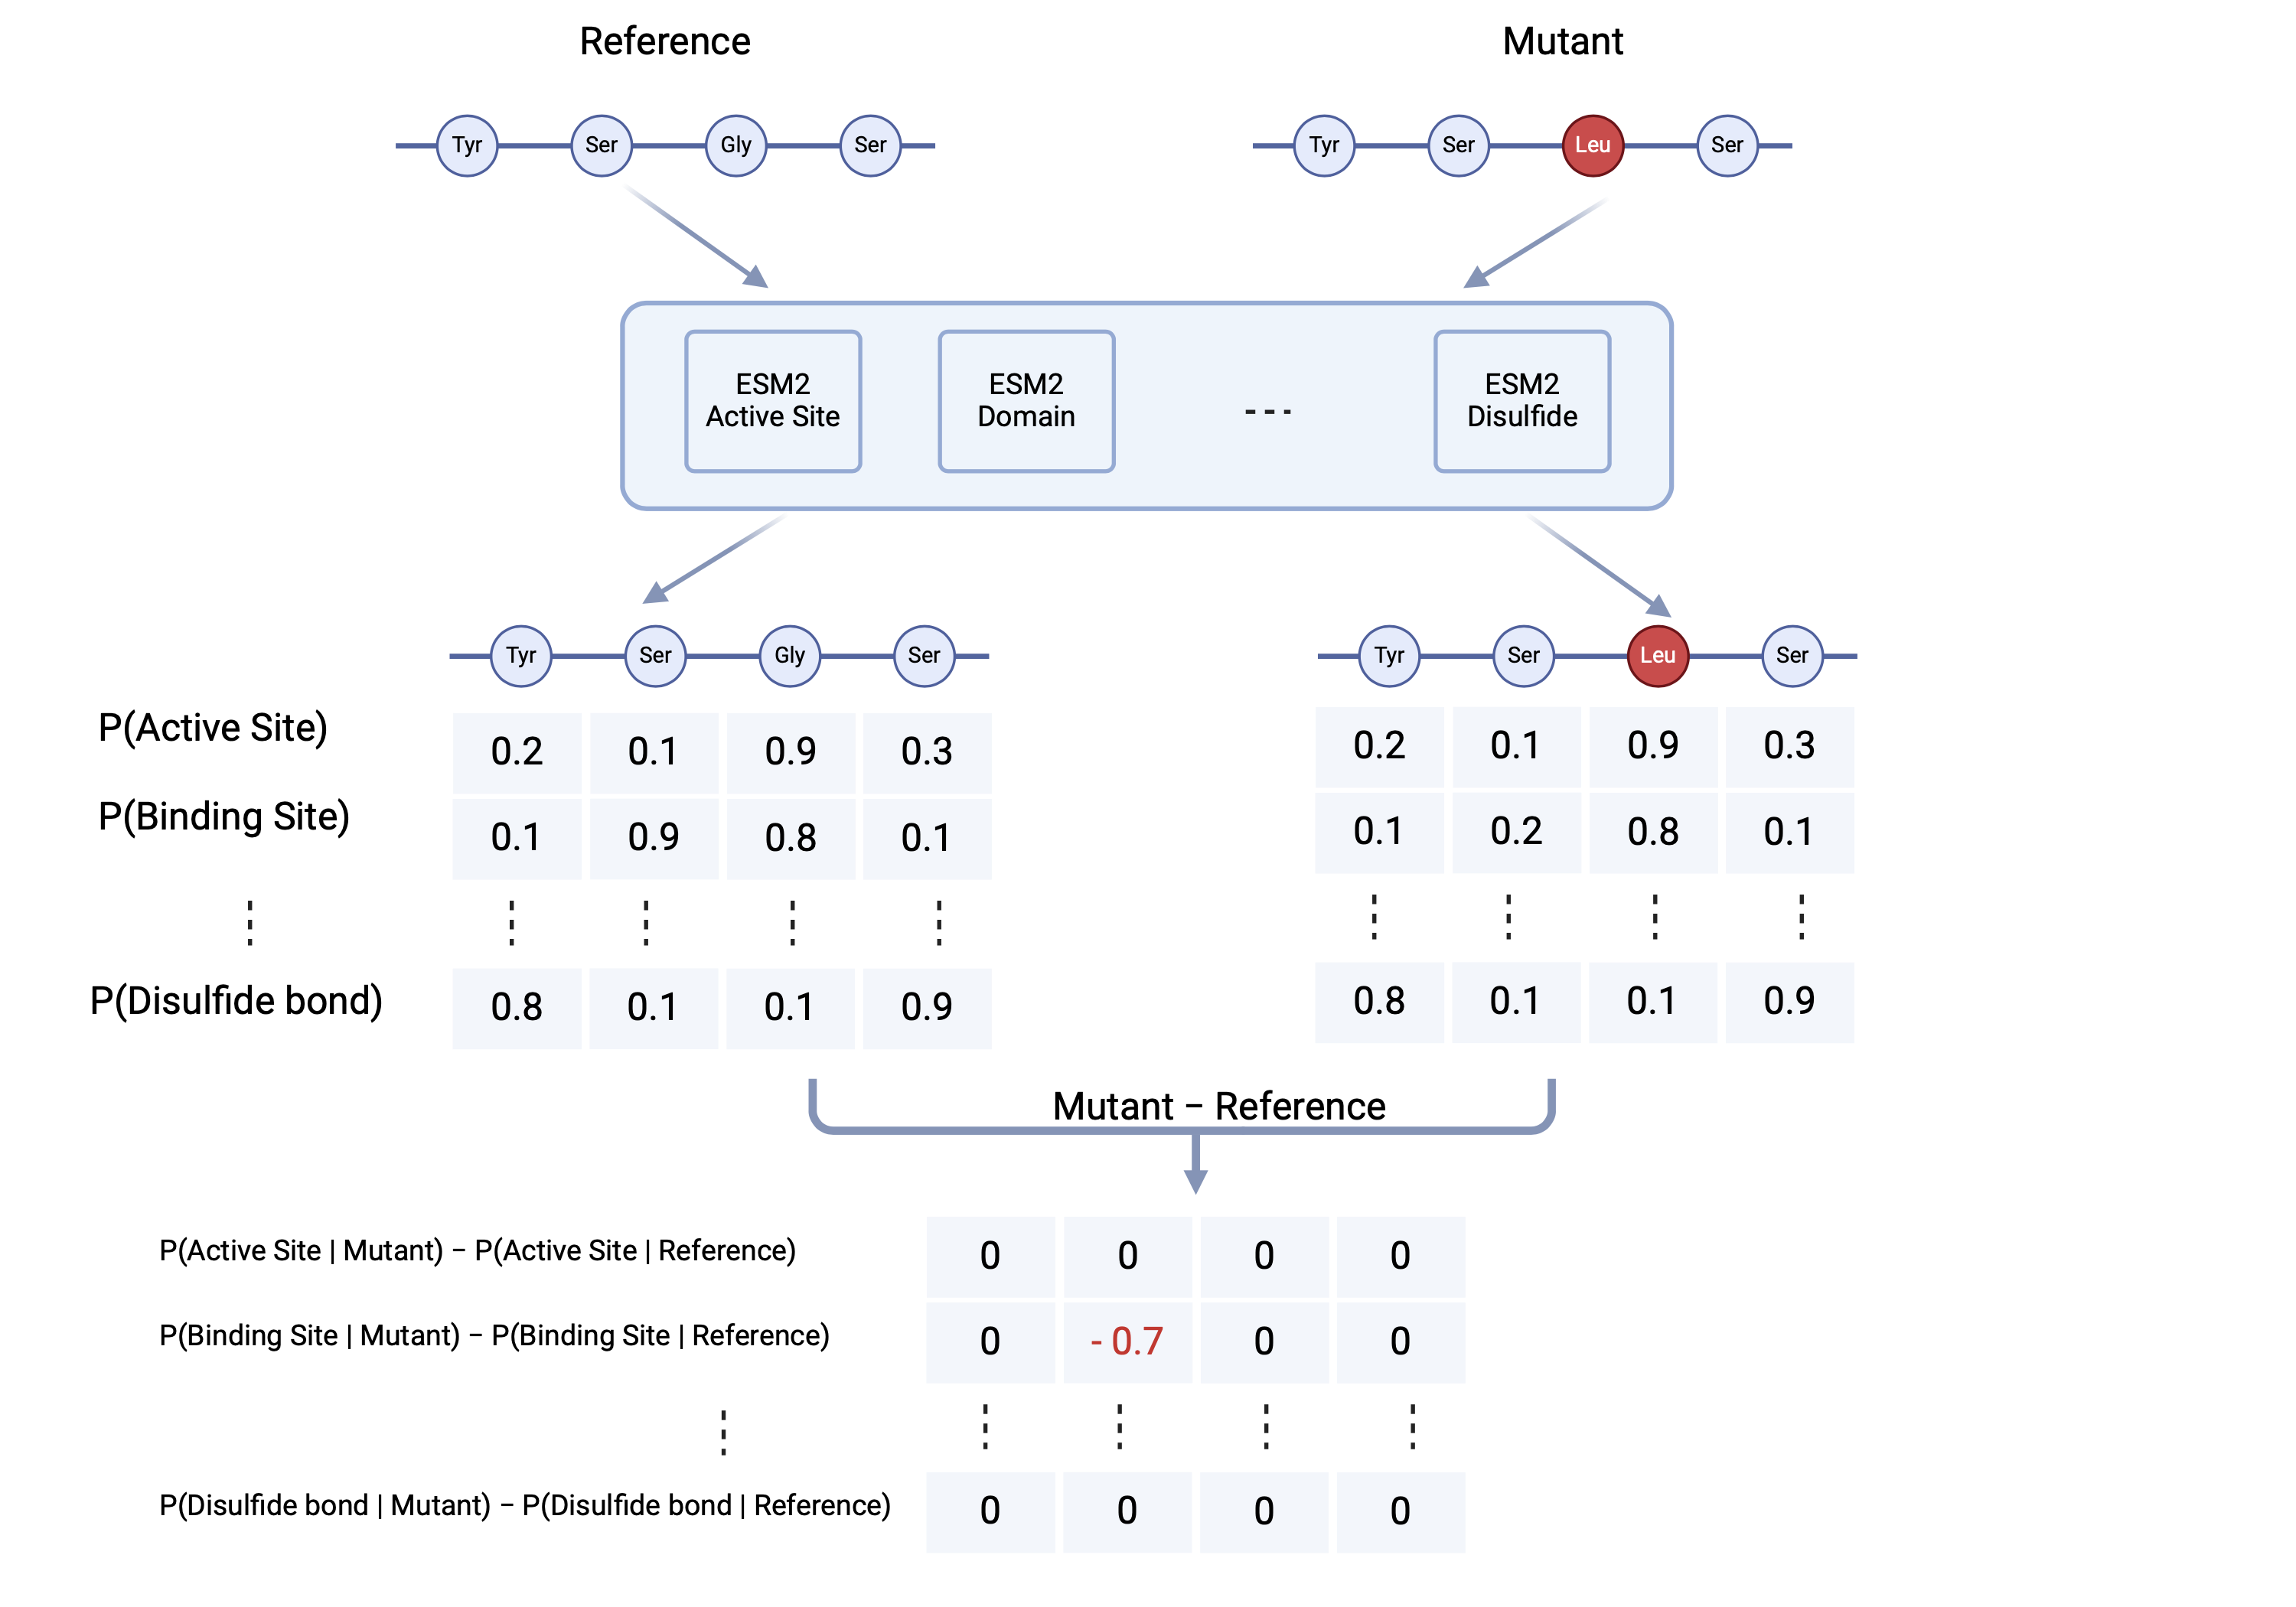
Figure 2: Variant interpretation using fine-tuned ESM2 models: to understand the impact of a missense variant, the reference and alternate protein sequences are passed into the ESM2 fine-tuned models. Then the difference between the prediction probabilities of alternate and reference features is calculated. Finally, a threshold is applied to detect gain or loss of features upon mutation. Figure created with BioRender.com.
3 Results
3.1 Fine-tuning and performance evaluation
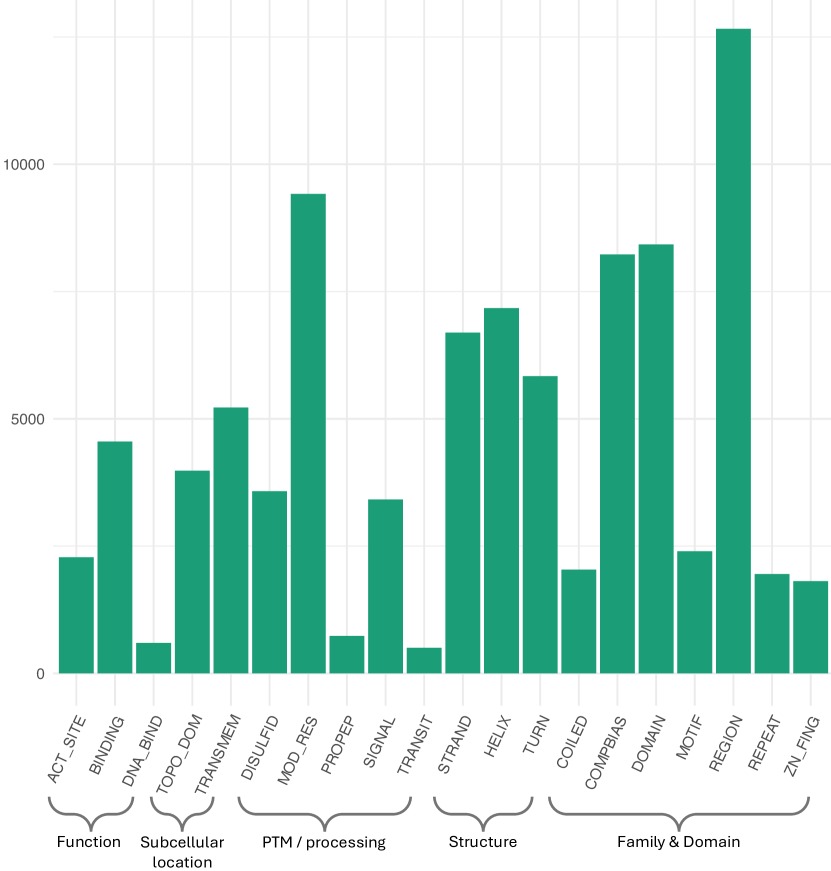
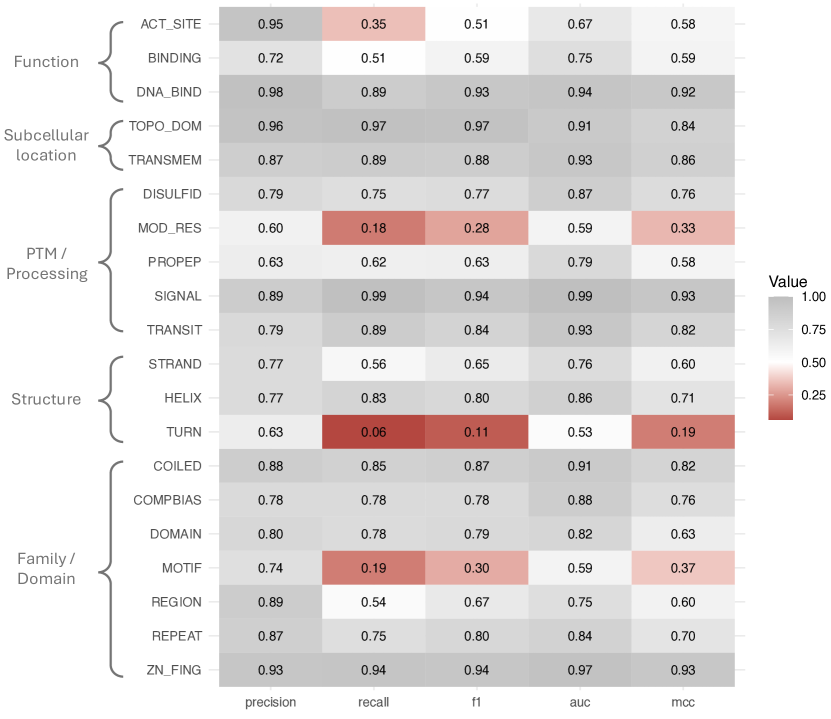
Figure S1 shows the number of annotated human proteins in UniProtKB/Swiss-Prot per feature. For each feature, we used the train split to fine-tune ESM2 for amino acid classification, and the validation split to select the model checkpoint with the lowest validation loss. We evaluated the models using the feature-specific test sets (Figure 3). All the fine-tuned models showed acceptable performance with except models for classification of modified residue, turn, and motif. For next steps, we excluded these three models.
3.2 Protein annotation inference
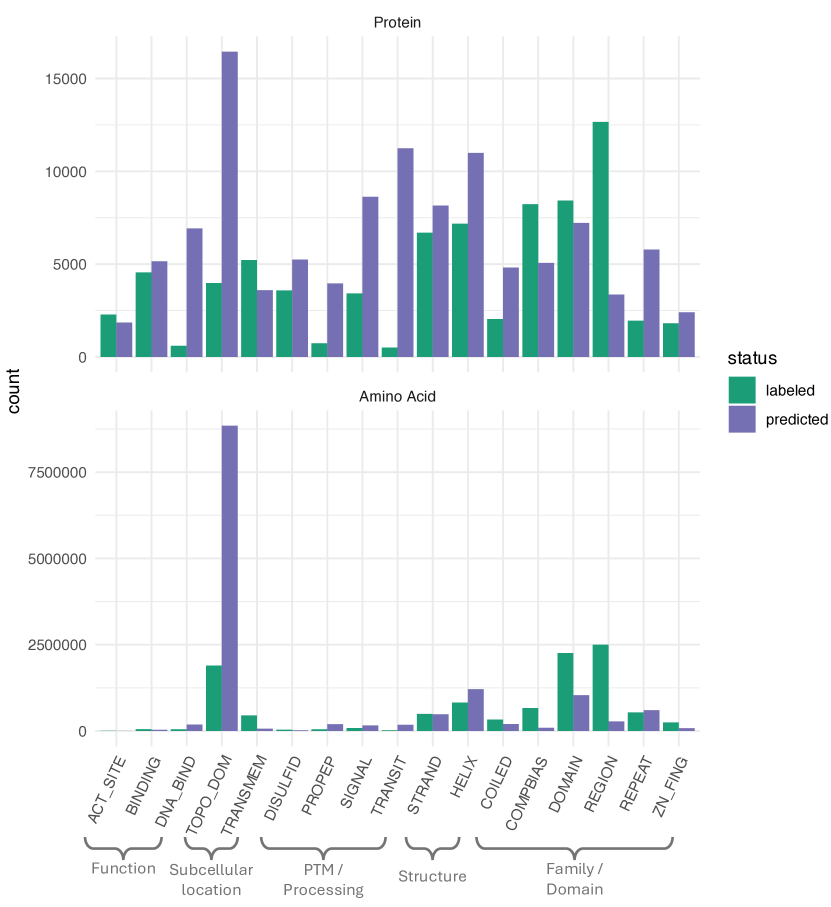
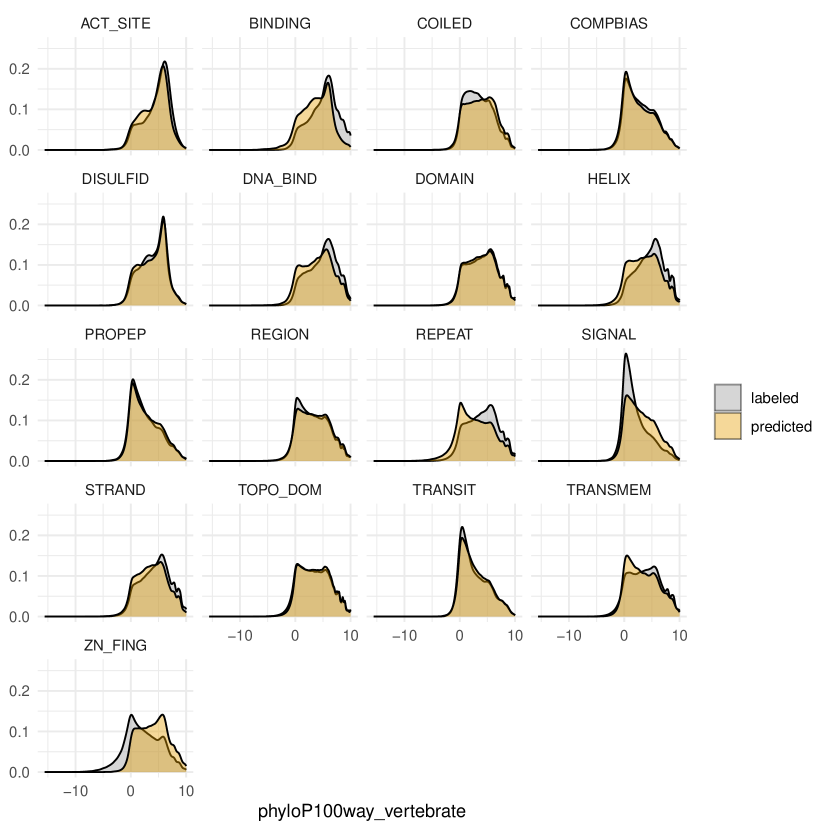
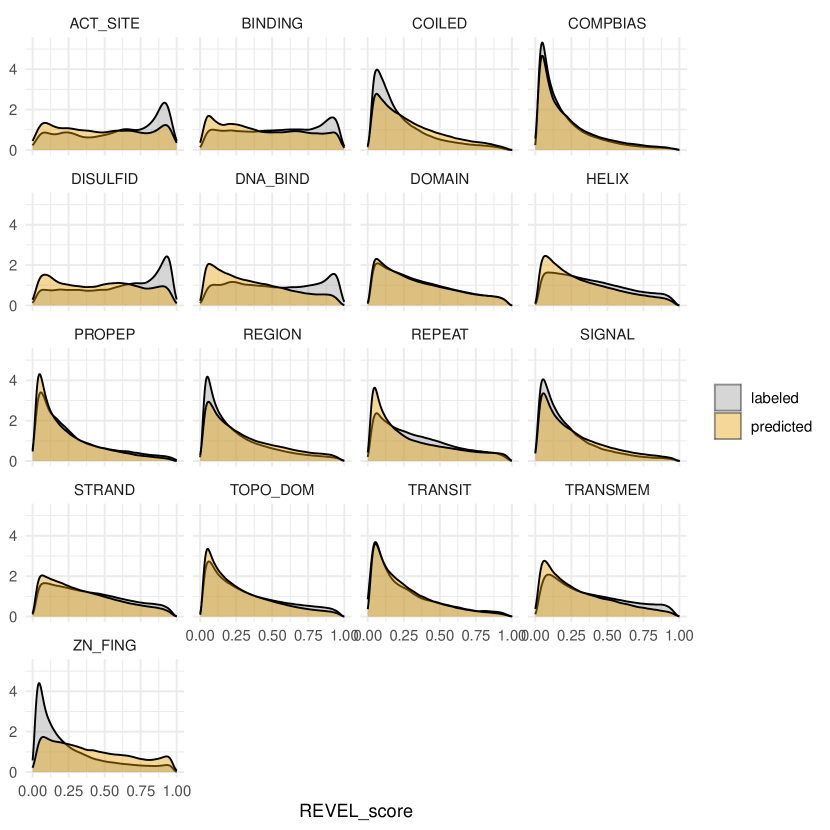
We used the fine-tuned models to predict presence or absence of the features in proteins with no annotations. The number of labeled/predicted proteins and amino acids are shown in Figure S2. To check the quality of predictions, we compared the distribution of conservation scores (phyloP 100 way, Figure S3) and variant pathogenicity scores (REVEL, Figure S4) between labeled and predicted amino acids. Overall we observed similar distributions across different features.
3.3 Applications
-
•
Variant classification: using pathogenic variants from ClinVar and benign variants from ClinVar/gnomAD, we performed two-sided Fisher’s exact test to identify protein features that are significantly associated with pathogenic or benign variants. Figure 4 shows that 10 features are enriched in pathogenic variants including active site, binding site, DNA binding site, trans-membrane, disulfide bond, -strand, -helix, domain, repeat, and zinc finger. After detecting these 10 features, we used them to reclassify 1,692,568 VUS (with PoP ) in gnomAD. We calculated a new PoP score by adding the PM1 evidence which is applied for missense variants located in the 10 protein features with significantly high enrichment of pathogenic variants. This resulted in the reclassification of 110,304 (6.5%) variants from VUS to pathogenic.
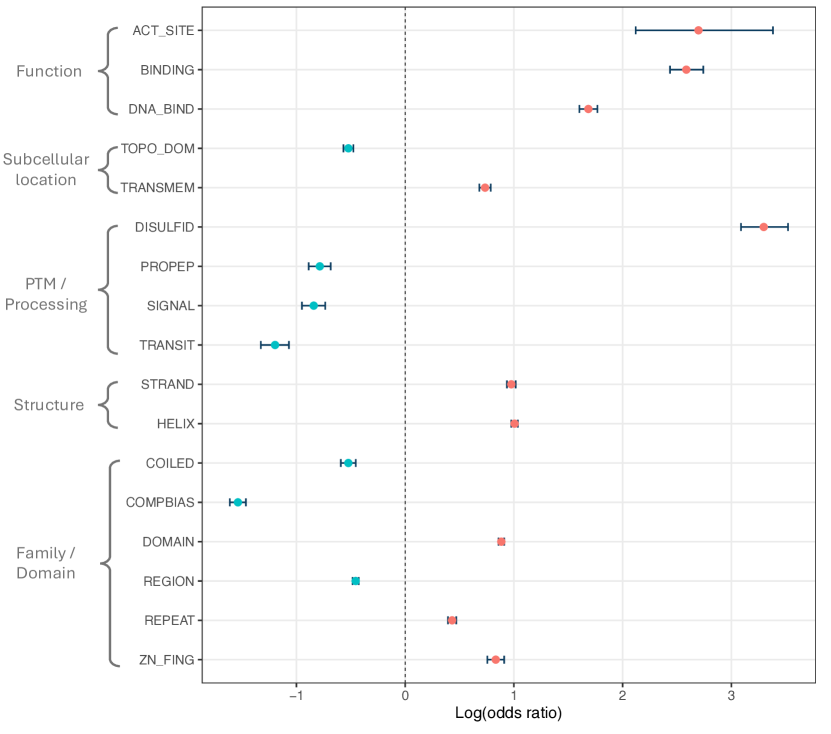
Figure 4: Enrichment of features in pathogenic or benign variants: for each feature, a two-sided Fisher’s exact test was performed using the pathogenic variants from ClinVar and benign variants from ClinVar/gnomAD. Ten features were significantly enriched in pathogenic variants (red dots), while seven features were enriched in benign variants (blue dots). -
•
Variant interpretation: we identified 771 curated variants in 54 genes that had at least one pathogenic and one benign missense variant from ClinGen (Rehm et al., 2015). To understand the potential impact of each missense variant, we utilized the workflow introduced in Figure 2. We observed that pathogenic missense variants impact certain protein features, especially loss of functional domains (Figure 5A). Regarding benign variants, we observed that they can only result in loss of compositional bias and region (Figure 5B), meaning that proteins can tolerate mutations in these features, which is in agreement with our previous observation (Figure 4). To demonstrate the power of our method, we chose two pathogenic variants (GAA:p.Cys103Gly and HNF4A:p.Arg63Gln) with deleterious effect on protein domains and DNA binding site, respectively. We observed that GAA:p.Cys103Gly results in the complete loss of P-type domain from the mutant protein, as well as loss of disulfide bonds and -helix (Figure 6). Regarding HNF4A:p.Arg63Gln, we could detect a partial loss of DNA binding domain as well as loss of the zinc fingers (Figure 7).
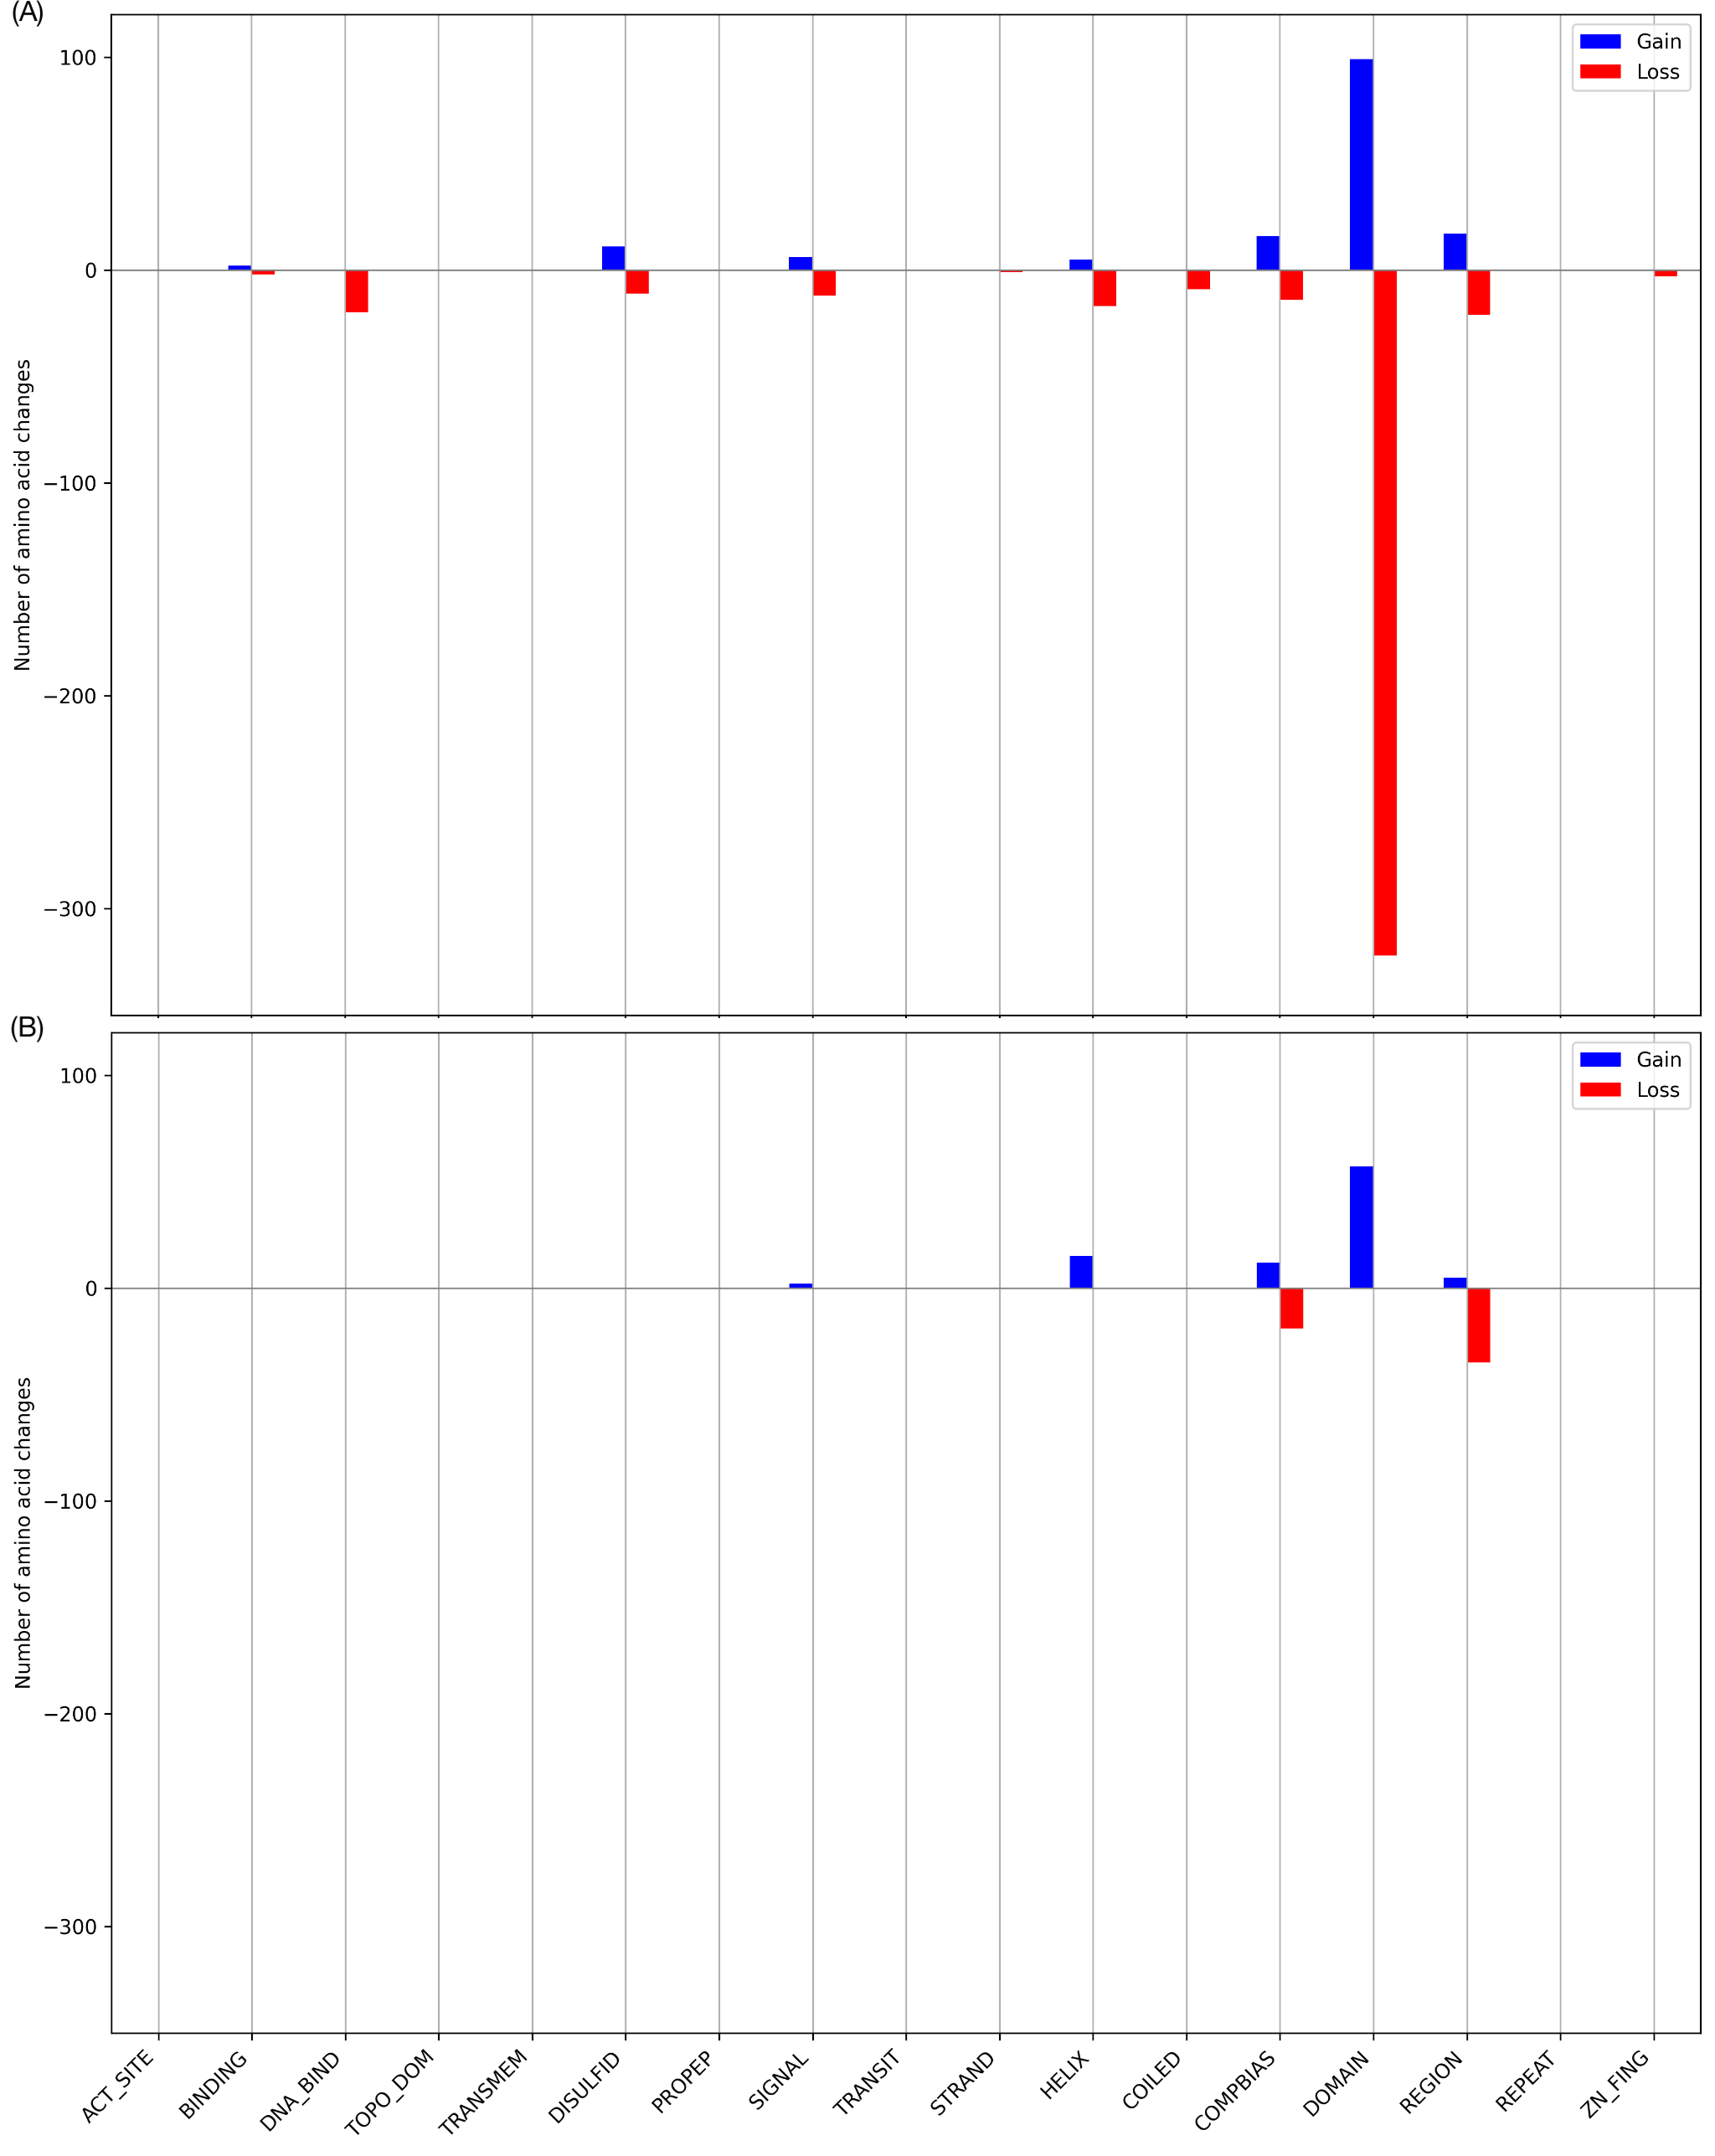
Figure 5: Predicted impact of {(A) pathogenic, (B) benign} missense variants on protein features: 771 curated variants in 54 genes that had at least one pathogenic and one benign missense variant were identified from ClinGen. The variant interpretation workflow (Figure 2) was applied to each variant separately, and the number of amino acids that lost or gained a feature upon mutation were recorded.
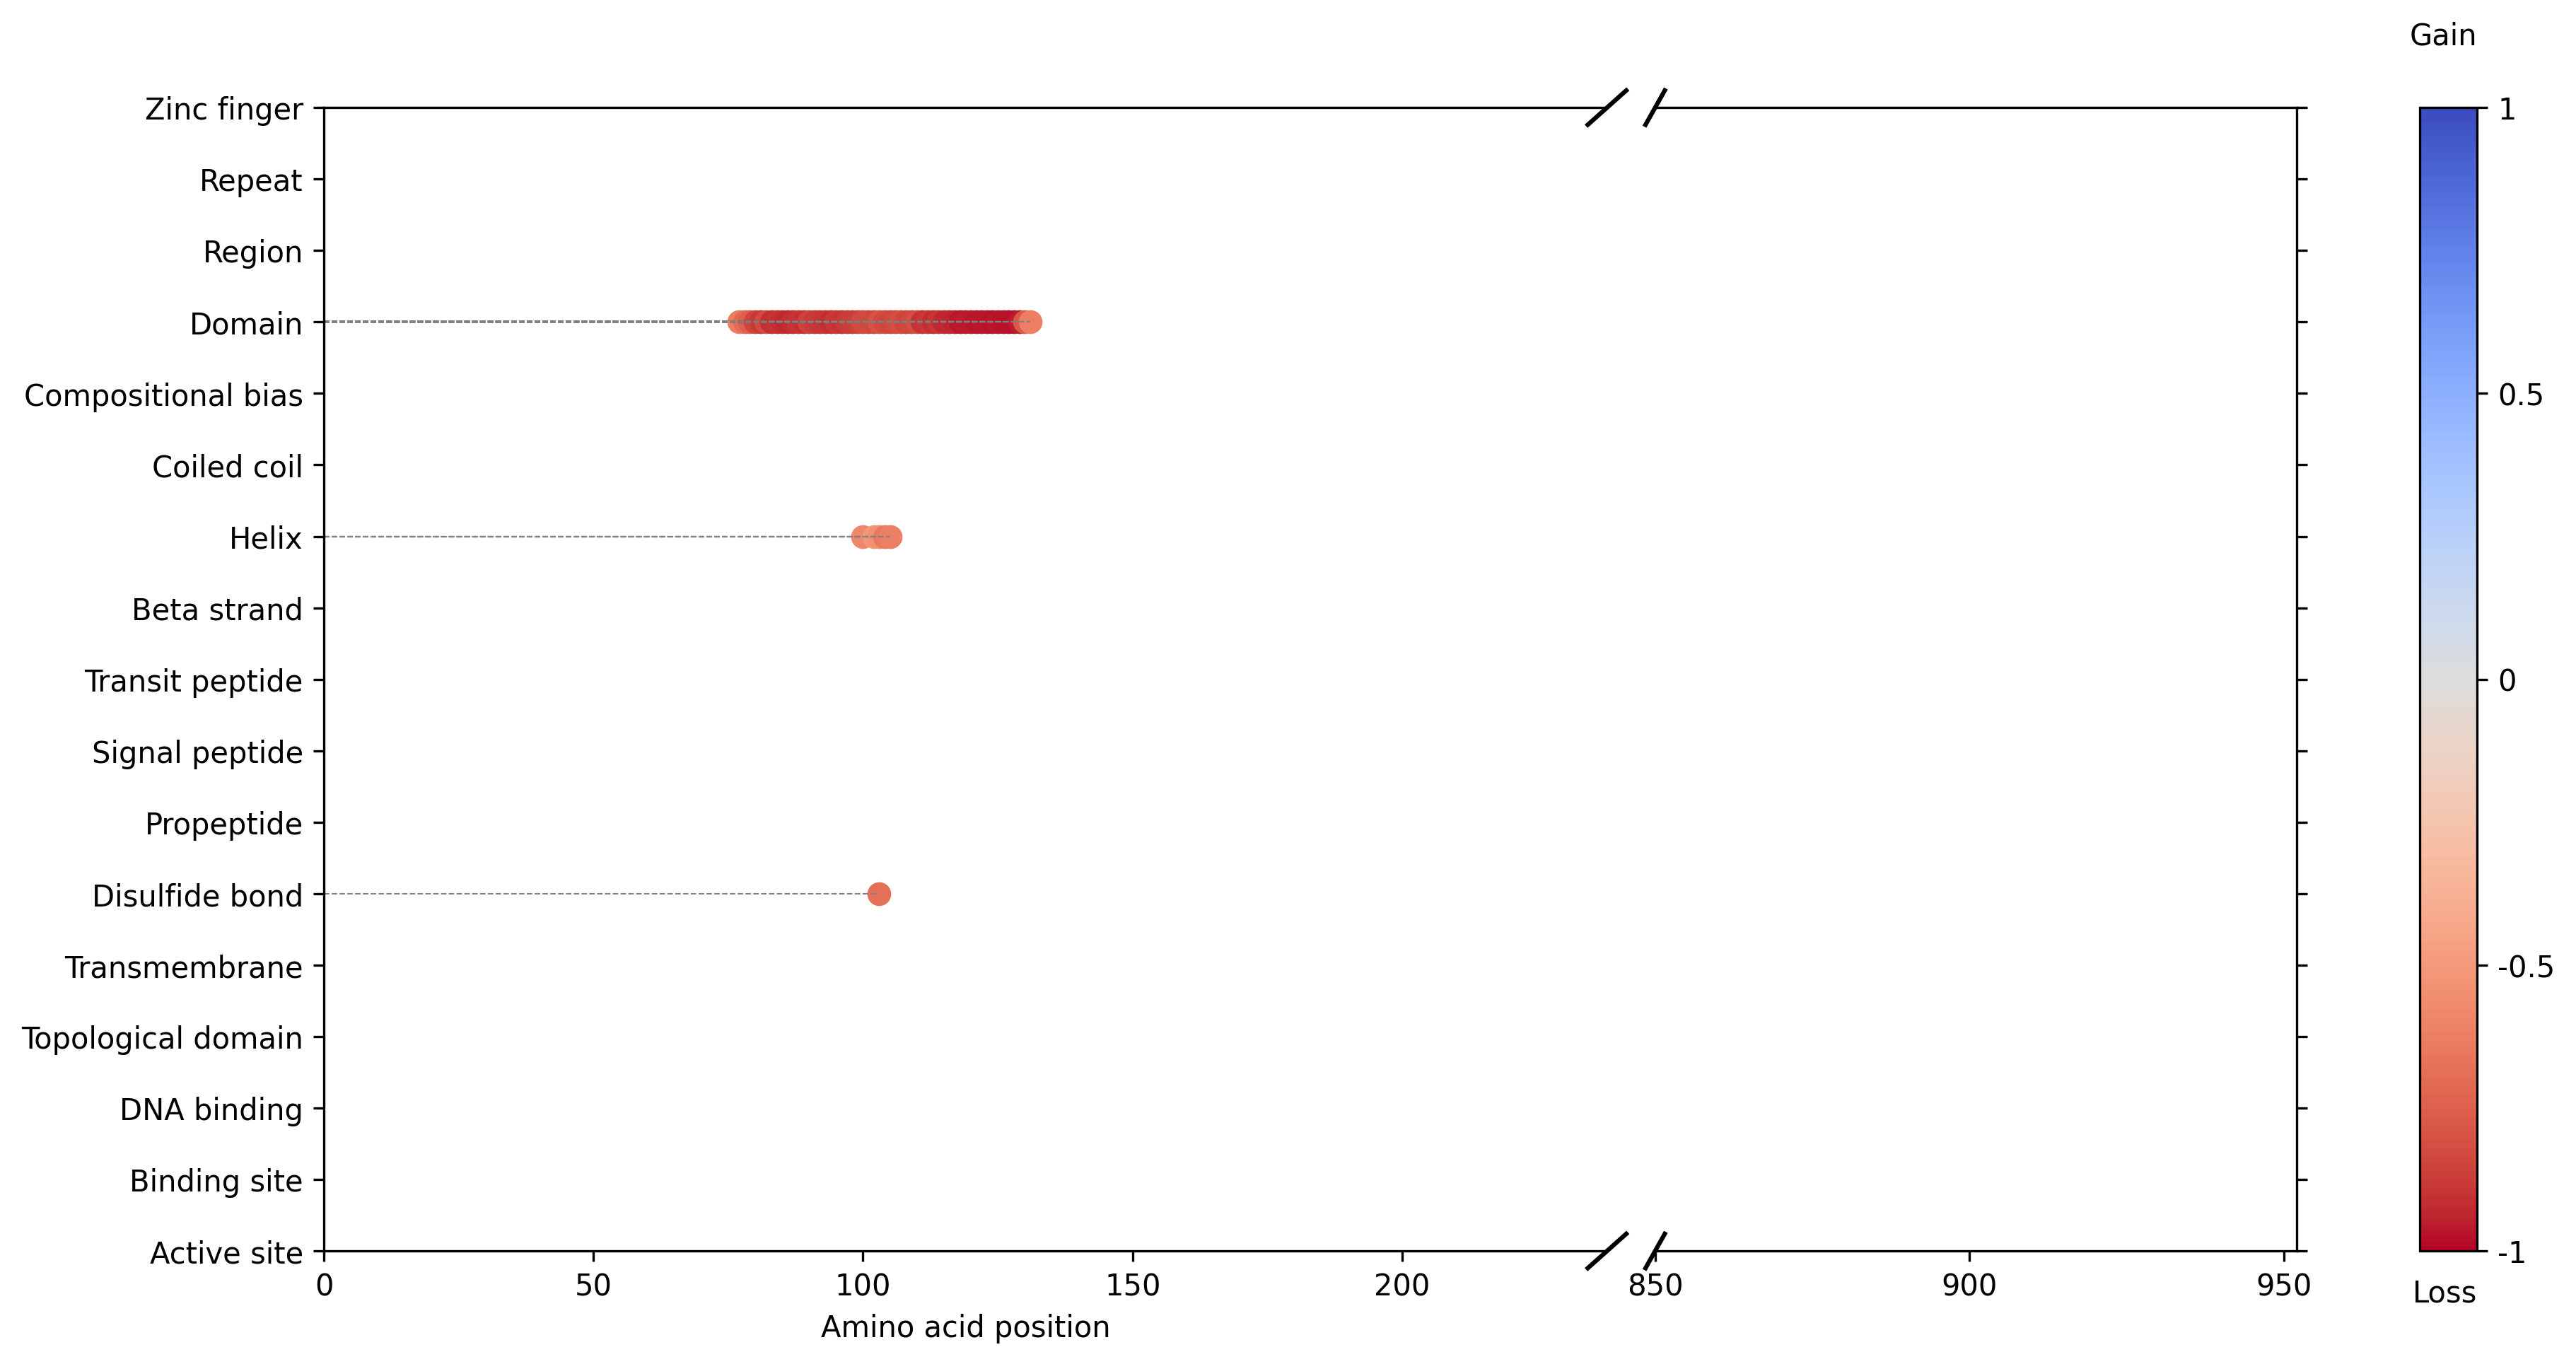
Figure 6: Predicted impact of p.Cys103Gly variant on GAA: the variant interpretation workflow (Figure 2) was used to predict the changes in protein features due to GAA:p.Cys103Gly variant. Each dot represents the loss or gain of a feature in the corresponding position. GAA:p.Cys103Gly is predicted to cause the complete loss of P-type domain from the mutant protein.
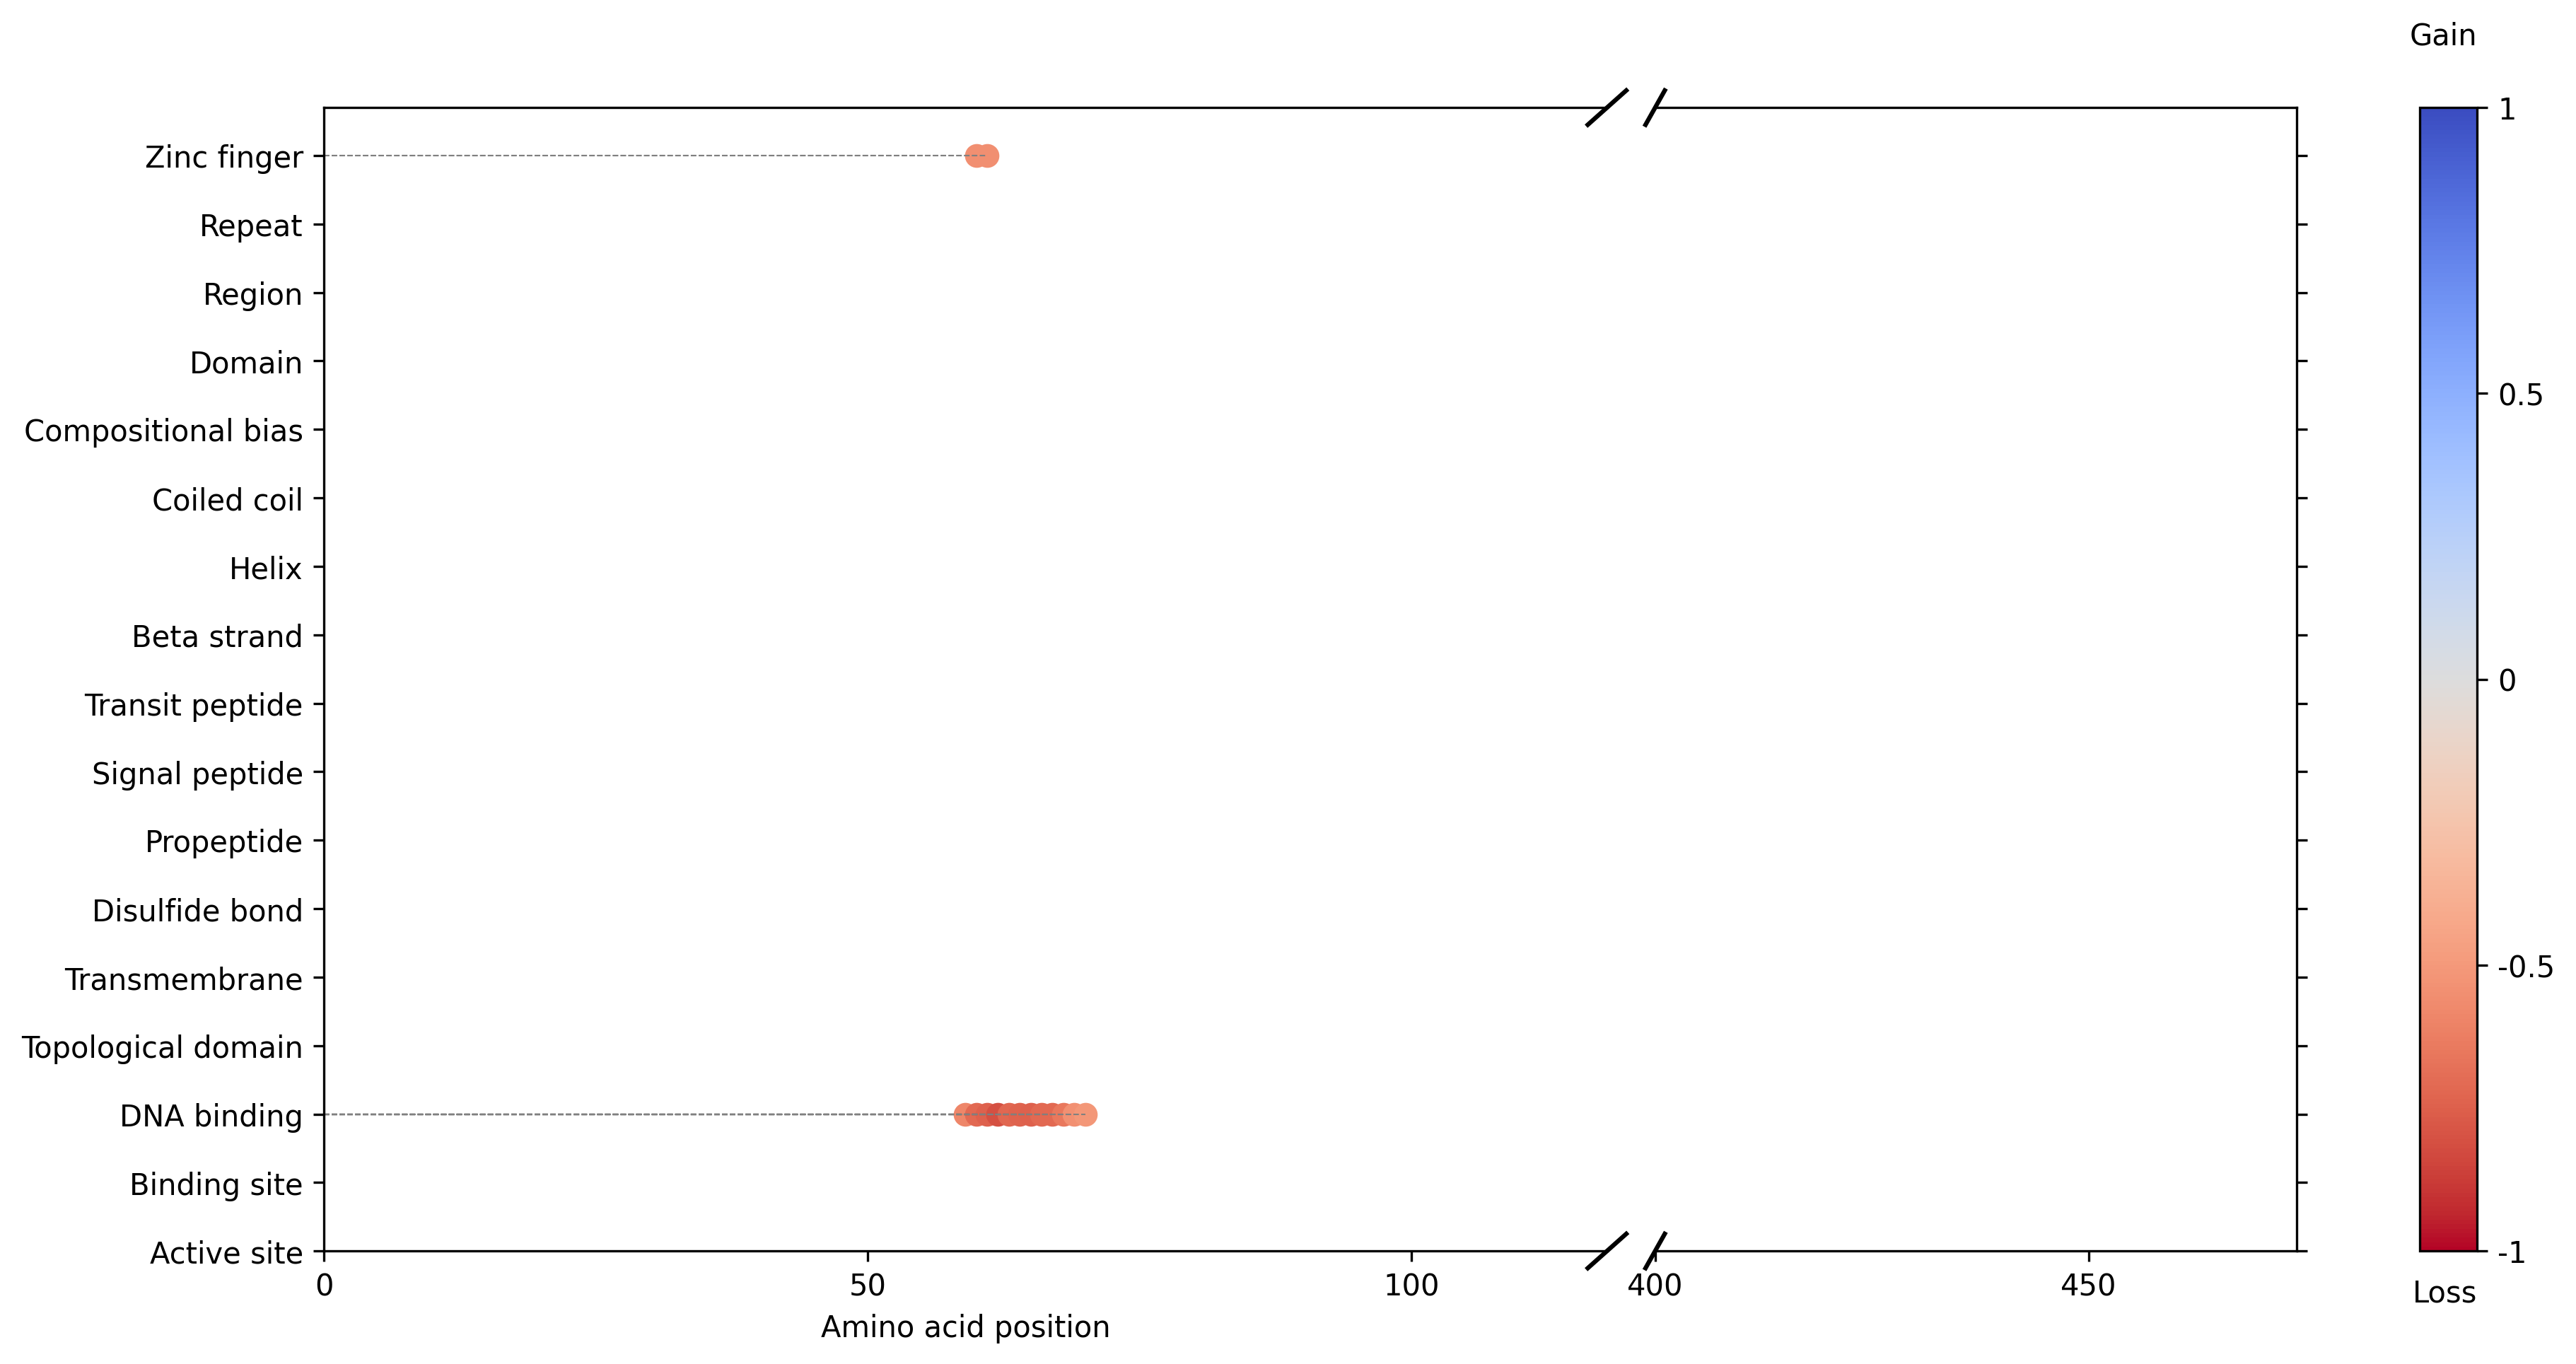
Figure 7: Predicted impact of p.Arg63Gln variant on HNF4A: the variant interpretation workflow (Figure 2) was used to predict the changes in protein features due to HNF4A:p.Arg63Gln variant. Each dot represents the loss or gain of a feature in the corresponding position. HNF4A:p.Arg63Gln is predicted to result in the partial loss of the DNA binding domain from the mutant protein.
4 Discussion
This study introduces an innovative application of the ESM2 protein language model to enhance our understanding of the functional implications of missense variants. Through fine-tuning of ESM2 on specific protein features, we have developed a toolset capable of classifying and interpreting missense variants with remarkable detail and accuracy.
Using our fine-tuned models, we quantified the burden of pathogenic variants in protein features and used them to reclassify 6.5% of VUS in gnomAD as pathogenic. We also demonstrate the power of our models to discern changes in protein features caused by missense variants. For instance, our analysis of specific pathogenic variants revealed loss of P-type domain in GAA and DNA binding domain in HNF4A, which can be directly linked to disease mechanisms.
Since our fine-tuned models can perform inference using CPU and only require protein sequences as input, they can be easily used by biologists and clinicians. Non-expert users can adopt our models to understand the molecular basis of missense variants and use them to design follow-up functional studies.
While our method shows promise, there are limitations. Some protein features were excluded due to poor model performance, reflecting the inherent complexity of these features. Moreover, while our models perform well with annotated data, their predictions for less characterized protein regions need more rigorous validation.
Our study demonstrates a powerful application of machine learning in the genomic field. This might support progress in personalized medicine, with downstream benefits for patient diagnosis and treatment planning.
Code Availability
References
- Auton et al. (2015) Auton, A., Consortium, . G. P., McCarthy, S., McVean, G. A., and Abecasis, G. R. A global reference for human genetic variation. Nature, 526(7571):68–74, September 2015. ISSN 1476-4687. doi: 10.1038/nature15393. URL http://dx.doi.org/10.1038/nature15393.
- Bagger et al. (2024) Bagger, F. O., Borgwardt, L., Jespersen, A. S., Hansen, A. R., Bertelsen, B., Kodama, M., and Nielsen, F. C. Whole genome sequencing in clinical practice. BMC Medical Genomics, 17(1), January 2024. ISSN 1755-8794. doi: 10.1186/s12920-024-01795-w. URL http://dx.doi.org/10.1186/s12920-024-01795-w.
- Bepler & Berger (2021) Bepler, T. and Berger, B. Learning the protein language: Evolution, structure, and function. Cell Systems, 12(6):654–669.e3, June 2021. ISSN 2405-4712. doi: 10.1016/j.cels.2021.05.017. URL http://dx.doi.org/10.1016/j.cels.2021.05.017.
- Boutet et al. (2007) Boutet, E., Lieberherr, D., Tognolli, M., Schneider, M., and Bairoch, A. UniProtKB/Swiss-Prot, pp. 89–112. Humana Press, 2007. ISBN 9781597455350. doi: 10.1007/978-1-59745-535-0˙4. URL http://dx.doi.org/10.1007/978-1-59745-535-0_4.
- Chen et al. (2023) Chen, S., Francioli, L. C., (gnomAD) Consortium, G. A. D., Tiao, G., Neale, B. M., MacArthur, D. G., and Karczewski, K. J. A genomic mutational constraint map using variation in 76, 156 human genomes. Nature, 625(7993):92–100, December 2023. ISSN 1476-4687. doi: 10.1038/s41586-023-06045-0. URL http://dx.doi.org/10.1038/s41586-023-06045-0.
- Cheng et al. (2023) Cheng, J., Novati, G., Pan, J., Bycroft, C., Zemgulytė, A., Applebaum, T., Pritzel, A., Wong, L. H., Zielinski, M., Sargeant, T., Schneider, R. G., Senior, A. W., Jumper, J., Hassabis, D., Kohli, P., and Avsec, Z. Accurate proteome-wide missense variant effect prediction with alphamissense. Science, 381(6664), September 2023. ISSN 1095-9203. doi: 10.1126/science.adg7492. URL http://dx.doi.org/10.1126/science.adg7492.
- Harrison et al. (2019) Harrison, S. M., Biesecker, L. G., and Rehm, H. L. Overview of specifications to the acmg/amp variant interpretation guidelines. Current Protocols in Human Genetics, 103(1), August 2019. ISSN 1934-8258. doi: 10.1002/cphg.93. URL http://dx.doi.org/10.1002/cphg.93.
- Ioannidis et al. (2016) Ioannidis, N. M., Rothstein, J. H., Pejaver, V., Middha, S., McDonnell, S. K., Baheti, S., Musolf, A., Li, Q., Holzinger, E., Karyadi, D., Cannon-Albright, L. A., Teerlink, C. C., Stanford, J. L., Isaacs, W. B., Xu, J., Cooney, K. A., Lange, E. M., Schleutker, J., Carpten, J. D., Powell, I. J., Cussenot, O., Cancel-Tassin, G., Giles, G. G., MacInnis, R. J., Maier, C., Hsieh, C.-L., Wiklund, F., Catalona, W. J., Foulkes, W. D., Mandal, D., Eeles, R. A., Kote-Jarai, Z., Bustamante, C. D., Schaid, D. J., Hastie, T., Ostrander, E. A., Bailey-Wilson, J. E., Radivojac, P., Thibodeau, S. N., Whittemore, A. S., and Sieh, W. Revel: An ensemble method for predicting the pathogenicity of rare missense variants. The American Journal of Human Genetics, 99(4):877–885, October 2016. ISSN 0002-9297. doi: 10.1016/j.ajhg.2016.08.016. URL http://dx.doi.org/10.1016/j.ajhg.2016.08.016.
- Iqbal et al. (2020) Iqbal, S., Pérez-Palma, E., Jespersen, J. B., May, P., Hoksza, D., Heyne, H. O., Ahmed, S. S., Rifat, Z. T., Rahman, M. S., Lage, K., Palotie, A., Cottrell, J. R., Wagner, F. F., Daly, M. J., Campbell, A. J., and Lal, D. Comprehensive characterization of amino acid positions in protein structures reveals molecular effect of missense variants. Proceedings of the National Academy of Sciences, 117(45):28201–28211, October 2020. ISSN 1091-6490. doi: 10.1073/pnas.2002660117. URL http://dx.doi.org/10.1073/pnas.2002660117.
- Landrum et al. (2013) Landrum, M. J., Lee, J. M., Riley, G. R., Jang, W., Rubinstein, W. S., Church, D. M., and Maglott, D. R. Clinvar: public archive of relationships among sequence variation and human phenotype. Nucleic Acids Research, 42(D1):D980–D985, November 2013. ISSN 1362-4962. doi: 10.1093/nar/gkt1113. URL http://dx.doi.org/10.1093/nar/gkt1113.
- Lin et al. (2023) Lin, Z., Akin, H., Rao, R., Hie, B., Zhu, Z., Lu, W., Smetanin, N., Verkuil, R., Kabeli, O., Shmueli, Y., dos Santos Costa, A., Fazel-Zarandi, M., Sercu, T., Candido, S., and Rives, A. Evolutionary-scale prediction of atomic-level protein structure with a language model. Science, 379(6637):1123–1130, March 2023. ISSN 1095-9203. doi: 10.1126/science.ade2574. URL http://dx.doi.org/10.1126/science.ade2574.
- Miosge et al. (2015) Miosge, L. A., Field, M. A., Sontani, Y., Cho, V., Johnson, S., Palkova, A., Balakishnan, B., Liang, R., Zhang, Y., Lyon, S., Beutler, B., Whittle, B., Bertram, E. M., Enders, A., Goodnow, C. C., and Andrews, T. D. Comparison of predicted and actual consequences of missense mutations. Proceedings of the National Academy of Sciences, 112(37), August 2015. ISSN 1091-6490. doi: 10.1073/pnas.1511585112. URL http://dx.doi.org/10.1073/pnas.1511585112.
- Pérez-Palma et al. (2019) Pérez-Palma, E., May, P., Iqbal, S., Niestroj, L.-M., Du, J., Heyne, H. O., Castrillon, J. A., O’Donnell-Luria, A., Nürnberg, P., Palotie, A., Daly, M., and Lal, D. Identification of pathogenic variant enriched regions across genes and gene families. Genome Research, 30(1):62–71, December 2019. ISSN 1549-5469. doi: 10.1101/gr.252601.119. URL http://dx.doi.org/10.1101/gr.252601.119.
- Quinodoz et al. (2022) Quinodoz, M., Peter, V. G., Cisarova, K., Royer-Bertrand, B., Stenson, P. D., Cooper, D. N., Unger, S., Superti-Furga, A., and Rivolta, C. Analysis of missense variants in the human genome reveals widespread gene-specific clustering and improves prediction of pathogenicity. The American Journal of Human Genetics, 109(3):457–470, March 2022. ISSN 0002-9297. doi: 10.1016/j.ajhg.2022.01.006. URL http://dx.doi.org/10.1016/j.ajhg.2022.01.006.
- Rehm et al. (2015) Rehm, H. L., Berg, J. S., Brooks, L. D., Bustamante, C. D., Evans, J. P., Landrum, M. J., Ledbetter, D. H., Maglott, D. R., Martin, C. L., Nussbaum, R. L., Plon, S. E., Ramos, E. M., Sherry, S. T., and Watson, M. S. Clingen — the clinical genome resource. New England Journal of Medicine, 372(23):2235–2242, June 2015. ISSN 1533-4406. doi: 10.1056/nejmsr1406261. URL http://dx.doi.org/10.1056/NEJMsr1406261.
- Richards et al. (2015) Richards, S., Aziz, N., Bale, S., Bick, D., Das, S., Gastier-Foster, J., Grody, W. W., Hegde, M., Lyon, E., Spector, E., Voelkerding, K., and Rehm, H. L. Standards and guidelines for the interpretation of sequence variants: a joint consensus recommendation of the american college of medical genetics and genomics and the association for molecular pathology. Genetics in Medicine, 17(5):405–424, May 2015. ISSN 1098-3600. doi: 10.1038/gim.2015.30. URL http://dx.doi.org/10.1038/gim.2015.30.
- Saadat & Fellay (2024a) Saadat, A. and Fellay, J. DNA language model and interpretable graph neural network identify genes and pathways involved in rare diseases. In Edwards, C., Wang, Q., Li, M., Zhao, L., Hope, T., and Ji, H. (eds.), Proceedings of the 1st Workshop on Language + Molecules (L+M 2024), pp. 103–115, Bangkok, Thailand, August 2024a. Association for Computational Linguistics. doi: 10.18653/v1/2024.langmol-1.13. URL https://aclanthology.org/2024.langmol-1.13.
- Saadat & Fellay (2024b) Saadat, A. and Fellay, J. Fine-tuning the ESM2 protein language model to understand the functional impact of missense variants. In ICML 2024 Workshop on Efficient and Accessible Foundation Models for Biological Discovery, 2024b. URL https://openreview.net/forum?id=wBETBcxoSn.
- Saadat et al. (2023) Saadat, A., Gouttenoire, J., Ripellino, P., Semela, D., Amar, S., Frey, B. M., Fontana, S., Mdawar-Bailly, E., Moradpour, D., Fellay, J., and Fraga, M. Inborn errors of type i interferon immunity in patients with symptomatic acute hepatitis e. Hepatology, 79(6):1421–1431, December 2023. ISSN 0270-9139. doi: 10.1097/hep.0000000000000701. URL http://dx.doi.org/10.1097/HEP.0000000000000701.
- Schmirler et al. (2023) Schmirler, R., Heinzinger, M., and Rost, B. Fine-tuning protein language models boosts predictions across diverse tasks. December 2023. doi: 10.1101/2023.12.13.571462. URL http://dx.doi.org/10.1101/2023.12.13.571462.
- Schreiber (2023) Schreiber, A. Esmbind and qbind: Lora, qlora, and esm-2 for predicting binding sites and post translational modification. November 2023. doi: 10.1101/2023.11.13.566930. URL http://dx.doi.org/10.1101/2023.11.13.566930.
- Siepel et al. (2005) Siepel, A., Bejerano, G., Pedersen, J. S., Hinrichs, A. S., Hou, M., Rosenbloom, K., Clawson, H., Spieth, J., Hillier, L. W., Richards, S., Weinstock, G. M., Wilson, R. K., Gibbs, R. A., Kent, W. J., Miller, W., and Haussler, D. Evolutionarily conserved elements in vertebrate, insect, worm, and yeast genomes. Genome Research, 15(8):1034–1050, July 2005. ISSN 1088-9051. doi: 10.1101/gr.3715005. URL http://dx.doi.org/10.1101/gr.3715005.
- Tavtigian et al. (2018) Tavtigian, S. V., Greenblatt, M. S., Harrison, S. M., Nussbaum, R. L., Prabhu, S. A., Boucher, K. M., and Biesecker, L. G. Modeling the acmg/amp variant classification guidelines as a bayesian classification framework. Genetics in Medicine, 20(9):1054–1060, September 2018. ISSN 1098-3600. doi: 10.1038/gim.2017.210. URL http://dx.doi.org/10.1038/gim.2017.210.
Appendix A Appendix
We used ACMG/AMP guidelines (Richards et al., 2015) to classify the variants into putative pathogenicity groups, as described in our previous works (Saadat et al., 2023; Saadat & Fellay, 2024a, b). In summary, we gather all the available evidences for a variant. Table 1 summarizes all the ACMG/AMP criteria that we used.
To calculate the probability of pathogenicity (PoP), we use the Bayesian framework developed by Tavtigian et al. (2018). For a given variant, the PoP is calculated as follow: