ACReferences \newcitesADReferences \newcitesAEReferences
A discrete event simulator for policy evaluation in liver allocation in Eurotransplant
Abstract
We present the ELAS simulator, a discrete event simulator built for the Eurotransplant (ET) Liver Allocation System (ELAS). Eurotransplant uses ELAS to allocate deceased donor livers in eight European countries. The simulator is made publicly available111Code and synthetic data are available via this link. to be transparent on which model Eurotransplant uses to evaluate liver allocation policies, and to facilitate collaborations with policymakers, scientists and other stakeholders in evaluating alternative liver allocation policies. This paper describes the design and modules of the ELAS simulator. One of the included modules is the obligation module, which is instrumental in ensuring that international cooperation in liver allocation benefits all ET member countries.
By default, the ELAS simulator simulates liver allocation according to the actual ET allocation rules. Stochastic processes, such as graft offer acceptance behavior and listing for a repeat transplantation, are approximated with statistical models which were calibrated to data from the ET registry. We validate the ELAS simulator by comparing simulated waitlist outcomes to historically observed waitlist outcomes between 2016 and 2019.
The modular design of the ELAS simulator gives end users maximal control over the rules and assumptions under which ET liver allocation is simulated, which makes the simulator useful for policy evaluation. We illustrate this with two clinically motivated case studies, for which we collaborated with hepatologists and transplantation surgeons from two liver advisory committees affiliated with Eurotransplant.
1 Introduction
Eurotransplant (ET) is responsible for the allocation of deceased donor organs in eight European countries (Austria, Belgium, Croatia, Germany, Hungary, Luxembourg, the Netherlands, and Slovenia). For liver allocation, an important role is played by the Eurotransplant Liver and Intestine Advisory Committee (ELIAC). This advisory committee monitors the ET liver allocation system (ELAS), and makes proposals to the Eurotransplant Board on how to improve liver allocation rules according to latest medical insights. ELIAC has brought forward several issues with ELAS; for instance, it has been reported that ELAS overprioritizes candidates who receive exception points [1], and it has been reported that Model for End-stage Liver Disease (MELD) [2], ET’s basis for liver allocation, may underserve female transplantation candidates [3, 4]. Despite identification of such issues, the current liver allocation system has not changed much since December 2006, when MELD scores became the basis for liver allocation in Eurotransplant.
Reasons for the limited evolution of ELAS are questions on whether the proposed modifications to allocation rules are adequate, and concerns that proposed policy changes may have unintended consequences. These doubts and concerns raise the need for a tool which can quantitatively map how changes to allocation rules affect the mortality rates on the liver waitlist and access to transplantation. There is a long history of using operations research and discrete event simulation for this purpose, with early work including the development of the UNOS Liver Allocation Model (ULAM) for U.S. liver allocation [5] and use of computer simulation for design of the 1996 Eurotransplant Kidney Allocation System [6, 7].
This work has culminated in the development of a family of discrete event simulators called the Simulation Allocation Models (SAMs) [8], which are maintained by the Scientific Registry of Transplant Recipients (SRTR) and tuned to allocation systems in the United States. LSAM, which is SRTR’s tool for liver allocation [8], is used routinely by the scientific community and policy makers to study alternative liver allocation rules. For instance, LSAM has been used to study the impact of expanding MELD with extra biomarkers [9, 10], the impact of alternative geographic sharing rules [11, 12, 13, 14, 15], and the impact of measures which improve access to transplantation for specific patient groups such as pediatric patients and females [16, 17, 18]. Other organ allocation organizations also routinely note the usage of simulators for evaluation of new allocation policies, for example in France [19, 20], the United Kingdom [21], the Netherlands [22] and India [23]. More recently, simulation-optimization has been used in the operations research literature to design optimized allocation policies [24, 25, 26].
Simulation can thus play a key role in moving Eurotransplant’s liver allocation system forward. However, existing simulation models are not directly applicable to Eurotransplant. Such models typically simulate allocation for a single patient population, whereas Eurotransplant needs to balance the interests of the populations from its eight member countries. A complicating factor in this is that ET member countries have different organ donation rates per million population [27], such that they face different challenges in liver allocation. Moreover, existing models typically implement allocation rules that are specific to the country for which the simulator was designed. For instance, allocation rules of SAM software place much emphasis on physical distances between the donor and transplantation candidate, because geographical sharing in the United States is primarily constrained by physical distances. In Eurotransplant, on the other hand, geographical sharing is mostly impeded by country borders. ELAS therefore gives substantial priority to candidates located in the same country as the donor, and a mechanism is implemented in ELAS which ensures that livers transplanted across country borders with absolute international priority are paid back. Existing simulation models do not implement such mechanisms, and are thus a poor fit for Eurotransplant.
This has motivated us to develop a discrete event simulator tailored to Eurotransplant, which we refer to as the ELAS simulator. Code for the ELAS simulator is implemented in Python, and made publicly available together with synthetic data.222http://github.com/hansdeferrante/Eurotransplant_ELAS_simulator By default, the ELAS simulator simulates ET liver allocation according to ET allocation rules. The modular design of the simulator enables end users to also use the simulator for policy evaluation.
The rest of this paper is structured as follows. In Section 1.1, we give a description of Eurotransplant’s liver allocation system (ELAS). In Section 2 we discuss the design of the ELAS Simulator, and give an overview of the general flow of the simulations. In Section 3, we describe important modules of the ELAS simulator, each of which emulates a key aspect of the liver allocation process. In Section 4, we discuss verification and validation of the ELAS simulator. In Section 5, we illustrate with two clinically motivated case studies that the ELAS simulator is useful for policy evaluation. We conclude and discuss in Section 6.
1.1 The Eurotransplant Liver Allocation System
Here, we give a simplified description of the ET Liver Allocation System, referred to as ELAS (more comprehensive descriptions are available elsewhere [28][29]). Fundamental to ELAS is the laboratory MELD (lab-MELD) score, which quantifies a candidate’s 90-day waitlist mortality risk based on blood measurements of serum bilirubin, serum creatinine, and the INR [2]. The rationale behind using lab-MELD scores for liver allocation is that lab-MELD scores are a strong and internationally accepted predictor of a candidate’s 90-day mortality risk. However, prioritization of candidates is not solely based on lab-MELD scores, because certain patient groups would be underserved by such an allocation. Specifically, ELAS also prioritizes candidates with:
-
•
the High Urgency (HU) status, which gives absolute international priority to candidates with acute liver failure,
-
•
the Approved Combined Organ (ACO) status, which is given to candidates who require a combined transplantation of a liver with a heart, lung, pancreas or intestine,
-
•
pediatric MELD (PED-MELD) scores, which are assigned automatically to candidates of pediatric age333Currently, younger than 16 in Germany and younger than 18 in the other member countries, and
-
•
(non-)standard exception (SE/NSE) MELD scores, which are available to patients who deserve priority for reasons other than a high short-term mortality risk and for which the lab-MELD score does not represent clinical severity of the disease. These reasons include risk of disease irreversibility (for instance, hepatocellular carcinoma) and quality of life reasons (for instance, polycystic liver disease).
When a liver graft is to be offered for transplantation within Eurotransplant, ET’s liver match algorithm is run. This computer algorithm implements the allocation policies and prioritization mechanisms of ELAS. From all candidates who are waiting for a liver transplantation, the algorithm returns a list of candidates eligible to receive the graft. This match list is ordered based on donor and candidate characteristics, and the order determines the sequence in which candidates are offered the graft by Eurotransplant. An actual ET liver match list for an adult blood group A donor reported from the Netherlands is shown in Table 1.
| Tier | Offered to | Candidate country | Rank | Match- MELD | Lab- MELD | PED- MELD | (N)SE -MELD | Cand. blood group | Offer accepted? |
| HU | patient | Austria | 1 | 25 | 22 | AB | No | ||
| center (29 patients) | Croatia | 2 | No | ||||||
| 3 | 28 | 16 | 28 | A | No | ||||
| 4 | 22 | 22 | A | No | |||||
| 5 | 20 | 8 | 20 | A | No | ||||
| 6 | 20 | 20 | A | No | |||||
| 7 | 17 | 17 | A | No | |||||
| 8 | 17 | 17 | A | No | |||||
| 9 | 16 | 16 | A | No | |||||
| 10 | 15 | 15 | A | No | |||||
| 11 | 14 | 14 | A | No | |||||
| 12 | 14 | 14 | AB | No | |||||
| 13 | 14 | 14 | A | No | |||||
| 14 | 13 | 13 | A | No | |||||
| 15 | 13 | 13 | A | No | |||||
| 16 | 9 | 9 | A | No | |||||
| 17 | 9 | 9 | A | No | |||||
| 18 | 9 | 9 | A | No | |||||
| 19 | 8 | 8 | A | No | |||||
| 20 | 8 | 8 | A | No | |||||
| Netherlands | 21 | 6 | 6 | A | No | ||||
| elective | patient | Belgium | 22 | 35 | 35 | A | Yes |
At the highest level, the ET match list order is based on match tiers, with candidates in higher tiers having priority over candidates in lower tiers. The first ELAS tier consists of candidates with the High Urgency (HU) status, and the second tier consists of candidates with the Approved Combined Organ (ACO) status. Candidates with HU or ACO status are given absolute international priority in Eurotransplant. To ensure that international transfers of liver grafts between ET member countries remain in balance, ELAS includes a payback mechanism for grafts accepted internationally in the HU and ACO tiers. Specifically, international HU/ACO transplantations create an obligation for the receiving country to offer the next available liver within the same blood group to the donor country until the obligation is redeemed (see Section 3.2 for more information).
Candidates without HU/ACO status are referred to as elective candidates, and such candidates are ranked in the remaining tiers. Whether candidates appear on the match list and their ranking on the match list is jointly determined by patient selection criteria (blood groups), ranking criteria (MELD, pediatric status, donor/recipient blood group combination), and filtering criteria (patients can indicate they do not want to be considered for certain donors with allocation profiles). These patient selection criteria, ranking criteria, and filtering criteria are multi-factorial, and generally differ by ET member country.
Common to all countries is that substantial priority is given to candidates who are listed in the same country as the country from which the donor is reported. Other factors which affect the ELAS ranking include donor/candidate blood groups, whether the donor and/or candidate are pediatric, whether the adult is low-weight (55kg), and the geographical location of the candidate with respect to the donor reporting center. The match list order in elective tiers is also affected by obligations. For instance, when the match list shown in Table 1 was created, the Netherlands had an obligation to offer a blood group A liver back to Croatia. Consequently, in the elective tier all Croatian candidates were ranked above Dutch candidates. The most important factor for ranking candidates in elective tiers is the match-MELD score (see Table 1). This match-MELD score can differ from the candidate’s lab-MELD score in case the candidate has received exception points (either a PED-MELD score which is valid internationally, or an (N)SE-MELD score which is valid nationally and valid if offers are based on obligations).
Most offers in ELAS are recipient-driven, which means that Eurotransplant offers the liver graft to a named candidate [28]. Under specific circumstances, ELAS offers are center-driven, which means that the center is free to choose any blood group compatible candidate on their waiting list for transplantation. For instance, offers to Croatia which are based on an obligation are center offers (this is why a single offer to 29 Croatian candidates appears on the match list in Table 1). The position of this center offer on the match list is determined by the highest ranked elective candidate listed in the center. We point out that national regulations diverge on when offers are center-driven (see [29] for a description of these regulations).
We mentioned that the order of the match list determines the sequence in which Eurotransplant contacts centers in standard allocation. In particular cases, Eurotransplant may deviate from this allocation order with a rescue procedure (see [28, 29]). Firstly, Eurotransplant can start the extended allocation procedure 1-2 hours before the planned explantation procedure (depending on the country) to speed up the allocation process. Centers in the vicinity of the donor center are then asked to actively propose up to 2 candidates for transplantation to Eurotransplant within 30 minutes, and the proposed candidate with the highest rank on the match list is selected for transplantation. If unsuccessful, Eurotransplant can offer the graft to centers further from the donor center on a first-come-first-serve basis with competitive rescue allocation in order to avoid organ loss. In total, 20-25% of liver grafts are transplanted after deviation from the standard allocation procedure [28]; extended allocation accounts for the majority of this figure.
2 The design of the ELAS Simulator
In this section, we describe the design of the ELAS simulator. The goal of this simulator is to enable end users to map the impact of changes to liver allocation rules on waitlist mortality rates and access to transplantation in Eurotransplant. We follow existing literature [30, 5, 31, 8] in using Discrete Event Simulation (DES) for this purpose. With DES, complex processes are analyzed by determining how system states are affected by a sequence of discrete events. Within the ELAS simulator, the system states are (i) the statuses of transplantation candidates (whether they remain alive, their last known MELD score, their accrued waiting time, and other information used in allocation), and (ii) obligations to return a graft. The discrete events which affect these system states are (i) patient events, which directly modify the candidate’s state which include for instance updates to candidate’s MELD score, and (ii) liver donation events, which lead to the transplantation of a candidate and which may result in the creation / redemption of an obligation to pay back a liver graft.
Apart from ET allocation rules, which candidate is transplanted at what moment is affected by several stochastic processes. One such process is center acceptance behavior. Such behavior plays a key role in liver allocation because transplantation centers frequently turn down offers of liver grafts deemed unsuitable for their candidate. Another stochastic process is that recipients of a liver transplant may experience graft failure, and be listed for a repeat transplantation. To accurately simulate outcomes of the ET liver allocation process, the ELAS simulator also has to emulate these stochastic processes.
For discussion of the design of the ELAS simulator, we find it helpful to distinguish between
-
1.
the organ allocation environment, with which we refer to the overall setting in which allocation policies operate. This environment is deterministically defined by the simulation settings and input streams. Critical are the simulation input streams, which are the datasets which define the donors which become available for transplantation, the candidates who appear on the liver waitlist, and the donor and patient events which drive ELAS simulations. These input streams also specify the nested structure of agents in the ELAS simulations, with donors / patients nested in hospitals / transplantation centers, which are in turn nested in the ET member countries. The organ allocation environment has to be pre-specified to any simulation. We discuss the requirements for input streams in Section 2.1. How simulations are initialized based on input streams is discussed in Section 2.2. How simulations proceed is illustrated in Section 2.3,
-
and .
simulation modules, which are implemented in Python code. These modules emulate key aspects of the liver allocation procedure. These processes include the generation of liver match lists according to liver allocation rules, the simulation of graft offer acceptance behavior, ELAS’ obligation system, and ELAS’ exception point system. We discuss the implemented modules in Section 3.
2.1 The organ allocation environment
The ELAS simulator requires input streams for donor information and for candidate information. Based on these input streams, the simulator constructs the discrete events which drive ELAS simulations. Users of the ELAS simulator are free to base these input streams on actual historic data, reordered historic data, synthetic data, or combinations thereof. Ideally, choices on which input stream to use are based on the end user’s research question of interest. For instance, end-users interested in evaluating the impact of small changes to allocation rules may use historic data from the ET registry for simulation, whereas end-users interested in evaluating the effect of an expansion to the donor pool may need to extend the historic donor pool with synthetic donor data.
For the input stream for donors, all administrative and medical information necessary for liver allocation is required, as is all information necessary for prediction of graft offer acceptance decisions, and all information necessary for prediction of post-transplant survival. Such information includes the donor reporting date, the donor hospital and donor reporting center, the donor weight and height, the donor blood group, and the donor death cause. The information on the donor is static and reflects the state of the donor on the date that they are reported to Eurotransplant.
For the input streams for transplantation candidates, basic administrative and medical information necessary for allocation is also required. Such information includes the candidate’s center of listing, the candidate’s disease group, the candidate’s age and weight, and the candidate blood group. To identify candidates listing for a repeat transplantation, a candidate identifier must also be identified. Next to this static candidate information, dynamic information is required on the evolution of candidate’s medical condition while they await liver transplantation. For this, the ELAS simulator requires an input stream of candidate status updates. These status updates specify when and how a candidate’s state changes while they wait on the Eurotransplant waitlist. Examples of such status updates are new measurements for the biomarkers used in MELD (which are used to calculate MELD scores), reception of or upgrades to exceptional scores (NSE/SE/PED-MELD), changes to the candidate’s waitlist status (HU / ACO / non-transplantable (NT) status, and exit statuses for the candidate (removed / waitlist death). Because candidates regularly modify their allocation profiles, profiles were also implemented as status updates. With these allocation profiles, centers can indicate that a candidate does not want to receive certain graft offers. For instance, many candidates specify that they do not want to be offered grafts from donors above a certain age.
Generally, discrete event simulators for organ allocation require complete knowledge on what would happen to a candidate if they would remain on the waiting list. For candidates transplanted in reality, such information is necessarily partly counterfactual; after all, transplantation prevents us from observing what would have happened to the transplanted candidate if they had remained on the waiting list. For other simulators, this counterfactual status problem was tackled by complementing the real statuses of a transplanted candidate with statuses copied over from a similar but not-yet-transplanted candidate [30, 8]. Based on this idea, we propose to construct for each transplanted candidate a risk set of candidates who (i) remain on the waiting list, (ii) are similar to the candidate on a set of pre-specified characteristics, and (iii) face similar 90-day mortality risks in the absence of transplantation. A complete status update trajectory can then be constructed by (i) randomly sampling a candidate from the risk set, and (ii) copying over the future status updates from the sampled candidate. By running this procedure repeatedly, we construct for each candidate multiple potential status update trajectories. This allows us to also quantify the uncertainty in this counterfactual status imputation procedure in simulations. We describe our procedure to complete counterfactual status updates in detail in Appendix C.
2.2 Initialization of the ELAS simulator’s system state
End users of the ELAS simulator must specify a simulation start and end date, which jointly define the simulation time window. When simulation starts, the system state is initialized by loading from input streams all donors reported during the simulation window, and all candidates who had an active waitlist status during the simulation window. For the loaded candidates, all status updates are pre-processed until the simulation start date. Thereby, the states of candidates at the simulation start date are congruent with their actual states as specified in candidate input streams.
One issue is that candidates who (i) received a transplantation and (ii) were re-listed for repeat transplantation may have multiple registrations falling within the simulation window. To avoid that such candidates are simultaneously listed for a primary transplantation and repeat transplantation in simulations, the ELAS simulator by default ignores re-listings of such candidates from the candidate input stream. Instead, patient re-listing is simulated by the post-transplant module. This module simulates the post-transplant survival and the potential re-listing of transplant recipients based on candidate and donor characteristics (see Section 3.5 for details).
Initialization of the discrete event simulation is finalized by scheduling for each donor and transplantation candidate a single event in the Future Event Set (FES). For donors, events are scheduled at the donor reporting date as specified in the donor input stream. For each candidate, a single patient event is scheduled at the time of the candidate’s first available status update after the simulation start date. Subsequent updates are scheduled in the FES only after the existing patient event has been handled (see Section 2.3).
2.3 Overview of the simulation
Figure 1 shows how patient and donor events from the FES are processed in the ELAS simulator. In case of a patient event, the corresponding candidate’s status is updated according to their firstly scheduled status update. Subsequent status updates are only scheduled after the already scheduled event has been processed. This postponement is necessitated by the fact that processing of a patient’s status update may result in automatic scheduling of a new status update (see Section 3.3).
In case a donor event is processed, a match list is created. To appear on this match list, candidates must have an active waitlist status (T, HU, or ACO), and must be compatible with the donor according to ELAS blood group rules. The match list consists of patient-driven and/or center-driven offers. The order of the match list is deterministic and follows the allocation rules specified in the organ allocation environment. By default, actual ELAS allocation rules are followed (described in Section 3.1).
The ordered match list serves as an input to the graft offering module (see Section 3.4). This module emulates the graft offering process in Eurotransplant, and returns the candidate who accepts the liver offer (if any). We point out that it is not obvious for which candidate the offered liver graft is accepted based on the match list alone. One reason for this is that offers are often declined by the transplant centers; in fact, over half of the transplanted liver grafts were declined by 10 or more candidates before they were accepted for transplantation. A second reason is that Eurotransplant may deviate from the standard allocation procedure to avoid the loss of transplantable organs (see Section 1.1). In simulating which candidate accepts the offer, the graft offering module emulates the graft offer acceptance behavior of transplant centers, and deviation from standard allocation.
The ELAS simulator assumes that the candidate who accepts the liver graft is transplanted, and removes scheduled events for this transplanted candidate from the Future Event Set. In case the donor liver was exported and transplanted to a different ET member country in HU or ACO tiers (or based on an obligation), the obligation system module creates (or redeems) obligations (see Section 3.2). The post-transplant module simulates a time-until-liver-failure for each transplantation (see Section 3.5). In case the transplant recipient is simulated to re-list on the liver waiting list before graft failure, the post-transplant module schedules a “synthetic” re-listing for the candidate. This synthetic re-listing is constructed by combining the static information from the transplant recipient, with the dynamic status updates from a candidate who was actually listed for a repeat transplantation.
The processing of patient and donor events continues until the simulation end date is reached. At simulation termination, information on transplantations is written to an output file. A list of discarded grafts (if any) is also written to output files, as are the final states of all candidates present in the simulation. These final states include candidate exit statuses (waiting, waitlist death, transplanted, or waitlist removal), as well as the last reported MELD scores of candidates. Such information may be summarized in post-processing to calculate the summary statistics relevant to a specific research question. We chose to write raw information to files rather than pre-defined summaries of information to give end users maximum flexibility in calculating more complicated summary statistics.
3 Modules of the ELAS simulator
This section describes key modules of the ELAS simulator: the match list module (Section 3.1), the obligation system module (Section 3.2), the exception module (Section 3.3), the graft offering module (Section 3.4), and the post-transplant module (Section 3.5).
3.1 The match list module
When a liver graft becomes available for transplantation, the match list module creates an ordered list of candidates who sequentially receive offers from the Eurotransplant until a candidate accepts the liver graft. To appear on the match list, candidates must (i) have an active waitlist status (transplantable, HU, or ACO), and (ii) have a blood group compatible with the donor according to ELAS allocation rules. The order of the created match list depends on patient and candidate characteristics, as well as whether the donor country has obligations to return a liver graft to other parties. By default, the match list module collapses offers to candidates eligible for center-driven offers into a single center offer object, whose rank is set equal to the rank of the highest ranked candidate who is eligible for the center offer. The match lists returned by the match list module are thereby ordered lists of center-driven and patient-driven offers, coinciding with the structure of match lists currently used by the Eurotransplant for liver allocation (see the example match list in Table 1).
The precise ordering returned by the match list module is based on liver allocation rules, which have to be pre-specified as part of organ allocation environment. The rules made available with the ELAS simulator are the current ELAS allocation rules. End-users of the ELAS simulator can modify these allocation rules to study waitlist outcomes under alternative rules.
On a technical level, the order of ELAS match objects (patient- or center-driven offers) is based on match codes. These match codes consist of several components which are determined by ET allocation rules, donor and patient characteristics, and the existence of obligations. Match codes are ordered lexicographically based on:
-
1.
Match tiers, which are used to give absolute international priority to patients with HU status or ACO status,
-
2.
Match layers, which differ per country and are used to give priority to certain patient groups (for instance, to pediatric candidates, to blood group identical candidates, local candidates, to candidates located in other countries based on obligations),
-
3.
Match obligation ranks, which are used as a tiebreaker in case the donor country has obligations to return livers to multiple countries,
-
4.
Match MELDs, which are used in the elective (i.e. non-HU/ACO) tiers,
-
5.
Match locality, which is used to prioritize patients regionally in Germany in elective tiers,
-
6.
Waiting time. In HU/ACO tiers, this is the number of days with the HU/ACO status. In elective tiers, this counts the number of consecutive days the candidate has had a match MELD at least as high as the current match MELD,
-
7.
The patient listing date, which is used as a final tiebreaker.
3.2 The obligation system module
To ensure a balanced exchange of liver grafts between ET member countries, ELAS includes an obligation system. Specifically, grafts transplanted across country borders with international priority (HU and ACO tiers) create an obligation for the recipient’s country444In Austria, obligations are defined at the level of the transplantation center. to return an organ of the same blood group to the donor country. An important feature of ET’s obligation system is that obligations within the same blood group are automatically linked. For example, if the Netherlands has an obligation to return a blood group A liver to Belgium, and an obligation is created for Belgium to return a blood group A liver to Germany, the two existing obligations are replaced by a linked obligation to return a blood group A liver from the Netherlands to Germany.
The obligation system module implemented in the ELAS simulator creates the obligations for grafts procured internationally in HU/ACO tiers, and automatically replaces linkable obligations by a linked obligation. The module also has the functionality to return for a given blood group and country which outstanding obligations exist, as well as the number of days these obligations have existed. This information is required by the ELAS simulator’s match list module to determine match obligation ranks (see Section 3.1).
3.3 The exception score module
Patient groups who are considered to be underserved by a purely lab-MELD-based allocation can apply for standard (SE) or non-standard (NSE) exceptions in ELAS. Pediatric patients have priority in allocation through the PED-MELD score. Candidates who receive such (N)SE and PED-MELD scores are awarded a pre-defined 90-day “mortality equivalent”, specified in percentages. Which exceptions are awarded in a country, the conditions under which exceptions are awarded, and which mortality equivalent is awarded per condition is determined by national competent authorities. For example, in the Netherlands candidates with hepatocellular carcinoma are currently awarded a 10% mortality equivalent, whereas in Belgium a 15% mortality equivalent is awarded. For allocation, these mortality equivalents are translated to the MELD scale. For instance, a 10% and 15% mortality equivalent correspond to MELD scores of 20 and 22, respectively [29]. The awarded 90-day mortality equivalent increases every 90 days555(N)SEs which have to manually re-certified increase immediately upon re-certification. Re-certification is possible 14 days before an (N)SE expires, meaning that in practice, (N)SEs can increase every 76-90 days. In simulations, we assume that such (N)SEs are upgraded after 80 days. Certain (N)SEs and PED-MELD are automatically re-certified at expiry and increase every 90 days. Such (N)SEs are upgraded every 90 days in simulations. for most (N)SEs and PED-MELDs, according to exception- and country-specific increments. In the current allocation system, some exceptions are implemented as “bonus SEs”, which add a fixed percentage point mortality equivalent to the lab-MELD’s 90-day mortality equivalent.
The exception score module implements this system, and is initialized based on an external file. This file has to specify which exceptions exist, and relevant exception attributes (the initial mortality equivalent awarded, the 90-day increment, the maximal equivalent awarded, the maximum age after which the exception no longer increases, and whether the SE is a regular SE or a bonus SE). For the default organ allocation environment, all (N)SEs and PED-MELDs existing in 2023 were implemented (see Appendix B for an overview). End-users may modify the attributes of these exceptions to simulate ET liver allocation under alternative (N)SE / PED-MELD rules. Simulation settings also have to include parameters for the formula used to translate 90-day mortality equivalents to the MELD scale.666This transformation is based on a Cox proportional hazards model which adjusts only for MELD and which uses a MELD score of 10 as the reference group. The curve used by Eurotransplant is given by: where 0.98037 is the 90-day mortality equivalent for a MELD score of 10, and 0.17557 is the slope on MELD.
By default, the ELAS simulator assumes that the candidate status input stream also specifies when exceptions are upgraded or expire. In case no future exception status is present in the candidate status queue for an NSE/SE/PED-MELD, the ELAS simulator assumes that the candidate would continue to re-certify their exception according to the exception-specific re-certification schedule. This choice is motivated by the fact that almost all candidates with exceptions re-certify their exceptions.
3.4 The graft offering module
The input of the graft offering module is an ordered match list, which consists of patient- and/or center-driven offers. For this match list, the module either returns the match record of the candidate who accepts the graft offer, or indicates that all eligible candidates have rejected the offer. In case all eligible candidates have rejected the graft offer, the ELAS simulator can either (a) force placement of the graft in the candidate who was most likely to accept the graft offer, or (b) record a discard. The graft offering process itself is mimicked by (i) offering grafts to patients/centers in order of their appearance on the match list, and (ii) treating organ offer acceptance as a Bernoulli process, with graft offer acceptance probabilities modelled with logistic regressions based on donor and patient characteristics (as in the SAM software, see [32]). The graft offering module also includes a logistic model to predict whether a liver graft is split by the transplantation center after acceptance based on donor and patient characteristics. Such split procedures allow centers to transplant two candidates with one liver, typically one child and one adult.
There are several reasons why a candidate may not be offered a liver in ELAS allocation, despite being ranked high enough for an offer. These reasons include that:
-
1.
Centers frequently decline the graft for all candidates who appear on the match list, even when making patient-driven offers (for instance, because of poor donor quality, or capacity constraints). A patient may thus not receive a patient-driven offer in case the center has already rejected the graft.
-
2.
Offers are not made to candidates whose allocation profile indicates that the patient does not want to be considered for the offer (for instance, because the donor is too old).
-
3.
Center-driven offers are not directly offered to listed candidates. Instead, the center chooses a candidate for transplantation.
-
4.
ET can deviate from the standard allocation procedure in case allocation time is limited. Candidates not located in the vicinity of the graft can then be skipped.
These reasons motivated us to
-
1.
Implement a two-stage patient-driven offer acceptance procedure. In the first stage, a center-level logistic model is used to predict based on donor characteristics alone whether the center is willing to accept the graft. Provided that the center is willing to accept the graft, a patient-level logistic model is used to predict graft offer acceptance based on patient and donor characteristics.
-
2.
Skip offers of liver grafts to elective candidates whose allocation profiles indicate they do not want to be offered the liver graft.
-
3.
Estimate logistic regressions separately for center- and patient-driven offers.
-
4.
Approximate deviation from standard allocation (see Appendix D for details).
The graft offer acceptance behavior of certain patient groups may be poorly described by a logistic model that is fitted on all historic offer acceptance decisions. For instance, Wood et al. [33] describe that the graft offer acceptance module of LSAM poorly predicted offer acceptance behavior for pediatric candidates. This has motivated us to estimate logistic regressions separately for (i) pediatric candidates with HU/ACO statuses, (ii) elective pediatric patients, (iii) adult candidates with HU/ACO statuses, and (iv) elective adult candidates.
To enable end users to change how graft offer acceptance decisions are made, the odds ratios necessary for calculating graft offer acceptance probabilities are kept in csv files external to the program. Default odds ratios supplied with the ELAS simulator were estimated based on offers of whole liver grafts offered between 01-01-2012 and 31-12-2019. When estimating these odds ratios, we ignored offers automatically rejected based on a candidate’s allocation profile and offers accepted in rescue / extended allocation. To account for correlations in organ acceptance behavior, odds ratios were estimated with mixed effect models with random effects for donor heterogeneity (as in [34]), patient heterogeneity, and center heterogeneity.
3.5 The post-transplant module
Over 10% of ET liver waitlist registrations are candidates who register for a repeat liver transplantation. To accurately simulate such re-listings, a post-transplant module was implemented for the ELAS simulator. At transplantation, this post-transplant module first generates a time-to-failure , at which the transplanted patient would die unless re-transplanted. This time-to-failure is simulated based on a Weibull model, which accounts for donor and patient characteristics. From this time-to-failure, we find a time-to-re-listing based on the empirical distribution of re-listing times relative to the time-to-failures .
In case the candidate is simulated to list for a repeat transplantation within the simulation period, the post-transplant module constructs a synthetic re-listing. Such synthetic re-listings are generated by combining the fixed patient characteristics of the transplant recipient with the status updates from a candidate who was actually re-listed for transplantation. This re-listing is chosen such that (a) candidates have similar time-to-failure and similar time-to-re-listing , and (b) candidates are similar in terms of pre-determined characteristics (for instance, both candidates are pediatric). One important matching characteristic is whether the candidate re-lists within 14 days after transplantation (); this is motivated by the fact that many candidates who experience graft failure within 14 days of transplantation are eligible for an HU status per ET allocation rules. More details on how post-transplant survival and re-listings are simulated is included in Appendix E.
The parameters required for simulation of post-transplant survival are the shape and scale parameters for Weibull models, and the empirical distribution of (time-to-relisting) relative to (time-to-failure). The parameters supplied with ELAS simulator have been estimated on ET liver transplantations between 01-01-2012 and 31-12-2019. Since we expected post-transplant survival and re-listing to be different for elective candidates and HU/ACO candidates, we estimated Weibull parameters and curves separately for these groups.
4 Verification and validation of the ELAS simulator
We have described the design and the modules of the ELAS simulator in Sections 2 and 3. In this section, we describe our efforts to ensure that the ELAS simulator adequately represents ELAS. For this, we distinguish between model verification, which are efforts taken to identify coding errors in the software, and model validation, which are efforts to assess whether simulated outcomes closely approximate actual outcomes of ET liver allocation (see [35] for a discussion of model verification / validation).
4.1 Verification of the ELAS simulator
To implement liver allocation rules in the ELAS simulator, we have used the 2016 functional specifications for ELAS. To verify the correctness of our implementation of ELAS allocation rules, we exported ELAS match lists for 500 randomly selected donors who were reported between 01-01-2016 and 31-12-2019. We constructed unit tests to ascertain that the ELAS simulator returned match codes for these lists correctly based on graft and candidate information. We also constructed unit tests to ascertain that the ELAS simulator returns the candidates in the exact same order as the exported match lists.
To ensure the correctness of the exception module, we exported (N)SE exception score definitions directly from the ET database. For the obligation system module, we used functional specifications of the ELAS obligation system to guide our implementation. These functional specifications contain examples of how obligations have to be linked (including how to date obligations created from multiple linkable obligations). We implemented these examples as unit tests for the ELAS simulator.
4.2 Validation of the ELAS simulator
Discrete event simulators for organ allocation are typically validated by comparing simulated statistics over a simulation window to real statistics over the same time period [8, 30]. Examples of validated properties include the number of transplantations and the number of waitlist deaths over the simulation window. Such statistics are typically also presented stratified by patient groups. We follow this practice to validate the ELAS simulator.
In comparing simulated statistics to real statistics, we do not use traditional hypothesis testing (or confidence intervals), because “traditional hypothesis testing is not appropriate for measuring model validity because the null hypothesis that the true system and model are identical is almost always false” [30]. In fact, any difference between actually observed outcomes and simulations can be made statistically significant by increasing the number of simulation runs. Instead, we give insight into the variability of ELAS simulator outputs by reporting 95% interquantile ranges (95%-IQRs) for simulation runs. These interquantile ranges are obtained by simulating liver allocation 200 times and reporting the 2.5th and 97.5th percentiles. When the real summary statistic for a property of interest falls within the interquantile range, we say that the ELAS simulator is “well-calibrated” for this property.
For validation of the simulator, we simulate ET liver allocation 200 times between 01-01-2016 and 31-12-2019. We allocate all donors with livers transplanted through ELAS in this simulation period, and include all candidates who had an active waitlist status (HU / T) within this period. We exclude candidates transplanted with a living donor (because ELAS is only used to allocate deceased donor livers), and candidates whose country of listing changes (29 listings in total). For simulation, we use actual donor arrival times and actual candidate status histories, which were completed with the future status imputation procedure described in Appendix C. For each of the 200 simulation runs, a different file with candidate status updates is used. These files differ in the counterfactual status updates that were imputed for each candidate. Summary statistics over the 200 simulation runs are compared to real summary statistics in Table 2 and Table 3.
Table 2 shows the validation results with respect to waitlist outcomes. For each property of interest (first column), Table 2 shows the average and 95%-interquantile range over 200 simulations (second column) and the real summary statistic (third column). Table 2 shows that the ELAS simulator is well-calibrated for the number of transplantations, the number of split livers, and the number of transplantations with a split graft. The simulator is also well-calibrated for the number of listings, the number of listings for a repeat transplantation, the number of waitlist removals, and the number of waitlist deaths, but the final waitlist size is on average 4.5% larger in simulations than in reality. The ELAS simulator is also well-calibrated to the number of waitlist deaths per country, except for in Germany where the number of waitlist deaths is underestimated on average by 52 (-8.1%) transplantations. Inspecting waitlist deaths by lab-MELD shows that the ELAS simulator underestimates the number of waitlist deaths in candidates with the highest MELD scores (-8.1% for MELD 31-40) and HU/ACO candidates (-27.2%), while the simulator overestimates the number of waitlist deaths in candidates with low MELD scores (+11.8% for MELD 6-10).
Table 3 shows validation results relating to transplantations. The ELAS simulator is well-calibrated for most summary statistics, including the number of transplantations placed through each allocation mechanism, and the number of transplantations by candidate age and sex. Regarding the number of transplantations per country, 55 () too many transplantations are simulated on average in Belgium, while on average 35 (-5.6%) and 15 (-3.0%) too few transplantations are simulated in Austria and Croatia, respectively. Regarding placements by type of exception received, we find that the ELAS simulator is well-calibrated for the number of transplantations in non-exception candidates and in candidates with SEs other than HCC. The number of transplantations in candidates with HCC is overestimated by on average by 40 (+3.5%), and the number of transplantations in candidates with NSEs is underestimated by 27 (-9.5%). Regarding transplantations by match- and lab-MELD score, we find that the ELAS simulator results in too few transplantations in candidates with low MELD scores (MELD: 6-10) and too many transplantations in candidates with high MELD scores (MELD: 21-30 and 31-40).
| Category | Simulated Results (average and 95%-IQR) | Actual data (2016-2019) |
| Deceased-donor livers | ||
| Total transplantations | 6,415 [6,398-6,432] | 6,418 |
| Number of livers splitted | 173 [156-192] | 181 |
| Split transplantations | 346 [311-383] | 354 |
| Waitlist | ||
| Patient listings | 12,086 [12,034-12,141] | 12,110 |
| Relisting (synthetic) | 650 [598-705] | 652 |
| Final active waitlist | 1,528 [1,485-1,571] | 1,462 |
| Removals (excl. recoveries) | 860 [831-1,888] | 857 |
| Deaths | 1,636 [1,582-1,690] | 1,686 |
| Waitlist mortality by country | ||
| Austria | 85 [72-100] | 82 |
| Belgium | 169 [148-190] | 165 |
| Croatia | 109 [97-121] | 98 |
| Germany | 1,096 [1,051-1,140] | 1,148 |
| Hungary | 62 [52-72] | 72 |
| Netherlands | 93 [79-107] | 101 |
| Slovenia | 22 [17-29] | 20 |
| Waitlist mortality by lab-MELD | ||
| Lab-MELD 6-10 deaths | 123 [113-134] | 110 |
| Lab-MELD 11-20 deaths | 498 [473-524] | 482 |
| Lab-MELD 21-30 deaths | 387 [361-413] | 379 |
| Lab-MELD 31-40 deaths | 505 [467-542] | 546 |
| HU/ACO deaths | 123 [103-142] | 169 |
| Category | Simulated Results (average and 95%-IQR) | Actual data (2016-2019) |
| Transplantations by allocation mechanism | ||
| HU/ACO (regular) | 942 [905-979] | 931 |
| Obligation (MELD-based) | 325 [302-354] | 290 |
| MELD-based | 3,850 [3,636-4,052] | 4,005 |
| Extended / rescue | 1,298 [1,099-1,503] | 1,192 |
| Transplant recipients | ||
| Female | 2,142 [2,107-2,186] | 2,140 |
| Male | 4,273 [4,227-4,310] | 4,278 |
| Pediatric recipient | 418 [396-439] | 424 |
| Match geography | ||
| Local/Regional | 2,506 [2,398-2,600] | 2,523 |
| National | 2,664 [2,543-2,779] | 2,647 |
| Abroad | 1,245 [1,183-1,300] | 1,248 |
| Austria | 585 [561-605] | 620 |
| Belgium | 1,122 [1,098-1,142] | 1,067 |
| Croatia | 481 [466-493] | 496 |
| Germany | 3,178 [3,148-3,208] | 3,166 |
| Hungary | 297 [284-312] | 312 |
| Netherlands | 656 [626-681] | 656 |
| Slovenia | 96 [88-103] | 101 |
| Transplantations by patient type (adult non-HU/ACO only) | ||
| Lab-MELD only | 3,250 [3,195-3,299] | 3,289 |
| Patient with HCC | 1,190 [1,158-1,221] | 1,150 |
| Patient with NSE | 259 [239-275] | 286 |
| Patient with other SE | 558 [533-579] | 547 |
| Transplantations by match-MELD (adult non-HU/ACO only) | ||
| Match-MELD 6-10 | 434 [400-476] | 493 |
| Match-MELD 11-20 | 1,389 [1,294-1,487] | 1,466 |
| Match-MELD 21-30 | 2,482 [2,386-2,574] | 2,285 |
| Match-MELD 31-40 | 952 [899-1,000] | 1,025 |
| Unknown | - | 3 |
| Transplantations by lab-MELD (adult non-HU/ACO only) | ||
| Lab-MELD 6-10 | 1,292 [1,254-1,337] | 1,373 |
| Lab-MELD 11-20 | 2,144 [2,058-2,226] | 2,181 |
| Lab-MELD 21-30 | 1,044 [993-1,093] | 942 |
| Lab-MELD 31-40 | 778 [731-828] | 769 |
| Unknown | - | 7 |
Post-transplant outcomes
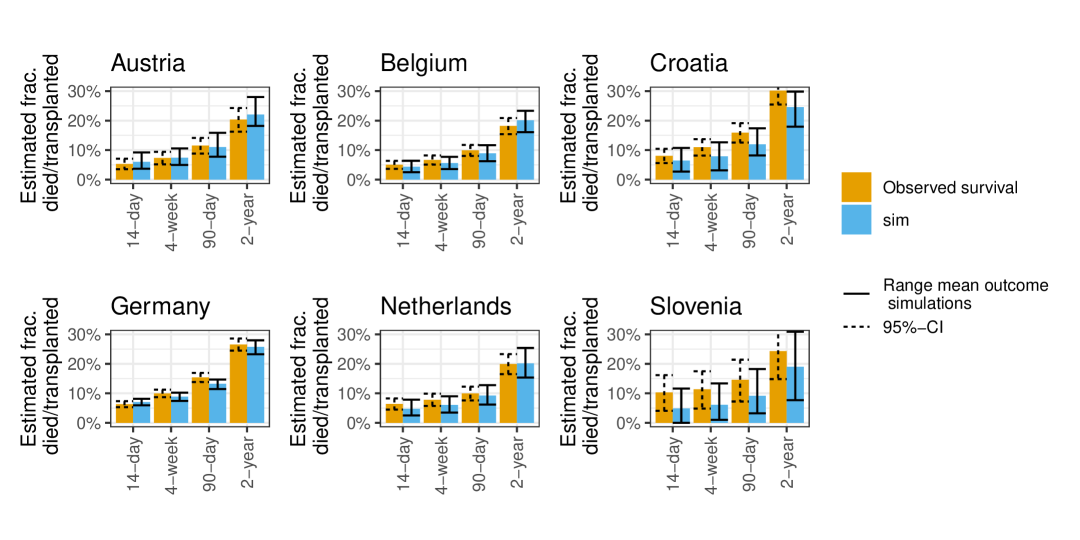
Figure 2 compares the simulated post-transplant event rates with real post-transplant event rates, estimated per country at several time horizons. For both, -day post-transplant survival probabilities are estimated with Kaplan-Meier. Simulated event rates are close to real event rates in all Eurotransplant regions. Only in Croatia and Slovenia, simulated post-transplant event rates appear to be slightly biased downwards. Supplementary Figure A1 shows that estimated relisting probabilities are also comparable to observed relisting probabilities.
Discussion
The ELAS simulator appears to be well-calibrated for most but not all waitlist and transplantation patterns within ET. One important property of interest for which the simulator is not well-calibrated is the number of transplantations and waitlist exits per lab- and match-MELD score: for candidates with high urgency (MELD 31-40 or HU/ACO status), the number of transplantations is overestimated and the number of waitlist deaths is underestimated (see Tables 2 and 3). A potential explanation for this finding is that the ELAS simulator assumes that a candidate who accepts a graft offer is transplanted. In reality, however, transplantation centers can still cancel a transplantation procedure after a graft offer has been accepted, for instance if the transplantation candidate has become unstable. In case of such a cancellation, the Eurotransplant allocation desk re-offers the graft to candidates who are located in vicinity of the graft. If re-offering takes place via rescue allocation, this generally results in placement of the graft in a candidate with much lower urgency, which may explain why the simulator underestimates placements in low-MELD candidates (6-10) 3), who also more waitlist deaths in simulations than in reality (see Tables 2).
A second property on which the simulator is not well-calibrated is the number of transplantations per country. For instance, in Belgium there are on average 55 (+4%) more transplantations in simulations than in reality. An explanation for this may be that the ELAS simulator does not implement competitive rescue allocation, through which approximately 10-15 grafts are transferred per year from Belgium to Germany. The fact that too many grafts are transplanted in Belgium may also explain why the number of transplantations in candidates with HCC is overestimated, as Belgium has the highest share of candidates listed with HCC.
We thus have two potential explanations for miscalibration of the ELAS simulator, which are (i) the simulator does not implement competitive rescue allocation, and (ii) the simulator does not allow planned transplantation procedures to be cancelled after an initial acceptance. We have chosen not to implement these two mechanisms in the ELAS simulator, because they are not directly relevant to most ELAS allocation policies and occur relatively rarely. All by all, we believe that the simulated and observed waitlist outcomes are sufficiently close to make the ELAS simulator useful for policy evaluation. We illustrate this with two case studies in Section 5.
5 Case studies: the impact of modifying ELAS allocation rules
We illustrate how the ELAS simulator can be used for policy evaluation with two case studies. For the first case study, we collaborated with representatives from the Belgian Liver and Intestine Advisory committee (BeLIAC) to study the impact of changes to the Belgian exception score system (see Section 5.1). In the second case study, we study the impact of basing ET liver allocation on ReMELD-Na scores instead of UNOS-MELD scores, which was a topic on the agenda of ELIAC in 2023 (see Section 5.2).
For all alternative policies, we simulate ET liver allocation 50 times between 01-01-2016 and 31-12-2019. We compare outcomes simulated under modified ELAS rules, to outcomes simulated under current ELAS rules. We test whether modified policies lead to significantly different outcomes with traditional hypothesis testing. To increase the power of these tests, we use common random number generators to eliminate the variance attributable to factors which we assume to be independent from the allocation policy (see [36, p.588] for more information on this variance reduction technique). Specifically, we use common random numbers to synchronize the splitting of liver grafts, the graft offer acceptance behavior of candidates, and the triggering of rescue allocation across policies for each of the 50 iterations. By synchronizing these processes, we can compare the alternative policies to the current policy with pairwise t-tests.
5.1 Case study 1: the exception score system in Belgium
Belgium is the ET member country where relatively most candidates are awarded exceptions, with nearly half of candidates listed in Belgium receiving a standard or non-standard exception (SE/NSE) during listing. As discussed in Section 3.3, candidates who receive exceptions obtain MELD-(N)SE scores which increase every 90 days until a maximum score of 40 is reached. There are concerns that these 90-day increments have increased the match-MELD score candidates need in Belgium to receive graft offers. Thereby, candidates without exception points - who solely have access to transplantation based on their laboratory MELD scores - may be crowded out of transplantation.
To address this, the BeLIAC has considered imposing a cap on (N)SE-MELDs of 30, which corresponds to maximizing the awardable 90-day mortality equivalent to 50%. In joint discussions, the BeLIAC also expressed an interest in capping (N)SE-MELDs by 25, as well as alternative policy options. These alternatives were slowing down (N)SE-MELDs by reducing the 90-day increments (referred to as “slower” policies), and lowering the initial mortality equivalents awarded for (N)SEs (referred to as “lowered” policies). An overview of the policy options discussed with BeLIAC is shown in Table 4.
We use the ELAS simulator to map the impact of these policies, and combinations of these policies. In this analysis, we focus on livers from Donation after Brain Death (DBD) donors, because livers from DCD donors are center offers in Belgium.
| Policy option | Initial equivalent | 90-day increment | Maximum mortality equivalent |
| CurrentELAS | 10% (MELD 20) for most (N)SEs, 15% (MELD 22) for HCC | 10% (2-4 MELD points) | 100% |
| Capped (25) | - | - | 25%a (MELD 25) |
| Capped (30) | - | - | 50%a (MELD 30) |
| Slower | - | 5% (1-2 MELD points) | - |
| Slowest | - | 2.5% (1 MELD point) | - |
| Lowered | Lowered to 8% (MELD 18) for existing (N)SEs with initial equivalents <20% | - | - |
a Set to the initial equivalent if the initial equivalent exceeds the proposed cap.
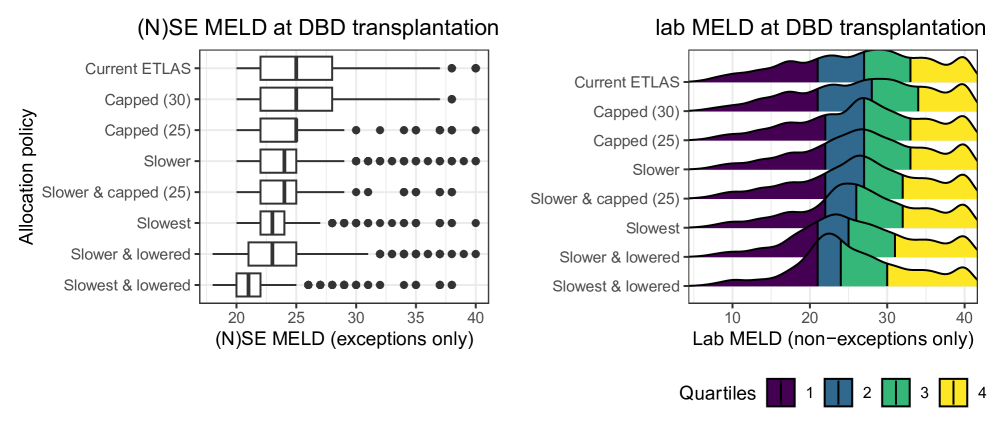
Figure 3 shows distributions of the simulated (N)SE-MELD scores at transplantation for exception candidates (left), and laboratory MELD scores at transplantation for non-exception candidates (right). From the left-hand side, it can be seen that capping (N)SE-MELDs at 30 barely affects the distribution of (N)SE-MELDs at transplantation. Other policies reduce the median (N)SE-MELD at transplantation by up to 4 MELD points. When focusing on non-exception candidates (right-hand side of Figure 3), we see that the lab-MELD scores at DBD transplantation for non-exception candidates also change when (N)SEs are capped. In fact, with slower and lowered policies, the median lab-MELD at DBD transplantation becomes up to 3 MELD points lower. These policies thus increase access to DBD transplantations for candidates with lab-MELD scores between 20 and 23, who face 10-15% 90-day waitlist mortality risks according to ET’s 90-day mortality equivalent.
Table 5 summary statistics over the simulation period, counted separately for exception and non-exception candidates. Comparing the third column (actual 2016-2019 statistics) to the fourth column (averages and 95%-interquantile ranges over 50 simulations) shows that the ELAS simulator is well-calibrated for the number of transplantations, waitlist deaths, and waitlist exits. This re-assures us that the ELAS simulator reasonably describes these allocation patterns. Of policy interest are the remaining columns of Table 5, which show for the (N)SE policy alternatives the average outcome over 50 simulations. Comparing these outcomes to the outcomes simulated under current (N)SE rules shows that almost all policies significantly change the number of transplantations, the number of waitlist deaths, and number of waitlist removals.
For instance, with the combined slowest and lowered policy (final column of Table 5) on average 33 (+8.1%) extra candidates without exception points are transplanted. With this policy, 18 waitlist deaths (-14.2%) could have been prevented over the simulation period, which corresponds to 3-4 waitlist deaths per year. The cost of this policy change is that we see a slight increase in the number of waitlist removals for exception patients, with on average 1-2 extra exception patients per year removed because they became unfit for transplantation, or because they had HCC / cancer.
| Exit reason | Patient type | Current (real) | Current (sim) | Capped (30) | Capped (25) | Slower | Slower & capped (25) | Slowest | Slower & lowered | Slowest & lowered |
| (N)SE | 438 | [] | 451 | 441 | 439 | 438 | 432 | 426 | 415 | |
| Transplanted | None | 387 | [] | 404 | 416 | 414 | 417 | 424 | 431 | 438 |
| (N)SE | 27 | [] | 29 | 28 | 29 | 29 | 29 | 30 | 30 | |
| Waitlist death | None | 119 | [] | 123 | 117 | 118 | 117 | 114 | 112 | 108 |
| (N)SE | 20 | [] | 13 | 14 | 14 | 14 | 14 | 16 | 17 | |
| Removed unfit | None | 23 | [] | 21 | 20 | 20 | 20 | 20 | 20 | 20 |
| (N)SE | 8 | [] | 9 | 9 | 9 | 10 | 10 | 13 | 13 | |
| Removed HCC/Cancer | None | 6 | [] | 6 | 6 | 6 | 6 | 6 | 6 | 6 |
5.2 Application 2: Basing ET liver allocation on ReMELD-Na
Candidates with low serum sodium levels (hyponatremia) face systematically higher waitlist mortality rates than is suggested by their MELD score [9]. To adequately prioritize these hyponatremic candidates, Kim et al. [9] proposed to expand the MELD scoring system with serum sodium, leading to the MELD-Na score. Recently, Goudsmit et al. used Eurotransplant registry data to refit the MELD-Na equation for the Eurotransplant area [37]. This refitting exercise, which consists of using ET data to update the coefficients of biomarkers included in the MELD-Na formula and optimizing caps imposed on the formula’s biomarkers, led to the ReMELD-Na score.
In May 2023, the ELIAC considered basing ET liver allocation on ReMELD-Na instead of UNOS-MELD. A matter of concern for ELIAC was that ReMELD-Na scores range from 1 to 36, whereas UNOS-MELD scores range from 6 to 40. Basing laboratory MELD scores on ReMELD-Na without updating the MELD-curve could therefore mean that non-exception candidates, who depend on lab-MELD for access to transplantation, could only receive match-MELD scores up to 36, whereas candidates with (N)SE or PED-MELD scores could receive match-MELD scores up to 40. A switch to ReMELD-Na could thereby inadvertently give extra priority to candidates with exception points (who may already be overprioritized in the current allocation system, see [1]).
Based on this discussion and concern, we were asked to simulate two scenarios for liver allocation using ReMELD-Na. For both scenarios, lab-MELD scores are based on ReMELD-Na, with scores calculated according to the following formula:
In the first scenario, the exception score system remains unchanged, which means that PED-MELD and (N)SE-MELD scores are calculated based on the UNOS-MELD survival curve. This curve is given by the following formula:
In the second scenario, PED-MELD and (N)SE-MELD scores are instead calculated based on a survival curve developed specifically for ReMELD-Na. We have obtained this curve by fitting a Cox proportional hazards model on ET registry data, with adjustment for ReMELD-Na. The obtained ReMELD-Na curve is given by the following formula:
Simulation results for these scenarios are shown in Table 6. Columns show the average number of waitlist exits with 95%-IQRs over 50 simulations under the current UNOS-MELD-based liver allocation (second column, UNOS-MELD), the first scenario (third column), and second scenario (fourth column). The third column shows that introducing ReMELD-Na without updating the S-curve results in approximately 70 extra waitlist deaths in total (), which corresponds to 15-20 extra waitlist deaths per year. This finding is likely explained by ELIAC’s concern that a switch to ReMELD-Na inadvertently de-prioritizes candidates who depend on lab-MELD scores for access to transplantation. The fourth column shows that switching to ReMELD-Na with the updated S-curve could have averted 25 waitlist deaths in total ().
| Exit status | UNOS-MELD (current) | ReMELD-Na (old S-curve) | ReMELD-Na (updated S-curve) |
| Waitlist deaths | 1633.4 [1581.2-1685.6] | 1703.3*** [1643.2-1763.3] | 1608.3*** [1546.9-1669.7] |
| Transplantations | 6414.5 [6400.1-6428.9] | 6417.7* [6401.6-6433.7] | 6410.3*** [6396.7-6423.8] |
| Removed | 859.9 [834.8-885] | 837.9*** [812.9-862.8] | 870.4*** [842.7-898.1] |
An important limitation of this analysis is that serum sodium measurements are not available for all candidates in ET registry data. When serum sodium was missing in simulations, we calculated ReMELD-Na scores with a serum sodium level of 138.6 mmol/l (which yields 0 points awarded for the candidate’s serum sodium level). As this means that hyponatremia could not be prioritized in all candidates, the reduction of on average 25 waitlist deaths is a conservative projection.
Whether serum sodium is reported to Eurotransplant depends foremostly on the candidate’s center of listing, with centers either never or almost always reporting serum sodium. This has motivated us to also assess the number of total waitlist deaths, stratified by the center of listing’s track record of reporting serum sodium. For this, we categorize centers into centers with high, medium and low serum sodium completeness (high: serum sodium known for of candidates, medium: serum sodium known for 50% of candidates, low: otherwise). Table7 shows the total number of waitlist deaths per type of center. It can be seen that the reduction in waitlist deaths is indeed concentrated in centers with high serum sodium completeness (28 fewer waitlist deaths on average). Under the (optimistic) assumption that this reduction in waitlist deaths is representative for all centers in ET, using ReMELD-Na as the basis for liver allocation could have prevented up to 80 waitlist deaths over the simulation period.
| Serum sodium completeness | Center count | Patient count | Waitlist deaths under UNOS-MELD | Waitlist deaths under ReMELDna |
| Low | 10 | 4775 | 590.3 [551.3-629.3] | 593.8 [555.3-632.4] |
| Medium | 13 | 3098 | 446.9 [404-489.7] | 446.9 [402.1-491.7] |
| High | 14 | 3995 | 589.3 [554.8-623.9] | 561*** [518.6-603.4] |
6 Conclusions and discussion
The Eurotransplant Liver Allocation System (ELAS) has changed little since it was introduced in December 2006, despite the fact that several potential areas of improvement have been identified. This lack of development in liver allocation policies stands in contrast to other organ allocation regions. For instance, in the United Kingdom the NHS has replaced MELD-based liver allocation in 2018 by a benefits-based allocation scheme [38], and liver allocation in the United States was based on MELD-Na in 2016 and switched to MELD 3.0 in 2023 [10]. One major explanation for the lack of policy development within ET is that new allocation policies have to be mutually agreed upon by all member countries. Aligning the interests and perspectives of these member countries is challenging, because the countries’ widely varying organ donation rates means that they face different challenges in liver allocation.
To help align interests and perspectives of the ET member countries, Eurotransplant needs a tool which can simulate the impact of proposed policy changes, as well as their unintended consequences. While such tools are already routinely used for organ allocation policy development in other geographic regions, the ELAS simulator is the first simulator tailored to the unique challenges of Eurotransplant as a multi-national organ exchange organization. To build trust in the ELAS simulator as a policy evaluation tool, we have extensively validated the ELAS simulator. All in all, the ELAS simulator is able to closely replicate most patterns in ET liver allocation. We believe the remaining differences are sufficiently small for the ELAS simulator to be useful for policy evaluation.
We have illustrated how the ELAS simulator is already being used for policy evaluation with two case studies. In the first case study, we collaborated with the Belgian Liver and Intestine Advisory Committee (BeLIAC) to assess how the Belgian exception system can be revised to avoid that candidates who are ineligible for exception points are crowded out of transplantation. A follow-up question from BeLIAC was whether it would be possible to only curb MELD-SE scores for candidates with hepatocellular carcinoma (HCC), who represent 70% of the candidates receiving (N)SEs. This topic is currently pending discussion in BeLIAC. For the second case study, we have evaluated the impact of basing ET liver allocation on ReMELD-Na scores instead of UNOS-MELD scores. Simulations for this case study suggested that a switch to ReMELD-Na can indeed reduce waitlist mortality, but only if the exception scores are appropriately re-scaled. Based on these results, the ELIAC has recommended the ET board to implement ReMELD-Na with re-scaled exception points, and this proposal is currently pending approval by the national competent authorities of several ET member countries.
The ELAS simulator is thus useful for policy evaluation, but it also has limitations. A first limitation is that our simulations were driven by ET registry data, and not all information relevant for liver allocation has been registered prospectively by this registry. For example, in the second case study we have seen that serum sodium is not available in ET registry data for many candidates, which complicates simulating the impact of allocation principles which are based on serum sodium. This limitation could be addressed by prospective data collection by the ET registry of factors relevant to allocation. Secondly, statistical models for graft offer acceptance and post-transplant outcomes were calibrated to historical data. New developments in liver transplantation threaten the external validity of these models. An example of such a development is machine perfusion, which is enhancing outcomes after liver transplantation [39] and is changing decision-making related to graft offer acceptance. This limitation can potentially be addressed by re-calibrating statistical models on contemporary data.
From a policy point of view, there remain several areas in which ET’s liver allocation system may be improved. These areas include taking post-transplant outcomes into account when allocating livers [38], broader geographic sharing of livers for candidates with very high MELD scores [40, 41], and rectifying sex disparity in liver waitlist outcomes [4]. The ELAS simulator will continue to play a role in informing the ELIAC of the impact of policy changes related to these topics.
Acknowledgements
We are grateful to prof. Xavier Verhelst, prof. Géraldine Dahlqvist, and prof. Frederik Nevens for their advice for the BeLIAC case study. We thank members of the ELIAC for the idea to conduct the ReMELD-Na case study. We thank dr. Marko Boon for providing feedback on this manuscript.
References
- [1] Umgelter A, Hapfelmeier A, Kopp W, et al. Disparities in Eurotransplant liver transplantation wait-list outcome between patients with and without model for end-stage liver disease exceptions. Liver Transplantation 2017; 23(10): 1256–1265. doi: 10.1002/lt.24805
- [2] Kamath PS, Wiesner RH, Malinchoc M, et al. A model to predict survival in patients with end-stage liver disease. Hepatology 2001; 33(2): 464–470. doi: 10.1053/jhep.2001.22172
- [3] Moylan CA, Brady CW, Johnson JL, Smith AD, Tuttle-Newhall JE, Muir AJ. Disparities in liver transplantation before and after introduction of the MELD score. JAMA 2008; 300(20): 2371–2378. doi: 10.1001/jama.2008.720
- [4] de Ferrante HC, de Rosner-van Rosmalen M, Smeulders BML, Vogelaar S, Spieksma FCR. Sex disparity in liver allocation within Eurotransplant. American Journal of Transplantation 2024; 0(0). doi: 10.1016/j.ajt.2024.06.018
- [5] Pritsker AAB, Kuhl ME, Roberts JP, et al. Organ transplantation policy evaluation. In: WSC ’95. ; 1995: 1314–1323.
- [6] Wujciak T, Opelz G. A proposal for improved cadaver kidney allocation. Transplantation 1993; 56(6): 1513–1517. doi: 10.1097/00007890-199312000-00044
- [7] De Meester J, Persijn GG, Wujciak T, Opelz G, Vanrenterghem Y. The new Eurotransplant Kidney Allocation System: report one year after implementation. Eurotransplant International Foundation. Transplantation 1998; 66(9): 1154–1159. doi: 10.1097/00007890-199811150-00007
- [8] Thompson D, Waisanen L, Wolfe R, Merion RM, McCullough K, Rodgers A. Simulating the Allocation of Organs for Transplantation. Health Care Management Science 2004; 7(4): 331–338. doi: 10.1007/s10729-004-7541-3
- [9] Kim WR, Biggins SW, Kremers WK, et al. Hyponatremia and mortality among patients on the liver-transplant waiting list. The New England Journal of Medicine 2008; 359(10): 1018–1026. doi: 10.1056/NEJMoa0801209
- [10] Kim WR, Mannalithara A, Heimbach JK, et al. MELD 3.0: The Model for End-Stage Liver Disease Updated for the Modern Era. Gastroenterology 2021; 161(6): 1887–1895.e4. doi: 10.1053/j.gastro.2021.08.050
- [11] Freeman RB, Wiesner RH, Roberts JP, McDiarmid S, Dykstra DM, Merion RM. Improving liver allocation: MELD and PELD. American Journal of Transplantation 2004; 4: 114–131. doi: 10.1111/j.1600-6135.2004.00403.x
- [12] Axelrod DA, Gheorghian A, Schnitzler MA, et al. The Economic Implications of Broader Sharing of Liver Allografts. American Journal of Transplantation 2011; 11(4): 798–807. doi: 10.1111/j.1600-6143.2011.03443.x
- [13] Gentry SE, Massie AB, Cheek SW, et al. Addressing Geographic Disparities in Liver Transplantation Through Redistricting. American Journal of Transplantation 2013; 13(8): 2052–2058. doi: 10.1111/ajt.12301
- [14] Goel A, Kim WR, Pyke J, et al. Liver Simulated Allocation Modeling: Were the Predictions Accurate for Share 35?. Transplantation 2018; 102(5): 769–774. doi: 10.1097/TP.0000000000002079
- [15] Akshat S, Gentry SE, Raghavan S. Heterogeneous donor circles for fair liver transplant allocation. Health Care Management Science 2024; 27(1): 20–45. doi: 10.1007/s10729-022-09602-7
- [16] Perito ER, Mogul DB, VanDerwerken D, et al. The impact of increased allocation priority for children awaiting liver transplant: A Liver Simulated Allocation Model (LSAM) analysis. Journal of Pediatric Gastroenterology and Nutrition 2019; 68(4): 472–479. doi: 10.1097/MPG.0000000000002287
- [17] Heimbach JK, Hirose R, Stock PG, et al. Delayed hepatocellular carcinoma model for end-stage liver disease exception score improves disparity in access to liver transplant in the United States. Hepatology (Baltimore, Md.) 2015; 61(5): 1643–1650. doi: 10.1002/hep.27704
- [18] Bernards S, Lee E, Leung N, et al. Awarding additional MELD points to the shortest waitlist candidates improves sex disparity in access to liver transplant in the United States. American Journal of Transplantation: Official Journal of the American Society of Transplantation and the American Society of Transplant Surgeons 2022; 22(12): 2912–2920. doi: 10.1111/ajt.17159
- [19] Jacquelinet C, Audry B, Golbreich C, et al. Changing Kidney Allocation Policy in France: the Value of Simulation. AMIA Annual Symposium Proceedings 2006; 2006: 374–378.
- [20] Bayer F, Audry B, Antoine C, et al. Removing administrative boundaries using a gravity model for a national liver allocation system. American Journal of Transplantation 2021; 21(3): 1080–1091. doi: 10.1111/ajt.16214
- [21] Watson CJE, Johnson RJ, Mumford L. Overview of the Evolution of the UK Kidney Allocation Schemes. Current Transplantation Reports 2020; 7(2): 140–144. doi: 10.1007/s40472-020-00270-6
- [22] de Klerk M, Kal-van Gestel JA, van de Wetering J, et al. Creating Options for Difficult-to-match Kidney Transplant Candidates. Transplantation 2021; 105(1): 240–248. doi: 10.1097/TP.0000000000003203
- [23] Shoaib M, Prabhakar U, Mahlawat S, Ramamohan V. A discrete-event simulation model of the kidney transplantation system in Rajasthan, India. Health Systems 2022; 11(1): 30–47. doi: 10.1080/20476965.2020.1848355
- [24] Bertsimas D, Papalexopoulos T, Trichakis N, Wang Y, Hirose R, Vagefi PA. Balancing Efficiency and Fairness in Liver Transplant Access: Tradeoff Curves for the Assessment of Organ Distribution Policies. Transplantation 2020; 104(5): 981–987. doi: 10.1097/TP.0000000000003017
- [25] Papalexopoulos T, Alcorn J, Bertsimas D, Goff R, Stewart D, Trichakis N. Reshaping National Organ Allocation Policy. Operations Research 2024; 72(4): 1475–1486. doi: 10.1287/opre.2022.0035
- [26] Mankowski MA, Wood NL, Segev DL, Gentry SE. Removing geographic boundaries from liver allocation: A method for designing continuous distribution scores. Clinical Transplantation 2023; 37(9): e15017. doi: https://doi.org/10.1111/ctr.15017
- [27] Eurotransplant International Foundation . Deceased donors used, per million population, by year, by donor country. Tech. Rep. 1031P., Eurotransplant International Foundation; 2024.
- [28] Jochmans I, van Rosmalen M, Pirenne J, Samuel U. Adult Liver Allocation in Eurotransplant. Transplantation 2017; 101(7): 1542–1550. doi: 10.1097/TP.0000000000001631
- [29] Eurotransplant International Foundation . Eurotransplant Manual - ET Liver Allocation System (ELAS). 2021.
- [30] Shechter SM, Bryce CL, Alagoz O, et al. A Clinically Based Discrete-Event Simulation of End-Stage Liver Disease and the Organ Allocation Process. Medical Decision Making 2005; 25(2): 199–209. doi: 10.1177/0272989X04268956
- [31] Ratcliffe J, Young T, Buxton M, et al. A simulation modelling approach to evaluating alternative policies for the management of the waiting list for liver transplantation. Health Care Management Science 2001; 4(2): 117–124. doi: 10.1023/a:1011405610919
- [32] Scientific Registry of Transplant Recipients . Liver Simulation Allocation Model - User’s Guide. 2019.
- [33] Wood NL, Mogul DB, Perito ER, et al. Liver simulated allocation model does not effectively predict organ offer decisions for pediatric liver transplant candidates. American Journal of Transplantation 2021; 21(9): 3157–3162. doi: 10.1111/ajt.16621
- [34] Agarwal N, Ashlagi I, Rees MA, Somaini P, Waldinger D. Equilibrium Allocations Under Alternative Waitlist Designs: Evidence From Deceased Donor Kidneys. Econometrica 2021; 89(1): 37–76. doi: 10.3982/ECTA17017
- [35] Carson JS. Verification and validation: a consultant’s perspective. In: WSC ’89. ; 1989: 552–558
- [36] Law AM. Simulation modeling and analysis. McGraw-Hill series in industrial engineering and management science. fifth edition ed. 2015.
- [37] Goudsmit BFJ, Putter H, Tushuizen ME, et al. Refitting the Model for End-stage Liver Disease for the Eurotransplant region. Hepatology 2020. doi: 10.1002/hep.31677
- [38] Allen E, Taylor R, Gimson A, Thorburn D. Transplant benefit-based offering of deceased donor livers in the United Kingdom. Journal of Hepatology 2024. doi: 10.1016/j.jhep.2024.03.020
- [39] Terrault NA, Francoz C, Berenguer M, Charlton M, Heimbach J. Liver Transplantation 2023: Status Report, Current and Future Challenges. Clinical Gastroenterology and Hepatology 2023; 21(8): 2150–2166. doi: 10.1016/j.cgh.2023.04.005
- [40] Massie A, Chow E, Wickliffe C, et al. Early Changes in Liver Distribution Following Implementation of Share 35. American Journal of Transplantation 2015; 15(3): 659–667. doi: 10.1111/ajt.13099
- [41] Ravaioli M, Lai Q, Sessa M, et al. Impact of MELD 30-allocation policy on liver transplant outcomes in Italy. Journal of Hepatology 2022; 76(3): 619–627. doi: 10.1016/j.jhep.2021.10.024
Appendix A Supplementary materials
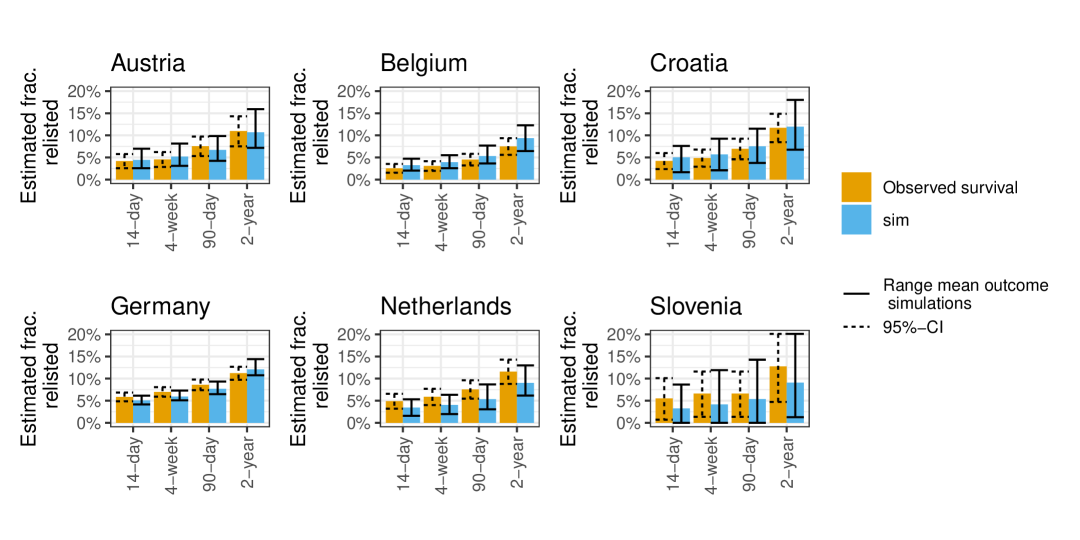
Appendix B Overview of 2016 (N)SE allocation rules in ET
Table LABEL:tab:nse_table gives an overview of the (N)SEs and PED-MELD as used in ELAS. For a few SEs (e.g., primary hyperoxaluria), there awarded initial mortality equivalent may depend on the SE criteria fulfilled by the candidate. For such SEs, the most commonly awarded initial mortality equivalents are shown.
| Exception | Type | NSE ID | Country | Initial equiv. (%) | Upgrade incr. (%) | Upgrade time (days) | Bonus amount (%) | Max age | Next (N)SE |
|---|---|---|---|---|---|---|---|---|---|
| 1 | AU | ||||||||
| 21 | SL | ||||||||
| 81 | DE | ||||||||
| Cholangiocarcinoma | SE | 101 | HR | 10 | 10 | 80 | |||
| 2 | AU | ||||||||
| 22 | SL | ||||||||
| 51 | BE | ||||||||
| 82 | DE | ||||||||
| Cystic fibrosis | SE | 102 | HR | 10 | 10 | 80 | |||
| Familial Amyloidotic Polyneuropathy | SE | 41 | NL | 10 | 10 | 80 | |||
| 3 | AU | ||||||||
| 23 | SL | ||||||||
| 52 | BE | ||||||||
| 83 | DE | ||||||||
| Familial Amyloidotic Polyneuropathy | SE | 103 | HR | 15 | 10 | 80 | |||
| Hepato-pulmonary syndrome | SE | 42 | NL | 10 | 10 | 80 | |||
| 4 | AU | ||||||||
| 24 | SL | ||||||||
| 53 | BE | ||||||||
| 84 | DE | ||||||||
| Hepato-pulmonary syndrome | SE | 104 | HR | 15 | 10 | 80 | |||
| 5 | AU | ||||||||
| 25 | SL | ||||||||
| 43 | NL | ||||||||
| 54 | BE | ||||||||
| 91 | DE | ||||||||
| Porto-pulmonary hypertension | SE | 105 | HR | 25 | 10 | 80 | |||
| 6 | AU | ||||||||
| 26 | SL | ||||||||
| 44 | NL | ||||||||
| 55 | BE | ||||||||
| 85 | DE | ||||||||
| Primary Hyperoxaluria Type 1 | SE | 106 | HR | 10 | 10 | 80 | 2 | ||
| 7 | AU | ||||||||
| 27 | SL | ||||||||
| 45 | NL | ||||||||
| 56 | BE | ||||||||
| 86 | DE | ||||||||
| Polycystic liver disease | SE | 107 | HR | 10 | 10 | 80 | |||
| Hepatocellular Carcinoma | SE | 46 | NL | 10 | 10 | 80 | |||
| 8 | AU | ||||||||
| 28 | SL | ||||||||
| 57 | BE | ||||||||
| 87 | DE | ||||||||
| Hepatocellular Carcinoma | SE | 108 | HR | 15 | 10 | 80 | |||
| 9 | AU | ||||||||
| 29 | SL | ||||||||
| 47 | NL | ||||||||
| 58 | BE | ||||||||
| 88 | DE | ||||||||
| 109 | HR | ||||||||
| Non-metastatic hepatoblastoma | SE | 151 | HU | 50 | 0 | 80 | |||
| 10 | AU | ||||||||
| 30 | SL | ||||||||
| 48 | NL | ||||||||
| 59 | BE | ||||||||
| 89 | DE | ||||||||
| 110 | HR | ||||||||
| Urea cycle disorder/organic acidemia | SE | 152 | HU | 50 | 0 | 80 | |||
| 11 | AU | ||||||||
| 31 | SL | ||||||||
| 49 | NL | ||||||||
| 60 | BE | ||||||||
| 90 | DE | ||||||||
| Persistent hepatic dysfunction | SE | 111 | HR | 20 | |||||
| 114 | NL | ||||||||
| 115 | AU | ||||||||
| 116 | SL | ||||||||
| 117 | BE | ||||||||
| 118 | DE | ||||||||
| Hereditary hemorrhagic teleangiectasia | SE | 119 | HR | 15 | 10 | 80 | |||
| 121 | AU | ||||||||
| 122 | SL | ||||||||
| 123 | BE | ||||||||
| 124 | DE | ||||||||
| 125 | HR | ||||||||
| Hepatic hemangioendothelioma | SE | 126 | NL | 15 | 10 | 80 | |||
| 131 | SL | ||||||||
| Biliary sepsis | SE | 133 | HR | 20 | |||||
| Biliary sepsis | SE | 134 | NL | 30 | |||||
| Biliary sepsis/ Secondary sclerosing cholangitis | SE | 132 | DE | 30 | |||||
| Primary sclerosing cholangitis | SE | 142 | DE | 15 | 10 | 80 | |||
| 141 | SL | ||||||||
| Primary sclerosing cholangitis | SE | 143 | HR | 20 | |||||
| Primary sclerosing cholangitis | SE | 144 | NL | 30 | |||||
| 145 | BE | ||||||||
| 146 | NL | ||||||||
| 147 | HR | ||||||||
| 148 | SL | ||||||||
| 149 | AU | ||||||||
| Biliary atresia | SE | 150 | DE | 60 | 15 | 80 | 1 | ||
| Neuro Endocrine Tumor | SE | 160 | DE | 15 | 10 | 80 | |||
| 172 | BE | ||||||||
| Hepatic artery thrombosis | SE | 174 | NL | 50 | 0 | 80 | |||
| 177 | DE | ||||||||
| 171 | AU | ||||||||
| 173 | HU | ||||||||
| 175 | HR | ||||||||
| Hepatic artery thrombosis | SE | 176 | SL | 100 | 0 | 80 | |||
| 701 | DE | ||||||||
| 702 | AU | ||||||||
| 703 | BE | ||||||||
| 704 | HR | ||||||||
| 705 | HU | ||||||||
| 706 | NL | ||||||||
| PED (12-16 years) | PED | 707 | SL | 15 | 10 | 90 | 16 | ||
| 801 | DE | 701 | |||||||
| 802 | AU | 702 | |||||||
| 803 | BE | 703 | |||||||
| 804 | HR | 704 | |||||||
| 805 | SL | 705 | |||||||
| 806 | HU | 706 | |||||||
| PED (12 years) | PED | 807 | NL | 35 | 15 | 90 | 12 | 707 | |
| 902 | AU | ||||||||
| 904 | HR | ||||||||
| 905 | HU | ||||||||
| 906 | NL | ||||||||
| NSE | NSE | 907 | SL | 10 | 10 | 80 | |||
| NSE | NSE | 903 | BE | 10 | 10 | 90 | |||
| NSE | NSE | 901 | DE | 15 | 10 | 80 |
Appendix C Details to the future status update imputation procedure
myama
Overview of the counterfactual future status imputation procedure
The ELAS Simulator requires a complete stream of status updates for all patient registrations, i.e. all registrations must end with a removal (R) status or a waitlist death (D) status. Input streams for registrations which end with a transplantation (FU) thus have to be completed with synthetic status updates. For LSAM, this problem was addressed by matching transplanted patients to non-transplanted patients on expected mortality \citeAC[p. 34]SRTR2019, and copying over future status updates from a matched candidate. Potential limitations of this approach are that patients were not matched based on other characteristics such as disease groups \citeAC[p. 34]SRTR2019, and that transplantation is a dependent censoring mechanism which results in biased predictions of expected mortality.
To address these limitations, we implemented a procedure for the ELAS simulator which matches transplanted candidates to candidates still at risk based on their expected counterfactual mortality risk and on other characteristics (such as HU status, age, and type of liver disease). In predicting this counterfactual mortality, we correct for dependent censoring by transplantation with inverse probability censoring weighting by modifying a procedure proposed by Tayob and Murray \citeACtayobstatistical2017 to impute future survival times from pre-determined landmark times for lung waitlist transplantation candidates.
Specifically, Tayob and Murray are interested in modelling the 12-month restricted survival time of transplant candidates, where is a random variable for the remaining survival time and is the time horizon of interest (12 months in their case). Tayob and Murray work with regularly spaced landmark times , and define as the -restricted remaining survival time of subject from landmark time . With these, Tayob and Murray aim to model the expected mean survival time directly, i.e. model
A challenge for direct estimation of is that is unobserved for most candidates due to censoring, transplantation represents an informative censoring mechanism, and that the exhibit correlations over the landmark times .
Tayob and Murray propose to multiply impute for all and s, and to estimate with Generalized Estimating Equations (GEE) to account for the correlation between . In summary, Tayob and Murray’s imputation procedure consists of:
-
1.
Estimate the counterfactual waitlist survival function , with correction for informative censoring by transplantation with inverse probability censoring weighting (IPCW). With this curve, they can construct -specific pseudo-observations for .
-
2.
Estimate on pairs with Generalized Estimating Equations (GEE) with an unstructured working correlation matrix. This correlation matrix permits arbitrary correlation between the s over .
-
3.
For each patient with unobserved construct a risk set
-
•
of patients who remain at risk after patient is censored, i.e. with , , where is patient ’s censoring time measured from landmark time ,
-
•
who are similar in terms of predicted expected log survival, i.e. require
for some , where are covariates of patient at ’s censoring time ,
-
•
Optionally, further restrict matches based on , e.g. require matching disease groups.
-
•
-
4.
Within risk set , re-estimate counterfactual survival function . Use inverse transform sampling from to sample a valid
Our aim is to use Tayob and Murray’s procedure to match transplant recipients to comparable, not-yet-transplanted waitlist candidates. This requires two main modifications to the imputation procedure:
-
•
We have to match transplanted patients at any continuous time to comparable, at-risk waitlist candidates (and not only at pre-determined landmark times ). For this, we define to be the -restricted remaining survival time from time forward, with the number of days elapsed since listing. For each observed status update we construct a -specific pseudo-observation , with the time-after-listing at which the status was reported.
-
•
We cannot estimate with GEE with an unstructured correlation matrix, as the is indexed by continuous time . Instead, we propose to estimate with Quasi-Least Squares (QLS) with a Markov correlation structure \citeACxieqls2010. This structure assumes that the correlation between decays with spacing in .
Construction of the risk set for patients with unknown is then similar; we consider patients with , similar , and require matches on characteristics . For each risk set, we can estimate . Inverse transform sampling from is then used to match candidate to a specific candidate . We can then impute patient ’s future status updates by copying over status updates from patient . This procedure is repeated, until all candidates have a set of status updates ending with a waitlist removal (R) or death (D).
This proposed imputation procedure was ran separately for HU and T candidates. Repeatedly running the procedure results in different input status files for ELASS. In the remainder of this appendix, we describe elements of the proposed imputation procedure in detail.
C.1 IPCW survival curve estimate & construction of pseudo-outcomes
Here, we discuss the procedure used to estimate counterfactual survival curves, and how to construct pseudo-outcomes for the log expected survival times.
Propensity score model
We are interested estimation of counterfactual waitlist survival, i.e. the probability that a patient is not yet delisted / has not yet died on the waiting list if transplantation were not available. Problematic is that in reality we are less likely to observe waitlist removals / deaths for patients who deteriorate, as MELD-based liver allocation offers livers first to the most sick patients, making transplantation an informative censoring mechanism. To correct for informative censoring by transplantation, we use a Cox model to predict the probability that a patient is censored over time, and estimate the counterfactual waitlist survival curve weighing observations by the inverse probability of being transplanted.
Adjustment variables included in the Cox model for prediction of the transplant probability are recipient sex, recipient blood group, spline terms of recipient weight and age, recipient disease group, percentage of time NT (total/too bad/too good), the national match MELD, whether the patient is on dialysis, whether the patient has a downmarked MELD and whether the patient has an exception (Y/N).
Figure C2 shows estimated survival functions without (orange) and with (blue) correction for dependent censoring for non-HU patients, stratified by the laboratory MELD score at listing. As expected, estimated 90-day survival probabilities decrease due to inverse probability weighting, with 90-day waitlist survival estimated with IPCW up to 7.4% lower for MELD 25-29 than 90-day waitlist survival estimated without IPCW.
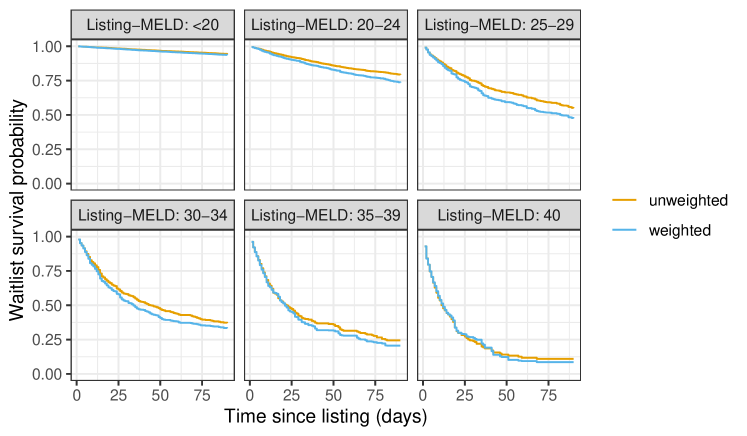
Construction of pseudo-outcomes
As in \citeACtayobstatistical2017, we are interested in directly modeling residual remaining survival time , i.e. modelling
For this, we’d ideally have access to observed times-to-event , i.e. the time-to-event for patient after time (where is a time at which the patient reported a status update). However, censoring and transplantation within time units of prevent us from observing . Tayob and Murray \citeACtayobstatistical2017 described how pseudo-observations for can be constructed, based on estimated counterfactual survival curve . We used this procedure to construct pseudo-observations for . Armed with pairs , we can in principle estimate .
C.2 Modelling the mean restricted survival time with Quasi-Least Squares
With pairs we can model the expected log remaining survival time as
| (1) |
However, in estimation of requires that we deal with correlations in over . Tayob and Murray faced a similar issue, where there is correlation between for the different landmark times , and addressed this by estimating with Generalized Estimating Equations (GEE) with an unstructured correlation matrix correlation over the landmark times (which requires parameters). Unfortunately, this strategy is infeasible to us as potential outcomes are indexed by continuous time , i.e. all observed censoring times. Instead, we assume a Markov correlation structure for the potential outcomes, i.e. we assume that the correlation between measurements and decays with their separation in time:
Parameters and to this model may be estimated with the qlspack R package, with Quasi-Least Squares \citeACShults2014-di, xieqls2010[p.94].
We use different model specifications for HU and non-HU patients for equation 1, with adjustment for natural spline terms for continuous variables. For HU patients, adjustment variables include recipient age at registration, the laboratory MELD score, whether the patient is on biweekly dialysis, recipient sex, and disease group. For non-HU patients, we adjust for age at registration, recipient weight, MELD components (serum creatinine, bilirubin, INR, biweekly dialysis), recipient sex, disease group, cirrhosis aetiology, type of exception score, whether it is a retransplant candidate, and whether the patient has failed to recertify their MELD score.
C.3 Risk set construction
We required to match transplant recipients to not-yet-transplanted waitlist candidates based on expected log 90-day-truncated survival. For both HU patients and non-HU patients, we require to always match on pediatric status. For other discrete variables and continuous variables we use an adaptive matching procedure in which we strive towards 35 candidates in the risk set for HU patients, and 50 candidates for non-HU patients.
Discrete variables used for matching are
-
1.
whether the patient is a retransplant candidate
-
2.
current urgency code (non-transplantable)
-
3.
(N)SE group
-
4.
disease group
-
5.
urgency reason (NT too good / NT other / NT too bad)
-
6.
biweekly dialysis
-
7.
recipient country.
Continuous match variables used are the laboratory MELD score, age at registration, (N)SE MELD score (for elective patients only), where we restrict absolute differences in continuous variables to pre-determined caliper widths. In case matching according to all criteria fails to result in a risk set of sufficient size, we drop a discrete match criterion (from 7 to 1 in the list above). In case dropping all discrete match criteria does not result in adequately sized risk set, we increase caliper widths for continuous variables. In total, about 50% of transplant recipients can be matched to a risk set on all characteristics, and 80% is matchable on the first 4 discrete variables (with most restrictive caliper widths).
Example of a risk set
In Table A2 we show an example of a constructed risk set for a patient who was transplanted, and for whom we thus need to impute future status updates. The first row of Table A2 shows that the transplanted patient is listed in 2014 in Germany at an age of 64 for liver cirrhosis. The patient reported a 33 lab-MELD score 36 days after registration, and was transplanted 6 days later. Based on our model, the expected log residual survival time for this patient is approximately 3.51, which corresponds roughly to 34 days.
Remaining rows of Table A2 show 10 (out of 50) waitlist candidates in patient ’s risk set . These patients remain at risk 36 days after waitlist registration () and are similar in terms of predicted expected log survival. Turning to other characteristics, we see that the matching procedure did not match on listing country and receival of biweekly dialysis. The risk set is comparable in terms of continuous variables (lab-MELDs ranging from 28 to 38, ages from 53 to 69).
| Year | Status time t | Lab-MELD | Age | Ped. | ReTX | Urg | (N)SE | Diag. | Dial. | Country | |||
| To be imputed subject | |||||||||||||
| 2014 | 36.0 | 41.9 | - | 33.7 | 33 | 64 | 0 | 0 | T | none | Cirrh. | 1 | DE |
| Risk set | |||||||||||||
| 2012 | 40.1 | 46 | - | 32.8 | 34 | 65 | 0 | 0 | T | none | Cirrh. | 0 | DE |
| 2015 | 41.1 | 55.8 | - | 34.9 | 30 | 63 | 0 | 0 | T | none | Cirrh. | 1 | DE |
| 2013 | 40.1 | 47.9 | - | 32.4 | 38 | 56 | 0 | 0 | T | none | Cirrh. | 1 | DE |
| 2012 | 36.4 | 42.1 | - | 35.3 | 35 | 68 | 0 | 0 | T | none | Cirrh. | 1 | BE |
| 2010 | 40.2 | 58.9 | - | 35.5 | 28 | 68 | 0 | 0 | T | none | Cirrh. | 0 | DE |
| 2016 | 37.7 | 86.3 | - | 35.6 | 34 | 53 | 0 | 0 | T | none | Cirrh. | 1 | DE |
| 2009 | 41.8 | - | 84.8 | 36.3 | 33 | 53 | 0 | 0 | T | none | Cirrh. | 0 | DE |
| 2008 | 35.1 | 42.1 | - | 29.9 | 30 | 69 | 0 | 0 | T | none | Cirrh. | 0 | DE |
| 2012 | 37.3 | 44.9 | - | 38.4 | 37 | 64 | 0 | 0 | T | none | Cirrh. | 0 | BE |
| 2010 | 7.4 | - | 946.9 | 29.4 | 29 | 63 | 0 | 0 | T | none | Cirrh. | 0 | AU |
| ⋮ | |||||||||||||
With risk set and constructed IPCW weights, we can obtain a personalized estimate of the conditional probability of remaining waitlisted time units after ’s censoring time (i.e. ). Estimation of this survival function for the risk set of A2 yields the survival function shown in Figure C3. This shows that our subject would have an approximately 60% probability of waitlist death/removal in the next 90 days, if not transplanted.
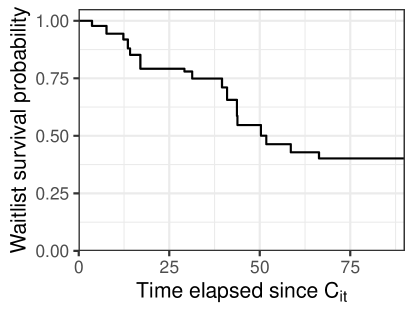
C.4 Matching the patient to a particular patient in
We match the censored patient to a patient who remains at risk in the risk set with inverse transform sampling. This means that we (i) draw a random number from the uniform(0,1) distribution, and (ii) find the smallest matching such that ). If such a exists, it corresponds to an event time for a patient . We can impute future status updates for patient by copying over the future status updates from patient .
In case such a does not exist, the patient remains alive at least time units after the status update. We therefore need to match to a patient from the set of patients who remain alive days after , i.e. . For this, we sampled patients with probability proportional to their inverse probability censoring weight, i.e. proportional to
C.5 Heterogeneity in waitlist survival per risk set
Figure C4 shows distributions of the estimated 90-day waitlist death/removal probabilities by laboratory MELD score, separately for HU and non-HU patients. The blue line is a smoothed estimate of the relation between laboratory MELD score and average 90-day event rates. The spread around the blue lines suggests that there is substantial heterogeneity in event rates not captured by MELD. This is especially true for HU patients (for whom MELD score is also not used in allocation). An interesting observation is that waitlist death/removal rates for the highest MELD scores (35-40) are higher than HU patients, even though HU patients receive absolute priority in allocation.
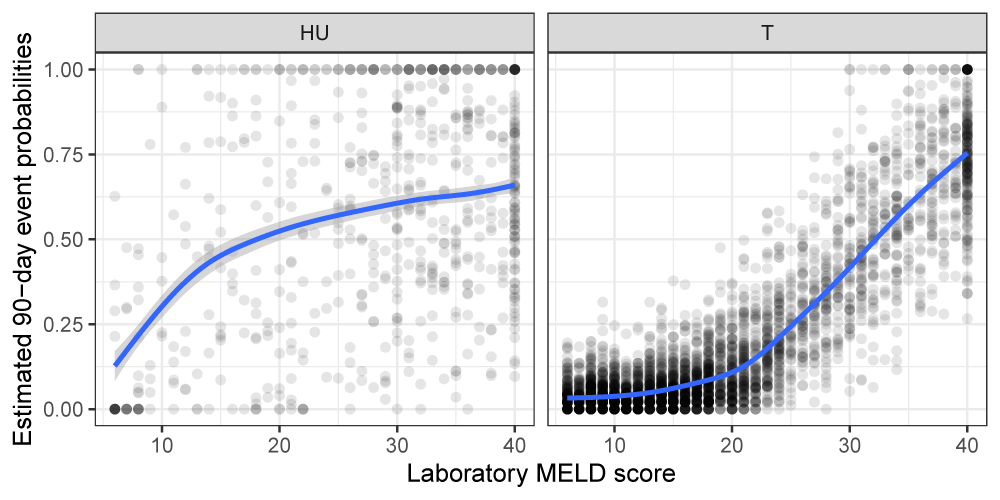
refs
Appendix D Deviation from standard allocation in the ELAS simulator’s graft offering module
myama
To avoid loss of transplantable grafts, ET can initiate the extended allocation procedure or competitive rescue allocation \citeADjochmansAdultLiverAllocation2017a. In total, such deviation from standard allocation accounts for 25% of placements. Without approximating such deviation from standard allocation, too many grafts are placed nationally in Germany (instead of regionally777In Germany, centers in the same region as the donor are first offered the liver in extended allocation.), and too many grafts are placed nationally in Belgium (instead of locally888Belgium has a special rule that the local center first receives a center offer before extended allocation is triggered.). Moreover, without deviation from standard allocation too few organs are placed at lower ranks, because many candidates specify that they do not want to receive a graft through extended allocation profiles. This motivated us to approximate deviation from standard allocation in the graft offering module.
We approximate deviation from standard allocation by
-
1.
simulating the maximum number of offers made until rescue allocation is triggered based on donor characteristics with a Cox proportional hazards model,
-
2.
offering the graft in order of the match list, while maintaining a count of the number of offers made,
-
3.
if the maximum number of offers is reached
-
•
stop offering the graft further to candidates whose allocation profiles exclude rescue donors,
-
•
giving absolute priority to regional candidates in Germany and local candidates in Belgium.
-
•
In counting the number of offers made, a center-level rejection is counted as a single offer, and a candidate-level rejection was counted only if (a) the graft was compatible with the candidates allocation profile and (b) the graft was previously rejected by fewer than 5 candidate from the same center.
We point out that this implementation is heavily simplified from actual rescue allocation in ELAS. Reasons for this are that there exist three distinct rescue allocation mechanisms which can be triggered under different circumstances \citeADjochmansAdultLiverAllocation2017a. A second complicating factor is that it is not clear from graft information alone when competitive rescue allocation is triggered, nor which centers are eligible for such offers. Moreover, not all centers are open to accepting grafts in competitive rescue allocation.
refs
Appendix E Simulating post-transplant mortality and re-listing and re-transplantations
myama
E.1 Post-transplant survival models & relistings
This section discusses how post-transplant survival and patient relisting is simulated based on patient and donor characteristics in ELASS. For post-transplant survival, parametric survival models were used. The Kaplan-Meier estimator was used to determine the time-to-relisting relative to simulated post-transplant survival times. Both models were estimated on transplantations in the Eurotransplant region between 01-01-2012 and 01-01-2020.
E.1.1 Choice of outcome: graft failure, patient failure or relisting
The Eurotransplant registry bi-annually requests data from centra on the graft failure and patient failure dates for transplanted recipients. However, centers do not use standardized definitions for graft failure dates. E.g., some centers define the date of graft failure as the date on which the patient was re-registered for liver transplantation, whereas others define the graft failure date as the date on which the patient was re-transplanted. Additionally, some centers report graft failure dates for patients even if the patient was not re-listed for transplantation, or died on the waiting list only years later. This motivated us to avoid using reported graft failure dates from the ET registry, and instead simulate in ELASS for each transplanted patient (i) an event time until patient death / retransplantation (whichever occurred first), and (ii) a time-to-relisting, relative to the first event time. LSAM handles post-transplant survival similarly, by assuming that a failure would result in a patient death unless the candidate is transplanted \citeAE[p. 41]SRTR2019.
E.1.2 Simulating patient failure date
Weibull accelerated failure time regression is used to simulate a time-to-event for patient death/retransplantation, separately for HU and elective candidates. For this, we used the R survival library. The Weibull distribution in this library is parametrized with a shape parameter and scale parameter , where are relevant patient and donor characteristics. The survival function for the Weibull distribution is given by:
After obtaining estimates for and based on historic data, we can simulate time-to-events for patient-donor pair by inverse transform sampling from this distribution. Specifically, we can draw a random number and simulate a patient’s time-to-event as
Shape and scale parameters were estimated separately for HU and elective patients. For the elective model, we included a broad set of patient attributes (MELD components, patient age, country, sex, exception, BMI), donor attributes (year reported, donor age, split, NHB, death cause, malignancy, tumor history), and patient-donor match attributes (weight difference, travel time, ET-blood group compatible, match geography). Paucity of data on HU transplantations motivated us to adjust for fewer variables in the HU model (weight difference, donor death cause, donor age, patient age, lab-MELD score, match geography, transplantation history (Y/N)). Country-specific shape parameters were estimated for the non-HU model, but not the HU model.
E.1.3 Simulating time-to-relisting
Simulating time-to-relisting is complicated by the fact that a patient’s time-to-relisting necessarily occurs before patient’s time-to-event . To simulate relistings in ELAS, we estimated the proportion of individuals that have relisted with Kaplan-Meier using time elapsed relative to the event time as the time scale (i.e. ). In this, we stratify Kaplan-Meier curves by groups of . A relisting time can then be simulated by inverse transform sampling, i.e. (i) sample a random , (ii) choose the first such that , and (iii) calculating the time-to-relisting as .
In case no such exists, the patient will not relist and therefore be a post-transplant death. Figure E5 shows estimates of the empirical distribution of , stratified by discretized . The figure clearly shows that the fraction of patients dying after transplantation without relisting depends strongly on . For instance, of candidates experiencing an event within 7 days after transplantation almost 70% relist for transplantation, whereas of candidates experiencing an event more than 5 years after initial transplantation only 20% relist.

Our approach to simulating a time-to-relisting differs from LSAM. LSAM instead requires end-users to specify for each possible realization of a discrete outcome distribution from (which includes an event that the patient does not relist).
E.1.4 Constructing a synthetic re-registration
Subsections E.1.2 and E.1.3 discussed how a time-to-event and time-to-relist are simulated in ELASS at transplantation based on patient and donor characteristics. However, ELASS also requires future status updates to be known for relisted candidates. Here, we discuss in detail how synthetic relistings are constructed in ELASS by combining information from the transplanted recipient with status updates from a real relisting.
Real relistings have a known and a time-to-event , where is the time until a terminal event measured from listing (potentially synthetic). To impute status updates for a relisting for candidate , we can thus look for a relisting with similar to . In practice, we could want to constrain matches further by also matching characteristics to . The post-transplant module includes code to require such matches.
By default, the post-transplant module finds a matching re-registration by:
-
1.
Considering re-registrations that match to the transplanted patient on whether the re-transplantation is HU-eligible999Retransplant candidates re-registered within 14 days () are eligible for an HU status, recipient country, patient age (20 year difference), time-to-relisting (1 year difference), and time-to-event (1 year difference).
-
2.
Selecting the re-registrations with the closest Mahalanobis distance between (, ) and (, ).
-
3.
Sampling a random re-registration from the re-registrations.
A synthetic re-registration is then constructed by combining patient attributes from patient with status updates from patient . The post-transplant module does not copy over profile status updates from patient to patient , since we consider them to be patient-specific. (N)SE status updates are copied over, as certain (N)SEs are specifically for re-transplantations (for instance, hepatic artery thrombosis). Note that by copying over status updates from real relisting , the synthetic re-registration may have a slightly different (but similar) time-to-event (namely, , instead of simulated ).
LSAM does not use data from real re-transplantations in scheduling relistings. Instead, users can specify for each potential realization of a synthetic patient relisting, consisting of (a) the MELD score at which the patient will re-list, and (b) all future status updates the patient will have after relisting. By default, ELASS assumes patients relist at a MELD score of 32. This is an unrealistic default choice, as the MELD at re-registration also depends strongly on time-to-reregistration.
refs