The Discovery of Polarized Water Vapor Megamaser Emission in a Molecular Accretion Disk
Abstract
For the first time in an extragalactic source, we detect linearly polarized H2O maser emission associated with the molecular accretion disk of NGC 1068. The position angles of the electric polarization vectors are perpendicular to the axes of filamentary structures in the molecular accretion disk. The inferred magnetic field threading the molecular disk must lie within of the sky plane. The orientation of the magnetic fields relative to the disk plane implies that the maser region is unstable to hydromagnetically powered outflow; we speculate that the maser region may be the source of the larger scale molecular outflow found in ALMA studies. The new VLBI observations also reveal a compact radio continuum source, NGC 1068∗, aligned with the near-systemic maser spots. The molecular accretion disk must be viewed nearly edge-on, and the revised central mass is .
1 Introduction
Extragalactic H2O masers, or megamasers, are usually associated with (sub-)pc-scale, edge-on molecular accretion disks, jet-induced shocks, or molecular outflows in narrow-line active galaxies (AGNs) (Lo, 2005). Famously, where they occur in disks, their distances can be determined geometrically through kinematic parallax (e.g., Herrnstein et al., 1999; Humphreys et al., 2013; Gao et al., 2016). Disk megamasers commonly show a Keplerian rotation curve, precisely measuring the central compact mass, presumably a supermassive black hole (SMBH) (e.g., Kuo et al., 2011; Gao et al., 2017).
In various models for accretion disks, the magnetic field plays an important role, ultimately providing an effective viscosity that drives accretion (Eardley & Lightman, 1975; Balbus & Hawley, 1998; Abramowicz & Fragile, 2013). Ordered and inclined magnetic fields can accelerate clouds, generate outflow, and remove angular momentum from the accretion disk (Blandford & Payne, 1982; Emmering et al., 1992). Elitzur & Shlosman (2006) proposed that the resulting molecular outflow might provide the torus scale height requisite for obscuration-based unification schemes for AGNs (see Antonucci, 1993; Ramos Almeida & Ricci, 2017, for reviews of such unification schemes). As such, measuring the strength and orientation of the magnetic fields in accretion disks contributes to our understanding of the accretion process.
Linear and circular polarization of maser emission measure the magnetic field strength and orientation in molecular gas (Goldreich et al., 1973). Since H2O is a non-paramagnetic molecule, its Zeeman splitting in mG magnetic fields is insufficient to produce detectable circular polarization, even in very narrow maser lines (Deguchi & Watson, 1986; Lankhaar & Teague, 2023). Despite several attempts (e.g. Herrnstein et al., 1998; Modjaz et al., 2005; Surcis et al., 2020), H2O megamaser circular polarization observations have only yielded upper limits to the line-of-sight component of the magnetic field, with the most stringent limit being mG towards NGC 3079 (Vlemmings et al., 2007). Linear polarization of masers is more complicated and depends on the saturation degree, anisotropy of the pumping mechanism, and propagation angle relative to the magnetic field axis, (see, e.g., the discussion in Deguchi et al., 1995). As long as the magnetic precession rate ( for the H2O 22 GHz transition) exceeds the rate of stimulated emission, then the electric polarization vector aligns parallel or perpendicular to the projection of the magnetic field on the sky (Goldreich & Kylafis, 1981): when , the polarization vector aligns with the projected magnetic field direction; otherwise, the polarization is perpendicular to the magnetic field (cf. the discussion in Vlemmings et al., 2006). Lankhaar et al. (2024) demonstrated that anisotropically pumped 22 GHz H2O masers should show 1 to 3% linear polarization below the saturation limit, i.e., the limit at which stimulated emission exceeds the decay rate; isotropic pumping produces significant linear polarization only above the saturation limit. Unlike circular polarization, the linear polarization fraction of H2O masers does not directly constrain the strength of the magnetic field.
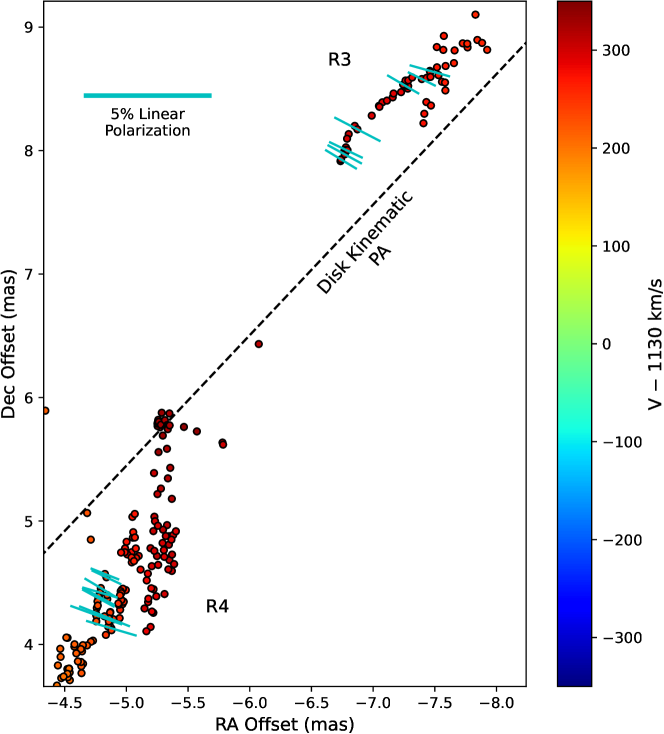
The Seyfert 2 galaxy NGC 1068 is an unusual H2O megamaser source. The brightest masers are found in a molecular accretion disk surrounding the central engine, radio continuum source S1 (Gallimore et al., 1996, 2001). To orient the reader, Fig. 1 shows the sky distribution of the disk maser spots relative to radio continuum. The position-velocity diagram, taken along the major axis position angle (, suggests a rotation curve slightly flatter than Keplerian rotation (Greenhill & Gwinn, 1997). However, Gallimore & Impellizzeri (2023) (GI23) demonstrated that the apparently too-flat rotation curve may be an illusion that results from how the water masers preferentially sample spiral arms within the disk; the fully three-dimensional model is consistent with Keplerian rotation around a SMBH.
The maser disk also shows filamentary substructures; these filaments are especially prominent in the brightest masers, the R4 group. Since the maser region is expected to be partially ionized (Neufeld et al., 1994; Neufeld & Maloney, 1995), the filaments suggest organization by an orderly magnetic field threading the disk (GI23). The filament lengths are typically 1–2 mas, or roughly 0.1 pc at the distance of NGC 1068111The distance to NGC 1068 is Mpc (Anand et al., 2021). We adopt the scale 1″= 70 pc, appropriate for a distance of 14.4 Mpc, to maintain consistency with previous work.. GI23 estimated that the magnetic field strengths must be mG to remain orderly in the presence of turbulent motions in the molecular gas. This estimate compares well with an independent measurement from infrared polarimetry, mG (Lopez-Rodriguez et al., 2015).
We obtained new observations of the 22 GHz H2O megamasers of NGC 1068 to search for polarization as a tool to map the magnetic fields in the molecular accretion disk. As a by-product, we obtained sensitive, wideband continuum measurements that provide the currently highest resolution map of the radio continuum source. Below, we discuss the observations and data reduction, the primary findings, and summarize our main conclusions.
2 Observations and Data Reduction
We observed NGC 1068 with the High Sensitivity Array (HSA), consisting of the ten VLBA telescopes augmented by the Green Bank Telescope (GBT) and the Karl G. Jansky Very Large Array (VLA) acting as a phased telescope. The observations took place on 2021 Nov 14, starting at UTC 03:36 and lasting six hours. The receivers were tuned to four intermediate frequency bands (IFs) centered at 21.776, 21.904, 22.032, & 22.160 GHz; the three lower frequency IFs cover the continuum well separated from the H2O line, and the high-frequency IF centers near the water maser transition GHz, redshifted to km s-1. Observations were performed with full polarization, permitting measurements in parallel-hand circular polarization (right-hand RR and left-hand LL) to produce images in Stokes and and cross-hand polarization (RL and LR) to produce images in Stokes and .
2.1 Data Reduction
Roughly half of the observing time was dedicated to NGC 1068, with short gaps for observations of calibrator sources. Every five minutes, the calibrator J0238+16 was observed to align the phases of the VLA antennas. The phase reference calibrator J0239 was observed for three minutes every half hour to monitor instrumental delays and as an astrometric reference. We also observed the bright radio source 3C 454.3 to calibrate bandpass and multi-band delays, 3C 84 as a low-polarization reference to remove instrumental polarization (leakage-term calibration), and 3C 48 as a polarized reference to calibrate the phase difference between the right-hand and left-hand circular polarization signal path. Note that 3C 84 shows weak, % linear polarization at 22 GHz (Taylor et al., 2006), which is small compared to the expected % instrumental polarization. We viewed linear polarizations % skeptically as they may reflect systematic error by assuming zero polarization for 3C 84. After accounting for pointing overheads and calibrator observations, the total integration time on NGC 1068 was 2.87 hours.
Data reduction broadly followed the approach used for the previous epoch (HSA code BG262J; GI23) with a few extra steps to ensure proper polarization calibration. All calibration steps were performed in AIPS (Associated Universities, 1999) following the procedures recommended by NRAO. One key step was determining multiband delays to ensure that phase calibration solutions could be transferred from the maser IF to the continuum IFs (AIPS task VLBAMPCL). Unfortunately, the multiband delay solutions failed specifically for the Mauna Kea (MK) antenna, so all baselines to that telescope were discarded (flagged) in the final calibrated data set.
After initial calibration of amplitudes, rates, and delays, we re-calibrated phase rates based on the channel containing the brightest H2O maser, which, for this epoch, had an integrated flux density mJy at km s-1. The resulting rate corrections were applied specifically to NGC 1068 and the phase reference J023902. This correction introduces an astrometric offset that displaces J023902 from its reference position of about 7 mas; this offset is applied in reverse to determine the astrometric positions of the maser spots in the J2000 reference frame. The expected absolute astrometric precision is mas, but, because they share a common phase reference, the relative astrometry between the maser spot positions and the 22 GHz continuum is precise, limited mainly by signal-to-noise (GI23). In this work, all positions are reported or plotted as offsets relative to RA(J2000) = 02h42m4070907, Dec(J2000) = 00°00′479444.
Calibrating circular polarization (Stokes ) is challenging as it is calculated from the difference of bright signals in the RR and LL feeds. We adopted a conservative approach and applied an amplitude self-calibration cycle assuming for the brightest maser feature (the Zero- Self-calibration technique of Homan & Wardle, 1999). If the brightest maser has an intrinsic circular polarization, this self-calibration imposes artificial circular polarization on other maser spots and the continuum. In the end, we did not find credible detections of circular polarization; we conclude that any intrinsic circular polarization is below the detection level, mJy () (see the discussion in GI23).

2.2 Maser Astrometry and Spectropolarimetry
After primary calibration in AIPS, all imaging tasks were performed in DIFMAP (Shepherd, 2011). To measure the positions of the maser spots, we used a suitably modified version of automap, a script provided with the DIFMAP distribution. The modified script alternates between offset fields associated with radio components S1 and C (the disk and jet masers, respectively) and a control field located midway between the radio components. For maser channels with high signal-to-noise ratios (S/N) in Stokes , we fit the visibilities with Gaussian surface brightness models; we used point source models for channels with lower S/N. Imaging was used only to initialize model components and assess residuals; we added model components until the residual peak in the image plane fell below . To filter false positives, we rejected candidate maser spots whose peak brightness was less than the magnitude of the most negative pixel in the sky plane, and we rejected spots fainter than the brightest pixels in the control field. Finally, we applied a spatial filter to remove false positives associated with sidelobes of the synthetic beam. With natural weighting, the characteristic background rms in the line-free channels is mJy beam-1, and the synthetic beam size is mas, PA . For reference, the EVN Calculator predicts an ideal background rms of mJy beam-1. In the brightest channel, the peak flux density is 280 mJy beam-1, and the background rms is 1 mJy beam-1; therefore, the measured dynamic range limit is 280:1.
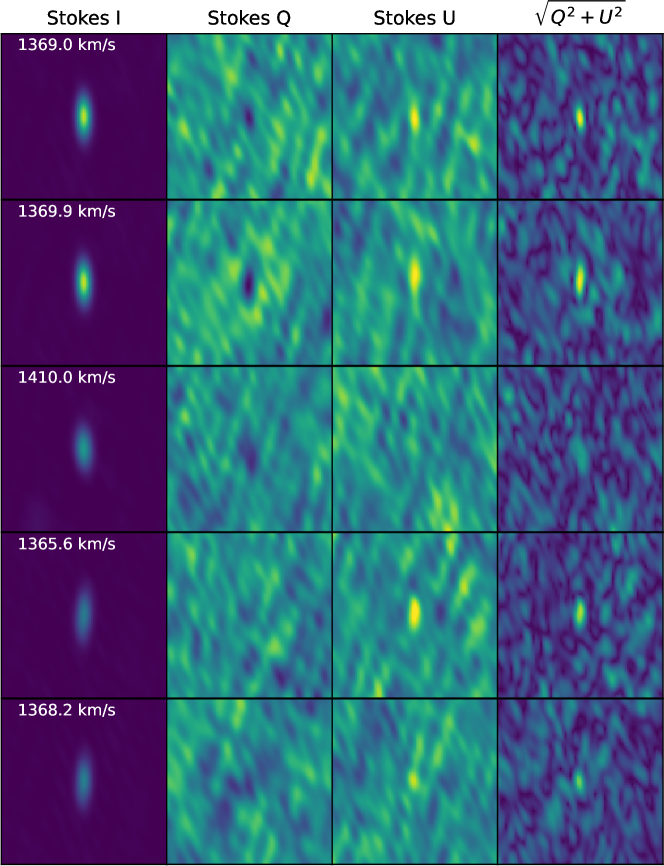
We also generated images in the , , and Stokes parameters to search for linear and circular polarization. We used point source models, initialized at the Stokes positions, to fit the polarized flux. Figure 2 shows the linear polarization images for the brightest five channels in Stokes . Polarized flux was searched to the limit mJy. There were no significant detections on the Stokes images.
To assess false detections, we applied a linear regression between the Stokes , , and positions and added a mixture model to identify positional outliers (Hogg et al., 2010; Foreman-Mackey et al., 2013). Polarization candidates having an outlier probability were rejected; put another way, we rejected polarization candidates whose best-fit position deviated significantly from the Stokes position. Finally, to obviate the effects of Ricean bias (Wardle & Kronberg, 1974; Killeen et al., 1986; Sohn, 2011), we used a Monte Carlo calculation to evaluate the fractional polarization and the electric polarization vector position angle (EVPA). Fig. 3 shows a map of the maser spots with significant linear polarization, and their properties are summarized in Table 1. All of the polarization detections are associated with the R3d, R4c, and R4d subgroups as defined in GI23. After outlier rejection, there are 16 maser spots with fractional linear polarizations significance. Typical values are .
| Channel | V(LSRK) | Stokes | Stokes | Stokes | EVPA | Subgroup | ||||||||||||
|---|---|---|---|---|---|---|---|---|---|---|---|---|---|---|---|---|---|---|
| (km s-1) | (mJy) | (mJy) | (mJy) | (%) | (degrees) | (degrees) | ||||||||||||
| 597 | 1360\@alignment@align.5 | 111 | 1\@alignment@align | -1.8 | 0\@alignment@align.4 | 1.5 | 0\@alignment@align.4 | 2.1 | 0\@alignment@align.4 | 70 | 6\@alignment@align | R4d | 88\@alignment@align | 6 | ||||
| 592 | 1364\@alignment@align.8 | 183 | 1\@alignment@align | -1.4 | 0\@alignment@align.4 | 2.1 | 0\@alignment@align.4 | 1.4 | 0\@alignment@align.2 | 62 | 6\@alignment@align | R4d | 80\@alignment@align | 6 | ||||
| 591 | 1365\@alignment@align.6 | 198.3 | 0\@alignment@align.9 | -1.5 | 0\@alignment@align.4 | 2.3 | 0\@alignment@align.4 | 1.4 | 0\@alignment@align.2 | 62 | 6\@alignment@align | R4d | 80\@alignment@align | 6 | ||||
| 589 | 1367\@alignment@align.3 | 188.5 | 0\@alignment@align.9 | -2.2 | 0\@alignment@align.4 | 1.4 | 0\@alignment@align.4 | 1.4 | 0\@alignment@align.2 | 74 | 6\@alignment@align | R4d | 88\@alignment@align | 6 | ||||
| 588 | 1368\@alignment@align.2 | 191.2 | 0\@alignment@align.9 | -1.3 | 0\@alignment@align.4 | 2.4 | 0\@alignment@align.4 | 1.4 | 0\@alignment@align.2 | 59 | 6\@alignment@align | R4d | 77\@alignment@align | 6 | ||||
| 587 | 1369\@alignment@align.0 | 345.3 | 0\@alignment@align.8 | -2.9 | 0\@alignment@align.4 | 2.7 | 0\@alignment@align.4 | 1.2 | 0\@alignment@align.1 | 69 | 5\@alignment@align | R4d | 87\@alignment@align | 5 | ||||
| 586 | 1369\@alignment@align.9 | 345.1 | 0\@alignment@align.8 | -2.7 | 0\@alignment@align.4 | 3.3 | 0\@alignment@align.4 | 1.2 | 0\@alignment@align.1 | 65 | 5\@alignment@align | R4d | 83\@alignment@align | 5 | ||||
| 583 | 1372\@alignment@align.4 | 118 | 1\@alignment@align | -1.8 | 0\@alignment@align.4 | 1.7 | 0\@alignment@align.4 | 2.1 | 0\@alignment@align.3 | 68 | 6\@alignment@align | R4c/daaThe subgroup identification for this maser spot is ambiguous. We averaged the properties of subgroups R4c and R4d to calculate . | 85\@alignment@align | 7 | ||||
| 573 | 1381\@alignment@align.0 | 99 | 1\@alignment@align | -1.7 | 0\@alignment@align.4 | 1.0 | 0\@alignment@align.4 | 2.0 | 0\@alignment@align.4 | 70 | 11\@alignment@align | R4c | 86\@alignment@align | 11 | ||||
| 541 | 1408\@alignment@align.3 | 130 | 1\@alignment@align | -1.8 | 0\@alignment@align.4 | 1.0 | 0\@alignment@align.4 | 1.6 | 0\@alignment@align.3 | 70 | 11\@alignment@align | R3d | 74\@alignment@align | 11 | ||||
| 539 | 1410\@alignment@align.0 | 228 | 1\@alignment@align | -1.6 | 0\@alignment@align.4 | 2.1 | 0\@alignment@align.4 | 1.2 | 0\@alignment@align.2 | 64 | 6\@alignment@align | R3d | 80\@alignment@align | 6 | ||||
| 535 | 1413\@alignment@align.4 | 189 | 1\@alignment@align | -1.3 | 0\@alignment@align.4 | 2.3 | 0\@alignment@align.4 | 1.4 | 0\@alignment@align.2 | 60 | 6\@alignment@align | R3d | 84\@alignment@align | 6 | ||||
| 523 | 1423\@alignment@align.6 | 105 | 1\@alignment@align | -1.2 | 0\@alignment@align.4 | 1.7 | 0\@alignment@align.4 | 2.0 | 0\@alignment@align.4 | 63 | 7\@alignment@align | R3d | 81\@alignment@align | 7 | ||||
| 521 | 1425\@alignment@align.3 | 162 | 1\@alignment@align | -1.3 | 0\@alignment@align.4 | 2.0 | 0\@alignment@align.4 | 1.5 | 0\@alignment@align.2 | 62 | 6\@alignment@align | R3d | 82\@alignment@align | 6 | ||||
| 520 | 1426\@alignment@align.2 | 148 | 1\@alignment@align | -1.3 | 0\@alignment@align.4 | 1.6 | 0\@alignment@align.4 | 1.4 | 0\@alignment@align.3 | 65 | 7\@alignment@align | R3d | 79\@alignment@align | 7 | ||||
| 519 | 1427\@alignment@align.0 | 171 | 1\@alignment@align | -1.1 | 0\@alignment@align.4 | 2.1 | 0\@alignment@align.4 | 1.4 | 0\@alignment@align.2 | 59 | 6\@alignment@align | R3d | 85\@alignment@align | 6 | ||||
Note. — Only maser spots with significance are included in this table. The subgroup is based on cross-identification with maser spots in GI23. The EVPA uncertainty includes a 4° systematic uncertainty added in quadrature to the statistical uncertainty. The position angle difference between the subgroup axis and the EVPA, , is defined as the minimum of the supplementary angles between the two vectors.
2.3 Continuum Imaging
We transferred calibration solutions from the maser IF to generate the continuum image and used natural weighting in the Fourier transform. For the image presented in Fig. 1, we used a sum of elliptical Gaussian and point-source models to reconstruct the continuum image. Fitting was performed interactively in DIFMAP. We added model components one at a time, elliptical Gaussians for brighter, clearly resolved sources, and point sources for fainter, compact sources. We performed non-linear model-fitting using the DIFMAP task modelfit. Fifty iterations usually sufficed to minimize for a given set of model components. We stopped adding model components when the sidelobes in the residual map were indistinguishable from background noise, Jy beam-1, which compares well with that predicted by the EVN Calculator, Jy beam-1. Ultimately, the S1 continuum model consisted of six Gaussians and two point sources. The model components were convolved with the restoring beam ( mas, PA 15) and added to the residual image to create the restored image. For reference, the HSA recovers roughly half of the flux density of S1 compared to a recent 22 GHz VLA measurement: the total HSA flux is mJy, compared to mJy for the VLA (Mutie et al., 2024).
3 Results and Discussion
The new continuum image (Fig. 1) is the currently highest-resolution image of the nuclear radio source. It reveals for the first time a compact radio source at the kinematic center of the molecular accretion disk. Following the convention used for the Galactic Center (Sgr A∗, Balick & Brown, 1974) and M 87 (M87∗, Event Horizon Telescope Collaboration et al., 2019), we identify this compact source as NGC 1068∗. There is resolved radio continuum emission extending roughly 6 mas (0.4 pc) east and west of NGC 1068∗ along PA . This extended feature broadly resembles the morphology observed in 5 and 8.4 GHz continuum (Gallimore et al., 2004), except for the sharp bends at the extreme eastern and western ends. As this structure is perpendicular to the local outflow axis, we maintain the interpretation that this extended continuum emission arises from plasma in a hot disk located inside the molecular accretion disk (cf. Gallimore et al., 1997, 2004). There is a rotation in PA between the plasma disk and the maser annulus suggesting a strong warp at pc from the central engine.
Labeled S1-North on Fig. 1, we discovered a plume of radio continuum emission north of NGC 1068∗ that was not resolved at lower frequencies. A hint of this feature is visible in the tapered 22 GHz continuum image of GI23 (cf. the comparison with the infrared continuum morphology in Gámez Rosas et al. 2022 & GI23). As it falls along the direction of larger-scale radio jet, we speculate that this feature is a cloud of plasma recently ejected from the central engine.
A full kinematic model is beyond the scope of this Letter, but we note that the near-systemic velocity maser spots (the G1 group) closely align with NGC 1068∗. Assuming NGC 1068∗ marks the location of the SMBH, the molecular accretion disk is viewed almost exactly edge-on, i.e., inclination . Our previous model had no constraints on the kinematic center; rather, we sought to minimize the scale height of the disk, resulting in a best fit (GI23). The correction reduces the inferred SMBH mass by 4%; the revised central mass is now , pending a revised model that includes prior constraints on the location of the kinematic center.
All polarization detections are associated with the brighter masers of the R3d, R4c, and R4d maser subgroups. The fractional polarization is typically between 1 and 2%. The detection limit is about 2 mJy in either Stokes or , so non-detections imply , where is the total (Stokes ) flux density. Only 3 / 754 maser spots have a detection threshold . Therefore, most of the maser spots might have but remain undetected in polarized flux owing to limited S/N.
From inspection of Fig. 3, the EVPAs appear nearly perpendicular to the local maser filament axes. To quantify the relative orientation, we cross-identified the maser spot positions and velocities against the subgroup properties found in GI23; the subgroup assignments are included in Table 1. The best-fit PAs of the R3d, R4c, and R4d filaments are , , and , respectively (GI23). We define the PA difference as the minimum absolute supplementary angle between the EVPA and the PA of the filament; means the EVPA is parallel to the filament, and means perpendicular. All of the measured values of fall within of 90°, and none are consistent with . In other words, the results are consistent with the EVPAs being perpendicular to the filament axes. With the EVPAs of the maser spots consistently aligned perpendicular to the filaments, Faraday rotation here is likely limited to a few degrees at most.
The relative orderliness of the maser spot EVPAs relative to the filaments they trace indicates a common organizing mechanism: the magnetic field. We assume that the filaments trace the projected orientation of the magnetic field lines, much like solar prominences. Under this assumption, the polarization is perpendicular to the magnetic field lines, indicating that the angles between the sight-line and the magnetic field lines are (Vlemmings et al., 2006); in other words, the magnetic field lines lie within 35° of the sky plane. Additionally, it appears that the polarized filaments are not at right angles with the disk plane as was suggested by the deprojection of the inclined disk models of GI23. Since we now have evidence that the disk is viewed edge-on and that the magnetic fields are oriented near the plane of the sky, projection effects are small, and the apparent sky rotation of the magnetic field relative to the disk plane is likely close to the true, deprojected rotation. In this case, the filaments are rotated by relative to the disk plane (see Fig. 3). Blandford & Payne (1982) demonstrated that a centrifugal outflow results when the poloidal magnetic field falls within 60° of the disk plane. We speculate that this region might be the source of the larger scale molecular outflow observed with ALMA (e.g., García-Burillo et al., 2014; Gallimore et al., 2016; Impellizzeri et al., 2019; Imanishi et al., 2020). The filaments are displaced by up to (0.07 pc) from the best-fit disk plane (Fig. 3), suggesting the masers arise from molecular gas elevated above the edge-on accretion disk. These results are consistent with the proposal of Elitzur & Shlosman (2006) that such hydromagnetic disk winds might inflate the scale height of dusty molecular gas around the molecular accretion disk as required by obscuration-based unification schemes.
4 Conclusions
Using the HSA, we have detected linear polarization for the first time in an extragalactic H2O maser source, the molecular accretion disk of NGC 1068. Furthermore, we have discovered a compact radio source at the kinematic center that we identify as NGC 1068∗. We list below the main results and conclusions.
-
1.
The near-systemic masers are nearly aligned with NGC 1068∗, indicating that the molecular accretion disk is viewed nearly edge-on. This corrects a previous model and slightly reduces the central mass to .
-
2.
The maser polarization vectors are perpendicular to their respective maser filaments, arguing for a common polarization mechanism. This result is self-consistent with our proposal that magnetic fields organize the maser filaments.
-
3.
The inferred magnetic fields lie within of the sky plane. Based on the filament morphology, the magnetic fields make an angle of with the plane of the molecular accretion disk.
-
4.
The polarization results are consistent with the requirements for a centrifugally directed, hydromagnetic wind. We speculate that this region of the molecular accretion disk might be the source of the larger scale molecular outflow and potentially elevates molecular gas to create the dust scale height required by obscuration-based unification schemes.
References
- Abramowicz & Fragile (2013) Abramowicz, M. A., & Fragile, P. C. 2013, Living Reviews in Relativity, 16, 1, doi: 10.12942/lrr-2013-1
- Anand et al. (2021) Anand, G. S., Lee, J. C., Van Dyk, S. D., et al. 2021, MNRAS, 501, 3621, doi: 10.1093/mnras/staa3668
- Antonucci (1993) Antonucci, R. 1993, ARA&A, 31, 473, doi: 10.1146/annurev.aa.31.090193.002353
- Associated Universities (1999) Associated Universities, I. 1999, AIPS: Astronomical Image Processing System, Astrophysics Source Code Library, record ascl:9911.003
- Astropy Collaboration et al. (2013) Astropy Collaboration, Robitaille, T. P., Tollerud, E. J., et al. 2013, A&A, 558, A33, doi: 10.1051/0004-6361/201322068
- Astropy Collaboration et al. (2018) Astropy Collaboration, Price-Whelan, A. M., Sipőcz, B. M., et al. 2018, AJ, 156, 123, doi: 10.3847/1538-3881/aabc4f
- Balbus & Hawley (1998) Balbus, S. A., & Hawley, J. F. 1998, Reviews of Modern Physics, 70, 1, doi: 10.1103/RevModPhys.70.1
- Balick & Brown (1974) Balick, B., & Brown, R. L. 1974, ApJ, 194, 265, doi: 10.1086/153242
- Blandford & Payne (1982) Blandford, R. D., & Payne, D. G. 1982, MNRAS, 199, 883, doi: 10.1093/mnras/199.4.883
- Deguchi et al. (1995) Deguchi, S., Nakai, N., & Barvainis, R. 1995, AJ, 109, 507, doi: 10.1086/117296
- Deguchi & Watson (1986) Deguchi, S., & Watson, W. D. 1986, ApJ, 302, 750, doi: 10.1086/164036
- Eardley & Lightman (1975) Eardley, D. M., & Lightman, A. P. 1975, ApJ, 200, 187, doi: 10.1086/153777
- Elitzur & Shlosman (2006) Elitzur, M., & Shlosman, I. 2006, ApJ, 648, L101, doi: 10.1086/508158
- Emmering et al. (1992) Emmering, R. T., Blandford, R. D., & Shlosman, I. 1992, ApJ, 385, 460, doi: 10.1086/170955
- Event Horizon Telescope Collaboration et al. (2019) Event Horizon Telescope Collaboration, Akiyama, K., Alberdi, A., et al. 2019, ApJ, 875, L1, doi: 10.3847/2041-8213/ab0ec7
- Foreman-Mackey et al. (2013) Foreman-Mackey, D., Hogg, D. W., Lang, D., & Goodman, J. 2013, PASP, 125, 306, doi: 10.1086/670067
- Gallimore et al. (1997) Gallimore, J. F., Baum, S. A., & O’Dea, C. P. 1997, Nature, 388, 852, doi: 10.1038/42201
- Gallimore et al. (2004) —. 2004, ApJ, 613, 794, doi: 10.1086/423167
- Gallimore et al. (1996) Gallimore, J. F., Baum, S. A., O’Dea, C. P., Brinks, E., & Pedlar, A. 1996, ApJ, 462, 740, doi: 10.1086/177187
- Gallimore et al. (2001) Gallimore, J. F., Henkel, C., Baum, S. A., et al. 2001, ApJ, 556, 694, doi: 10.1086/321616
- Gallimore & Impellizzeri (2023) Gallimore, J. F., & Impellizzeri, C. M. V. 2023, ApJ, 951, 109, doi: 10.3847/1538-4357/acd846
- Gallimore et al. (2016) Gallimore, J. F., Elitzur, M., Maiolino, R., et al. 2016, ApJ, 829, L7, doi: 10.3847/2041-8205/829/1/L7
- Gámez Rosas et al. (2022) Gámez Rosas, V., Isbell, J. W., Jaffe, W., et al. 2022, Nature, 602, 403, doi: 10.1038/s41586-021-04311-7
- Gao et al. (2016) Gao, F., Braatz, J. A., Reid, M. J., et al. 2016, ApJ, 817, 128, doi: 10.3847/0004-637X/817/2/128
- Gao et al. (2017) —. 2017, ApJ, 834, 52, doi: 10.3847/1538-4357/834/1/52
- García-Burillo et al. (2014) García-Burillo, S., Combes, F., Usero, A., et al. 2014, A&A, 567, A125, doi: 10.1051/0004-6361/201423843
- Goldreich et al. (1973) Goldreich, P., Keeley, D. A., & Kwan, J. Y. 1973, ApJ, 179, 111, doi: 10.1086/151852
- Goldreich & Kylafis (1981) Goldreich, P., & Kylafis, N. D. 1981, ApJ, 243, L75, doi: 10.1086/183446
- Greenhill & Gwinn (1997) Greenhill, L. J., & Gwinn, C. R. 1997, Ap&SS, 248, 261, doi: 10.1023/A:1000554317683
- Herrnstein et al. (1998) Herrnstein, J. R., Moran, J. M., Greenhill, L. J., Blackman, E. G., & Diamond, P. J. 1998, ApJ, 508, 243, doi: 10.1086/306398
- Herrnstein et al. (1999) Herrnstein, J. R., Moran, J. M., Greenhill, L. J., et al. 1999, Nature, 400, 539, doi: 10.1038/22972
- Hogg et al. (2010) Hogg, D. W., Bovy, J., & Lang, D. 2010, arXiv e-prints, arXiv:1008.4686. https://arxiv.org/abs/1008.4686
- Homan & Wardle (1999) Homan, D. C., & Wardle, J. F. C. 1999, AJ, 118, 1942, doi: 10.1086/301108
- Humphreys et al. (2013) Humphreys, E. M. L., Reid, M. J., Moran, J. M., Greenhill, L. J., & Argon, A. L. 2013, ApJ, 775, 13, doi: 10.1088/0004-637X/775/1/13
- Imanishi et al. (2020) Imanishi, M., Nguyen, D. D., Wada, K., et al. 2020, ApJ, 902, 99, doi: 10.3847/1538-4357/abaf50
- Impellizzeri et al. (2019) Impellizzeri, C. M. V., Gallimore, J. F., Baum, S. A., et al. 2019, ApJ, 884, L28, doi: 10.3847/2041-8213/ab3c64
- Killeen et al. (1986) Killeen, N. E. B., Bicknell, G. V., & Ekers, R. D. 1986, ApJ, 302, 306, doi: 10.1086/163992
- Kuo et al. (2011) Kuo, C. Y., Braatz, J. A., Condon, J. J., et al. 2011, ApJ, 727, 20, doi: 10.1088/0004-637X/727/1/20
- Lankhaar et al. (2024) Lankhaar, B., Surcis, G., Vlemmings, W., & Impellizzeri, V. 2024, A&A, 683, A117, doi: 10.1051/0004-6361/202348420
- Lankhaar & Teague (2023) Lankhaar, B., & Teague, R. 2023, A&A, 678, A17, doi: 10.1051/0004-6361/202345840
- Lo (2005) Lo, K. Y. 2005, ARA&A, 43, 625, doi: 10.1146/annurev.astro.41.011802.094927
- Lopez-Rodriguez et al. (2015) Lopez-Rodriguez, E., Packham, C., Jones, T. J., et al. 2015, MNRAS, 452, 1902, doi: 10.1093/mnras/stv1410
- Modjaz et al. (2005) Modjaz, M., Moran, J. M., Kondratko, P. T., & Greenhill, L. J. 2005, ApJ, 626, 104, doi: 10.1086/429559
- Mutie et al. (2024) Mutie, I. M., Williams-Baldwin, D., Beswick, R. J., et al. 2024, MNRAS, 527, 11756, doi: 10.1093/mnras/stad3864
- Neufeld & Maloney (1995) Neufeld, D. A., & Maloney, P. R. 1995, ApJ, 447, L17, doi: 10.1086/309553
- Neufeld et al. (1994) Neufeld, D. A., Maloney, P. R., & Conger, S. 1994, ApJ, 436, L127, doi: 10.1086/187649
- Ramos Almeida & Ricci (2017) Ramos Almeida, C., & Ricci, C. 2017, Nature Astronomy, 1, 679, doi: 10.1038/s41550-017-0232-z
- Shepherd (2011) Shepherd, M. 2011, Difmap: Synthesis Imaging of Visibility Data, Astrophysics Source Code Library, record ascl:1103.001
- Sohn (2011) Sohn, B. W. 2011, Journal of Astronomy and Space Sciences, 28, 267, doi: 10.5140/JASS.2011.28.4.267
- Surcis et al. (2020) Surcis, G., Tarchi, A., & Castangia, P. 2020, A&A, 637, A57, doi: 10.1051/0004-6361/201937380
- Taylor et al. (2006) Taylor, G. B., Gugliucci, N. E., Fabian, A. C., et al. 2006, MNRAS, 368, 1500, doi: 10.1111/j.1365-2966.2006.10244.x
- Vlemmings et al. (2007) Vlemmings, W. H. T., Bignall, H. E., & Diamond, P. J. 2007, ApJ, 656, 198, doi: 10.1086/510515
- Vlemmings et al. (2006) Vlemmings, W. H. T., Diamond, P. J., van Langevelde, H. J., & Torrelles, J. M. 2006, A&A, 448, 597, doi: 10.1051/0004-6361:20054275
- Wardle & Kronberg (1974) Wardle, J. F. C., & Kronberg, P. P. 1974, ApJ, 194, 249, doi: 10.1086/153240