[table]capposition=top \DeclareSourcemap\maps[datatype=bibtex] \map[overwrite] \step[fieldsource=shortjournal] \step[fieldset=journaltitle,origfieldval]
Coherent X-rays reveal anomalous molecular diffusion and cage effects in crowded protein solutions
Abstract
Understanding protein motion within the cell is crucial for predicting reaction rates and macromolecular transport in the cytoplasm. A key question is how crowded environments affect protein dynamics through hydrodynamic and direct interactions at molecular length scales. Using megahertz X-ray Photon Correlation Spectroscopy (MHz-XPCS) at the European X-ray Free Electron Laser (EuXFEL), we investigate ferritin diffusion at microsecond time scales. Our results reveal anomalous diffusion, indicated by the non-exponential decay of the intensity autocorrelation function at high concentrations. This behavior is consistent with the presence of cage-trapping in between the short- and long-time protein diffusion regimes. Modeling with the -theory of hydrodynamically interacting colloidal spheres successfully reproduces the experimental data by including a scaling factor linked to the protein direct interactions. These findings offer new insights into the complex molecular motion in crowded protein solutions, with potential applications for optimizing ferritin-based drug delivery, where protein diffusion is the rate-limiting step.
Introduction
In living organisms, proteins are embedded in crowded environments such as in the cytoplasm of cells, membranes, and lipid vesicles [1]. Understanding protein diffusion in these environments is essential, as it directly impacts several critical cellular processes, including metabolism (connected to reaction rates), self-assembly of supramolecular structures and signal transduction [2, 1].
However, predicting and studying protein diffusion in crowded conditions is challenging due to the complex interplay of multiple factors. One such factor is the hydrodynamic interactions, where the motion of each biomolecule is influenced by the flow field generated by its neighbors [3, 4]. These hydrodynamic flows can affect the entire biomembrane and enhance the diffusive motion of passive particles within the cytoplasm [5]. Additionally, protein diffusion is affected by direct forces, including electrostatic interactions and nonspecific attractive interactions between molecules such as van der Waals forces [6]. Excluded volume effects can further complicate diffusion by reducing macromolecular mobility, although these effects alone do not fully account for the tenfold decrease in diffusion rates observed in vivo [7, 8]. Moreover, transient protein clusters due to attractive forces can further diminish mobility [6, 9]. A major challenge in understanding protein diffusion in crowded environments lies in deciphering the competition among these factors, all of which influence dynamics on similar time scales.
Crowding can also lead to deviations from simple Brownian motion, which is termed as anomalous diffusion [10, 11]. For globular proteins and colloids, anomalous diffusion has been linked to cage effects [12, 13], where a protein is transiently confined in a "cage" formed by neighboring molecules. The rearrangement of this cage is what eventually allows the molecule to diffuse and leads to structural relaxation. In this context, protein motion is typically characterised in terms of short- and long-time diffusion (see Fig. 1a). Short-time diffusion refers to the motion of the proteins within the cage formed by its neighbors and occurs on time scales shorter than the interaction time , which is the travel time needed for a protein to move a distance equal to its radius. The interaction time can be estimated as , where is the hydrodynamic radius of the protein and is the average self-diffusion coefficient.
Anomalous diffusion of globular proteins is most evident around the interaction time, [3]. At time scales much shorter than (), the short-time diffusion is Brownian and is mainly affected by hydrodynamic interactions and excluded volume effects [14]. At much longer times (), long-time diffusion is predominantly hindered by friction caused by interaction between the proteins [14]. Unlike the short-time diffusion, there are no theoretical predictions for the long-time diffusion due to complex interplay of hydrodynamic and direct protein interactions. Therefore, it is essential to develop strategies to characterize the properties of the long-time diffusion, as well as the transition between the short- and long-time diffusion regimes.
To understand the role of hydrodynamic and direct interactions in long-time protein motion, it is necessary to measure the collective diffusion at length scales both larger and smaller than the protein intermolecular distances, which is a significant technical challenge. Single particle tracking, fluorescence correlation spectroscopy [15], neutron backscattering, nuclear magnetic resonance (NMR) and gradient field NMR are limited to accessing the self-diffusion of proteins. While scattering techniques can probe collective diffusion, dynamic light scattering (DLS) [16, 17] provides insights at length scales significantly larger than the protein size, while neutron spin echo reflects the short-time diffusion dynamics, typically faster than 300 ns [18, 19, 20, 21]. Thus, alongside the theoretical challenges of describing long-time diffusion due to the complexity of interparticle hydrodynamics and direct protein interaction, there is also an experimental research gap. Addressing this gap requires methods that can combine molecular-scale sensitivity with the capability to probe collective dynamics on microsecond time scales.
With the advent of high repetition rate X-ray Free Electron Lasers (XFELs), such as the European XFEL (EuXFEL), it becomes possible to bridge this methodological gap. This capability is especially relevant for biological systems, enabling the study of relatively small proteins (on the order of a several nanometers) at high volume fraction exceeding 20 vol%, which has been previously inaccessible. Measuring dynamics in the microsecond range opens the possibility to probe proteins around the interaction time (estimated in the order of few microseconds) and beyond. X-ray Photon Correlation Spectroscopy (XPCS) enables direct access to collective protein diffusion on molecular length scales [22, 23]. XPCS measurements have been demonstrated for measuring protein dynamics, both indirectly with micro-rheology [24], and directly when related to Brownian diffusion [25], cage relaxation [26, 27], liquid-liquid phase separation dynamics [28, 29, 30], gelation processes [31, 32, 33], and nanoscale fluctuations in hydration water [34]. The recent development of Megahertz XPCS (MHz-XPCS) at the EuXFEL has further enhanced the ability to capture equilibrium protein diffusion before the onset of radiation effects using the “correlation before aggregation” approach [35]. This technique offers a powerful tool to address the experimental research gap, enabling detailed investigation of long-time protein diffusion at the molecular scale and microsecond time scales, which we exploit in the present study.
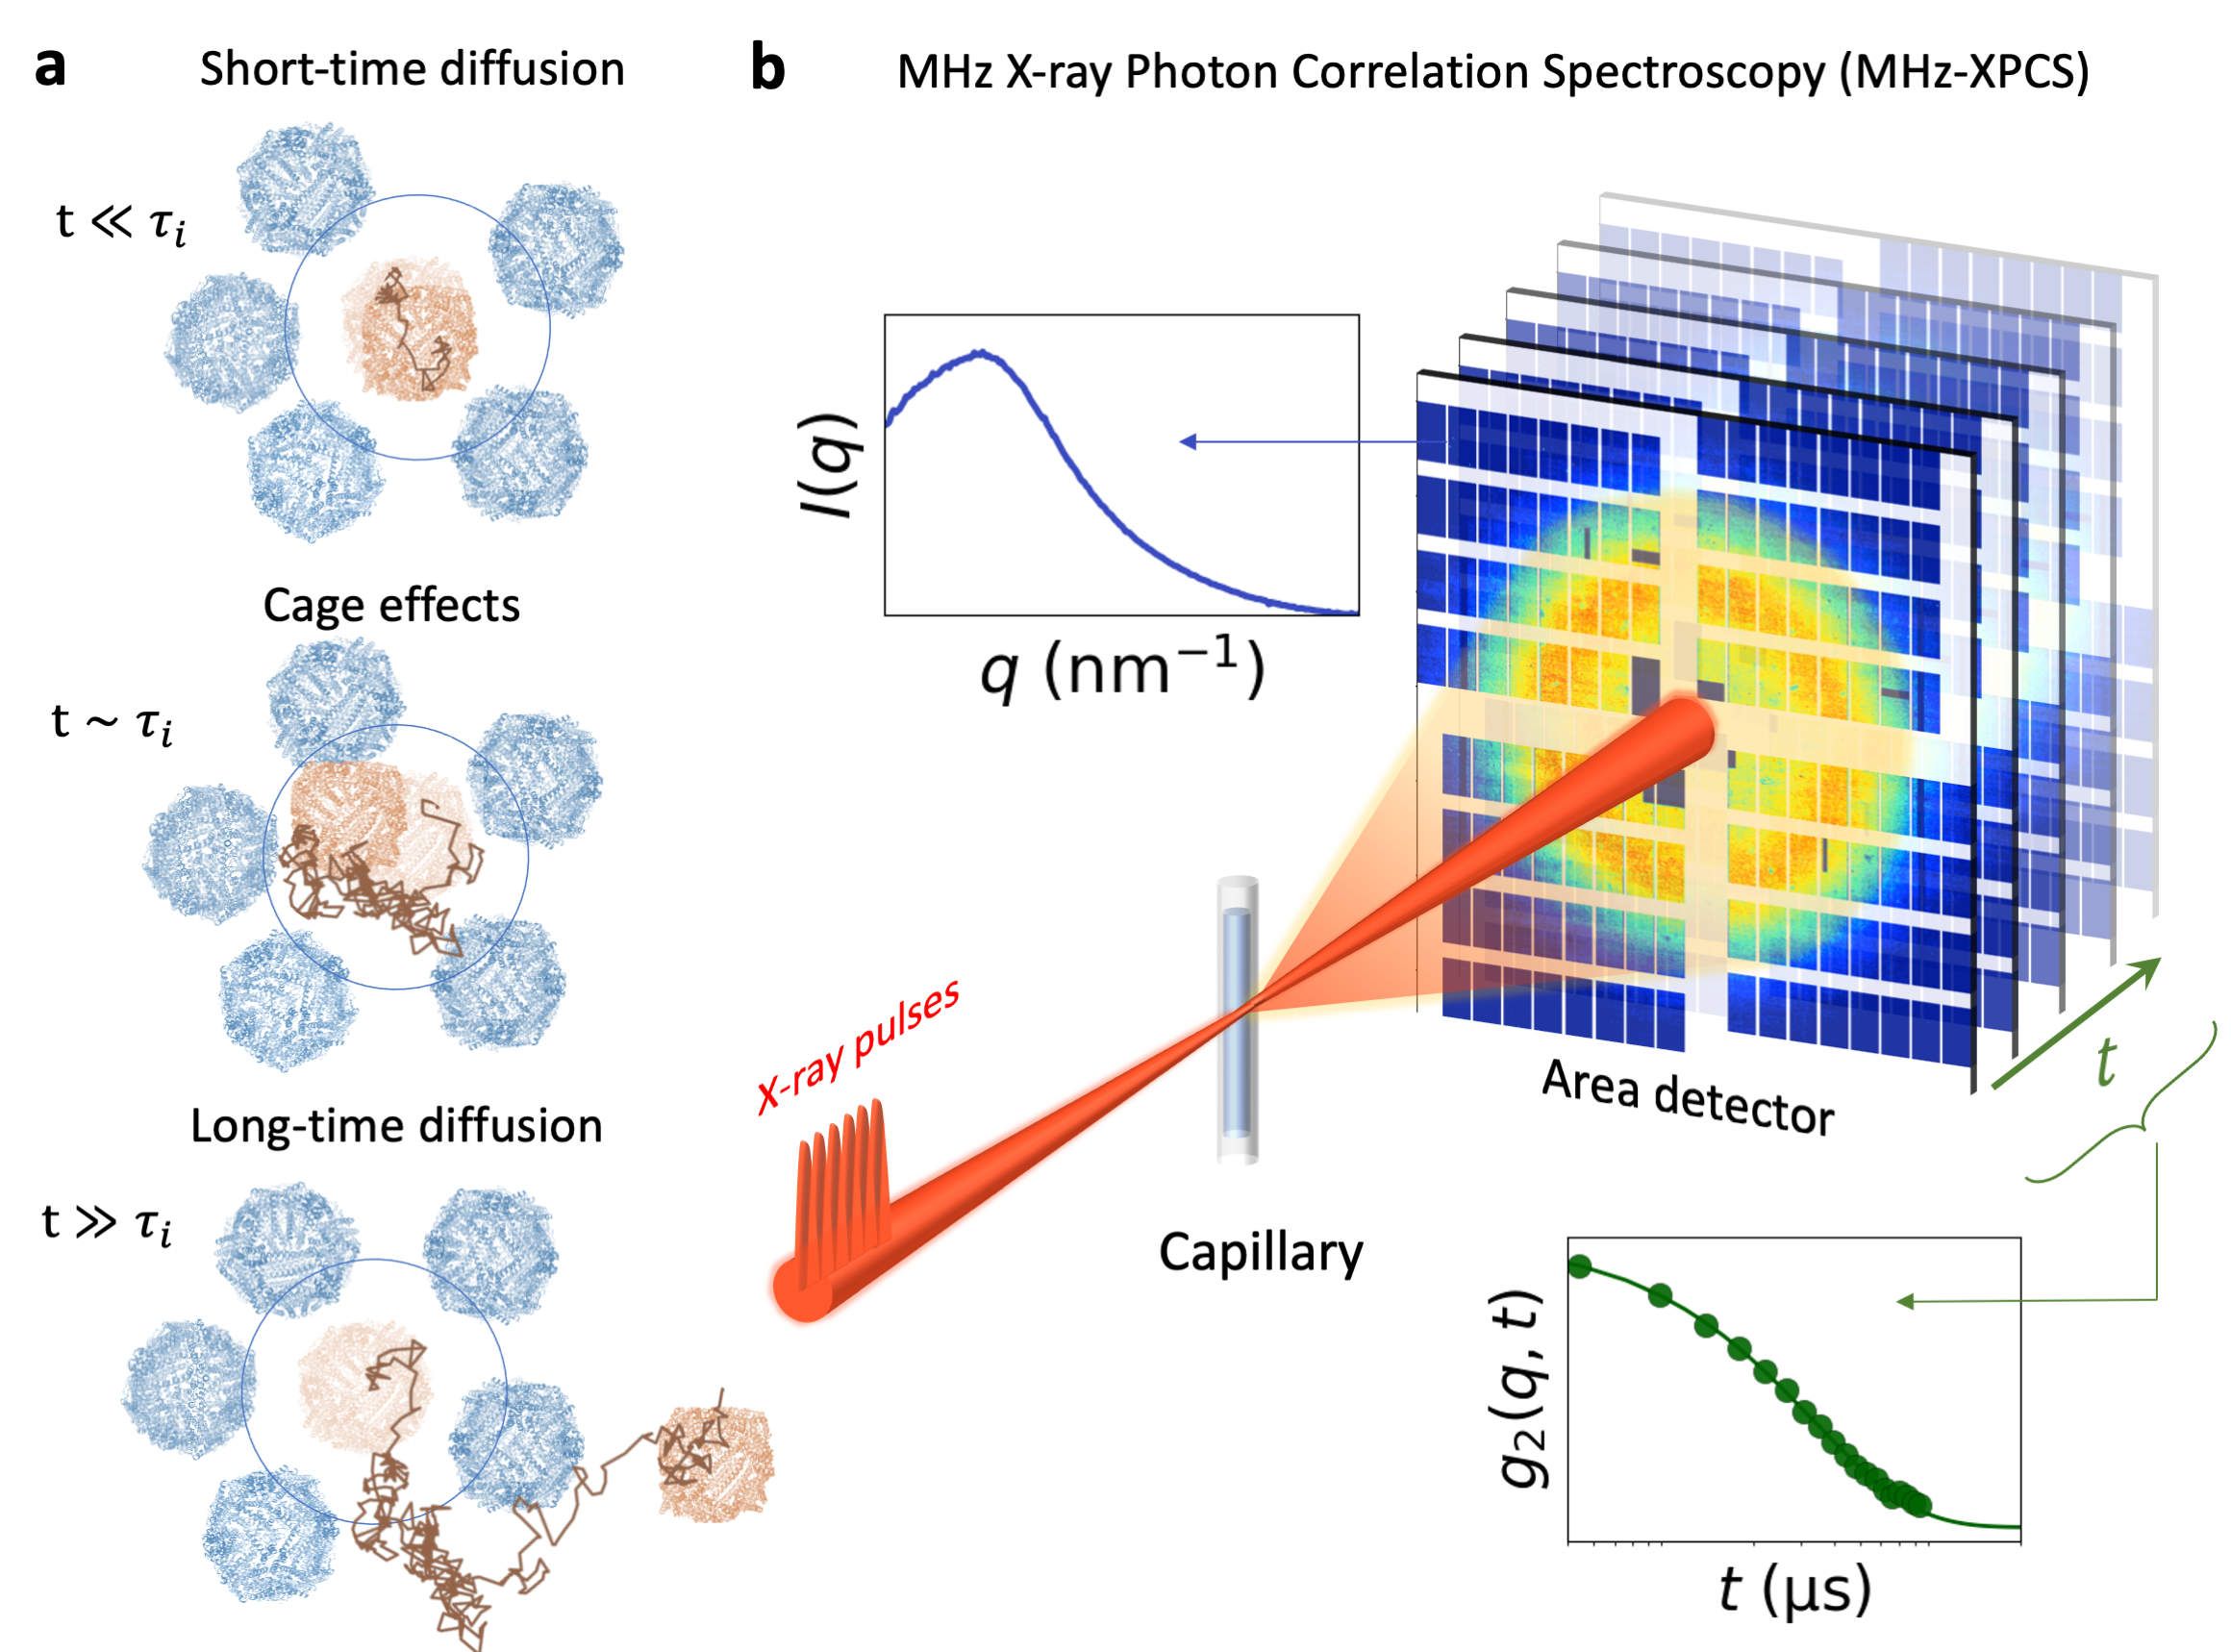
Here, we investigate the short- and long-time molecular diffusion and cage effects in crowded protein solutions using MHz-XPCS at the EuXFEL (see Fig. 1b). The central questions are (i) how does the interplay between the hydrodynamic interactions and the direct interactions influence the long-time protein diffusion, (ii) how does the long-time protein diffusion depend on the momentum-transfer approaching protein molecular length scales, (iii) what are the characteristic signatures and time and length scales associated with the cage effects.
To address these questions, we utilize ferritin, a globular protein known for its non-toxic iron-storing capabilities, which is produced by nearly all living organisms. Ferritin has relevant applications in vaccine development [36, 37], drug delivery [38] and nanomaterials [39, 40]. Structurally, ferritin consists of a protein shell with 24 sub-units arranged in pairs to form a hollow nanocage, with a core enriched in iron ions. This robust and monodisperse system is ideal for dynamic measurements, providing strong scattering signal due to the iron-rich core, which facilitates data interpretation. The expected interaction time for ferritin in water is and for ferritin in water-glycerol (with volume fraction ), calculated using the dilute limit diffusion coefficient as an approximation of and the experimental (see Methods).
Our experimental results indicate that as the protein concentration increases, there is a continuous transition from simple Brownian motion to anomalous diffusion. This transition is characterized by the deviation from single-exponential behavior in the intermediate scattering function, particularly evident at high protein concentrations, where two distinct decay processes become apparent. The hydrodynamic function, , is determined experimentally and serves as a signature of many-body hydrodynamic and direct protein interactions. Modeling based on the -theory of hydrodynamically interacting colloidal spheres in the short-time limit [41, 42, 43] shows quantitative agreement with the experimental results only by accounting for both short- and long-time diffusion.
Results
Scattering intensity and structure factor
The experiments were conducted at the Material Imaging and Dynamics (MID) instrument of the EuXFEL [44], where the protein solutions, contained in capillaries, were measured using a small-angle X-ray scattering (SAXS) geometry with photon energy 10 keV (see Methods). Figure 2a shows the azimuthally integrated intensity, , for various protein concentrations, ranging from 9 mg/ml (volume fraction ) to 730 mg/ml (). A spherical form factor fit to the scattering intensity of the dilute solution ( 9 mg/ml) yields a radius nm (see also Supplementary Section 1), corresponding to the size of ferritin cavity [45]. This result suggests that the SAXS signal predominantly originates from the protein core, which exhibits a higher scattering cross-section at this photon energy compared to the protein shell, due to the high iron content.
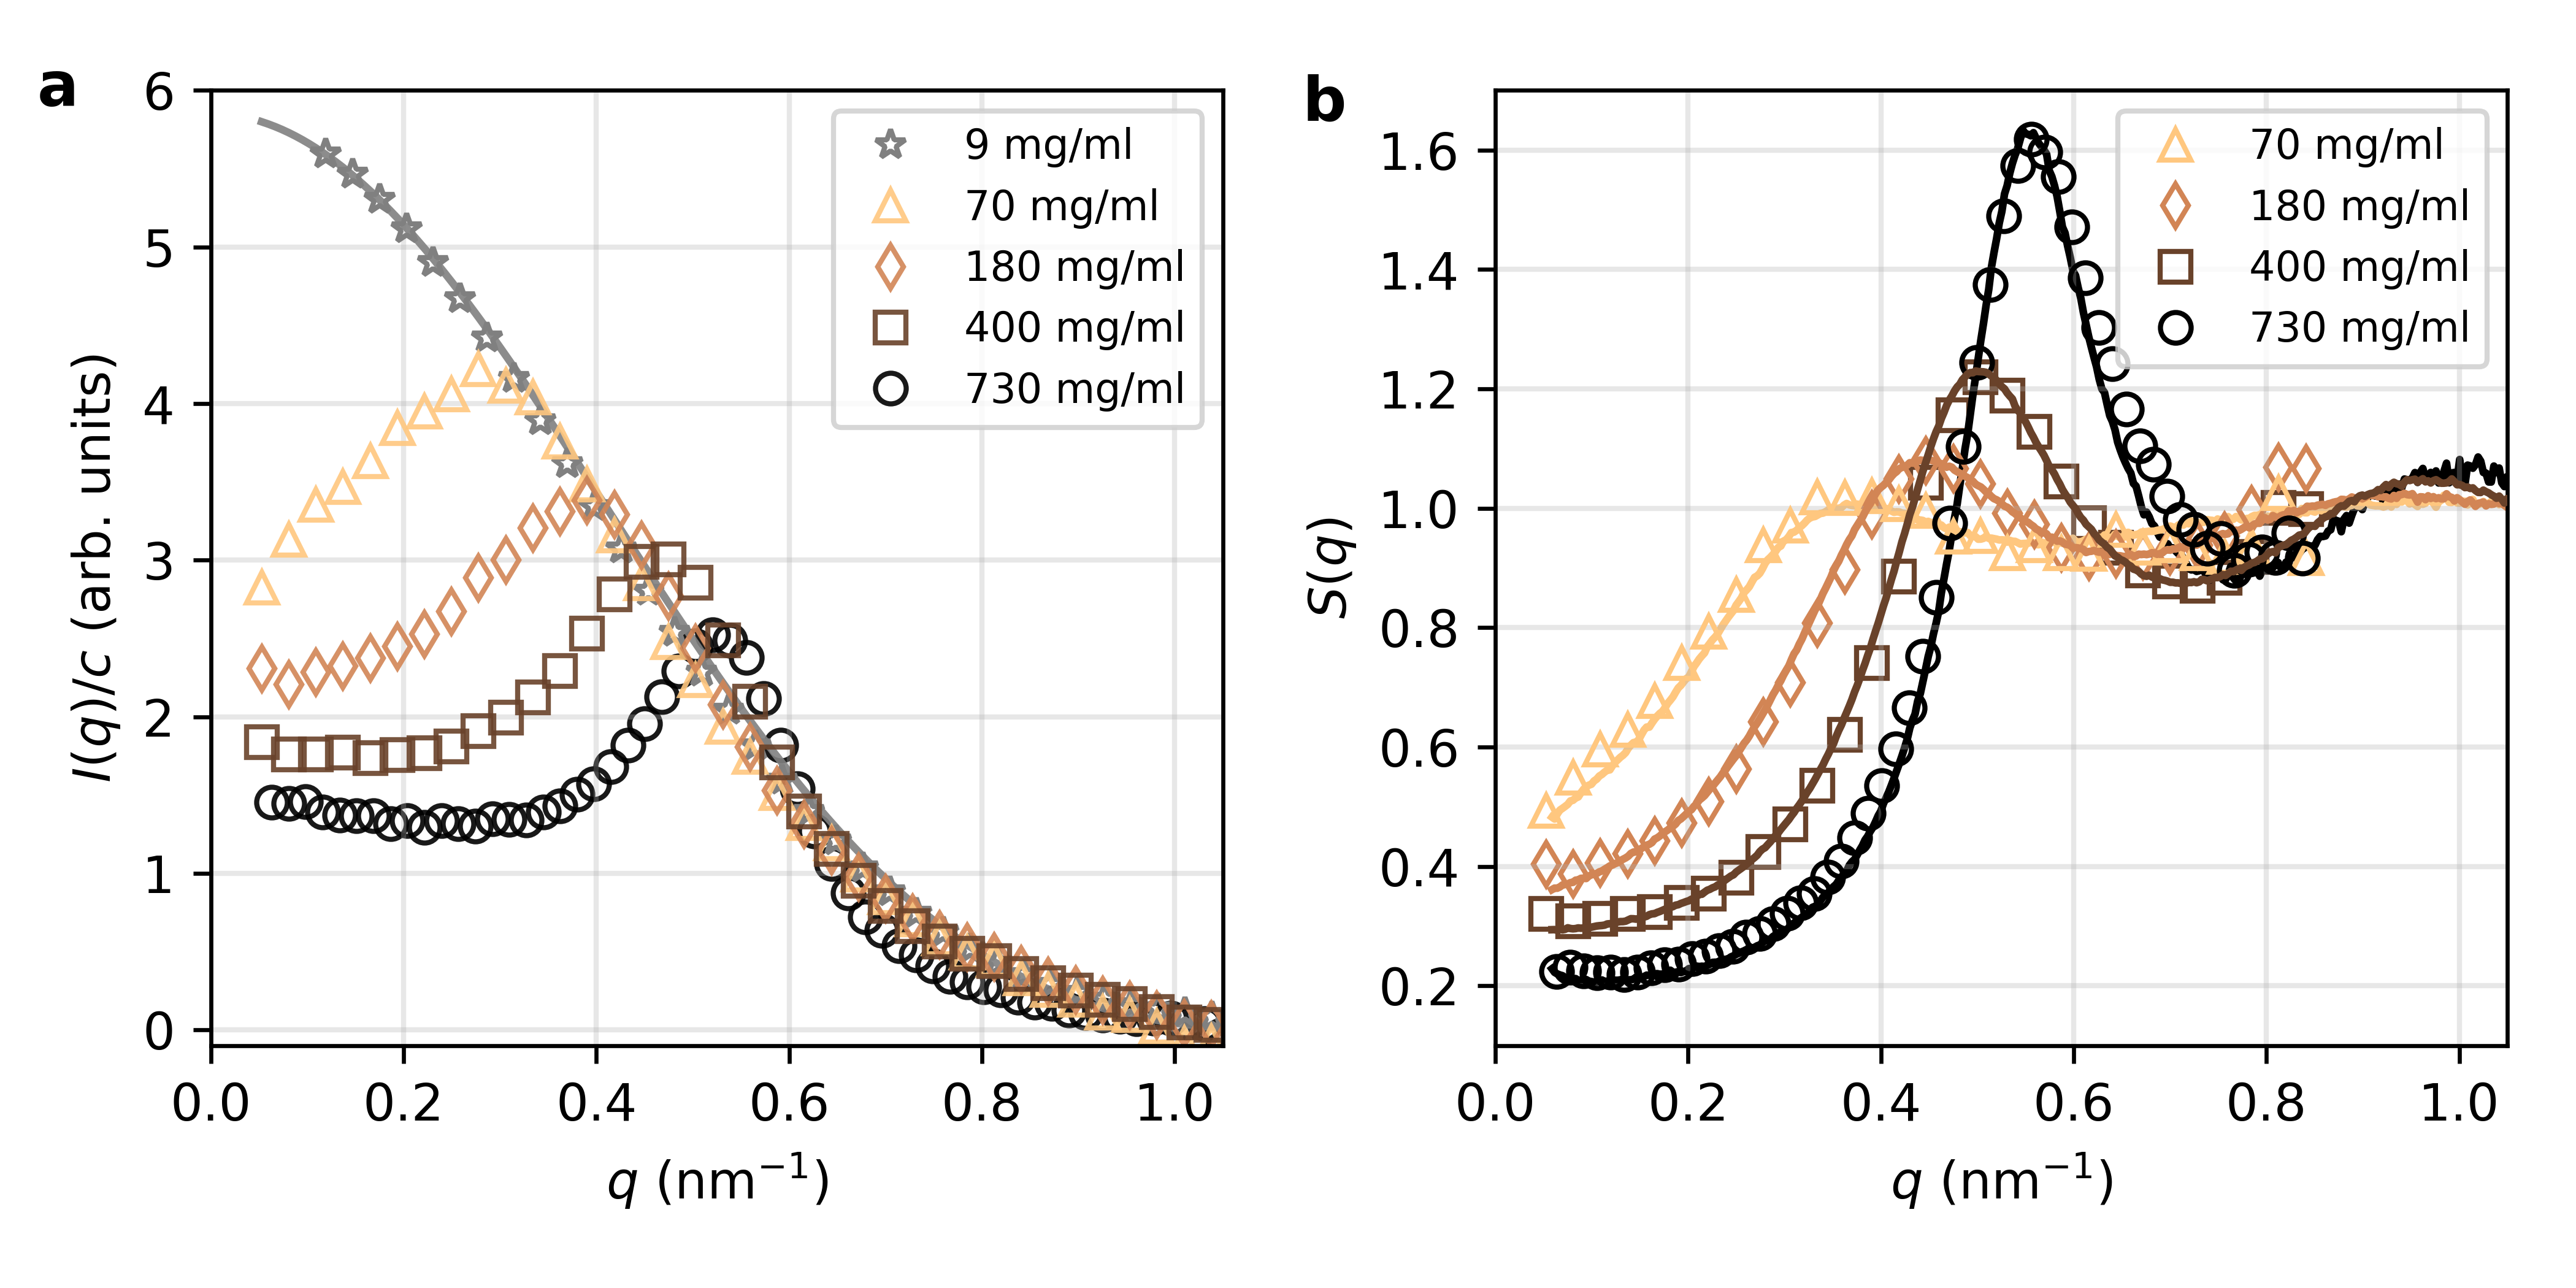
For the more concentrated solutions ( 70, 180, 400 and 730 mg/ml; see Table 2 for specific sample compositions), exhibits correlation peaks that are indicative to the formation of a structure factor , as shown in Fig. 2b (see Methods for details on data analysis). The presence of the peak at reflects interference between proteins, with a correlation length . The values of and are provided in Table 1. As the protein concentration increases, the peak shifts to higher -values, indicating that the inter-protein correlation length, , decreases due to crowding. Additionally, Fig. 2b demonstrates that the measured at the European Synchrotron Radiation Facility (ESRF), beamline TRUSAXS (ID02), is consistent with the obtained at the EuXFEL.
| c (mg/ml) | ||||
|---|---|---|---|---|
| 70 | 0.03 | 0.36 nm-1, 17.2 nm | 0.36 nm-1 | 0.38 nm-1 |
| 180 | 0.08 | 0.45 nm-1, 14.0 nm | 0.44 nm-1 | 0.45 nm-1 |
| 400 | 0.19 | 0.50 nm-1, 12.6 nm | 0.49 nm-1 | 0.49 nm-1 |
| 730 | 0.34 | 0.55 nm-1, 11.5 nm | 0.55 nm-1 | 0.55 nm-1 |
Intensity autocorrelation functions and -dependent diffusion coefficient
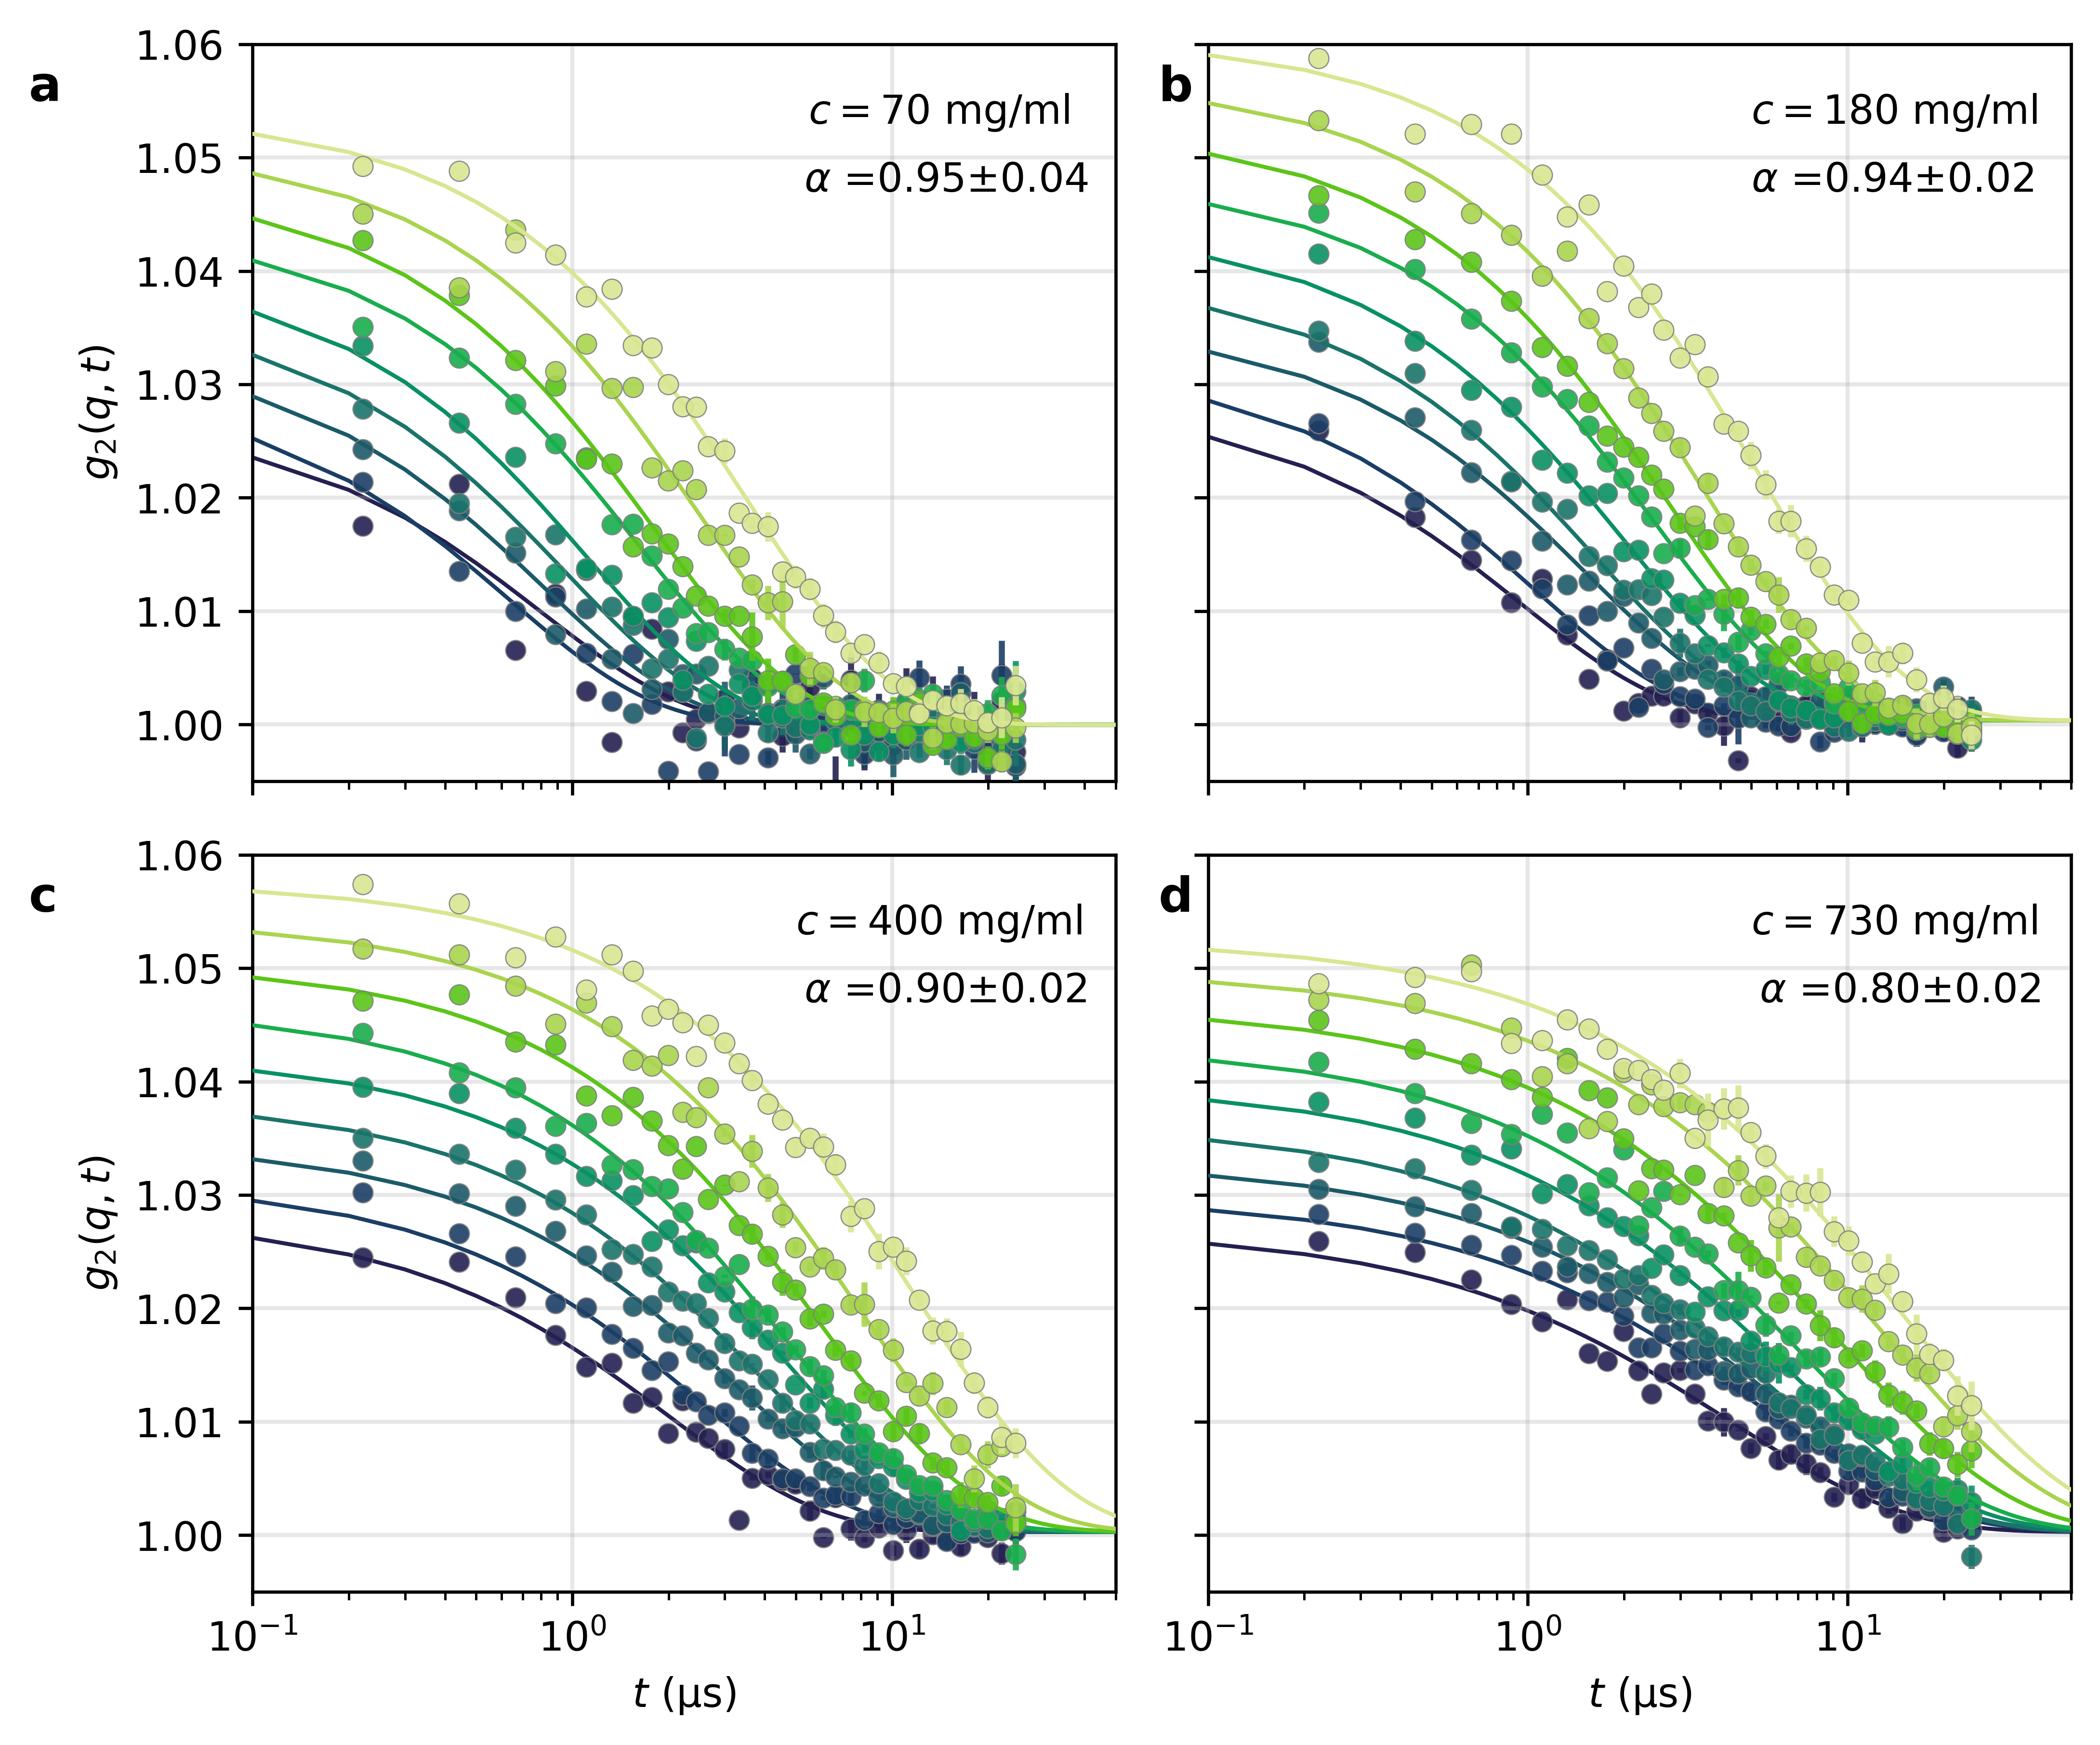
The intensity autocorrelation function, , is shown in Fig. 3a-d (see Methods for definition). The was collected for varying concentrations ( 70, 180, 400 and 730 mg/ml) and -values ( nm-1), as indicated by the color-code. The solid lines represent the stretched exponential fits according to the equation
| (1) |
where is the speckle contrast, modelled as in Ref. [35], is the decorrelation rate and is the Kohlrausch-Williams-Watts (KWW) exponent [46]. As protein concentration increases, we observe an overall slowdown in dynamics and a systematic change of the lineshape from an almost simple exponential decay () at 70 mg/ml to a stretched exponential decay () at higher concentrations. The condition indicates heterogeneous protein motion at elevated concentrations. To account for the varying KWW exponents, we compute the average decorrelation rate [47] , where is the -function.
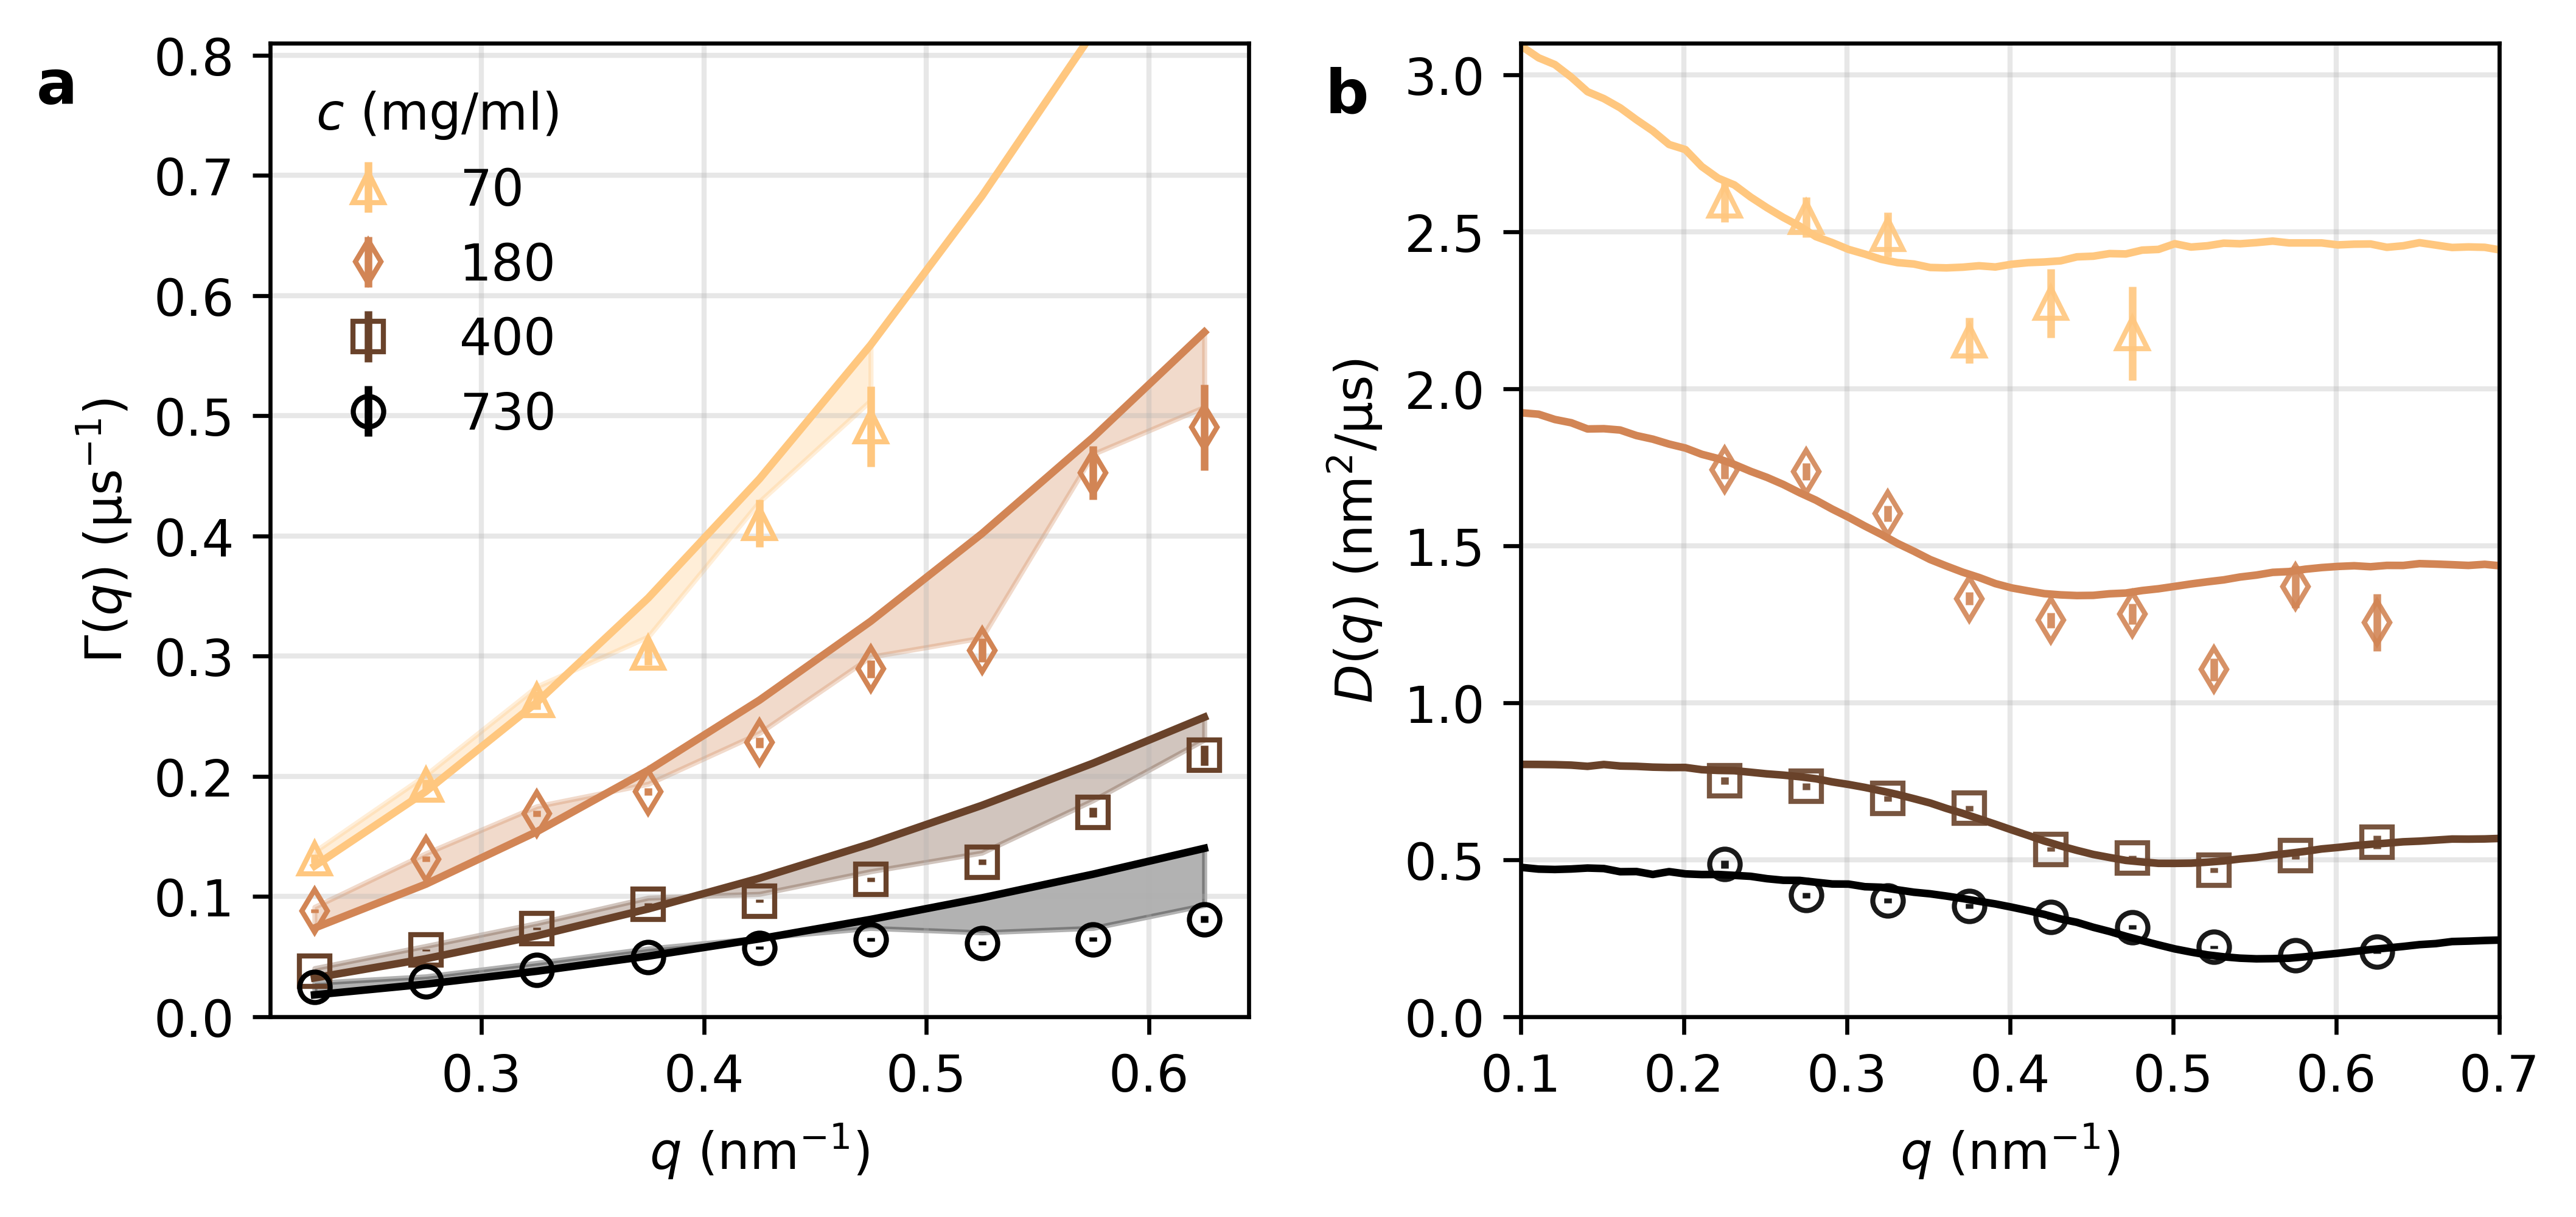
The average decorrelation rate, , is shown in Fig. 4a. The solid lines denote the expected relationship for Brownian diffusion. However, the experimental data deviate from this behavior, as highlighted by the shaded regions. To quantify these deviations, we calculate the -dependent diffusion coefficient, , shown in Fig. 4b. The diffusion coefficient decreases as a function of , reaching a minimum at , which coincides with (see Table 1). This modulation in is due to the De Gennes narrowing [48], observed in a variety of systems [49, 50, 51, 52, 53, 54], including apoferritin [55, 56, 19]. Thus, the observed indicates that collective protein motion is hindered (i.e. slowed down) by the neighbouring proteins, at length scales approaching the correlation length .
Hydrodynamic function and self-diffusion coefficient
In the short-time limit, the diffusion coefficient can be linked to the hydrodynamic interactions by computing the hydrodynamic function [14], defined as:
| (2) |
where is the diffusion coefficient in the dilute limit and the structure factor. Since there is no theoretical description beyond the short-time limit, we use Eq. 2 to estimate the hydrodynamic function, even though the time scale probed exceeds the interaction time and thus can be influenced also by long-time diffusion.
The hydrodynamic function can be expressed as a sum of two contributions via [42]
| (3) |
where is the -dependent term determined by protein-protein hydrodynamic interactions and the spatial arrangement of the proteins in the solution, i.e. the , while is a -independent term, related to the protein self-diffusion by . At length scales much smaller than the typical protein-protein correlation length (), the contribution from is negligible and thus .
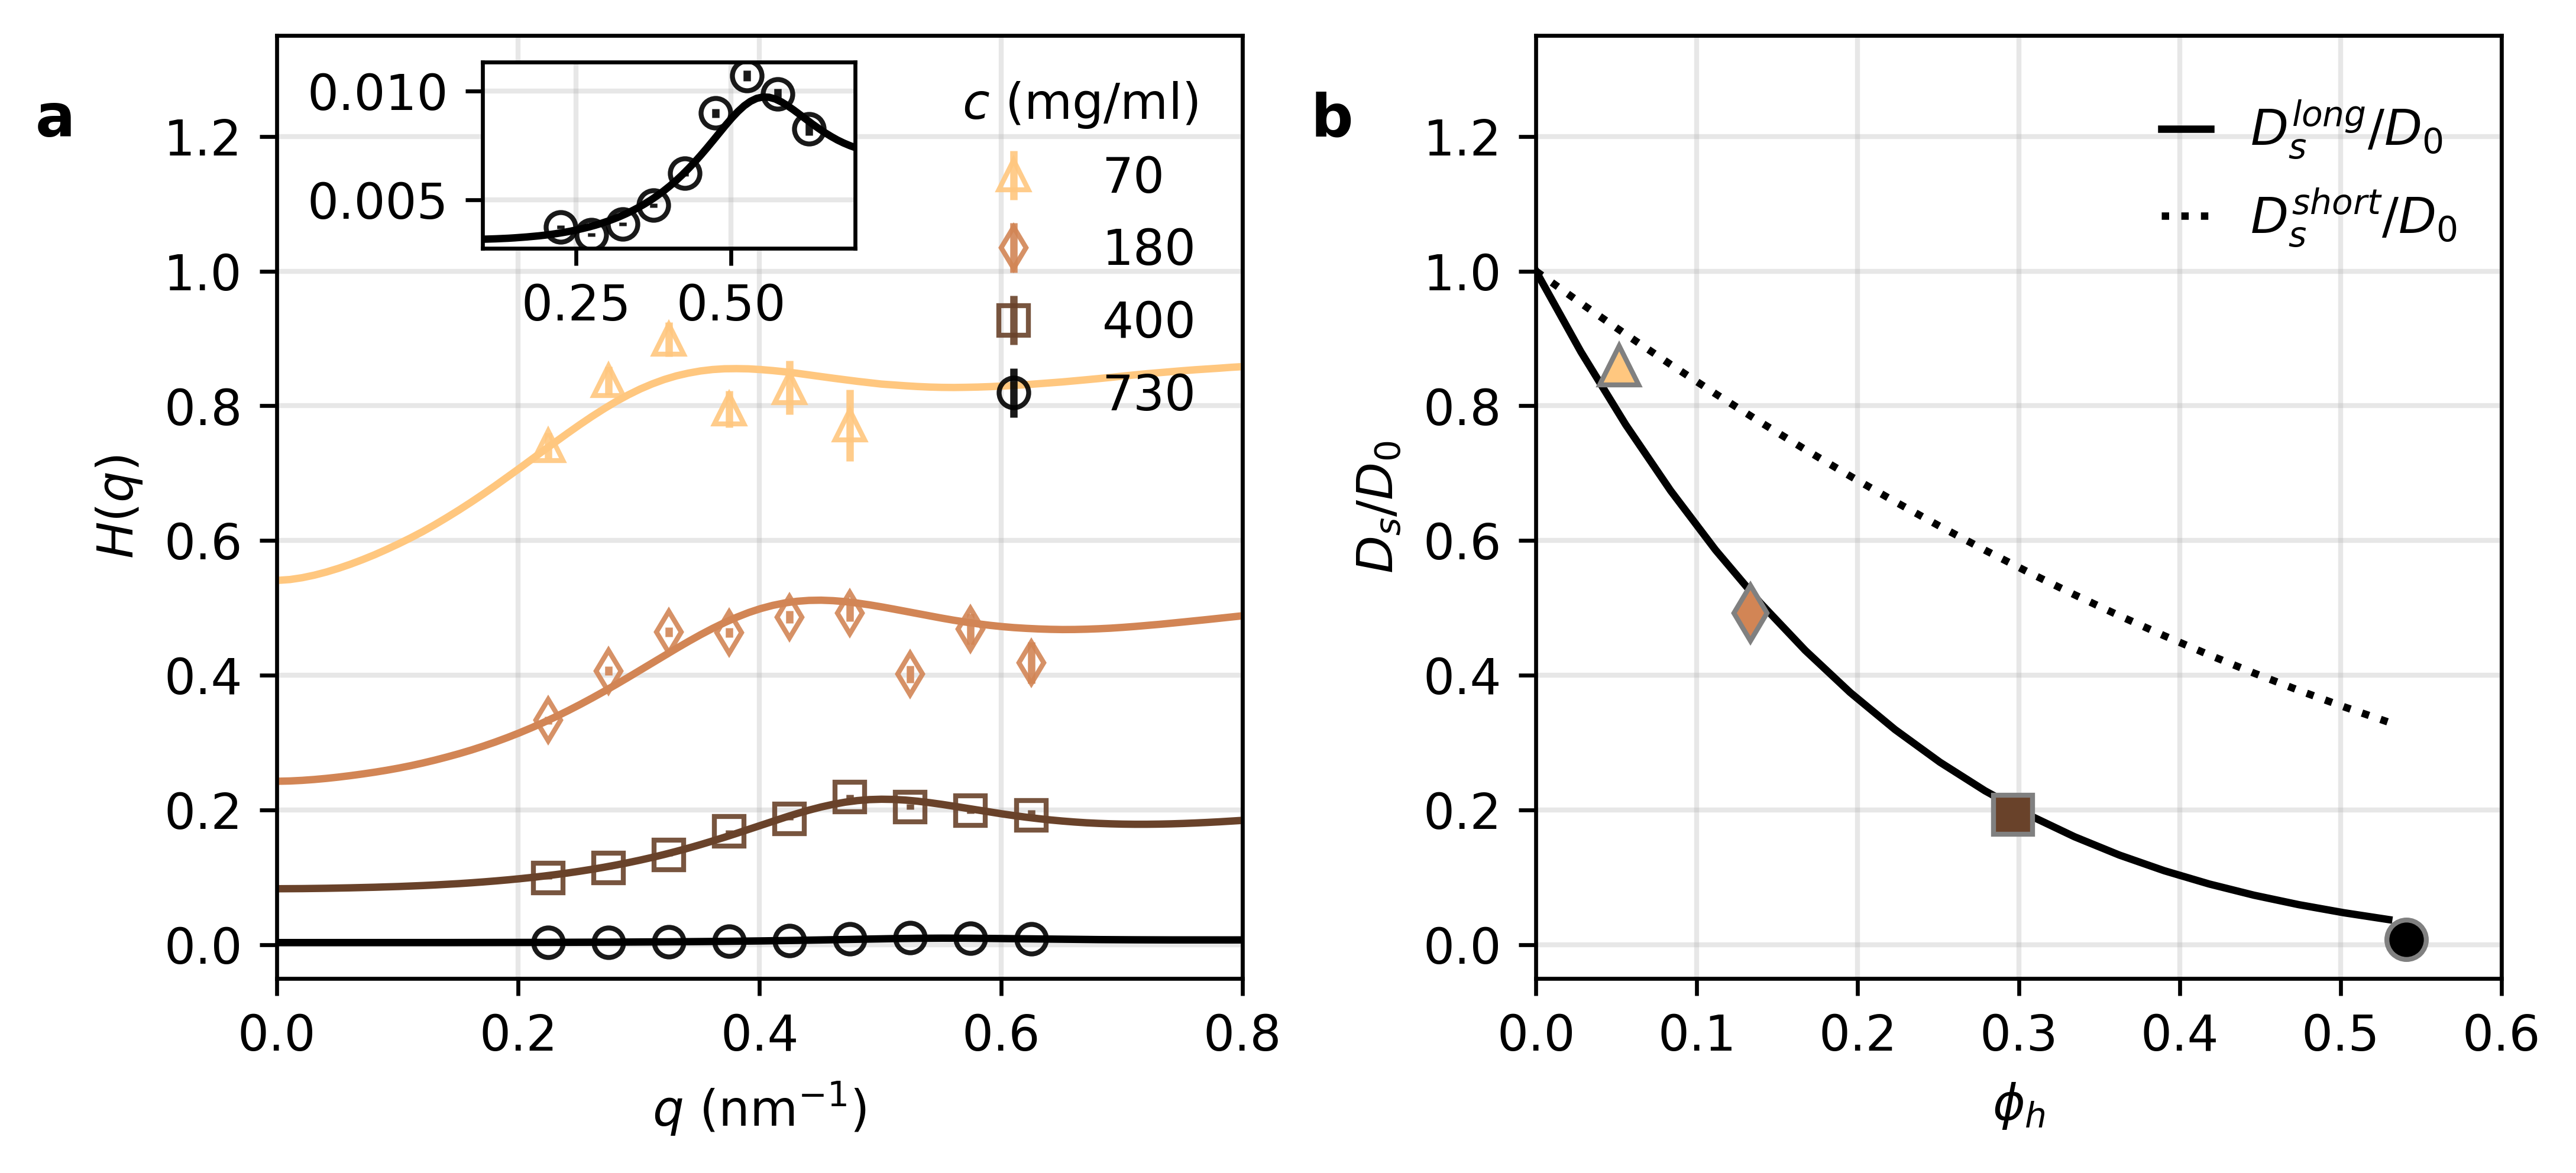
Figure 5a shows the experimental for different ferritin concentrations ( 70, 180, 400 and 730 mg/ml) using Eq. 2. Here, was determined from the SAXS data (shown in Fig. 2b) and from the DLS data (see Methods and Supplementary section 3). The value of was corrected to account for the beam heating effect (approximately 1 K as detailed in Table S1). The hydrodynamic function exhibits maxima at in agreement with the values listed in Table 1. At increased protein concentrations, the overall magnitude of decreases due to the reduction in the self-diffusion and enhanced hydrodynamic interactions.
Modelling based on the -theory
The hydrodynamic function was modelled using the colloid -theory [58, 41, 42, 14]. This theory accounts for many-body hydrodynamic interactions of spherical particles in suspension in the short-time limit and uses as input, as described in the Methods section. Figure 5a shows the model results (solid lines), including a scaling factor that was fitted to the experimental data (see Supplementary Section 5). The model demonstrates good agreement with the experimental values within the measured -range. The extracted as a function of the hydrodynamic volume fraction is shown in Fig. 5b. The hydrodynamic volume fraction is , where is the protein hydrodynamic radius ( 7.25 nm obtained by DLS, see Methods) and the protein radius ( 6.25 nm based on the structure reported in Ref [59]).
Alternatively, the hydrodynamic volume fraction dependence of can be modeled independently [60] by the expression
| (4) |
as shown in Fig. 5b (dashed line). This formula, which assumes that refers to the short-time self-diffusion, appears to overestimate in comparison to the experimental values extracted by fitting . Such deviations from colloid theory has been observed for various protein systems, including myoglobin [18], hemoglobin [20], and crystalline [21]. In the case of hemoglobin [20], this discrepancy was partially explained by accounting for the hydrodynamic volume fraction, . Here, implementing the correction is insufficient to explain the discrepancy seen for ferritin, where the is included in Fig. 5. Another possible explanation for an overestimation of the by the theory is the presence of patchy interactions (non-isotropic protein specific interactions) [21], which is presumably not the case for ferritin given the repulsive interactions visible in the lineshape, characterized by the reduction in the with increasing concentration, and the presence of a strong correlation peak [16, 17, 61].
At the observed time scales, it is possible that is influenced by a combination of short- and long-time diffusion as observed previously by fluorescence recovery after photobleaching (FRAP) experiments [57, 62]. To explore this hypothesis, the long-time self-diffusion coefficient is approximated by [62, 63]
| (5) |
The short-time self-diffusion coefficient, , contains the hydrodynamic interactions, but not the direct protein interactions (i.e. electrostatic and nonspecific attractive interactions). The latter are included in [64], where is the contact value of the pair-correlation function, which was estimated approximating the protein interactions as hard spheres (where ). This model appears to better describe the volume fraction dependence of the , as shown in Fig. 5b (solid line). Therefore, the experimental data indicate that the steep decline of with increasing is likely due to the component, which becomes dominant with increasing volume fraction.
Cage effects and long-time diffusion
To investigate the origin of the heterogeneous dynamics indicated by for high protein concentrations, we calculate the intermediate scattering function, , related to the by the Siegert relation,
| (6) |
For Brownian diffusion, the is expected to be a simple exponential function, meaning that depends linearly on time. Figure 6a shows for different protein concentrations, where the dotted line corresponds to a linear fit over the first . We observe that for 70 mg/ml, the data follow closely the single exponential fit, while deviations from single exponential behavior become apparent at higher concentrations. Notably, at 730 mg/ml, a distinct slope is observed at time scales longer than . This deviation is evident for all measured values, as shown in Fig. 6b, and becomes more pronounced when is normalized by the slope of the linear fit over the first , as seen in Fig. 6d. This observation suggests the presence of two components in the decay.
Using a a double exponential fit, we extract the diffusion coefficients of the two components, by:
| (7) |
where and correspond to fast and slow decorrelation rates and represents the relative amplitude of the slow component. Figure 6c shows the diffusion coefficients, and , obtained from the decorrelation rates of the double exponential fit. and exhibit similar -dependence and minima for in agreement with the behavior of the at lower concentrations, shown in Fig. 4. At mg/ml, the ratio is .
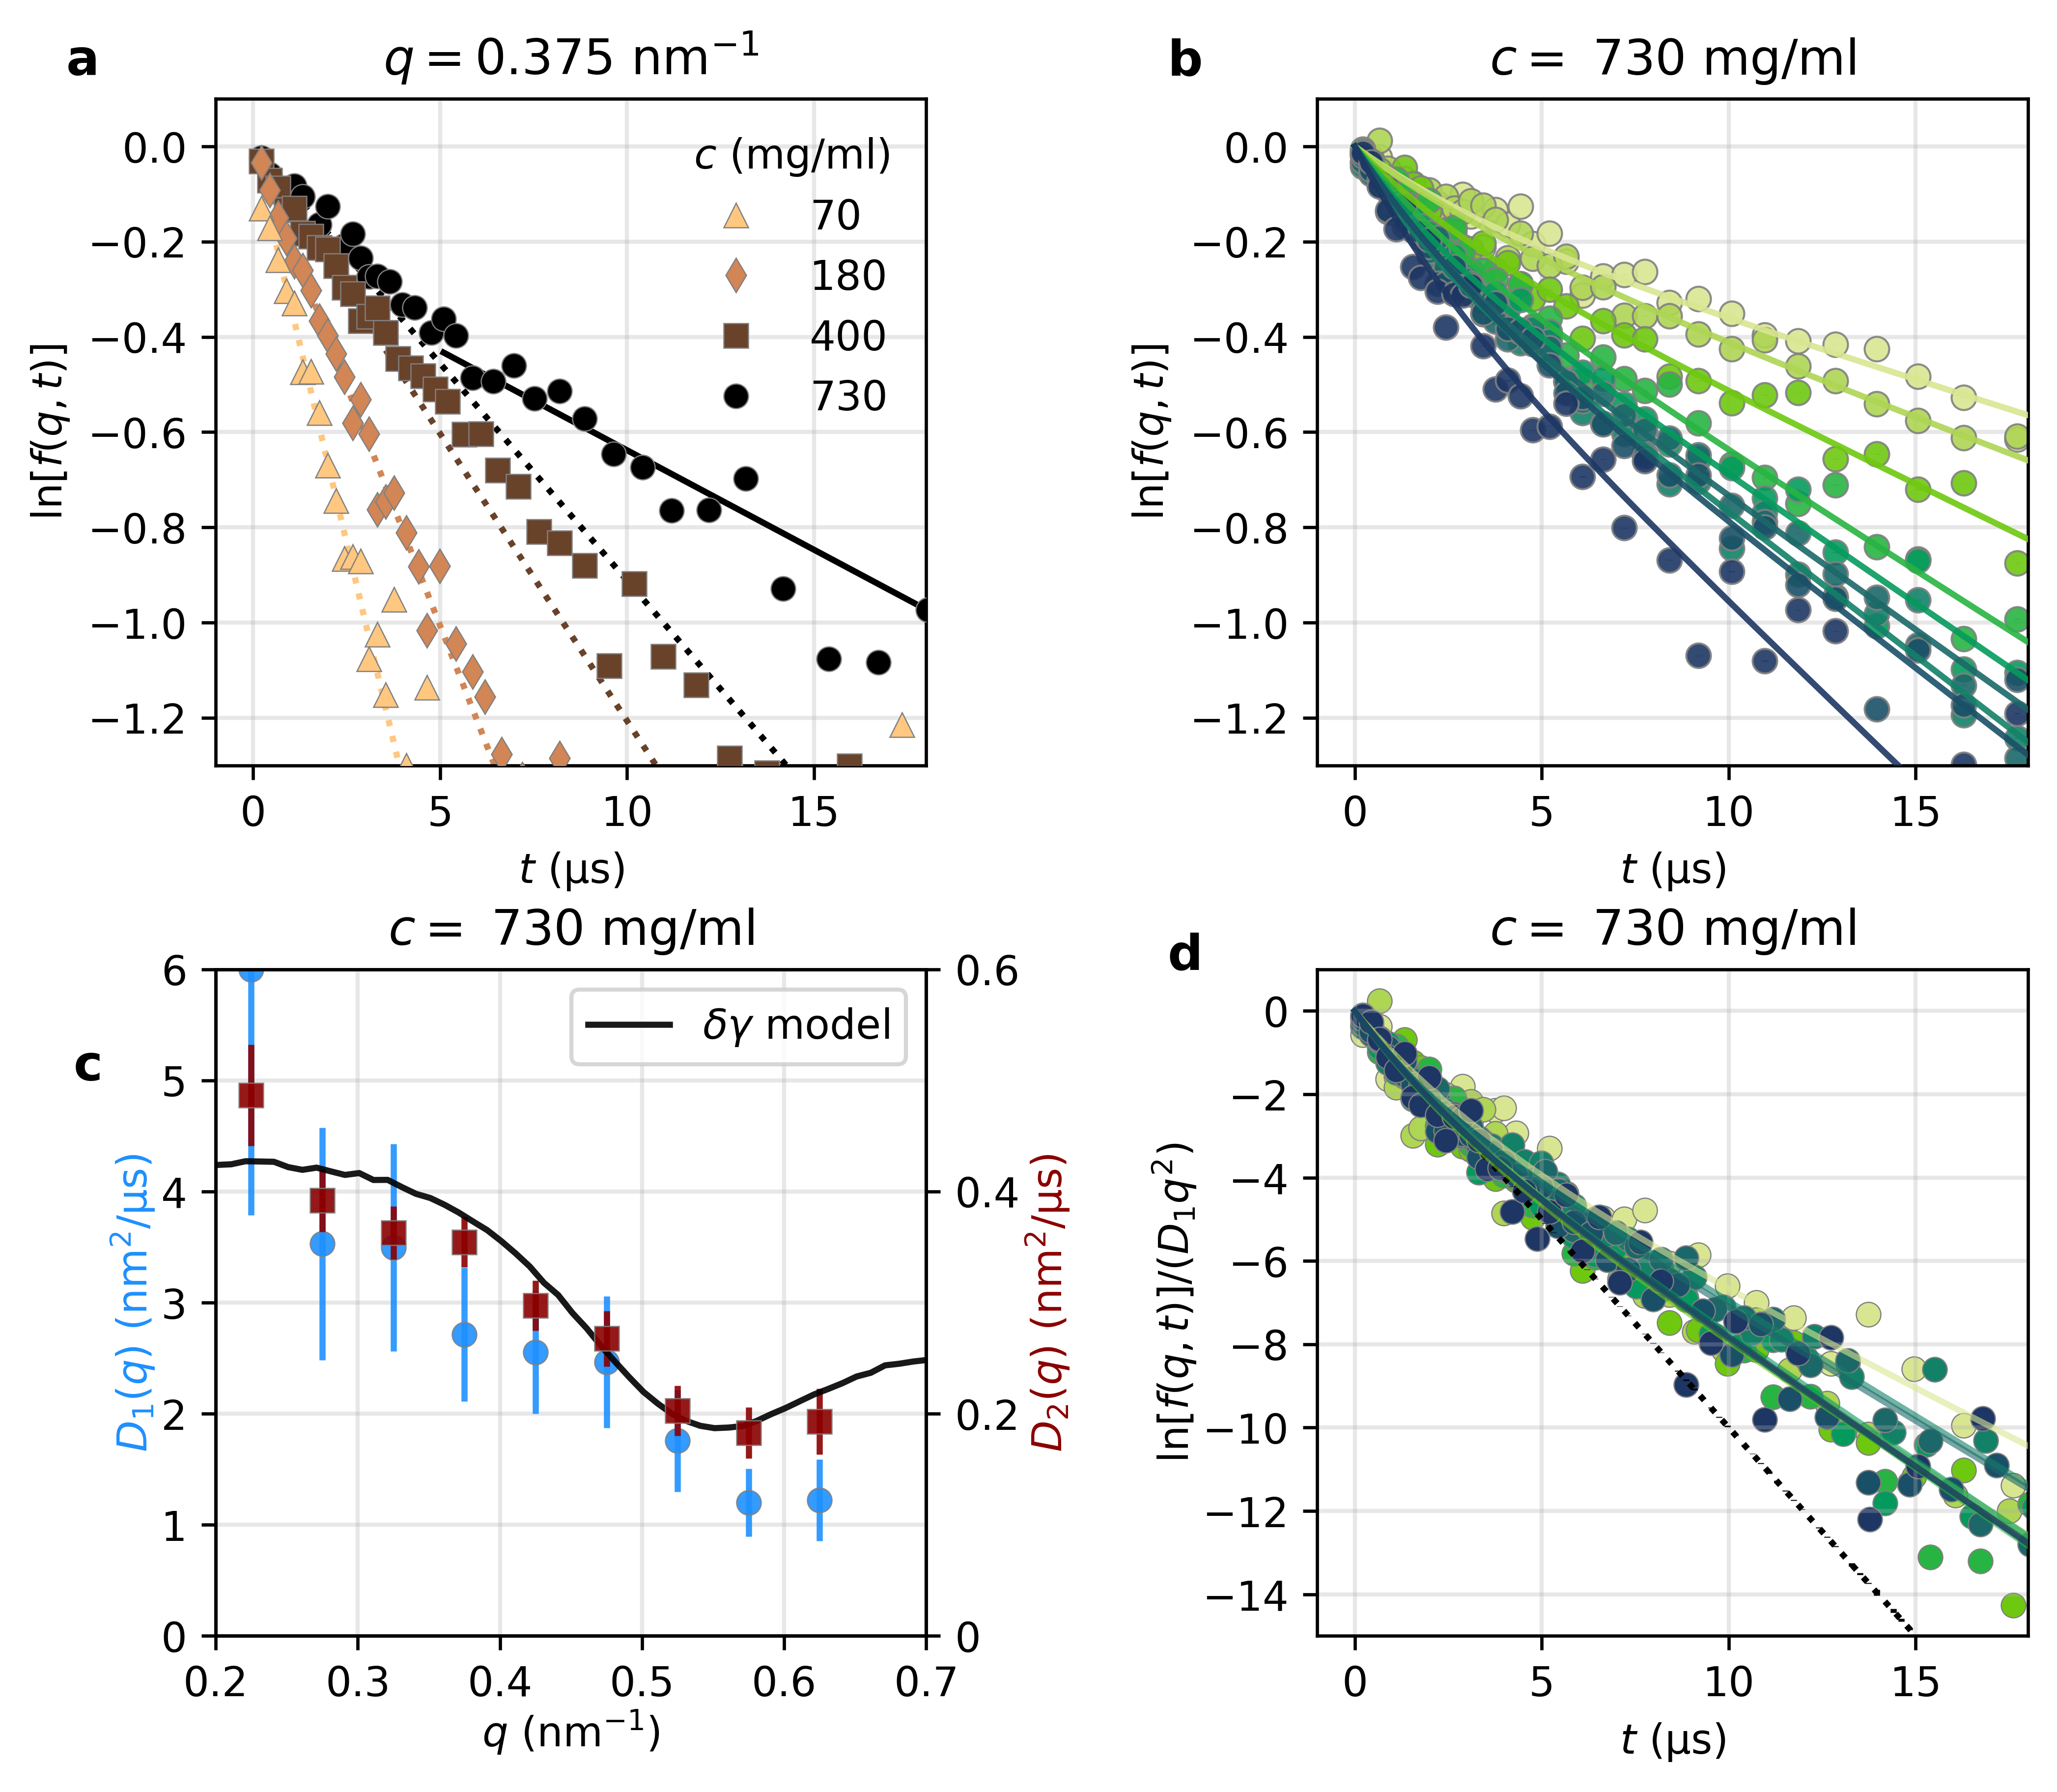
One possibility is that the slow component is due to aggregates with size times larger than a single protein (based on ), predicting a correlation peak at nm-1. However, in the data (Fig.2b) we do not see any enhancement at low , which would indicate such a peak. Alternatively, the two decays represent short- and long-time diffusion. From , we estimate which yields an interaction time of = . This value corresponds to the cross-over time between the two exponential functions, supporting the hypothesis that the double exponential decay arises from short- and long-time diffusion. It is noteworthy, that estimating the interaction time based on the Stokes-Einstein equation in the dilute limit for ferritin in water yields , whereas in crowded conditions is times larger. This calculation implies a significantly slower reaction rates than those predicted from simple Stokes-Einstein estimations, even at molecular length scales.
The lineshape of and coincides with the prediction from the -theory, as shown in Fig. 6c (black line). Since hydrodynamic forces influence both diffusion coefficients, while direct interactions are relevant only in the long-time diffusion, we conclude that hydrodynamic forces act similarly on the short- and long-time diffusion and the direct interactions do not provide additional -dependent changes on the diffusion coefficient. These results are also in agreement with studies performed on larger colloidal particles [65, 66, 67], where the short- and long-time diffusion coefficients, and , were shown to have the same lineshape at . This finding indicates that for the investigated system at , the direct interactions, relevant only for the long-time diffusion, do not influence the -dependence of . Consequently, hydrodynamic functions can be effectively extracted from long-time diffusion, disentangling the contributions of direct forces and hydrodynamic interactions (see also Supplementary Section 5).
Additionally, the relative amplitude of the two decays, , provides insight into protein motion. It is given by:
| (8) |
reflecting the loss of correlation due to an Debye–Waller-like movement around a central position, with average displacement and percentage of particles involved [68]. For this system, = 90 3% and nm indicating that that the majority of protein molecules participate in cage formation, with an average displacement of 1.2 nm. This finding suggests that protein rattling within the cage occurs only within a fraction of their radius due to the limited available space at high concentrations. This result aligns with the expected reduction in cage size due to confinement with increasing volume fraction, approaching the glass transition [12, 69].
Discussion
In summary, we present results from MHz-XPCS experiments conducted at the EuXFEL, complemented by modelling based on colloid theory, focusing on concentrated ferritin solutions. A key advantage of this experimental approach is its ability to capture the long-time protein diffusion at length scales comparable to the average protein-protein distance in crowded conditions. In contrast to short-time diffusion, there are no theoretical predictions for long-time diffusion that adequately account for hydrodynamic interactions and direct interactions.
Our results reveal anomalous diffusion in highly concentrated ferritin solutions, which becomes more pronounced with increasing protein concentration. From the momentum-transfer dependent diffusion coefficient, , and the corresponding structure factor, , we extract the hydrodynamic function , which quantifies contributions from many-body hydrodynamic interactions. Modeling based on the -theory of hydrodynamically interacting colloidal spheres [41, 42] shows good agreement with the experimental when a scaling is applied. Notably, the intercept, related to the ratio of the self- over the dilute-limit diffusion coefficients, , decreases with volume fraction much more rapidly than expected for purely short-time diffusive motion. This finding indicates that both short- and long-time diffusion contribute to self-diffusion, with the long-time diffusion becoming more significant as the protein concentration increases.
Further evidence for the coexistence of short- and long-time diffusion comes from the analysis of the intensity autocorrelation function, . The exhibits a double exponential decay with increasing protein concentration, which is especially pronounced at the highest concentration, 730 mg/ml. The data suggest that the short- and long-time diffusion coefficients, and , exhibit nearly identical -dependence differing only by a scaling factor, as previously observed in colloidal suspensions [65]. This finding indicates that long-time diffusion is governed by both hydrodynamic effects and direct interactions. We observe that the latter contribute to an -independent decrease of the diffusion coefficient for . At the highest concentration ( 730 mg/ml), cage effects are observed with an average displacement of nm, indicating that cage-trapping occurs within a fraction of the protein radius due to confinement. These effects can explain quantitatively the observed anomalous diffusion but also provide a molecular mechanism for the reduced mobility of proteins under crowded conditions.
From a broader perspective, our findings can facilitate biomedical applications involving ferritin as a nano-drug delivery system [38] and nano-reactor [70], as in sustained-release preparations the accurate determination of the anomalous diffusion coefficients can significantly influence the bioavailability profile. Future work that builds on the results presented here has the potential to focus on environments more closely resembling biological conditions, by introducing crowders of different sizes (e.g., polymers, proteins, polysaccharides) in order to explore the effects of polydispersity on long-time diffusion [71].
Methods
Sample Preparation
Protein solutions of different concentrations were prepared in steps, starting from centrifuging the parent protein saline solution and followed by dilution with glycerol. Ferritin from equine spleen solutions (Sigma-Aldrich, F4503) was used as the parent solution, with an initial protein concentration of mg/ml and NaCl content of 150 mM. This parent solution was centrifuged at g for 1 hour using 10 kDa Millipore filters, resulting in a concentrated ferritin solution of approximately mg/ml, as determined by UV-Vis spectroscopy at nm [72]. This concentration was estimated using a calibration curve based on samples of known concentration.
The concentrated ferritin solution was subsequently diluted with glycerol and water to achieve protein concentrations 70, 180, 400 mg/ml (with 55 vol glycerol). As the protein concentration decreased, the NaCl concentration also decreased, as the diluting solvent did not contain NaCl. These solutions were filled in quartz capillaries with an outer diameter of 1 mm and a wall thickness of 20 m. The volume fraction is calculated from the protein concentration, , using the equation , where 0.465 ml/g is the specific volume of the protein [73], which is the inverse of the protein density. A summary of the samples and their composition is shown in Table 2.
| (mg/ml) | (mM) | |
|---|---|---|
| 70 | 0.55 | 15 |
| 180 | 0.55 | 35 |
| 400 | 0.55 | 80 |
| 730 | 0 | 150 |
X-ray experimental parameters
The data were acquired at the MID instrument [44] of the EuXFEL in small-angle X-ray scattering (SAXS) configuration using a pink beam with a photon energy of 10 keV. The X-ray pulses, with a intra-train repetition rate of 4.5 MHz (221.5 ns pulse spacing), were delivered in trains of up to 310 pulses, with a inter-train repetition rate of 10 Hz. The Adaptive Gain Integrating Pixel Detector (AGIPD) [74, 75] was positioned at a sample-detector distance of 7.687 m. The X-ray beam was focused to a diameter of 12 1 m and the X-ray bandwidth was 710-3, determined by fitting the speckle contrast. This beam size, achieved using compound refractive lenses (CRL), was chosen to enhance both the speckle contrast and the signal-to-noise ratio (SNR) of the XPCS measurements [76]. X-ray intensity was adjusted by chemically vapor deposited (CVD) diamond attenuators of variable thickness to minimise beam-induced effects while maintaining high SNR (see Table S1). To refresh the sample volume between trains, the sample was moved through the X-ray beam at a translation motor speed of , as described in Ref. [35]. Table 3 summarises the experimental parameters for the EuXFEL measurements, along with the SAXS experimental parameters at ESRF (beamline ID02).
| Parameter | EuXFEL (MID) | ESRF (ID02) |
|---|---|---|
| Photon energy (keV) | 10.0 | 12.23 |
| Frame rate | 4.5 MHz/10 Hz (intra-/inter-train) | 10 Hz |
| Beam size (m2) | ||
| Sample environment | 1mm quartz capillaries | 1mm quartz capillaries |
| Detector | AGIPD | EIGER2 4M |
| Pixel size (m2) | ||
| Sample-detector distance (m) | 7.687 | 1.48 |
Brownian diffusion coefficient and hydrodynamic radius
The protein diffusion coefficient, , was measured at dilute conditions ( 9 mg/ml) using DLS (see Section 4 of Supplementary Information). For ferritin in water-glycerol (55 vol% glycerol), we obtained 4.28 while for ferritin in water the diffusion coefficient is 30.1 . The hydrodynamic radius, , was calculated using the Stokes-Einstein equation, , where is the viscosity, the temperature and the Boltzmann constant. Here, by using [77] and 298 K, we estimated nm . This value is comparable to literature values of apoferritin (hollow shell without the core) in saline solutions obtained with DLS ( nm [16], nm [17]) and HYDROPRO ( nm) [78]. The slightly larger obtained here could be due to the presence of the iron (ferritin vs apoferritin), which may influence the protein hydrodynamic radius as surrounding hydration layer. For ferritin solutions, the nm obtained by DLS [79] is consistent with our estimation.
SAXS data analysis
The protein scattering intensity, , was determined by subtracting the background scattering intensity, (scattering from the capillary containing only the solvent), from the measured scattering intensity, :
| (9) |
The scattering intensity, , of mono-dispersed spherical proteins is modelled by
| (10) |
where is the scattering contrast between the protein and the solvent, the protein concentration, the structure factor, and the form factor. The was determined experimentally by measuring the scattering intensity in the dilute limit, , where . Here, is estimated using low concentration sample ( mg/ml). The experimental was then calculated as follows:
| (11) |
where is a normalization constant. More detailed are provided in section 1 of the Supplementary Information.
Intensity autocorrelation function calculation
The function was calculated starting from the two time correlation function (TTCs), which represent the correlation between speckle images taken at times and at momentum transfer :
| (12) |
where indicates averaging over all pixels with the same momentum transfer, . The functions were analyzed with the MID data processing pipeline embedded to the DAMNIT tool of the EuXFEL data analysis group (https://damnit.readthedocs.io/en/latest/) The average TTC was obtained by averaging the TTCs of the single trains, where the weights correspond standard error on the TTCs. The corresponding error bars were estimated from the standard error between the individual TTCs. Finally, was obtained by .
Beam-induced effects assessment
Identifying the onset of X-ray beam-induced effects is crucial for MHz-XPCS. Beam-induced effects can manifest as fluence-dependent changes in the scattering intensity, , and the diffusion coefficient, . These changes may result from beam-induced heating or radicals formation in the solution, potentially leading to protein aggregation or denaturation [35].
Supplementary Fig. S2 shows the for varying pulse accumulations at different concentrations, , and transmissions, . In addition, the as a function of pulse number for nm-1 is shown in Supplementary Fig. S3. Minor changes in the are observed across all . Specifically for data used for the figures presented, i.e. at , intensity changes are less than 1%.
The fluence-dependence of and TTCs are discussed in Supplementary Section 3. Within the error bars, changes in the KWW exponent with dose are negligible. However, a slight increase in the diffusion coefficient is observed with increasing pulse number, likely due to beam-induced temperature rise [35, 80], estimated to be below 1 K. This approach allows us to identify the optimal parameters to mitigate beam-induced effects, such as optimal transmission , number of repetitions , and the number of pulses-per-train . Considering the minor changes in both and under these conditions, we conclude that protein aggregation is not detected. The intrinsic protein dynamics can be accurately accessed by including a correction for the temperature increase (in the order of 1 K) as reported in Table S2.
Hydrodynamic function modelling
| (13) |
The -dependent part is calculated using jscatter [81] with the expression:
| (14) |
where is the angle between and vectors, is the protein volume fraction. The protein radius nm is based on the structure reported in Ref [59], and is the volume fraction dependent function given in Ref. [58]. The used for the calculation is obtained by interpolating the experimental (see Supplementary Section 1).
The normalized self-diffusion coefficient was estimated via [58]:
| (15) |
More information on the fit is provided in the Supplementary Section 5.
Acknowledgements
We acknowledge the European XFEL in Schenefeld, Germany, for provision of XFEL beamtime at the Scientific Instrument MID (Materials Imaging and Dynamics) and would like to thank the staff for their assistance. The data presented here are collected as part of measurement time awarded to proposals 3094 and 5397. In addition, we acknowledge Maxwell cluster for providing computer resources to perform the analysis. We thank the European Synchrotron Radiation Facility (ESRF) for provision of synchrotron radiation facilities at TRUSAXS instrument (Time Resolved Ultra Small Angle X-ray Scattering), ID02 (SC-5485) with additional support from Theyencheri Narayanan. FP acknowledges financial support by the Swedish National Research Council (Vetenskapsrådet) under Grant No. 2019-05542, 2023-05339 and within the Röntgen-Ångström Cluster Grant No. 2019-06075, and the kind financial support from Knut och Alice Wallenberg foundation (WAF, Grant. No. 2023.0052). This research is supported by the Center of Molecular Water Science (CMWS) of DESY in an Early Science Project, the MaxWater initiative of the Max-Planck-Gesellschaft (Project No. CTS21:1589), Carl Tryggers and the Wenner-Gren Foundations (Project No. UPD2021-0144). This project has also received funding from the European Union’s Horizon 2020 research and innovation programme under the Marie Skłodowska-Curie grant agreement No. 101081419 (PRISMAS) and 101149230 (CRYSTAL-X). We also acknowledge BMBR ErUM-Pro funding (05K22PS1, CG), BMBF (05K19PS1 and 05K20PSA, CG ; 05K19VTB, FS and FZ), DFG-ANR (SCHR700/28-1, SCHR700/42-1, ANR-21-CE06-0047 IDPXN, FS, FZ, and TS). FL and PPR thank the Cluster of Excellence “Advanced Imaging of Matter” of the Deutsche Forschungsgemeinschaft (DFG)–EXC 2056–project id no. 390715994. AL and CG acknowledge financial support by the consortium DAPHNE4NFDI in association with the German National Research Data Infrastructure (NFDI) e.V. - project number 46024879. MP thanks the DELTA machine group for providing synchrotron radiation for sample characterization.
Author contributions
AG, MR and FP designed the experiment, along with discussions with CG, FS, FZ, MP, JM, TS and FL. AG, MB and MF prepared and handled the samples. JH, AR-F, J-EP, FB, UB, WL, WJ, RS, AZ, JM and AM operated MID and collected data together with the rest of the experimental team. AG, MB, MF, ST and IA performed online data processing and analysis at MID, based on scripts developed by MR and the MID data analysis team (JW and AL being the main contributors). SB, SR, MS, LR, and MD were in addition responsible for the elog. Experiments at ESRF were supported by WC. AG performed offline data processing and analysis with input from FP, FZ, CG and MP. All authors jointly performed the experiments and discussed the final results. The manuscript was written by AG and FP with input from all authors.
Competing interests
The authors declare no competing interests.
Data availability
Data recorded for the experiment at the European XFEL are available at [doi:10.22003/XFEL.EU-DATA-003094-00] and [doi:10.22003/XFEL.EU-DATA-005397-00]. Data recorded at ESRF are available at [doi:10.15151/ESRF-ES-1435809276].
Code availability
The code used to analyse the data in this study is available from the corresponding authors upon request.
References
- [1] James A. Dix and A.. Verkman “Crowding Effects on Diffusion in Solutions and Cells” In Annu. Rev. Biophys. 37.1, 2008, pp. 247–263 DOI: 10.1146/annurev.biophys.37.032807.125824
- [2] S.B. Zimmerman and A.P. Minton “Macromolecular crowding: biochemical, biophysical, and physiological consequences” Publisher: Annual Reviews 4139 El Camino Way, PO Box 10139, Palo Alto, CA 94303-0139, USA In Annu. Rev. Biophys. Biomol. Struct. 22.1, 1993, pp. 27–65
- [3] Marco Grimaldo et al. “Dynamics of proteins in solution” In Q. Rev. Biophys. 52, 2019, pp. e7 DOI: 10.1017/S0033583519000027
- [4] Akshay J. Maheshwari et al. “Colloidal hydrodynamics of biological cells: A frontier spanning two fields” Publisher: American Physical Society In Phys. Rev. Fluids 4.11, 2019, pp. 110506 DOI: 10.1103/PhysRevFluids.4.110506
- [5] Alexander S. Mikhailov and Raymond Kapral “Hydrodynamic collective effects of active protein machines in solution and lipid bilayers” Publisher: Proceedings of the National Academy of Sciences In Proc. Natl. Acad. Sci. U.S.A. 112.28, 2015, pp. E3639–E3644 DOI: 10.1073/pnas.1506825112
- [6] Tadashi Ando and Jeffrey Skolnick “Crowding and hydrodynamic interactions likely dominate in vivo macromolecular motion” Publisher: National Academy of Sciences Section: Biological Sciences In Proc. Natl. Acad. Sci. U.S.A. 107.43, 2010, pp. 18457–18462 DOI: 10.1073/pnas.1011354107
- [7] Michael B. Elowitz et al. “Protein Mobility in the Cytoplasm of Escherichia coli” Publisher: American Society for Microbiology In J. Bacteriol. 181.1, 1999, pp. 197–203 DOI: 10.1128/jb.181.1.197-203.1999
- [8] Michael C. Konopka et al. “Crowding and Confinement Effects on Protein Diffusion In Vivo” Publisher: American Society for Microbiology In J. Bacteriol. 188.17, 2006, pp. 6115–6123 DOI: 10.1128/jb.01982-05
- [9] Sören von Bülow, Marc Siggel, Max Linke and Gerhard Hummer “Dynamic cluster formation determines viscosity and diffusion in dense protein solutions” Publisher: National Academy of Sciences Section: PNAS Plus In Proc. Natl. Acad. Sci. U.S.A. 116.20, 2019, pp. 9843–9852 DOI: 10.1073/pnas.1817564116
- [10] Daniel S. Banks and Cécile Fradin “Anomalous Diffusion of Proteins Due to Molecular Crowding” In Biophys. J. 89.5, 2005, pp. 2960–2971 DOI: DOI: 10.1529/biophysj.104.051078
- [11] Matthias Weiss, Markus Elsner, Fredrik Kartberg and Tommy Nilsson “Anomalous Subdiffusion Is a Measure for Cytoplasmic Crowding in Living Cells” In Biophys. J. 87.5, 2004, pp. 3518–3524 DOI: 10.1529/biophysj.104.044263
- [12] Eric R. Weeks and D.. Weitz “Properties of Cage Rearrangements Observed near the Colloidal Glass Transition” In Phys. Rev. Lett. 89.9, 2002, pp. 095704
- [13] Willem K Kegel, Blaaderen and Alfons “Direct observation of dynamical heterogeneities in colloidal hard-sphere suspensions” In Science 287.5451 American Association for the Advancement of Science, 2000, pp. 290–293
- [14] G. Nägele “On the dynamics and structure of charge-stabilized suspensions” In Phys. Rep. 272, 1996, pp. 215–372
- [15] Kirsten Bacia, Sally A. Kim and Petra Schwille “Fluorescence cross-correlation spectroscopy in living cells” In Nat. Methods 3.2, 2006, pp. 83–89 DOI: 10.1038/nmeth822
- [16] W. Häußler, A. Wilk, J. Gapinski and A. Patkowski “Interparticle correlations due to electrostatic interactions: A small angle X-ray and dynamic light scattering study. I. Apoferritin” Publisher: AIP In J. Chem. Phys. 117, 2002, pp. 413 URL: https://doi.org/10.1063/1.1481383
- [17] D.. Petsev and P.. Vekilov “Evidence for Non-DLVO Hydration Interactions in Solutions of the Protein Apoferritin” Publisher: American Physical Society In Phys. Rev. Lett. 84.6, 2000, pp. 1339–1342 DOI: 10.1103/PhysRevLett.84.1339
- [18] S. Longeville, W. Doster and G. Kali “Myoglobin in crowded solutions: structure and diffusion” In Chem. Phys. 292.2-3, 2003, pp. 413–424 DOI: DOI: 10.1016/S0301-0104(03)00292-1
- [19] J. Gapinski et al. “Diffusion and microstructural properties of solutions charged nanosized proteins: experiment versus theory” In J. Chem. Phys. 123, 2005, pp. 054708
- [20] Wolfgang Doster and Stéphane Longeville “Microscopic Diffusion and Hydrodynamic Interactions of Hemoglobin in Red Blood Cells” In Biophys. J. 93.4, 2007, pp. 1360–1368 DOI: DOI: 10.1529/biophysj.106.097956
- [21] Saskia Bucciarelli et al. “Dramatic influence of patchy attractions on short-time protein diffusion under crowded conditions” In Sci. Adv. 2, 2016, pp. e1601432
- [22] Johannes Moeller, Michael Sprung, Anders Madsen and Christian Gutt “X-ray photon correlation spectroscopy of protein dynamics at nearly diffraction-limited storage rings” In J. Synchrotron Radiat. 6.5, 2019, pp. 794–803 DOI: doi:10.1107/S2052252519008273
- [23] Fivos Perakis and Christian Gutt “Towards molecular movies with X-ray photon correlation spectroscopy” Publisher: The Royal Society of Chemistry In Phys. Chem. Chem. Phys. 22.35, 2020, pp. 19443–19453 DOI: 10.1039/D0CP03551C
- [24] Ferdinand Otto et al. “The dynamics of PEG-coated nanoparticles in concentrated protein solutions up to the molecular crowding range” In Aggregate 5.3, 2024, pp. e483 DOI: https://doi.org/10.1002/agt2.483
- [25] Kacper Switalski et al. “Direct measurement of Stokes–Einstein diffusion of Cowpea mosaic virus with 19 s-resolved XPCS” In J. Synchrotron Radiat. 29.6, 2022, pp. 1429–1435 DOI: 10.1107/S1600577522008402
- [26] Preeti Vodnala et al. “Hard-sphere-like dynamics in highly concentrated alpha-crystallin suspensions” In Phys. Rev. E 97.2, 2018, pp. 020601(R) DOI: 10.1103/PhysRevE.97.020601
- [27] Yuriy Chushkin et al. “Probing cage relaxation in concentrated protein solutions by XPCS” In Phys. Rev. Lett. 129 American Physical Society, 2022, pp. 238001 DOI: 10.1103/PhysRevLett.129.238001
- [28] Anita Girelli et al. “Microscopic Dynamics of Liquid-Liquid Phase Separation and Domain Coarsening in a Protein Solution Revealed by X-ray Photon Correlation Spectroscopy” Publisher: American Physical Society In Phys. Rev. Lett. 126.13, 2021, pp. 138004 DOI: 10.1103/PhysRevLett.126.138004
- [29] M. Moron et al. “Gelation Dynamics upon Pressure-Induced Liquid–Liquid Phase Separation in a Water–Lysozyme Solution” In J. Phys. Chem. B 126.22, 2022, pp. 4160–4167 DOI: 10.1021/acs.jpcb.2c01947
- [30] Mariana Juliani Amaral et al. “Copper drives prion protein phase separation and modulates aggregation” In Sci. Adv. 9.44, 2023, pp. eadi7347 DOI: 10.1126/sciadv.adi7347
- [31] Nafisa Begam et al. “Kinetics of network formation and heterogeneous dynamics of an egg white gel revealed by coherent X-ray scattering” Publisher: APS In Phys. Rev. Lett. 126.9, 2021, pp. 098001
- [32] Sonja Timmermann et al. “X-ray driven and intrinsic dynamics in protein gels” In Sci. Rep. 13.1, 2023, pp. 11048 DOI: 10.1038/s41598-023-38059-z
- [33] Nimmi Das Anthuparambil et al. “Exploring non-equilibrium processes and spatio-temporal scaling laws in heated egg yolk using coherent X-rays” In Nat. Commun. 14.1, 2023, pp. 5580 DOI: 10.1038/s41467-023-41202-z
- [34] Maddalena Bin et al. “Coherent X-ray Scattering Reveals Nanoscale Fluctuations in Hydrated Proteins” In J. Phys. Chem. B 127.21, 2023, pp. 4922–4930 DOI: 10.1021/acs.jpcb.3c02492
- [35] Mario Reiser et al. “Resolving molecular diffusion and aggregation of antibody proteins with megahertz X-ray free-electron laser pulses” In Nat. Commun. 13.1, 2022, pp. 5528 DOI: 10.1038/s41467-022-33154-7
- [36] Margarida Q. Rodrigues, Paula M. Alves and António Roldão “Functionalizing Ferritin Nanoparticles for Vaccine Development” In Pharmaceutics 13.10, 2021 DOI: 10.3390/pharmaceutics13101621
- [37] Zhantong Wang et al. “Ferritin nanocage-based antigen delivery nanoplatforms: epitope engineering for peptide vaccine design” Publisher: The Royal Society of Chemistry In Biomater. Sci. 7.5, 2019, pp. 1794–1800 DOI: 10.1039/C9BM00098D
- [38] Yuanjun Zhu et al. “Ferritin-based nanomedicine for disease treatment” In Med. Rev. 3.1, 2023, pp. 49–74 DOI: 10.1515/mr-2023-0001
- [39] Didi He and Jon Marles-Wright “Ferritin family proteins and their use in bionanotechnology” In European Congress of Biotechnology - ECB 16 32.6, 2015, pp. 651–657 DOI: 10.1016/j.nbt.2014.12.006
- [40] Masaki Uchida et al. “The ferritin superfamily: Supramolecular templates for materials synthesis” In Biochim. Biophys. Acta - General Subjects 1800.8, 2010, pp. 834–845 DOI: 10.1016/j.bbagen.2009.12.005
- [41] C.W.J. Beenakker and P. Mazur “Diffusion of spheres in a concentrated suspension: Resummation of many-body hydrodynamic interactions” In Phys. Lett. A 98.1, 1983, pp. 22–24 DOI: 10.1016/0375-9601(83)90535-2
- [42] C.W.J. Beenakker “The effective viscosity of a concentrated suspension of spheres (and its relation to diffusion)” In Physica A 128.1, 1984, pp. 48–81 DOI: 10.1016/0378-4371(84)90081-5
- [43] Fabian Westermeier et al. “Structure and short-time dynamics in concentrated suspensions of charged colloids” Publisher: AIP In J. Chem. Phys. 137.11, 2012, pp. 114504 DOI: 10.1063/1.4751544
- [44] A. Madsen et al. “Materials Imaging and Dynamics (MID) instrument at the European X-ray Free-Electron Laser Facility” In J. Synchrotron Radiat. 28.2, 2021, pp. 637–649 DOI: 10.1107/S1600577521001302
- [45] Nan Jian et al. “Morphology of the ferritin iron core by aberration corrected scanning transmission electron microscopy” In Nanotechnology 27.46 IOP Publishing, 2016, pp. 46LT02 DOI: 10.1088/0957-4484/27/46/46LT02
- [46] Graham Williams and David C. Watts “Non-symmetrical dielectric relaxation behaviour arising from a simple empirical decay function” In Trans. Faraday Soc. 66.0, 1970, pp. 80–85 DOI: 10.1039/TF9706600080
- [47] A. Arbe and J. Colmenero “Characterization of the “simple-liquid” state in a polymeric system: Coherent and incoherent scattering functions” In Phys. Rev. E 80.4, 2009, pp. 041805 DOI: 10.1103/PhysRevE.80.041805
- [48] P.. De Gennes “Liquid dynamics and inelastic scattering of neutrons” Publisher: Elsevier In Physica 25.7-12, 1959, pp. 825–839
- [49] Kim Nygård et al. “Anisotropic de Gennes Narrowing in Confined Fluids” In Phys. Rev. Lett. 116.16, 2016, pp. 167801 DOI: 10.1103/PhysRevLett.116.167801
- [50] Michal K. Braun et al. “Crowding-Controlled Cluster Size in Concentrated Aqueous Protein Solutions: Structure, Self- and Collective Diffusion” In J. Phys. Chem. Lett. 8.12, 2017, pp. 2590–2596 DOI: 10.1021/acs.jpclett.7b00658
- [51] Katharina Holzweber et al. “Beam-induced atomic motion in alkali borate glasses” Publisher: American Physical Society In Phys. Rev. B 100.21, 2019, pp. 214305 DOI: 10.1103/PhysRevB.100.214305
- [52] Peco Myint et al. “de Gennes Narrowing and Relationship between Structure and Dynamics in Self-Organized Ion-Beam Nanopatterning” Publisher: American Physical Society In Phys. Rev. Lett. 126.1, 2021, pp. 016101 DOI: 10.1103/PhysRevLett.126.016101
- [53] Bin Wu, Takuya Iwashita and Takeshi Egami “Atomic Dynamics in Simple Liquid: de Gennes Narrowing Revisited” Publisher: American Physical Society In Phys. Rev. Lett. 120.13, 2018, pp. 135502 DOI: 10.1103/PhysRevLett.120.135502
- [54] F. Dallari et al. “Microsecond hydrodynamic interactions in dense colloidal dispersions probed at the European XFEL” In IUCrJ 8.5, 2021 DOI: 10.1107/S2052252521006333
- [55] W. Häussler and B. Farago “Diffusive dynamics of ordered solutions of apoferritin near the structure factor peak” In J. Phys.:Cond. Matter 15, 2003, pp. s197–s204 URL: https://iopscience.iop.org/article/10.1088/0953-8984/15/1/325
- [56] W. Häussler “Structure and dynamics in Apoferritin solutions with paracrystalline order” In Chem. Phys. 292, 2003, pp. 425–434 URL: https://doi.org/10.1016/S0301-0104(03)00183-6
- [57] A. Blaaderen, J. Peetermans, G. Maret and J… Dhont “Long–time self–diffusion of spherical colloidal particles measured with fluorescence recovery after photobleaching” In J. Chem. Phys. 96.6, 1992, pp. 4591–4603 DOI: DOI:10.1063/1.462795
- [58] U. Genz and R. Klein “Collective diffusion of charged spheres in the presence of hydrodynamic interaction” In Physica A 171.1, 1991, pp. 26–42 DOI: 10.1016/0378-4371(91)90355-G
- [59] Pauline M. Harrison “The structure and function of ferritin” In Biochem. Educ. 14.4, 1986, pp. 154–162 DOI: 10.1016/0307-4412(86)90203-7
- [60] CWJ Beenakker “Self-diffusion of spheres in a concentrated suspension” In Physica A 120.3 Elsevier, 1983, pp. 388–410
- [61] Dimiter N Petsev et al. “Temperature-independent solubility and interactions between apoferritin monomers and dimers in solution” In J. Cryst. Growth 232.1, Proceedings of the Eighth International Conference on Crystalliza tion of Biological Macromolecules, 2001, pp. 21–29 DOI: 10.1016/S0022-0248(01)01095-8
- [62] M. Medina-Noyola “Long-Time Self-Diffusion in Concentrated Colloidal Dispersions” In Phys. Rev. Lett. 60 American Physical Society, 1988, pp. 2705–2708 DOI: 10.1103/PhysRevLett.60.2705
- [63] Frank Hirschmann et al. “Effects of flexibility in coarse-grained models for bovine serum albumin and immunoglobulin G” In J. Chem. Phys. 158.8, 2023, pp. 084112 DOI: 10.1063/5.0132493
- [64] Grzegorz Szamel and Jan A. Leegwater “Long-time self-diffusion coefficients of suspensions” In Phys. Rev. A 46 American Physical Society, 1992, pp. 5012–5019 DOI: 10.1103/PhysRevA.46.5012
- [65] P.. Segrè and P.. Pusey “Scaling of the Dynamic Scattering Function of Concentrated Colloidal Suspensions” In Phys. Rev. Lett. 77.4, 1996, pp. 771–774 DOI: 10.1103/PhysRevLett.77.771
- [66] Peter Holmqvist and Gerhard Nägele “Long-Time Dynamics of Concentrated Charge-Stabilized Colloids” In Phys. Rev. Lett. 104 American Physical Society, 2010, pp. 058301 DOI: 10.1103/PhysRevLett.104.058301
- [67] Adolfo J. Banchio, Marco Heinen, Peter Holmqvist and Gerhard Nägele “Short- and long-time diffusion and dynamic scaling in suspensions of charged colloidal particles” In J. Chem. Phys. 148.13, 2018, pp. 134902 DOI: 10.1063/1.5017969
- [68] Robert L. Leheny “XPCS: Nanoscale motion and rheology” In Curr. Opin. Colloid Interface Sci 17.1, 2012, pp. 3–12 DOI: https://doi.org/10.1016/j.cocis.2011.11.002
- [69] Eric R. Weeks et al. “Three-Dimensional Direct Imaging of Structural Relaxation Near the Colloidal Glass Transition” In Science 287.5453, 2000, pp. 627–631 DOI: 10.1126/science.287.5453.627
- [70] Abhinav Mohanty, Akankshika Parida, Rohit Kumar Raut and Rabindra K. Behera “Ferritin: A Promising Nanoreactor and Nanocarrier for Bionanotechnology” In ACS Bio. & Med. Chem. Au. 2.3, 2022, pp. 258–281 DOI: 10.1021/acsbiomedchemau.2c00003
- [71] Marco Grimaldo et al. “Protein Short-Time Diffusion in a Naturally Crowded Environment” _eprint: https://doi.org/10.1021/acs.jpclett.9b00345 In J. Phys. Chem. Lett. 10.8, 2019, pp. 1709–1715 DOI: 10.1021/acs.jpclett.9b00345
- [72] Michael E. May and Wayne W. Fish “The uv and visible spectral properties of ferritin” In Arch. Biochem. Biophys. 190.2, 1978, pp. 720–725 DOI: 10.1016/0003-9861(78)90332-6
- [73] Rodolfo Ghirlando, Radina Mutskova and Chad Schwartz “Enrichment and characterization of ferritin for nanomaterial applications” Publisher: IOP Publishing In Nanotechnology 27.4, 2015, pp. 045102 DOI: 10.1088/0957-4484/27/4/045102
- [74] Aschkan Allahgholi et al. “The adaptive gain integrating pixel detector at the European XFEL” Publisher: International Union of Crystallography In J. Synchrotron Radiat. 26.1, 2019, pp. 74–82
- [75] Jolanta Sztuk-Dambietz et al. “Operational experience with Adaptive Gain Integrating Pixel Detectors at European XFEL” In Front. Phys. 11, 2024 DOI: 10.3389/fphy.2023.1329378
- [76] P Falus, LB Lurio and SGJ Mochrie “Optimizing the signal-to-noise ratio for X-ray photon correlation spectroscopy” Publisher: International Union of Crystallography In J. Synchrotron Radiat. 13.3, 2006, pp. 253–259
- [77] Nian-Sheng Cheng “Formula for the Viscosity of a Glycerol-Water Mixture” Publisher: American Chemical Society In Ind. Eng. Chem. Res. 47.9, 2008, pp. 3285–3288 DOI: 10.1021/ie071349z
- [78] A. Ortega, D. Amorós and J. García de la Torre “Prediction of Hydrodynamic and Other Solution Properties of Rigid Proteins from Atomic- and Residue-Level Models” In Biophys. J. 101, 2011, pp. 892–898 DOI: 10.1016/j.bpj.2011.06.046
- [79] Abhinav Mohanty, Mithra K, Sidhartha S. Jena and Rabindra K. Behera “Kinetics of Ferritin Self-Assembly by Laser Light Scattering: Impact of Subunit Concentration, pH, and Ionic Strength” Publisher: American Chemical Society In Biomacromolecules 22.4, 2021, pp. 1389–1398 DOI: 10.1021/acs.biomac.0c01562
- [80] Felix Lehmkühler et al. “Emergence of Anomalous Dynamics in Soft Matter Probed at the European XFEL” In Proc. Natl. Acad. Sci. U.S.A. 117.39, 2020, pp. 24110–24116 DOI: 10.1073/pnas.2003337117
- [81] Ralf Biehl “Jscatter, a program for evaluation and analysis of experimental data” In PLoS One 14.6, 2019, pp. e0218789 DOI: 10.1371/journal.pone.0218789