The evolutionary history of GD1400, a white dwarf-brown dwarf binary
Abstract
GD1400AB was one of the first known white dwarfbrown dwarf binaries, and is the only one of these systems where the white dwarf is a ZZ Ceti pulsator. Here we present both radial velocity measurements and time series photometry, analysing both the white dwarf pulsations and the effects of irradiation on the brown dwarf. We find the brightness temperatures of 1760 K for the night side and 186010 K for the day side indicate the brown dwarf is hotter than spectra have previously suggested, although brightness temperatures calculated using a larger radius for the brown dwarf are consistent with previously determined spectral types. We also discuss the likely evolutionary pathway of this binary, and put its common envelope phase into context with the other known systems.
keywords:
Stars: white dwarfs, low-mass, brown dwarfs, infrared: stars1 Introduction
Detached brown dwarf white dwarf systems allow the exploration of a variety of aspects of binary formation and evolution, including probing the known deficit of brown dwarf companions to main sequence stars (McCarthy & Zuckerman, 2004; Grether & Lineweaver, 2006; Metchev & Hillenbrand, 2009). In detached systems (close or wide) the brown dwarfs themselves can be studied spectroscopically because they dominate the spectral energy distribution at near- to mid-infrared (IR) wavelengths (Farihi & Christopher, 2004; Dobbie et al., 2005; Burleigh et al., 2006a; Casewell et al., 2018b; Casewell et al., 2020a; Lew et al., 2022; Zhou et al., 2022). It should be noted that there are few observational constraints on brown dwarf evolutionary models at older ages, such as might be expected for most white dwarfs ( Gyr; Pinfield et al. 2006) as determining the age of a field brown dwarf is challenging due to the age-mass-radius-luminosity degeneracy.
The closest brown dwarf white dwarf pairs provide another channel for cataclysmic variable (CV) formation (Politano, 2004; Littlefair et al., 2007; Burleigh et al., 2006b; Hernández Santisteban et al., 2016), in which the substellar companion survives common envelope (CE) evolution when it is engulfed by the envelope of the red giant progenitor to the white dwarf (Maxted et al., 2006; Rappaport et al., 2017; Parsons et al., 2017). In extremis, the closest such binaries might even represent the end state of CV evolution, in which the secondary has become highly evolved through mass transfer (Patterson et al., 2005). Indeed, Zorotovic & Schreiber (2022) calculated the CE efficiency for the known white dwarf brown dwarf pairs to be which is consistent for CVs with main sequence secondary stars.
In close detached binaries, the brown dwarf is irradiated by the high ultraviolet (UV) flux of the white dwarf, leading to substantial temperature differences between the “day” and “night” hemispheres. Such systems can provide empirical laboratories for comparison with models for irradiated “hot Jupiter” atmospheres (Fortney et al., 2008; Knutson et al., 2012; Stevenson et al., 2014; Beatty et al., 2019; Arcangeli et al., 2019; Mikal-Evans et al., 2022). However, detached brown dwarf companions to white dwarfs are rare (the fraction of L-type secondaries is 0.5%; Farihi, Becklin & Zuckerman 2005b, Girven et al. 2011; Steele et al. 2011) with only 20 such systems known to date, of which 10 are close, post CE binaries, although many candidates are known (Brown et al., 2023). The majority of these systems studied to date have been those in which the brown dwarf is highly irradiated: WD0137-349B (Casewell et al., 2015; Longstaff et al., 2017; Lee et al., 2020; Zhou et al., 2022), SDSS1411 (Casewell et al., 2018b; Lew et al., 2022), EPIC212235321 (Casewell et al., 2018a; Lothringer & Casewell, 2020; Zhou et al., 2022). These three systems have periods between 68 min and 2 hrs, and the white dwarfs have effective temperatures between 25,000 K and 13,000 K. Very little is known as to the effects of irradiation on brown dwarfs orbiting cooler white dwarf primaries, although what is known suggests some form of inflation of the brown dwarf is likely (e.g. Casewell et al. 2020a; Casewell et al. 2020b).The majority of these close binaries have periods of 2 hrs (e.g. Maxted et al. 2006; Steele et al. 2013; Littlefair et al. 2014; Casewell et al. 2020a), making those with longer periods: GD 1400AB at 10 hrs (Burleigh et al., 2011) and ZTFJ0038+2030 with a period of 10.36 hrs (van Roestel et al., 2021) unusual. The only post-CE systems known with substellar companions and long orbital periods are Gaia 0007-1605 which has a period of 1.0446 days (Rebassa-Mansergas et al., 2022) and the white dwarf-planet system WD1856+534Ab which has a period of 1.407 days (Vanderburg et al., 2020).
GD 1400 (WD0145-221) is a DA white dwarf located at 46.25 0.07 pc. Farihi & Christopher (2004) determined GD 1400 had a likely unresolved L dwarf companion, confirmed as an L7 dwarf with near-IR spectroscopy by Dobbie et al. (2005). Farihi et al. (2005a) subsequently obtained IRAC photometry from 3.6 to 9 microns which was also consistent with a secondary of L5–L7 spectral type. The most recent work on the system was by Walters et al. (2023), who determined an effective temperature of 2100 K for the brown dwarf, significantly hotter than suggested by the previous spectra. GD 1400 is known to be a ZZ Ceti pulsator, hence it is photometrically variable with Fontaine et al. (2003); Kilkenny et al. (2014); Bognár et al. (2020) detecting numerous periods.
In this paper we present radial velocity measurements and time series photometry of the GD 1400 system in order to better constrain the mass of the brown dwarf, likely levels of irradiation, and the effects the pulsations are having on the system. We also present an in-depth analysis of the likely CE evolution of the system, and how this compares to other binaries formed via the same evolutionary pathway.
2 GD 1400A
Gentile Fusillo et al. (2021) fitted the photometry and parallax of GD 1400A with pure hydrogen atmosphere models and obtained an effective temperature of K and a surface gravity of , resulting in a mass of 0.6040.016 M⊙. This is broadly consistent with the values given in Koester et al. (2009) of K and from spectroscopy alone. A more recent spectroscopic determination by Bergeron et al. (2021) yields a slightly higher mass with parameters of K, and a mass of 0.71 0.06 M⊙, although the spectrum in this case is a classification spectrum from the Montreal-Cambridge-Tololo (MCT) survey. Walters et al. (2023) determined parameters of K and a mass of 0.59 0.07 M⊙ based on the DR3 parallax and the Pan-STARRS photometry.
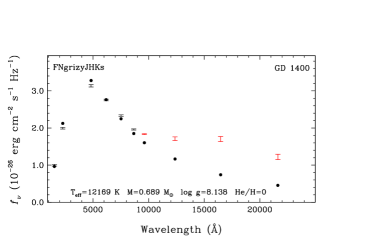
Vincent et al. (2020, see their Figure 4) show the difference between spectroscopically and photometrically derived parameters for ZZ Ceti stars, highlighting the fact that time averaged photometry of ZZ Ceti pulsators is not the same as for non-pulsating DA white dwarfs. The lack of a band measurement for GD1400A would also likely bias the photometric fit towards lower effective temperatures (Bergeron et al., 2019). We decided to independently measure the parameters of GD 1400A by reanalyzing the best available photometric and spectroscopic data available. We show in Figure 1 our photometric fit to GD 1400A using the parallax, , Pan-STARRS , and 2MASS photometry. In doing so, however, we exclude the photometric passbands that appear contaminated by the brown dwarf companion. We obtain K, , and M⊙.
We also updated the spectroscopic fit using the optical spectrum from Gianninas et al. (2011) with the most recent DA white dwarf models, and by including the 3D hydrodynamical corrections from Tremblay et al. (2013). We rely on the evolutionary models from Bédard et al. (2020) with CO cores, , and , which are representative of H-atmosphere white dwarfs. Our best fit displayed in Figure 2 is obtained with T K, , which result in a mass of M M⊙, in excellent agreement with our photometric solution. This updated mass gives a gravitational redshift of 35 kms-1, larger than the measured difference in velocities given in Walters et al. (2023), but broadly consistent with the gravitational redshift for their adopted mass.
We can estimate an upper limit on the total age of the system using the white dwarf cooling age, the initial-final mass relation (IFMR) for white dwarfs and an estimate of the main sequence lifetime, neglecting any accelerated evolution during the CE phase. Using the software wdwarfdate (Kiman et al., 2022) and with the Cummings et al. (2018) IFMR and MIST isochrones we determine the cooling age to be 0.46 Gyr and the white dwarf progenitor mass to be 2.09 M⊙. The total system age is estimated to be 1.76 Gyr. It should, however, be noted that this is an upper limit, as we do not know when the main sequence lifetime of the white dwarf progenitor was truncated by the common envelope evolution.
3 Radial velocity observations
Fifteen high resolution optical spectra of GD 1400 were obtained between 2006 July and September with the UVES echelle spectrometer (Dekker et al., 2000) on UT2 of the European Southern Observatory’s Very Large Telescope (ESO VLT), under programme 077.D-0673(A). UVES was used with the DIC-1 dichroic, with the split beams centred at 3900 Å and 5640 Å, giving a resolution of 0.04 Å and a radial velocity accuracy of 1.5 km s-1 in the cores of the H and H absorption lines. The observations were performed in service mode, in seeing no worse than , for a total exposure time of 1200 s to deliver an anticipated S/N per pixel (using binning). Each observation was split into s exposures to avoid smearing.
The spectra were reduced with the ESO MIDAS pipeline for UVES, in the same way as for the ESO Supernova Type 1 Survey (SPY: Napiwotzki et al. 2020) including the merging of the echelle orders and the wavelength calibration. The quality of these automatically extracted spectra is very good, except for a quasi-periodic wave-like pattern that occurs in some of the spectra. This is largely removed by additional processing. In addition, a featureless (DC) white dwarf, WD 0000345 was observed as part of the programme to aid in correcting the detector response curve.
We see no sign of emission within the Balmer features at any phase which could be caused by irradiation (e.g. Longstaff et al. 2017), which was expected as no such emission is seen in the lines of WD1032+011 (Casewell et al., 2020a) which has a similar white dwarf temperature, but a 2 hr period.
We measured the radial velocities (RVs) of GD 1400 from the non-local thermodynamic equilibrium (NLTE) line cores of the Balmer lines H and H. The measurements were carried out with the package fitsb2 designed to fit the spectra of single-lined (SB1) and double-lined (SB2) binaries (Napiwotzki et al., 2004) as for Napiwotzki et al. (2020).
Synthetic spectra from Koester (2010) were convolved to the observational resolution with a Gaussian and interpolated to the actual parameters with bi-cubic splines and interpolated to the observed wavelength scale. We used the model profiles computed by Koester et al. (1998) for their investigation of rotation in white dwarfs. These are computed performing a NLTE line formation on top of up-to-date LTE model atmospheres for DA white dwarfs (Koester et al., 1998) for details. The inner core of GD 1400 is not very well reproduced by the model profiles. The very likely explanation of this is GD 1400 being a large amplitude ZZ Ceti variable. fitsb2 offers the option to combine model spectra with other line profiles. In our case we achieved reasonable representation of the observed line profile by adding a central Gaussian component.
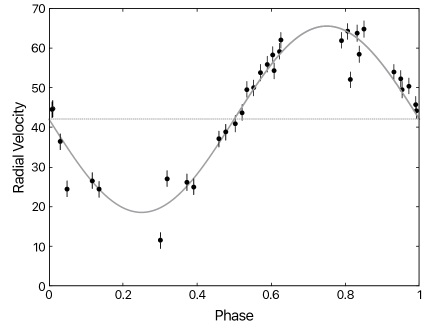
The line profiles were derived from a simultaneous fit of all spectra available, significantly reducing the overall uncertainties. The RV errors were determined by bootstrapping the pixels of the spectra (see Napiwotzki et al. 2020). We determined a RV dispersion of , indicating very good stability for the observations. Any RV shifts seen within the measurements are likely caused by the ZZ Ceti pulsations (Berger et al., 2005).
The period search was carried out by means of a periodogram method (see Lorenz et al., 1998; Napiwotzki et al., 2001). Sine-shaped RV curves were fitted to the measured RVs for a large range of trial periods. The quality of each fit was determined based on the sum of the squared residuals (). A detailed fit for the best period estimate was then done to derive the orbital semi-amplitude , system velocity , and the epoch of phase zero . The latter is defined here as the conjunction time when the visible primary moves from the blue side to the red side of the RV curve.
The orbital parameters were then refined by fitting with fitsb2 using the solution from above as starting point. In this process we fit all spectra simultaneously leading to a direct determination of the orbital parameters (and line profile parameters), with the errors estimated using the bootstrapping method. However, there exists no straightforward way to include the systematic errors affecting complete spectra in this error estimate, and so we used an alternative approach: the bootstrapping is applied to the set of spectra, instead of pixels within the spectra. For each bootstrapping step, a list with a random selection of spectra is produced and a fit performed exactly the same way it is done on the original set of spectra. This is repeated several times (we used 2000 iterations) and error estimates computed from the scatter of the fitted parameters. As long as “systematic” errors vary in a random way between spectra – which is likely true for most error sources, e.g. centroiding errors or not perfectly corrected flexing of the spectrograph – these are fully taken into account.
To take into account that it is possible the correct period is very different from the best fitting period, for instance outside the formal error limits, we converted the values fitted for the trial periods into probabilities before integrating over the periods – comparing the probability for an interval centred on the primary peak with the “outside” region. The integration was carried out between 0.1 d and 30 d extending over all plausible periods for this post-CE system.
| Parameter | Value | |
|---|---|---|
| (days) | 0.00008 | |
| (BJD) | 2451699.888265 0.001128 | |
| (km s-1) | ||
| (km s-1) | ||
| (K) | 11939180 K | |
| (M⊙) | 0.680 0.029 | |
| sin (M⊙) | 786 MJup |
4 Time-series Photometry
4.1 Optical wavelength
As GD 1400A is a ZZ Ceti variable, we monitored it between 2007 and 2010 at the South African Astronomical Observatory (SAAO) with the STE4 CCD imager and the UCT high-speed camera mounted on the 1.0 m telescope in white light (i.e. with no filter). The data were reduced using SAAO’s data reduction pipeline, which subtracted the bias, flat-fielded the science frames and extracted the brightness of the stars in the frames using DAOPHOT. The light curve is expressed in terms of flux relative to the average brightness of the star. In some cases, a low-order, best-fit polynomial was also subtracted from the light curve to remove any residual extinction effects. A summary of the observations is given in Table 2 and an example of the light curves from 2010 is shown in Figure 4, where the multiperiodic nature of the variable is clearly evident. Observations taken during the same run were combined into a single epoch light curve and analysed using the Period04 program (Lenz & Breger 2005). The Fourier Transform (FT) of each epoch is illustrated in Figure 5, along with its window function and prewhitened FT, obtained from subtracting the best-fit periodicities from the light curve and recalculating the FT. Table 3 summarises the best-fit periodicities determined from non-linear least-squares fitting for the 2007, 2008, 2009 and 2010 datasets, with both least squares and Monte Carlo uncertainties computed using Period04. We have not attempted to identify multiplets or , , modes and the orbital period of GD 1400AB at 10 h is not detected in these data. All phases of the orbital period have been covered with the light curve, but we also find no indication of an eclipse when the light curve is folded on the orbital period.
Tentative periods were identified by Fontaine et al. (2003) at 462.20 s, 727.90 s and 823.20 s in data taken in July 2002 at the 3.6 m Canada-France-Hawaii-Telescope (CFHT) with LAPOUNE, a portable Montréal three-channel photometer. In 2012 Kilkenny et al. (2014) determined periods of 437 s, 730 s and 454 s in order of dominance, two of which are consistent with those determined by Fontaine et al. (2003). Bognár et al. (2020) used 13448 TESS data points from sector 3 in 120 s mode over 20.3 days to determine periods of 415.420 s with the second highest peaks at 451 s consistent with previous work. At lower frequencies, there were clusters of periods around 1046 s, 796 s, and 766 s detected, all of which are complex (below frequencies 1400 Hz). They also comment that there could be a “triplet” of frequencies at 765 s leading to a rotation period of either 3.3 or 0.57 days, although the authors were unable to confirm this. When TESS returned to Southern hemisphere observations, it was found by Bognár et al. (2023) that the detected pulsation periods had changed.
We also detect three significant frequencies, at 716.34 s (1395.9763 Hz), 1413.0393 Hz and 1370.4765 Hz. However, if those are from splitting caused by the rotation period, they are uneven – 17.1 Hz and 25.5 Hz from the central component, respectively. At these periods, the mode density also increases, leading to overlapping and modes making identification of triplets challenging.
GD 1400 sits in a typical place within the ZZ Ceti instability strip (Hermes et al., 2017), however, the best-fit periodicities are not stable, with the peak frequencies and amplitudes changing from year to year. Unfortunately, this makes GD 1400A an unsuitable candidate for a long-term O – C study to search for tertiary, lower mass companions in wide orbits through a search for periodic variations in the arrival time of these pulsations (Mullally et al., 2008; Hermes, 2018).
| Telescope/ | Observation | Start Time | Exposure | Number |
|---|---|---|---|---|
| Instrument | Date (UTC) | (UTC) | Time (s) | of points |
| SAAO 1.0m STE4 | 2007-11-30 | 19:50:13 | 12 | 480 |
| SAAO 1.0m STE4 | 2007-12-03 | 20:18:45 | 12 | 140 |
| SAAO 1.0m STE4 | 2007-12-04 | 21:06:52 | 12 | 287 |
| SAAO 1.0m UCT | 2008-10-31 | 18:21:50 | 10 | 1815 |
| SAAO 1.0m UCT | 2008-11-04 | 18:35:59 | 10 | 451 |
| SAAO 1.0m UCT | 2009-10-30 | 22:21:46 | 10 | 1438 |
| SAAO 1.0m UCT | 2009-10-31 | 18:31:52 | 10 | 876 |
| SAAO 1.0m UCT | 2009-11-04 | 20:55:02 | 10 | 1106 |
| SAAO 1.0m UCT | 2010-09-29 | 20:42:01 | 10 | 1325 |
| SAAO 1.0m UCT | 2010-10-17 | 19:18:37 | 10 | 1817 |
| SAAO 1.0m UCT | 2010-10-18 | 19:08:50 | 10 | 1400 |
| SAAO 1.0m UCT | 2010-10-26 | 18:59:28 | 10 | 1437 |
| Year | Frequency | Period | Amplitude | |
|---|---|---|---|---|
| (Hz) | (s) | (mma) | ||
| 2007 | 1: | |||
| 0.041 | 0.016 | 0.98 | ||
| 2: | ||||
| 7.514 | 1.593 | 1.62 | ||
| 3: | ||||
| 8.420 | 4.363 | 3.22 | ||
| 4: | ||||
| 16.074 | 1.115 | 1.88 | ||
| 5: | ||||
| 59.798 | 41.390 | 1.93 | ||
| 2008 | 1: | |||
| 0.040 | 0.009 | 0.63 | ||
| 2: | ||||
| 37.926 | 22.187 | 2.96 | ||
| 3: | ||||
| 14.089 | 1.150 | 1.46 | ||
| 2009 | 1: | |||
| 0.019 | 0.014 | 0.91 | ||
| 2: | ||||
| 6.781 | 7.061 | 1.50 | ||
| 3: | ||||
| 11.537 | 6.396 | 2.07 | ||
| 4: | ||||
| 0.049 | 0.009 | 0.77 | ||
| 5: | ||||
| 0.066 | 0.005 | 0.64 | ||
| 2010 | 1: | |||
| 0.0056 | 0.0029 | 0.62 | ||
| 2:∗ | ||||
| 0.0111 | 0.0055 | 0.47 | ||
| 3:∗ | ||||
| 0.0064 | 0.0034 | 0.45 | ||
| 4: | ||||
| 0.0075 | 0.0010 | 0.47 | ||
| 5:∗ | ||||
| 0.0100 | 0.0058 | 0.44 | ||
| 6:∗ | ||||
| 0.0093 | 0.0045 | 0.51 | ||
| 7: | ||||
| 0.0147 | 0.0031 | 0.40 |
∗ Multiplet best-fit periodicities (also marked on its FT) that were required to remove the signal from the FT to approximately 4.
4.2 Near-IR wavelengths
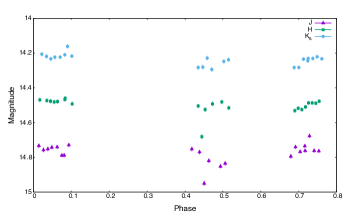
We observed GD 1400 using Son OF Issac (SOFI Moorwood et al. 1998) on the New Technology Telescope La Silla on the nights of 25 October 2007 and 26 October 2007 as part of programme 080.C-0587(A). Photometry was obtained in the , and filters using a 5 point dither pattern with exposure times of 4 s for and 9 s for . The seeing was between 0.5 and 1.6".
The data were reduced using the starlink software package orac-dr to perform the flat fielding, sky subtraction and mosaic combining each 5 dithered frames using the method outlined in Casewell et al. (2015). Object extraction was performed using aperture photometry routines within SExtractor and an aperture equivalent to the seeing.
There are 22 band, 22 band and 23 band data points after reduction (Figure 6) covering phases 0-0.1, 0.4-0.55 and 0.65-0.77. The maxima and minima of the orbit are covered, however there is no reflection effect detected similar to that seen in WD0137-349AB (Casewell et al., 2015; Zhou et al., 2022), which is perhaps to be expected from the longer orbital period and cooler host star.
4.3 Mid-IR wavelengths
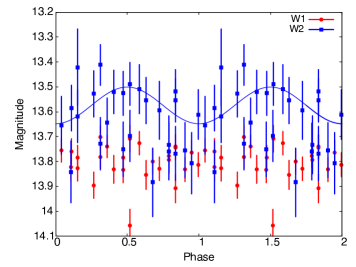
GD 1400 has been observed by the mission (Wright et al., 2010; Mainzer et al., 2011) and there is archival time series photometry from at both W1 and W2 (3.6 and 4.5 microns). The source catalogue (combined photometry) has 13.8010.026 and 13.6330.033 respectively for magnitudes in W1 and W2, broadly consistent with the 13.650.06 and 13.680.06 determined by Farihi et al. (2005a) (it should be noted here that the and bands are not identical).
We used the guidance notes and removed all photometry flagged as affected by the moon, and those flagged as poor quality, or close to the South Atlantic Anomaly. For each data band, we performed a sinusoidal curve fit to the phasefolded data, keeping the period as a fixed parameter (Figure 7). We calculated the chi-squared metric between the best-fitting sinusoid and the data, as well as a chi-squared metric between the data and a flat line at the mean value. From this comparison we find that the reduced chi-squared value in W1 is 28.05 for a sine and 31.33 for a flat value. So W1 is 1.12 times more likely to follow a sinusoidal trend than a flat line, which is not a statistically significant result.For W2, we find the reduced chi-squared value is 9.91 for a sine and 30.79 for a flat line and that the data is 2.92 times more likely to follow a sinusoidal trend than the flat line at the mean of 13.69 mags. Therefore the W2 band shows a small reflection effect with semi-amplitude of 0.07 mags. This reflection effect is smaller than that detected for WD0137-349B which has a semi-amplitude of 0.34 mags at 4.5 microns. NLTT5306B however, which has a 101 minute orbit, has a 4.5 micron reflection effect half that seen for GD 1400 at 0.047 mags. GD 1400 receives 9000 times less irradiation than WD0137-349B, and 320 times less than NLTT5306B. The reason for this difference may be clouds. As an L6-7 dwarf GD 1400B is predicted to be more cloudy than the L5 NLTT5306B (Casewell et al., 2020b).
We interpolated the DA white dwarf models in the filters from Tremblay et al. (2011) for an 11,900 K log =8.0 white dwarf to obtain apparent magnitudes of W1=15.325 and W2=15.39. We subtracted the predicted white dwarf W2 magnitude from the maximum and minimum measured by and calculated the brightness temperatures as described in Casewell et al. (2015) using the orbital separation of 0.009 AU and a brown dwarf radius of 0.086 R⊙ gives brightness temperatures of 1760 K for the night side and 186010 K for the day side. If we use a larger secondary radius, such as might be expected for a 80 MJup object, then the temperatures drop to K on the nightside and K on the dayside. These brightness temperatures are just about consistent with those suggested by a L6-L7 dwarf. From observations of field L dwarfs, Dupuy & Liu (2017) give the effective temperature of L6-L7 dwarfs as between K. A 1850 K dwarf would have a spectral type nearer to an L2-L3 dwarf using the same relationships.
Using the predicted magnitudes from Dupuy & Liu (2012) for L6-7 dwarfs, we get 14.350.37 and 14.070.37 as the combined white dwarfbrown dwarf magnitudes of the system, just consistent with the photometry on the nightside of the brown dwarf at 4.5 microns. The measured 3.6 micron magnitudes are however too bright by 0.5 mags, even taking into account the large scatter on the Dupuy & Liu (2012) magnitudes and the data. The spectral type would need to be nearer to L3-L4 to be consistent with these values.
Farihi et al. (2005a) suggested the [3.6]-[4.5] magnitude colour of GD 1400B is too blue when compared to a L5-L7 dwarf, suggesting that there is significant absorption in the [4.5] band due to CO, although this result does not take into account the fact that there is photometric variability at 4.5 microns. These data were taken at phases 0.15-0.18 covering a very small part of the orbit as the reflection effect is reaching its maximum. Our W1-W2 colour varies from 0.36 mags to -0.05 mags, the latter of which is consistent with the Farihi et al. (2005a) values.
5 Discussion
UVES radial velocity measurements presented here reveal that the white dwarf L6-L7 brown dwarf GD 1400AB has an orbital period days hours and a separation AU. The envelope of the post main sequence progenitor would have extended beyond this distance, so GD 1400B must have survived a phase of CE evolution.
5.1 The mass of the brown dwarf
As our UVES spectra of GD 1400 are single lined we can only determine a lower limit on the mass of GD 1400B from our spectroscopic data. The lack of any features (emission or absorption) from the brown dwarf in the majority of the UVES spectra means that we can only make radial velocity measurements for the white dwarf.
Using the velocities of 21.81.1 and 199.20.6 kms-1 presented in Walters et al. (2023) which are consistent with our values for the white dwarf, and our updated mass for GD1400A we derived a brown dwarf mass of 0.0740.007 M⊙ equating to 78 6 MJup.
If we simply use our own value for the white dwarf, then from Kepler’s laws and using the white dwarf mass estimate, the orbital period and our measured white dwarf’s velocity km s-1 (), we determine the brown dwarf mass to be M⊙ if we use the inclination of 6010∘ Walters et al. (2023). At the higher end of the inclination (70∘), but not large enough to eclipse, the secondary mass decreases to 0.071 M⊙. Both these mass estimates are large for a substellar object. Indeed, the spectral type of the brown dwarf (GD 1400B) has been constrained by two near-IR spectroscopic observations (Farihi & Christopher, 2004; Dobbie et al., 2005) and additional Spitzer mid-IR photometry (Farihi et al., 2005a) to be L6-7. From observations of field L dwarfs, Dupuy & Liu (2017) give the effective temperature of L6-L7 dwarfs as between K. At an age of Gyr, the Sonora Bobcat (Marley et al., 2021) models predict the brown dwarf mass should be between 0.058 and 0.065 M⊙. At the lowest end of our age limit this is 0.048-0.055 M⊙, and at 6 Gyr it is 0.069-0.071 M⊙. It should be noted the rms scatter on the Dupuy & Liu (2017) relationship between Teff and spectral type is 80 K, however taking this into account, and the mass derived from the radial velocities, this would suggest an age for GD 1400AB of greater than 3 Gyr.
If GD 1400B is indeed only 2 Gyr old as we determine from wdwarfdate, then it may have had its cooling slowed by the influx of irradiation from GD 1400A, similar to the suggestions for NLTT5306AB (Casewell et al., 2020b; Amaro et al., 2023), or indeed be inflated such as WD1032+011B (Casewell et al., 2020a). This scenario would also possibly explain the mismatch between the proposed spectral type and the best fitting model as determined by the band spectra in Walters et al. (2023), where the model is 600 K hotter than would normally be assumed for an L6-L7 dwarf. Alternatively, both WD0137-349B (Casewell et al., 2015) and SDSS1411 (Casewell et al., 2018b) have been shown to be too bright on both the day and night side in the band when compared to models of unirradiated brown dwarfs, and this may indeed be the same effect.
5.2 A possible evolutionary history for GD 1400
Even if the mass of the white dwarf GD 1400A is as much as M⊙ lower than the spectroscopically determined value of M⊙, it is still around the peak of the mass distribution for field white dwarfs (Tremblay et al., 2016) and is most likely a C/O-core degenerate. Thus, the progenitor star likely underwent two giant phases, as would be expected for an isolated field white dwarf. Our progenitor mass as determined by wdwarfdate is 2.09 M⊙ assuming single star evolution.
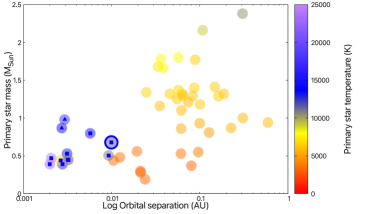
Assuming solar metallicity, Hurley, Pols & Tout (2000) estimate the radius of a M⊙ RGB star as R⊙ or AU, and the radius of a M⊙ AGB star as R⊙ or AU. Therefore, during the main sequence phase GD 1400B must have orbited its parent star at a separation somewhere between AU. Interestingly, this region is precisely that which is largely void of brown dwarfs around solar-type main sequence stars (Grether & Lineweaver, 2006; Triaud et al., 2017). While only 40 transiting brown dwarfs have been discovered in this region (e.g. Henderson et al. 2024), coined the brown dwarf desert (Figure 8), 8 per cent are orbiting stars more massive than 2 M⊙ (Vowell et al., 2023; Grieves et al., 2021; Psaridi et al., 2022), although none of these are giants. Similarly, RV searches at first ascent giant stars, which are descended from the intermediate-mass stars that are the progenitors of white dwarfs like GD 1400, find brown dwarfs orbiting within a few AU at roughly the same frequency as for solar-type stars ( 1%; Hatzes et al. 2005; Lovis & Mayor 2007; Liu et al. 2008), and candidate substellar companions to red giants have been identified as causing long secondary period variability (Soszyński et al., 2021).
The details of the CE interaction following contact with the expanding AGB envelope are poorly understood, but it is thought the drag on the brown dwarf forces it to quickly spiral in towards the core of the AGB star. The deposition of orbital energy as kinetic energy in the envelope causes it to be ejected from the system, leaving a close binary consisting of the AGB core (now a white dwarf) and the brown dwarf (e.g. Izzard et al. 2012).
In order to test this evolutionary pathway, we have reconstructed the CE phase using the same method recently used by Zorotovic & Schreiber (2022) for similar systems. This algorithm, developed by Zorotovic et al. (2010), searches for possible white dwarf progenitors in a grid of stellar evolution tracks generated with the single-star evolution (SSE) code from Hurley et al. (2000). Assuming that the core mass of the progenitor when it filled the Roche lobe is equal to the mass of the current white dwarf, we used the radius of the progenitor and the companion mass, assuming Roche geometry, to determine the period the system had at the onset of the CE phase for each possible progenitor. We then used the energy formalism for CE developed by Webbink (1984) with the binding and orbital energy calculated as in the binary-star evolution (BSE) code from Hurley et al. (2002). The CE efficiency was left as a free parameter, while the structural parameter was calculated as in Claeys et al. (2014) without considering contributions from recombination energy. The metallicity was set to z=0.02. For the calculation of the final orbital energy we used the period the system had when it emerged from the CE, which was calculated based on the current orbital configuration and the cooling time of the white dwarf, assuming gravitational radiation during the post CE phase (Schreiber & Gänsicke, 2003).
In Figure 9 we show the total age of the system (top), i.e. the time until the CE phase occurred plus the cooling age of the white dwarf, and the progenitor mass (bottom) as a function of the CE efficiency derived from our reconstruction. The results in dark gray were computed assuming a white dwarf mass consistent with our estimation. Considering the different values reported in the literature for the white dwarf mass, we allowed the progenitor’s core to vary between and M⊙. The mass of the companion was set to M⊙ based on our estimation derived from the velocity ratio reported by Walters et al. (2023). We were able to reconstruct the CE phase without the need of recombination energy and with a small efficiency (as low as ), especially if the system is at least 2 Gyr old. Our reconstruction predicts an initial progenitor mass in the range of M⊙ and a total age of Gyr, with all possible progenitors being on the AGB phase at the onset of the CE evolution. When restricting , to align with the range derived by Zorotovic & Schreiber (2022) for similar systems, the ranges for the possible mass of the progenitor and total age of the system are reduced to M⊙ and Gyr, respectively. While the reconstructed parameters presented in Figure 9 correspond to a fixed metallicity (z=0.02), different metallicities were also tested. Although these results are not shown in the figure, a lower metallicity leads to faster evolution, allowing for possible progenitors with lower masses and less envelope mass to expel during the CE phase. This results in a lower minimum value for the reconstructed efficiency ().
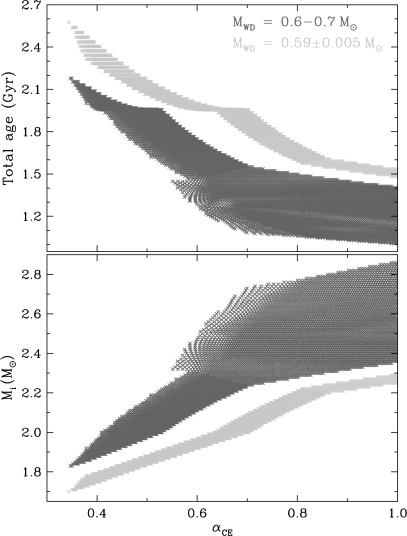
We also tested our reconstruction using the white dwarf mass of M⊙ derived by Walters et al. (2023). These results are shown in light grey in Figure 9. Again, only possible progenitors on the AGB phase are found, and the minimum value obtained for remains as low as for a larger white dwarf mass. However, the reconstruction for a lower white dwarf mass predicts progenitors with lower initial masses, resulting in an older system compared to the case with the higher white dwarf mass derived here.
Finally, considering the uncertainty in the brown dwarf mass, we repeated the calculations assuming a mass at the lower end of our estimations, i.e., M⊙. While the ranges for the possible initial mass of the progenitor and total age remained almost unchanged, we observed a slight shift towards larger values of the CE efficiency with a minimum value of . This behavior is expected, as lowering the mass of the companion does not affect the possible progenitors of the white dwarf. However, it reduces the available orbital energy to eject the envelope, which translates in a larger CE efficiency required to emerge from the CE phase at a given orbital period.
If the CE phase had happened on the first ascent of the (Red) Giant Branch (RGB) phase, the growth of the progenitor’s core would have been significantly truncated. The premature ejection of the envelope during the RGB phase leaves behind a naked He core ( M⊙). This core can ignite helium to become a hot subdwarf star, and later evolve into a hybrid He/CO white dwarf if the CE phase occurs near the tip of the RGB (Han et al., 2002; Arancibia-Rojas et al., 2024). Otherwise, if the naked core is not massive enough to ignite helium, it contracts and cools down after the CE ejection, becoming a He-core white dwarf. This is most likely the evolutionary path for WD 0137-349A, and the majority of the other known systems.
GD 1400 appears to have a different evolutionary history to many of the known close, detached white dwarfbrown dwarf binaries. Most of them contain white dwarfs with a mass M⊙ (see Table 1 in Zorotovic & Schreiber, 2022). The WD 0137-349AB system, for example, had the smaller original separation ( 0.1 AU) and underwent CE evolution on the RGB, while GD 1400B originally orbited its parent star at a wider separation, roughly between and AU, and went through CE evolution only when its companion reached the AGB.
6 Summary
Radial velocity measurements with UVES on the VLT conclusively demonstrate that the white dwarf L6-L7 dwarf binary GD 1400 is a close system with an orbital period h. Optical time-series photometry of GD 1400A shows that the pulsations are consistent with a large-amplitude ZZ Ceti variable and that the frequencies and amplitudes are unstable from year to year. photometry detects a weak reflection effect suggesting a day-night temperature difference of 100 K, but a nightside that is warmer than would be suggested by field dwarfs of the same spectral type, suggesting either the system is younger, or the constant irradiation from the white dwarf has slowed the cooling of the brown dwarf. The brown dwarf must have survived a prior phase of CE evolution, when the progenitor of the white dwarf was on the AGB phase and not the RGB phase, making it different to the majority of the known systems.
7 Acknowledgments
SLC acknowledges the support of an STFC Ernest Rutherford Fellowship ST/R003726/1. PB is supported in part by the NSERC Canada and by the Fund FQR-NT (Québec). JRF thanks the University of Leicester’s College of Science and Engineering for a PhD studentship. We thank Paul Dobbie for his input into the project. For the purpose of open access, the author has applied a Creative Commons Attribution (CC BY) licence to the Author Accepted Manuscript version arising from this submission. This paper is based on observations collected at the European Southern Observatory, Paranal, Chile (programmes 077.D-0673(A), 080.C-0587(A)), and observations made at the South African Astronomical Observatory (SAAO). This publication also makes use of data products from the Wide-field Infrared Survey Explorer, which is a joint project of the University of California, Los Angeles, and the Jet Propulsion Laboratory/California Institute of Technology, funded by the National Aeronautics and Space Administration.
Data Availability
The UVES and SOFI data are available in the ESO data archive., and the ALLWISE data are public and available at IRSA. The SAAO data are available on request to the authors.
References
- Amaro et al. (2023) Amaro R. C., et al., 2023, arXiv e-prints, p. arXiv:2303.07420
- Arancibia-Rojas et al. (2024) Arancibia-Rojas E., Zorotovic M., Vučković M., Bobrick A., Vos J., Piraino-Cerda F., 2024, MNRAS, 527, 11184
- Arcangeli et al. (2019) Arcangeli J., et al., 2019, A&A, 625, A136
- Beatty et al. (2019) Beatty T. G., Marley M. S., Gaudi B. S., Colón K. D., Fortney J. J., Showman A. P., 2019, AJ, 158, 166
- Bédard et al. (2020) Bédard A., Bergeron P., Brassard P., Fontaine G., 2020, ApJ, 901, 93
- Berger et al. (2005) Berger L., Koester D., Napiwotzki R., Reid I. N., Zuckerman B., 2005, A&A, 444, 565
- Bergeron et al. (2019) Bergeron P., Dufour P., Fontaine G., Coutu S., Blouin S., Genest-Beaulieu C., Bédard A., Rolland B., 2019, ApJ, 876, 67
- Bergeron et al. (2021) Bergeron P., et al., 2021, AJ, 162, 188
- Bognár et al. (2020) Bognár Z., et al., 2020, A&A, 638, A82
- Bognár et al. (2023) Bognár Z., Sódor Á., Clark I. R., Kawaler S. D., 2023, A&A, 674, A204
- Brown et al. (2023) Brown A. J., et al., 2023, MNRAS, 521, 1880
- Burleigh et al. (2006a) Burleigh M. R., Hogan E., Dobbie P. D., Napiwotzki R., Maxted P. F. L., 2006a, MNRAS, 373, L55
- Burleigh et al. (2006b) Burleigh M. R., et al., 2006b, MNRAS, 373, 1416
- Burleigh et al. (2011) Burleigh M. R., et al., 2011, in Schuh S., Drechsel H., Heber U., eds, American Institute of Physics Conference Series Vol. 1331, Planetary Systems Beyond the Main Sequence. pp 262–270 (arXiv:1102.0505), doi:10.1063/1.3556209
- Casewell et al. (2015) Casewell S. L., et al., 2015, MNRAS, 447, 3218
- Casewell et al. (2018a) Casewell S. L., et al., 2018a, MNRAS, 476, 1405
- Casewell et al. (2018b) Casewell S. L., Littlefair S. P., Parsons S. G., Marsh T. R., Fortney J. J., Marley M. S., 2018b, MNRAS, 481, 5216
- Casewell et al. (2020a) Casewell S. L., et al., 2020a, MNRAS, 497, 3571
- Casewell et al. (2020b) Casewell S. L., Debes J., Braker I. P., Cushing M. C., Mace G., Marley M. S., Kirkpatrick J. D., 2020b, MNRAS, 499, 5318
- Claeys et al. (2014) Claeys J. S. W., Pols O. R., Izzard R. G., Vink J., Verbunt F. W. M., 2014, A&A, 563, A83
- Cummings et al. (2018) Cummings J. D., Kalirai J. S., Tremblay P. E., Ramirez-Ruiz E., Choi J., 2018, ApJ, 866, 21
- Dekker et al. (2000) Dekker H., D’Odorico S., Kaufer A., Delabre B., Kotzlowski H., 2000, in Iye M., Moorwood A. F., eds, Society of Photo-Optical Instrumentation Engineers (SPIE) Conference Series Vol. 4008, Optical and IR Telescope Instrumentation and Detectors. pp 534–545, doi:10.1117/12.395512
- Dobbie et al. (2005) Dobbie P. D., Burleigh M. R., Levan A. J., Barstow M. A., Napiwotzki R., Holberg J. B., Hubeny I., Howell S. B., 2005, MNRAS, 357, 1049
- Dupuy & Liu (2012) Dupuy T. J., Liu M. C., 2012, ApJS, 201, 19
- Dupuy & Liu (2017) Dupuy T. J., Liu M. C., 2017, ApJS, 231, 15
- Farihi & Christopher (2004) Farihi J., Christopher M., 2004, AJ, 128, 1868
- Farihi et al. (2005a) Farihi J., Zuckerman B., Becklin E. E., 2005a, AJ, 130, 2237
- Farihi et al. (2005b) Farihi J., Becklin E. E., Zuckerman B., 2005b, ApJS, 161, 394
- Fontaine et al. (2003) Fontaine G., Bergeron P., Billères M., Charpinet S., 2003, ApJ, 591, 1184
- Fortney et al. (2008) Fortney J. J., Lodders K., Marley M. S., Freedman R. S., 2008, ApJ, 678, 1419
- Gentile Fusillo et al. (2021) Gentile Fusillo N. P., et al., 2021, MNRAS, 508, 3877
- Gianninas et al. (2011) Gianninas A., Bergeron P., Ruiz M. T., 2011, ApJ, 743, 138
- Girven et al. (2011) Girven J., Gänsicke B. T., Steeghs D., Koester D., 2011, MNRAS, 417, 1210
- Grether & Lineweaver (2006) Grether D., Lineweaver C. H., 2006, ApJ, 640, 1051
- Grieves et al. (2021) Grieves N., et al., 2021, A&A, 652, A127
- Han et al. (2002) Han Z., Podsiadlowski P., Maxted P. F. L., Marsh T. R., Ivanova N., 2002, MNRAS, 336, 449
- Hatzes et al. (2005) Hatzes A. P., Guenther E. W., Endl M., Cochran W. D., Döllinger M. P., Bedalov A., 2005, A&A, 437, 743
- Henderson et al. (2024) Henderson B. A., et al., 2024, MNRAS, 530, 318
- Hermes (2018) Hermes J. J., 2018, in Deeg H. J., Belmonte J. A., eds, , Handbook of Exoplanets. p. 6, doi:10.1007/978-3-319-55333-7_6
- Hermes et al. (2017) Hermes J. J., et al., 2017, ApJS, 232, 23
- Hernández Santisteban et al. (2016) Hernández Santisteban J. V., et al., 2016, Nature, 533, 366
- Hurley et al. (2000) Hurley J. R., Pols O. R., Tout C. A., 2000, MNRAS, 315, 543
- Hurley et al. (2002) Hurley J. R., Tout C. A., Pols O. R., 2002, MNRAS, 329, 897
- Izzard et al. (2012) Izzard R. G., Hall P. D., Tauris T. M., Tout C. A., 2012, in Planetary Nebulae: An Eye to the Future. pp 95–102, doi:10.1017/S1743921312010769
- Kilkenny et al. (2014) Kilkenny D., Welsh B. Y., Koen C., Gulbis A. A. S., Kotze M. M., 2014, MNRAS, 437, 1836
- Kiman et al. (2022) Kiman R., Xu S., Faherty J. K., Gagné J., Angus R., Brandt T. D., Casewell S. L., Cruz K. L., 2022, AJ, 164, 62
- Knutson et al. (2012) Knutson H. A., et al., 2012, ApJ, 754, 22
- Koester (2010) Koester D., 2010, Mem. Soc. Astron. Italiana, 81, 921
- Koester et al. (1998) Koester D., Dreizler S., Weidemann V., Allard N. F., 1998, A&A, 338, 612
- Koester et al. (2009) Koester D., Voss B., Napiwotzki R., Christlieb N., Homeier D., Lisker T., Reimers D., Heber U., 2009, A&A, 505, 441
- Lee et al. (2020) Lee E. K. H., Casewell S. L., Chubb K. L., Hammond M., Tan X., Tsai S.-M., Pierrehumbert R. T., 2020, MNRAS, 496, 4674
- Lenz & Breger (2005) Lenz P., Breger M., 2005, Communications in Asteroseismology, 146, 53
- Lew et al. (2022) Lew B. W. P., et al., 2022, AJ, 163, 8
- Littlefair et al. (2007) Littlefair S. P., Dhillon V. S., Marsh T. R., Gänsicke B. T., Baraffe I., Watson C. A., 2007, MNRAS, 381, 827
- Littlefair et al. (2014) Littlefair S. P., et al., 2014, MNRAS, 445, 2106
- Liu et al. (2008) Liu Y. J., et al., 2008, ApJ, 672, 553
- Longstaff et al. (2017) Longstaff E. S., Casewell S. L., Wynn G. A., Maxted P. F. L., Helling C., 2017, MNRAS, 471, 1728
- Lorenz et al. (1998) Lorenz R., Mayer P., Drechsel H., 1998, A&A, 332, 909
- Lothringer & Casewell (2020) Lothringer J. D., Casewell S. L., 2020, ApJ, 905, 163
- Lovis & Mayor (2007) Lovis C., Mayor M., 2007, A&A, 472, 657
- Mainzer et al. (2011) Mainzer A., et al., 2011, ApJ, 731, 53
- Marley et al. (2021) Marley M. S., et al., 2021, ApJ, 920, 85
- Maxted et al. (2006) Maxted P. F. L., Napiwotzki R., Dobbie P. D., Burleigh M. R., 2006, Nature, 422, 543
- McCarthy & Zuckerman (2004) McCarthy C., Zuckerman B., 2004, AJ, 127, 2871
- Metchev & Hillenbrand (2009) Metchev S. A., Hillenbrand L. A., 2009, ApJS, 181, 62
- Mikal-Evans et al. (2022) Mikal-Evans T., et al., 2022, Nature Astronomy,
- Moorwood et al. (1998) Moorwood A., Cuby J. G., Lidman C., 1998, The Messenger, 91, 9
- Mullally et al. (2008) Mullally F., Winget D. E., Degennaro S., Jeffery E., Thompson S. E., Chandler D., Kepler S. O., 2008, ApJ, 676, 573
- Napiwotzki et al. (2001) Napiwotzki R., Edelmann H., Heber U., Karl C., Drechsel H., Pauli E.-M., Christlieb N., 2001, A&A, 378, L17
- Napiwotzki et al. (2004) Napiwotzki R., et al., 2004, in Hilditch R. W., Hensberge H., Pavlovski K., eds, Astronomical Society of the Pacific Conference Series Vol. 318, Spectroscopically and Spatially Resolving the Components of the Close Binary Stars. pp 402–410 (arXiv:astro-ph/0403595)
- Napiwotzki et al. (2020) Napiwotzki R., et al., 2020, A&A, 638, A131
- Parsons et al. (2017) Parsons S. G., et al., 2017, MNRAS, 471, 976
- Patterson et al. (2005) Patterson J., Thorstensen J. R., Kemp J., 2005, PASP, 117, 427
- Pinfield et al. (2006) Pinfield D. J., Jones H. R. A., Lucas P. W., Kendall T. R., Folkes S. L., Day-Jones A. C., Chappelle R. J., Steele I. A., 2006, MNRAS, 368, 1281
- Politano (2004) Politano M., 2004, ApJ, 604, 817
- Psaridi et al. (2022) Psaridi A., et al., 2022, A&A, 664, A94
- Rappaport et al. (2017) Rappaport S., et al., 2017, MNRAS, 471, 948
- Rebassa-Mansergas et al. (2022) Rebassa-Mansergas A., Xu S., Raddi R., Pala A. F., Solano E., Torres S., Jiménez-Esteban F., Cruz P., 2022, arXiv e-prints, p. arXiv:2203.05901
- Schreiber & Gänsicke (2003) Schreiber M. R., Gänsicke B. T., 2003, A&A, 406, 305
- Soszyński et al. (2021) Soszyński I., et al., 2021, ApJ, 911, L22
- Steele et al. (2011) Steele P. R., Burleigh M. R., Dobbie P. D., Jameson R. F., Barstow M. A., Satterthwaite R. P., 2011, MNRAS, 416, 2768
- Steele et al. (2013) Steele P. R., et al., 2013, MNRAS, 429, 3492
- Stevenson et al. (2014) Stevenson K. B., et al., 2014, Science, 346, 838
- Tremblay et al. (2011) Tremblay P. E., Bergeron P., Gianninas A., 2011, ApJ, 730, 128
- Tremblay et al. (2013) Tremblay P. E., Ludwig H. G., Steffen M., Freytag B., 2013, A&A, 552, A13
- Tremblay et al. (2016) Tremblay P. E., Cummings J., Kalirai J. S., Gänsicke B. T., Gentile-Fusillo N., Raddi R., 2016, MNRAS, 461, 2100
- Triaud et al. (2017) Triaud A. H. M. J., et al., 2017, A&A, 608, A129
- Vanderburg et al. (2020) Vanderburg A., et al., 2020, Nature, 585, 363
- Vincent et al. (2020) Vincent O., Bergeron P., Lafrenière D., 2020, AJ, 160, 252
- Vowell et al. (2023) Vowell N., et al., 2023, AJ, 165, 268
- Walters et al. (2023) Walters N., Farihi J., Marsh T. R., Breedt E., Cauley P. W., von Hippel T., Hermes J. J., 2023, MNRAS, 519, 1381
- Webbink (1984) Webbink R. F., 1984, ApJ, 277, 355
- Wright et al. (2010) Wright E. L., et al., 2010, AJ, 140, 1868
- Zhou et al. (2022) Zhou Y., et al., 2022, AJ, 163, 17
- Zorotovic & Schreiber (2022) Zorotovic M., Schreiber M., 2022, MNRAS, 513, 3587
- Zorotovic et al. (2010) Zorotovic M., Schreiber M. R., Gänsicke B. T., Nebot Gómez-Morán A., 2010, A&A, 520, A86
- van Roestel et al. (2021) van Roestel J., et al., 2021, ApJ, 919, L26