Measurement, self-similarity, and TNT equivalence of blasts from exploding wires
Abstract
Reduced-scale experiments offer a controlled and safe environment for studying the effects of blasts on structures. Traditionally, these experiments rely on the detonation of solid or gaseous explosive mixtures, with only limited understanding of alternative explosive sources. This paper presents a detailed investigation of the blasts produced by exploding aluminum wires for generating shock waves of controlled energy levels. We meticulously design our experiments to ensure a precise quantification of the underlying uncertainties and conduct comprehensive parametric studies.
We drawn practical relationships of the blast intensity with respect to the stand-off distance and the stored energy levels. The analysis demonstrates self-similarity of blasts with respect to the conventional concept of the scaled distance, a desirable degree of sphericity of the generated shock waves, and high repeatability. Finally, we quantify the equivalence of the reduced-scale blasts from exploding wires with high explosives, including TNT. This experimental setup and the present study demonstrate the high degree of robustness and effectiveness of exploding aluminum wires as a tool for controlled blast generation and reduced-scale structural testing.
Keywords: Reduced-scale experiments; Exploding wire; Blast; Shock wave; TNT equivalence; Scaling law.
1Nantes Université, Ecole Centrale Nantes, CNRS,
Institut de Recherche en Génie Civil et Mécanique (GeM), UMR 6183,
Nantes, France.
2Sydney Centre in Geomechanics and Mining Materials (SciGEM),
School of Civil Engineering, The University of Sydney,
Sydney, Australia.
1 Introduction
The investigation of the dynamic response of structures subjected to blast loading is a major issue in protecting such assets against explosions. Experimental testing plays a crucial role in enhancing our understanding of how structures respond to blast waves, and it can be broadly classified into full-scale and reduced-scale testing (see, [47, 32, 17, 9, 39, 26, 11, 28], among others). However, full-scale testing is non-trivial due to the inherent costs, difficulties in ensuring repeatability, and safety risks [6]. In contrast, reduced-scale testing offers increased control and repeatability, with reduced hazards and costs, hence it offers the possibility of performing parametric studies, rather than single tests [28].
In reduced-scale experiments, two critical aspects must be considered: (1) scaling laws and (2) the type of the explosive source.
Scaling laws ensure the equivalence between blast loads acting on the reduced-scale model and those acting on the full-scale prototype. Depending on the phenomena under investigation, different scaling laws for blast waves, blast loads, and their effects on structures are available in the literature (see [16, 4, 19, 43, 23], among others). Regardless of the chosen scaling law, reduced-scale tests typically require smaller amounts of energy than those required in full-scale, field testing. The required explosive mass depends on the type of explosive, its chemical composition, and the dimensions of the tested environment and model, which are governed by the chosen scaling laws.
Explosives can vary widely as far as it concerns their chemical composition, e.g. trinitrotoluene (TNT), pentaerythritol tetranitrate (PETN), Composition C4, and are classified as solid or fluid (cf. [25, 46, 30, 39]). In reduced-scale settings, solid explosives, including TNT, are often disregarded due to (1) the difficulty in handling and preparing very small explosive masses (as small as a few micrograms, cf. [31]), (2) the need for an igniter to detonate the explosive, and (3) the safety concerns associated with their storage that render difficult their use in a laboratory setting.
An alternative consists of gaseous explosives which can be stored more safely, allow precise control of the chemical components for explosions of varying intensities, and are easier to handle in a reduced-scale environment. A common approach consists of detonating gas bubbles initiated electrically – for a detailed review, we refer to Zyskowski et al. [47], Sochet and Maillot [39]. However, gaseous explosive mixtures may require relatively large gas volumes, posing practical challenges when conducting reduced-scale experiments on centimeter-scale structures while maintaining geometric similarity in terms of stand-off distance and explosive radius.
Another experimental approach consists of resorting to shock tubes for generating shocks in air for tests at medium or small-scale testing [17, 37]. However, the setup produces shock waves that differ from those generated by conventional explosions (with longer characteristic times) and is limited to the study of isolated structural elements as the loading acts along a distinct direction rather than (hemi-)spherically.
Alternatively, the use of analogue explosives has been gaining increased attention in reduced-scale testing. This is the case of exploding wires, where a rapid discharge of high electrical loads over a thin conductor produces repeatable blast-type shock waves of controlled intensity similar to those produced by conventional explosives (cf. [2, 8, 22, 21, 33, 12, 10]). The concept of exploding wire dates back to the late 18th century, with the seminal work of [29] who connected slender pieces of silver and copper to a Leyden jar, causing the wire to explode upon discharge. [8] later built on this research, using exploding wires to deposit a thin gold film and provided early insights into the phenomenon. Recently, the study of the generation of shock waves from exploding wires gathered further attention (see [1, 5, 13, 21, 24, 39, 36]).
Several experimental studies have been focused on the understanding of the effects of different parameters affecting the blast generated from exploding wires. For instance, Bennett [1] investigated the shape of shock waves generated by exploding wires, using mirrors and high speed cameras, finding cylinder-shaped shock waves fronts. [33] investigated blast-structure interactions arising from exploding wires. Liverts et al. [22] implemented the exploding wire technique to study blast-wave interaction in aqueous foams. Sochet and Maillot [39] performed an extensive study on the impact of the wire’s diameter, length, and capacitor charge on the resulting shock-wave pressure profiles and time-history. In particular, they demonstrated a significant influence of the wire diameter on the resulting blast overpressure. Liu et al. [21] demonstrated that the energy deposition within conductive wires strongly depends on the (dis)charging voltage and the wire dimensions. More recently, Mellor et al. [24] studied the temporal evolution of shock waves, utilizing the Schlieren flow visualization technique, and identified a spatial transition from ellipsoidal to spherical shock wave fronts as they are expanding outward. Han et al. [12] further investigated the dynamic formation of plasma occurring in the explosion of wires using copper/nickel alloy wires, showing that the material properties impact the plasma formation.
Despite the aforementioned seminal works and studies, our understanding of the blast loads generated from exploding wires remains limited compared to conventional explosives like TNT. This is particularly true in terms of how these blasts scale with key parameters such as stand-off distance and the energy discharged through the electrical circuit. While detailed characterizations are available for TNT, data on exploding wires remains fragmented and sparse, ultimately hindering their application in studying blast effects on structures within controlled laboratory conditions.
The objective of this paper is to provide a comprehensive characterization of the blasts generated from exploding aluminum wires using a newly developed reduced-scale experimental setup for structures, referred to as miniBLAST [28, 27]. The setup also enables us to analyze the effect of varying energies stored in the capacitor before the electrical discharge and the spatial and temporal evolution of the resulting blasts. Therefore, based on experimental measurements of blast overpressure time-histories, we measure the corresponding blast impulse, which is crucial for analyzing the effects of an explosion on structures under appropriate scaling laws (cf. [23]). The high repeatability of our experiments provides a robust characterization of the blast parameters, including the arrival time of the shock wave, the positive and negative overpressure peaks, the (positive and negative) load duration, as well as the impulse peaks. Based on this analysis, we demonstrate that the blasts produced from exploding wires follow the same scaling law observed for conventional high-explosives, e.g. TNT [16, 4]. Next, we compare the blasts generated from exploding wires with conventional solid explosives and draw equivalence factors with TNT charges (cf. [7]). Finally, we illustrate how the generated reduced-scale blasts can be up-scaled to simulate large-scale explosions with the ultimate objective of studying the response and failure of structures subjected to explosions.
The paper is structured as follows. Section 2 outlines the experimental setup and the metrology used to characterize the generated blasts. Particular emphasis is given to the repeatability, sampling rate and measurement errors. Section 3 presents the profile and the time-history of the measured incident overpressure and impulse, at varying of the stand-off distance, , and stored energy, , in the capacitor. This is followed by a study of the shape of the front of the generated shock waves. Next, Section 4 presents the evolution of the blast parameters as function of the stand-off distance and stored energy, by further discussing the scaling of such parameters with respect to the conventionally adopted scaled distance and provides best-fit analytical interpolations (regression). Finally, Section 5 discusses and presents the TNT equivalence of the generated blasts and offers new insights on the upscaling of reduced-scale explosions from exploding wires.
2 Methods
Our experiments leverages the novel experimental setup miniBLAST which ensures a controlled and isolated environment in a laboratory setting (for more details, we refer to [28]). miniBLAST has been developed to study the response of structures subjected to blast loads at reduced scale. The experimental setup ensures safety, repeatability, and precise measurements. The setup is composed of a container cabin of dimensions m3 (length ×width ×height). The cabin isolates the experiments from the rest of the laboratory, providing a controlled environment and protection for personnel and equipment. Inside the cabin, an acoustic foam covering ensures absorption of the generated shock waves, thus reducing the influence of eventual reflections in our measurements, see Figure 1(a).
The experiments are conducted on an optical table ( cm wide, cm long, and cm high) with six pneumatic supports to ensure a stable and leveled base for testing. This table is specially designed to withstand the blast loads generated during the explosions [28] under negligible deformation. A ventilation system is used to remove metal dust particles produced during the detonation. The exploding wire system comprises two circuits: (1) a charging circuit composed of an electric source, a high-current switch, and twelve capacitors (with nominal capacitance µF), and (2) a discharge circuit comprising six Ignitron switches (Ignitron NL7703 mercury switches) and a coaxial cable ( m long) that connects the capacitor with to the electrodes. The energy, , that can be stored within the capacitor is in between J and kJ (for more details, see [28]). The electrodes are installed within the optical table and connected with an aluminum wire representing the analogue explosive source. In all considered scenarios, the aluminum wire has a diameter of µm and a length of µm, and is weakly fixed to the electrodes by using a commercial tape, see Figure 1(c).

For the measurement of the incident blast wave resulting from the exploding aluminum wire, we use pencil probes, which enable minimum disturbances of the incident air flow and, therefore, minimize reflections and diffraction of the impinging shock wave. We use 6233AA0050 pencil probes with a full scale output of kPa. In most scenarios, we position the pencil probes on the optical table at a stand-off distance from the aluminum wire and fix them adequately with tape, see Figure 1(b). Additionally, we measure the overpressure along the normal direction of the optical table (vertically) by suspending the pencil probe over the table with a stand. The pressure sensors are connected to a data acquisition system (TraNET FE 404) and to an oscilloscope enabling to report the trigger signal at the moment of closing of the discharge circuit. Finally, to prevent the effect of thermal transients [3] stemming from the exploding wire, which may result in fictitious recording of the overpressure signal (e.g. long-standing negative phase), we employ an aluminum foil applied on top of the sensor. For more details, we refer to [28].
2.1 Analysis of the signal and post-processing
The overpressure signal is recorded at a sampling rate of 5 MS/s (mega-samples per second), which provides high accuracy for capturing the overpressure peak (see [28]). The sensor has two main sources of uncertainty: (1) acceleration sensitivity of kPa/g and (2) a linearity error of kPa. Thus, the total error of the pencil probe is more than satisfactory for an accurate investigation of the positive and negative phases of the blast as it will be shown below. Additionally, the sensor has a low rise time ( µs) to reach of its total range ( kPa). The maximum recorded level of overpressure increase is approximately kPa – that is, of the full scale output – within a time interval of approximately µs. Accordingly, the rise time error is negligible in all measurements.
Figure 2 presents the trigger signal and the incident overpressure time-history, shifted to the origin using the triggering time, , as measured from the oscilloscope. The overpressure signals are recorded from three identical tests at a stand-off distance cm, for a stored energy kJ. The signature of the blast load agrees with that resulting from the detonation of solid explosive. Moreover, the three measurements overlap near-perfectly, which demonstrates the excellent repeatability of the generated explosions and the high performance of the measurement system.
It is worth noticing that from the trigger point, , some minor spikes in the overpressure signal appears at variable times , cf. Figure 2. These disturbances are caused by the electrical discharge shortly after the aluminum wire explosion, which results in flashes and occasional electrical arcs. However, in all recorded scenarios, these spikes consistently occur at times less than half of the shock wave arrival time, , thus they do not affect the main overpressure measurements.
For the sake of simplicity, we remove any eventual spikes by post-processing all recorded overpressure measurements by identifying the arrival time, , and zeroing the value of the pressure for smaller times, . The arrival time is automatically identified as the last intersection point between the recorded signal and the horizontal axis at kPa, from the trigger time, , until the point where the overpressure reaches its peak, cf. Figure 2. This results in signals of the type of that schematically sketched in Figure 3. With reference to the same figure, we define the conventionally adopted blast parameters for the positive and the negative phase. For the positive phase, the parameters are: (1) the arrival time, , (2) the overpressure peak, , (3) the positive time duration, , and (4) the positive impulse peak, . For the negative phase, we define (1) the underpressure peak, , (2) the negative impulse peak, , and (3) the duration of the negative phase, . The peaks and are identified as the absolute maximum and minimum values of the pressure signal, respectively. The positive time duration, , is identified as the intersection between the pressure signal with the horizontal axis between the peaks and . Similarly, the negative phase duration, , is determined for times . Finally, the impulse, , and the corresponding peaks, and , are computed by integrating the overpressure over the relevant time intervals, namely
| (1) |
Note that, following the convention in [41], we define both the negative impulse and underpressure as positive.
3 Results
Using the aforementioned setup, we conduct a total of 90 experiments to adequately capture the time history of blasts generated by the exploding wire as a function of the stand-off distance, , and the capacitor’s stored energy, , with the pencil probe positioned on the optical table, cf. Figure 1, face-on the exploding wire. Next, an additional set of 24 experiments is performed for studying the shape of the front of the generated shock waves.
3.1 Evolution of the incident overpressure and impulse
The stand-off distance varies between 20 and 70 cm, while the energy levels span between 0.5 and 10 kJ. In parallel, to verify and ensure the repeatability of the experimental results , each test is conducted three times, resulting in three distinct measurements for each scenario.
Figure 4 presents the time history of the incident pressure for the range of stand-off distances, at varying of the energy level. As expected, higher energy level results in larger amplitudes of the incident overpressure during both the positive and negative phases. Conversely, an increase in the stand-off distance leads to a reduction in amplitude.
The measurements show lack of parasitic reflections and diffractions, which would affect the time evolution of the measured pressure signal. In all considered scenarios, the positive overpressure is much larger than the error intrinsic to the pencil probe’s measurements (approximately kPa). However, for very low energies ( kJ) the underpressure peak can sometimes approach the intrinsic error of the sensor. This issue is further analyzed in Section 4.
Following the definition of the impulse, Equation 1, we compute it from the recorded pressure signals using the trapezoidal rule. The resulting time evolution of the incident impulse is presented in Figure 5. The higher the capacitor’s energy, and the lower the stand-off distance , the larger the impulse is. It is worth mentioning that for low energies, the total impulse – that is, the value of at the end of the negative phase – approaches zero. This is due to a non-negligible negative phase, which could be important for the dynamic response of slender structures due to their relatively short characteristic time (cf. [34]).
3.2 Analysis of the shock wave shape and pressure distribution
Following the results of Bennett [1], Mellor et al. [24], we analyze the sphericity of the shock waves produced by the exploding wire. In particular, we measure the time evolution of the overpressure for different incident angles around the exploding wire position, see Figure 6. The pencil probes are positioned at different angles relative to the direction normal to the axis of the exploding wire.
The energy level is kept constant, i.e., kJ, and the tests are performed at two distinct stand-off distances, i.e. 30 and 50 cm. Figures 7 and 8 presents the time history of the overpressure with respect to , at cm and cm. We observe that the positive phase of the blast is almost identical, independently of . Some clearing effects (caused by diffraction) start appearing during the negative phase for angles approaching and some reflections are visible at longer times, ms. These reflections and diffraction are likely due to the presence of the electrodes and the shorter length of the optical table.
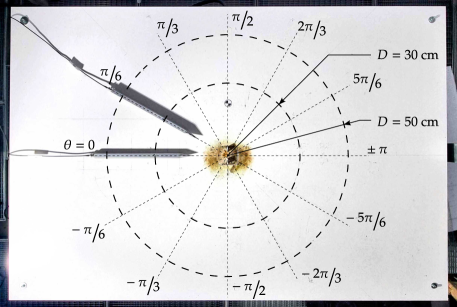
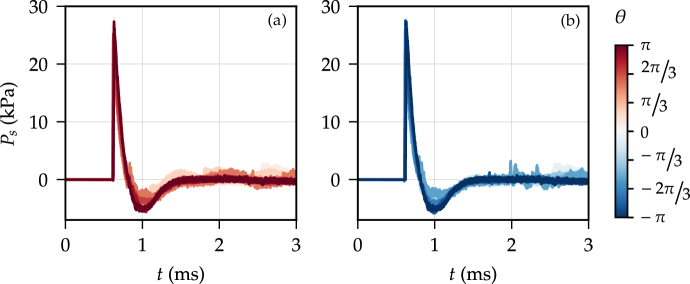
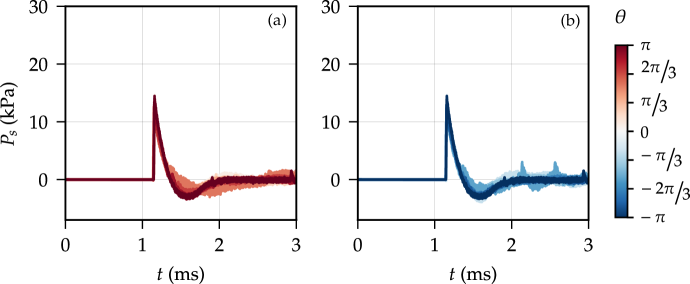
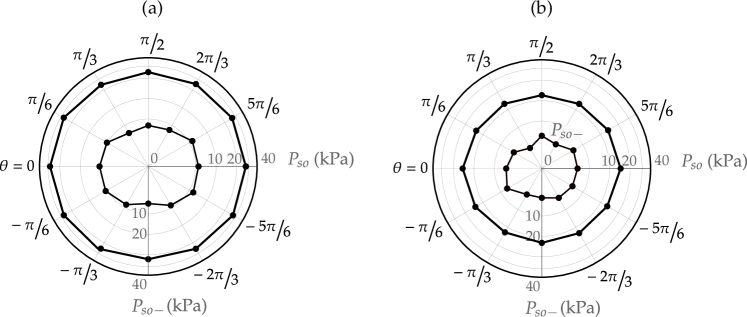
Figure 9 shows the spatial distribution of the overpressure and underpressure peaks, and , which provide a reasonable approximation of the shock wave front shape. At very short distances from the wire, the shock wave front is expected to take a cylindrical form (cf. [1]). However, as the distance increases, the front should evolve into a spherical shape (cf. [24]). Indeed, in Figure 9 we observe a nearly spherical (circular) front at cm and an ellipsoidal front at cm. The electrodes do not seem to cause any significant distortion to the sphericity of the front at the measured distances, with only a limited influence on the distribution of the underpressure peak, . The sphericity of the shock wave front is further confirmed by measurements obtained from a pencil probe suspended above the optical table, see Figure 1(b). In this case, for a stand-off distance cm, we found that the over- and under-pressure peaks – kPa and kPa – are found to be nearly identical to the values measured at , at the same distance.
4 Blast parameters
Following the definitions provided in subsection 2.1, we compute the blast parameters characterizing the positive and negative phases for the case of a normal shock wave, i.e., for , see Figure 6. Figure 10 displays how the overpressure peaks, impulses, arrival time, positive and negative phase duration depend on the stand-off distance, , for different energy levels, . For completeness, we include error bars associated with the pressure measurements, and , accounting for the linearity error of the pencil probe, which is kPa, see subsection 2.1. We neglect the error associated with the acceleration sensitivity of the piezoelectric crystal, which is approximately kPa/g, because the pencil probe remains fixed throughout all experiments. Indeed, although some accelerations may occur, the corresponding error remains negligible compared to the linearity error (with a difference of one order of magnitude). The error bars for the positive and negative impulses are calculated by propagating the pressure measurement errors, i.e., , where µs is the time interval associated with the sampling rate of 5 MS/s, is the number of samples corresponding to the positive and the negative impulse, and , respectively. The resulting error for and is negligible for all scenarios, see Figure 10. No error bars are presented for the arrival time or the duration of the positive and negative phases, as the rise time error of the pencil probe is negligible within the measured pressure range.
As the energy increases, the overpressure peak, , the impulse and , and time durations, and , increase. The arrival time presents the opposite trend: the shock wave travels at higher velocity as the stored energy increases, thus reduces. For the underpressure peak, we observe that, overall, the higher the energy level is, the higher becomes. However, for low energies, kJ, is only slightly affected.
Note that, despite our efforts to accurately capture the negative phase – such as minimizing thermal transients and secondary reflections – the measurements for the negative phase are less reliable than those for the positive phase. This is evident from the increasing spread of the error bars at large distances, cm.
4.1 Self-similarity
For high explosives such as TNT and C4, it is common [41] to scale the blast parameters according to the Hopkinson-Cranz [16, 4] self-similarity law. This law states that blasts from different explosions at the same atmospheric pressure are self-similar if the associated scaled distance is the same, where
| (2) |
is the stand-off distance, also conventionally referred to as shock wave radius, and is the (internal) energy of the explosive mass.
Here, we aim at demonstrating that the same self-similarity is also valid for blasts generated by exploding wires. In doing so, we consider that the internal energy of the ‘equivalent’ explosive mass coincides with the energy stored in the capacitor, thus assuming that the whole stored energy is discharged and transferred to the blast, . Note that this is, in general, not necessarily true, as a small part of the stored energy may be consumed or be trapped within the discharge circuit. Moreover, part of the discharged energy is lost during the phase transition process of the aluminum wire and in the formation of plasma [28]. However, considering allows for a straightforward characterization of the blast parameters with respect to the scaled distance.
Figure 11 presents the blast parameters as function of the scaled distance, . The impulse peaks and time durations have been converted to their respective scaled values: scaled impulse peaks, and , and scaled times, , , and . The scaling is achieved by dividing each parameter by , e.g. .
Despite minor discrepancies at lower energy levels, specifically at kJ, it is clear that nearly all blast parameters scale very well with the scaled distance, , confirming the validity of the Hopkinson-Cranz self-similarity law for blasts generated by exploding aluminum wires too. The only parameter that shows a weaker correlation with is the negative phase duration, . This may be due to the inherently lower accuracy in measuring the negative phase, as compared to the positive phase, as well as the difficulty in precisely determining the end of the negative phase at low energy levels. Whilst being outside of the scope of the present paper, one possible path to investigate in the future is consider higher energy levels, kJ.
We believe that the above experimental results are significant not only because they confirm the self-similarity in exploding wire blasts, but also because they enable effective comparisons with other conventional, well-documented explosives such as TNT. This comparison is explored further in Section 5.
4.2 Best-fit interpolations
We present analytical interpolations of the blast parameters characterizing both the positive and the negative phase. The best-fit interpolations are obtained through symbolic regression, leveraging the gplearn library [40]. By identifying , the expression for the pressure peaks, and (in kPa), reads
| (3a) | ||||
| (3b) | ||||
for the scaled impulses, and in (kPa.ms/kJ1/3),
| (4a) | ||||
| (4b) | ||||
and for the scaled times, , , and (in ms/kJ1/3),
| (5a) | ||||
| (5b) | ||||
| (5c) | ||||
Figure 12 juxtaposes the (raw) blast parameters and the corresponding best-fit interpolations at varying of the scaled distance, .
Note that the aforementioned expressions are only valid for the particular range of tested scaled distances, i.e., m/kJ1/3, and for the considered electrical circuit, whose details can be found in [28].
5 Shock wave radius, TNT equivalence, and upscaling
Several representations of a ‘universal’ relationship relating the energy (or mass) of explosives with the resulting blast parameters exist. Two of the most common approaches are (1) the shock wave radius versus arrival time concept (, [15]) and (2) the TNT equivalence factor [7].
The relationship allows for the comparison of shock wave profiles generated by different explosives, and facilitates the computation of the shock wave velocity and of the energy. Following [15], we compute the profiles of shock waves driven by exploding wires and compare them with those produced by a range of conventional high explosives, including PETN, TNT, and C4. This comparison is shown in Figure 13, where inset (a) displays the profiles of different explosives, and inset (b) focuses on the profile region specific to exploding wires. Note that we show the mean value of the arrival time (over three identical experiments), for each energy level.
The profiles from the exploding wires, like those of most conventional explosives, lie on the region of supersonic shock waves, indicating that the exploding wire technique enables to obtain shock waves with Mach number , in particular, . The shock profiles produced by exploding wires are comparable to those generated by the detonation of 1 g of PETN, despite a different dependency of the shock velocity on the shock wave radius (slope of the curve).
For completeness, it is worth noting that, following the work of Hargather et al. [15], the curves can also be expressed in terms of dimensionless radius and time. Although such a comparison could offer an alternative method for calculating the blast energy, this is beyond the scope of the current study and is reserved for future work.
5.1 TNT equivalence
As discussed earlier, different explosives lead to different blast parameters and different dependencies with respect to the scaled distance, . Under these circumstances, the TNT equivalence is the most widely adopted approach. The goal is to identify the blast parameters arising from the explosive source at hand in terms of TNT, which is historically used as the reference material due to its well-established explosive properties, consistent behavior, and the development of the widely accepted empirical formulae by Kingery and Bulmash [18].
The TNT equivalence factor is then defined as the ratio between the energy released by the denotation of a mass of TNT and the energy associated with the considered explosive, i.e.
| (6) |
such that the TNT mass, , and the actual explosive yield the same blast effects, where , MJ/kg3 is the specific internal energy of TNT, and is the energy corresponding to the actual explosive.
Several approaches exist to compute the equivalence factor (for more details, we refer to [38]). Here, we focus on the most widely adopted and, namely, the equivalence factors based on (1) the positive overpressure peak and (2) the positive impulse peak ( cf. [7, 45]).
According to [7], we define the two equivalence factors respectively as
| (7) | ||||
| (8) |
where the scaled distance is computed according to Equation (2) and similarly for , using the energy .
Following Equations (7) and (8), we compute the equivalence factors. For TNT, we leverage the best-fit interpolations of the data collected by Kingery and Bulmash [18], and for the exploding wires, we consider both the raw data points in Figure 11 and the best-fit interpolations presented in subsection 4.2.
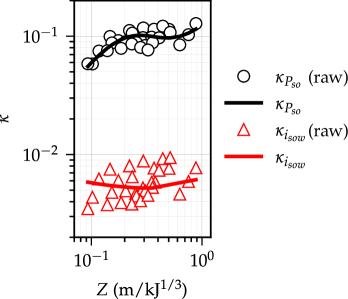
Figure 14 presents the two TNT equivalence factors. The two methods – one based on and the other on – yield significantly different equivalences, with a substantial difference exceeding one order of magnitude: and . The equivalence factor based on also shows a relatively strong dependence on the scaled distance, , suggesting that the commonly adopted assumption of a single, constant value for the equivalence factor is not appropriate. Similar discrepancies between and , as well as their dependency on , have been observed in studies of conventional high explosives (see [45], among others).
It should also be noted that the values of the equivalence factors may be influenced by the assumed energy associated with the exploding wires. However, even if the effective blast energy is lower than the nominal energy stored in the capacitor, i.e., , this would primarily result in a shift toward slightly higher values of . Hence, the difference between and , as well as their dependence on scaled distance, would likely remain unchanged.
After having determined the equivalence factors, we estimate the equivalent TNT mass, , whose detonation would produce the same value of the overpressure peak and of the scaled impulse at a specified scaled distance, , according to
| (9) |
Figure 15 presents the equivalent TNT mass at varying of the scaled distance, , and of the energy levels, where inset (a) considers and inset (b) uses .
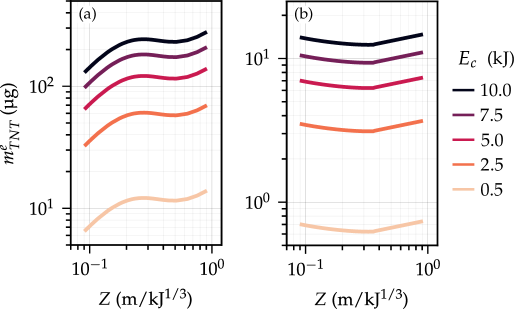
As expected, the two approaches yield significantly different TNT equivalent masses. For instance, for kJ, we obtain µg using and µg using . We can also observe a relatively strong dependence with respect to the stored energy, , between 0.5 and 2.5 kJ.
5.2 Blast upscaling
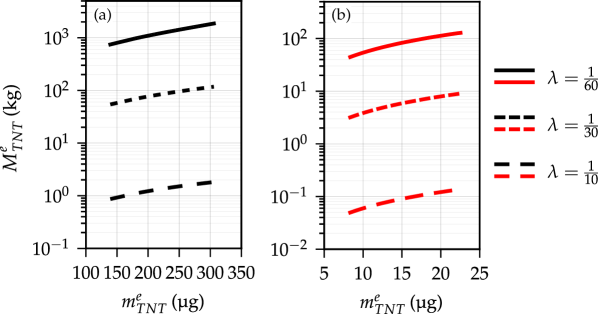
It is interesting to explore how the (reduced-scale) blasts generated by exploding aluminum wires can be scaled to represent a full-scale prototype explosion. To achieve this, we leverage the scaling laws developed by Masi et al. [23] and consider three different values for the geometric scaling factor of the model, denoted as , where is the characteristic length of the model (in this case, ), and is the corresponding length in the full-scale prototype. For example, given a specific , the upscaled stand-off distance in the prototype is .
Figure 16 presents the upscaling relationship between the TNT equivalent mass in the prototype, , and the actual mass in the model, , for both TNT equivalence factors. These results represent the proof of concept for the current study, demonstrating how reduced-scale experiments using exploding wires could be employed to investigate blast effects on structures.
6 Conclusions
Reduced-scale experiments offer compelling advantages over full-scale and field experiments, when appropriate scaling laws are available [16, 23]. Existing research has primarily focused on blast experiments using solid or gaseous mixtures of explosive [30, 39]. However, these explosive sources pose practical challenges due to environmental hazard and difficulties in managing small explosive charges while ensuring geometric similarity with full-scale prototypes. In response to these limitations, exploding wires have gained attention for their ability to generate controlled, blast-like shock waves [31, 36, 24].
Building on this technology, we conducted an extensive analysis of the blasts generated by exploding aluminum wires using a novel experimental setup designed for studying blast effects on structures in a controlled and safe laboratory environment [28]. Through parametric tests and repeated experiments under identical conditions, we demonstrated a high level of robustness and repeatability in the resulting blasts. Our analysis provided a comprehensive examination of how blast intensity varies with both the stand-off distance and the energy stored in the capacitor. Next, we identified key blast parameters, including the over- and under-pressure peaks, the positive and negative impulses, as well as the arrival time, and the positive and negative phase duration. Those parameters were found to follow the self-similarity law proposed by Hopkinson [16] that is commonly applied to high explosives.
Finally, we studied the equivalence of blasts from aluminum wires to those from conventional explosives, such as TNT. We calculated the TNT equivalence factors and established a direct correspondence between the stored energy and the equivalent mass of TNT. These factors were found to be strongly dependent on the particular approach used to evaluate them, namely relying on the overpressure peak or the scaled positive impulse, as well as the stand-off distance. This finding indicates that single, constant equivalence factors may be inappropriate.
The novel experimental setup and the detailed characterization of the blasts from exploding wires open new perspectives in the study of reduced-scale explosions and the fast structural dynamics due to blast loads, with reduced costs, increased safety, and repeatability of tests. As a result, this work lays foundations for broader investigations.
Declaration of competing interest
The authors declare that they have no known competing financial interests or personal relationships that could have appeared to influence the work reported in this paper.
Data availability
Experimental data accompanying this manuscript and codes used for post-processing will be made publicly available at https://github.com/filippo-masi/miniBLAST.
Acknowledgments
The authors would like to acknowledge the support of the Region Pays de la Loire and Nantes Métropole under the Connect Talent programme (CEEV: Controlling Extreme EVents - BLAST: Blast LoAds on STructures). Special thanks also go to Prof. Guillaume Racineux and Mr. Emmanuel Marché for our fruitful discussions and their technical assistance regarding the implementation of the system.
References
- Bennett [1958] F. D. Bennett. Cylindrical shock waves from exploding wires. The Physics of Fluids, 1(4):347–352, Jul. 1958. doi: https://doi.org/10.1063/1.1705893.
- Chace and Moore [1968] W. G. Chace and H. K. Moore, editors. Exploding Wires. Springer New York, NY, Jul. 1968. ISBN 978-1-4899-7330-6. doi: https://doi.org/10.1007/978-1-4899-7328-3.
- Chan and Simpson [1979] C. Chan and M. Simpson. Thermal-transient effects on pressure measurements: Thermal transients at the boundaries of diaphragm-type pressure transducers can cause mechanical deformations in the diaphragm, and simulate erroneous pressure transients. Experimental Mechanics, 19:324–330, 1979. doi: https://doi.org/10.1007/BF02324153.
- Cranz [1925] C. Cranz. Lehrbuch der Ballistik. Verlag von Julius Springer, Berlin, 5th edition, 1925. Unter Mitwirkung von Professor O. von Eberhard und Major Dr. Keceker. Reproduction by Edwards Brothers, Inc. Ann Arbor, Michigan, 1943.
- Doney et al. [2010] R. L. Doney, G. B. Vunni, and J. H. Niederhaus. Experiments and Simulations of Exploding Aluminum Wires: Validation of ALEGRA-MHD. ARL-TR ; 5299. Army Research Laboratory, Aberdeen Proving Ground, MD, 2010.
- Draganić et al. [2018] H. Draganić, D. Varevac, and S. Lukić. An overview of methods for blast load testing and devices for pressure measurement. Advances in Civil Engineering, 2018:1–20, Dec 2018. doi: https://doi.org/10.1155/2018/3780482.
- Esparza [1986] E. D. Esparza. Blast measurements and equivalency for spherical charges at small scaled distances. International Journal of Impact Engineering, 4(1):23–40, Jan. 1986. doi: https://doi.org/10.1016/0734-743X(86)90025-4.
- Faraday [1857] M. Faraday. X. The Bakerian Lecture.—Experimental relations of gold (and other metals) to light. Philosophical transactions of the Royal Society of London, (147):145–181, 1857. doi: https://doi.org/10.1098/rstl.1857.0011.
- Fouchier et al. [2017] C. Fouchier, D. Laboureur, L. Youinou, E. Lapebie, and J. Buchlin. Experimental investigation of blast wave propagation in an urban environment. Journal of Loss Prevention in the Process Industries, 49:248–265, 2017. ISSN 0950-4230. doi: https://doi.org/10.1016/j.jlp.2017.06.021.
- Gilburd et al. [2012] L. Gilburd, S. Efimov, A. G. Fedotov, V. T. Gurovich, G. Bazalitski, O. Antonov, and Y. E. Krasik. Modified wire array underwater electrical explosion. Laser and Particle Beams, 30(2):215–224, 2012. doi: https://doi.org/10.1017/S0263034611000851.
- Godio et al. [2021] M. Godio, N. Portal, M. Flansbjer, J. Magnusson, and M. Byggnevi. Experimental and numerical approaches to investigate the out-of-plane response of unreinforced masonry walls subjected to free far-field blasts. Engineering Structures, 239:112328, 2021. doi: https://doi.org/10.1016/j.engstruct.2021.112328.
- Han et al. [2020] R. Han, J. Wu, H. Zhou, Y. Zhang, A. Qiu, J. Yan, W. Ding, C. Li, C. Zhang, and J. Ouyang. Experiments on the characteristics of underwater electrical wire explosions for reservoir stimulation. Matter and Radiation at Extremes, 5(4):047201, 2020. doi: https://doi.org/10.1063/1.5135725.
- Hansen [1993] S. Hansen. Exploding Wires: Principles, Apparatus, and Experiments. Stephen P. Hansen, 1993.
- Hargather [2013] M. Hargather. Background-oriented schlieren diagnostics for large-scale explosive testing. Shock Waves, 23:529–536, 2013. doi: https://doi.org/10.1007/s00193-013-0446-7.
- Hargather et al. [2023] M. Hargather, K. Winter, J. Kimberley, and T. Wei. A comparison of explosively driven shock wave radius versus time scaling approaches. Shock Waves, 33(6):449–460, 2023. doi: https://doi.org/10.1007/s00193-023-01149-y.
- Hopkinson [1915] B. Hopkinson. British Ordnance Board Minutes 13565. N/A, 1915.
- Keys and Clubley [2017] R. Keys and S. Clubley. Experimental analysis of long duration blast loading and debris distribution of masonry panels. Engineering Structures, 130, Jan 2017. doi: https://doi.org/10.1016/j.engstruct.2016.10.054.
- Kingery and Bulmash [1984] C. N. Kingery and G. Bulmash. Technical report ARBRL-TR-02555: Air blast parameters from TNT spherical air burst and hemispherical burst. Technical Report ARBRL-TR-02555, U.S. Army Ballistic Research Laboratory, 1984.
- Kinney and Graham [1985] G. F. Kinney and K. J. Graham. Explosive shocks in air. Springer Berlin, Heidelberg, 1985. doi: https://doi.org/10.1007/978-3-642-86682-1.
- Kleine et al. [2003] H. Kleine, J. M. Dewey, K. Ohashi, T. Mizukaki, and K. Takayama. Studies of the tnt equivalence of silver azide charges. Shock Waves, 13:123–138, Jan. 2003. doi: https://doi.org/10.1007/s00193-003-0204-3.
- Liu et al. [2019] H. Liu, J. Zhao, Z. Wu, L. Zhang, and Z. Qiaogen. Experimental investigations on energy deposition and morphology of exploding aluminum wires in argon gas. Journal of Applied Physics, 125:103301, Mar 2019. doi: https://doi.org/10.1063/1.5078811.
- Liverts et al. [2015] M. Liverts, O. Ram, O. Sadot, N. Apazidis, and G. Ben-Dor. Mitigation of exploding-wire-generated blast-waves by aqueous foam. Physics of Fluids, 27:076103, Jul. 2015. doi: https://doi.org/10.1063/1.4924600.
- Masi et al. [2021] F. Masi, I. Stefanou, and V. Maffi-Berthier. Scaling laws for the rigid-body response of masonry structures under blast loads. Journal of Engineering Mechanics, 147(10):04021078, 2021. doi: https://doi.org/10.1061/(ASCE)EM.1943-7889.0001986.
- Mellor et al. [2019] W. Mellor, E. Lakhani, J. Valenzuela, B. Lawlor, J. Zanteson, and V. Eliasson. Design of a multiple exploding wire setup to study shock wave dynamics. Experimental Techniques, 44, Nov. 2019. doi: https://doi.org/10.1007/s40799-019-00354-8.
- Meyer et al. [2016] R. Meyer, J. Köhler, and A. Homburg. Explosives. John Wiley & Sons, 2016. doi: https://doi.org/10.1002/3527600515.
- Michaloudis and Gebbeken [2018] G. Michaloudis and N. Gebbeken. Modeling masonry walls under far-field and contact detonations. International Journal of Impact Engineering, 123, 10 2018. doi: 10.1016/j.ijimpeng.2018.09.019.
- Morsel [2024] A. Morsel. Experimental testing of masonry structures subjected to extreme loads. PhD thesis, École centrale de Nantes, 2024.
- Morsel et al. [2024] A. Morsel, F. Masi, E. Marché, G. Racineux, P. Kotronis, and I. Stefanou. miniBLAST: a novel experimental setup for laboratory testing of structures under blast loads. arXiv: 2408.01586, 2024. doi: https://doi.org/10.48550/arXiv.2408.01586.
- Nairne [1774] E. Nairne. VII. Electrical experiments by Mr. Edward Nairne, of London, mathematical instrument-maker, made with a aachine of his own workmanship, a description of which is prefixed. Philosophical Transactions of the Royal Society, 64:79–89, 1774. doi: https://doi.org/10.1098/rstl.1774.0007.
- Needham [2010] C. Needham. Blast Waves. Springer-Verlag Berlin Heidelberg, 2010. doi: https://doi.org/10.1007/978-3-642-05288-0.
- Nof et al. [2017] E. Nof, O. Ram, E. Kochavi, G. Ben-Dor, and O. Sadot. Exploration of methods in the exploding wire technique for simulating large blasts. In 30th International Symposium on Shock Waves 2: ISSW30-Volume 2, pages 1327–1331. Springer, 2017. doi: https://doi.org/10.1007/978-3-319-44866-4_93.
- Pereira et al. [2015] J. M. Pereira, J. Campos, and P. B. Lourenço. Masonry infill walls under blast loading using confined underwater blast wave generators (WBWG). Engineering Structures, 92:69–83, 2015. doi: https://doi.org/10.1016/j.engstruct.2015.02.036.
- Ram and Sadot [2012] O. Ram and O. Sadot. Implementation of the exploding wire technique to study blast-wave-structure interaction. Experiments in Fluids, 53:1335–1345, Nov. 2012. doi: https://doi.org/10.1007/s00348-012-1339-8.
- Rigby et al. [2014] S. E. Rigby, A. Tyas, T. Bennett, S. D. Clarke, and S. D. Fay. The negative phase of the blast load. International Journal of Protective Structures, 5(1):1–19, 2014. doi: https://doi.org/10.1260/2041-4196.5.1.1.
- Rigby et al. [2020] S. E. Rigby, R. Knighton, S. D. Clarke, and A. Tyas. Reflected near-field blast pressure measurements using high-speed video. Experimental Mechanics, 60:875–888, 2020. doi: https://doi.org/10.1007/s11340-020-00615-3.
- Sadot et al. [2018] O. Sadot, O. Ram, E. Nof, E. Kochavi, and G. Ben-Dor. Small-scale blast wave experiments by means of an exploding wire. In Blast Effects, pages 141–170. Springer, 2018.
- Schneider et al. [2019] J. Schneider, M. Von Ramin, A. Stottmeister, and A. Stolz. Characterization of debris throw from masonry wall sections subjected to blast. Engineering Structures, 203:109729, Nov. 2019. doi: https://doi.org/10.1016/j.engstruct.2019.109729.
- Sochet [2018] I. Sochet. TNT equivalence. In Blast Effects, pages 121–140. Springer, 2018.
- Sochet and Maillot [2018] I. Sochet and Y. Maillot. Blast wave experiments of gaseous charges. In Blast Effects, pages 89–111. Springer, 2018.
- Stephens et al. [2017] T. Stephens, L. Tiao, and contributors. gplearn: Genetic programming in python, with a scikit-learn inspired api. https://gplearn.readthedocs.io/en/stable/, 2017.
- U.S. Department of Defense [1990] U.S. Department of Defense. UFC 3-340-02: Structures to resist the effects of accidental explosions. Technical report, Chairman, Department of Defense Explosives Safety Board, November 1990.
- Vannucci et al. [2017] P. Vannucci, F. Masi, and I. Stefanou. A comparative study on the effects of blast actions on a monumental structure. Research report, UVSQ - ENPC, Nov 2017. URL https://hal.science/hal-01720557.
- Wei and Hargather [2021] T. Wei and M. J. Hargather. A new blast wave scaling. Shock Waves, 31(3):231–238, 2021. doi: https://doi.org/10.1007/s00193-021-01012-y.
- Winter [2021] K. Winter. Irregular reflections of unsteady shock waves. PhD thesis, New Mexico Tech, 2021.
- Xiao et al. [2020] W. Xiao, M. Andrae, and N. Gebbeken. Air blast TNT equivalence concept for blast-resistant design. International Journal of Mechanical Sciences, 185:105871, 2020. doi: https://doi.org/10.1016/j.ijmecsci.2020.105871.
- Zapata and García-Ruiz [2021] F. Zapata and C. García-Ruiz. Chemical classification of explosives. Critical Reviews in Analytical Chemistry, 51(7):656–673, 2021. doi: https://doi.org/10.1080/10408347.2020.1760783.
- Zyskowski et al. [2004] A. Zyskowski, I. Sochet, G. Mavrot, P. Bailly, and J. Renard. Study of the explosion process in a small scale experiment - structural loading. Journal of Loss Prevention in the Process Industries, 17:291–299, Jul. 2004. doi: https://doi.org/10.1016/j.jlp.2004.05.003.