Tracking the jet-like corona of black hole Swift J1727.8-1613 during a flare state through Type-C quasi-periodic oscillations
Abstract
Type-C quasi-periodic oscillations (QPOs) in black hole X-ray transients typically manifest in the low-hard and hard-intermediate states. This study presents a detailed spectral and temporal analysis of the black hole candidate Swift J1727.8-1613 using NICER observations from August and September 2023, with a focus on the first flare period. The time-averaged spectra, along with the rms and phase-lag spectra of the QPOs, were jointly fitted using the time-dependent Comptonization model vkompthdk to examine the geometry of the corona during this flare. The results provide a comprehensive view of the QPO, where we detected type-C QPOs with a centroid frequency increasing from 0.32 Hz to 2.63 Hz, while it elevated when it entered the flare state, and its energy spectral properties as they evolved during the first flare period. Correlations between spectral and temporal properties suggest that type-C QPOs are primarily modulated by Lense-Thirring precession. Based on simultaneous radio observations indicating discrete jet ejections, we propose, for the first time, a scenario where the temporarily extended corona contracts vertically from approximately 2714 km to less than 900 km, overlying the inner accretion disc, with a transient jet seemingly being launched. The corona then recovers to nearly 2000 km by the end of the first flare period of Swift J1727.8-1613, rather than undergoing horizontal changes. A phenomenological analysis of the corona scenario during this flare period was also conducted.
1 Introduction
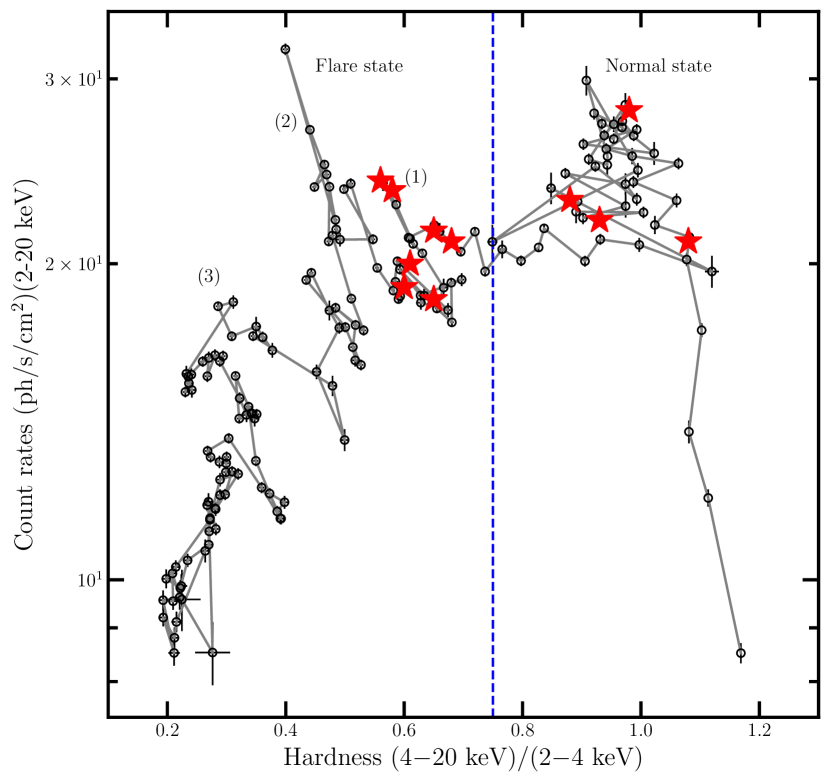
Most black hole X-ray binaries (BHXBs) are transient sources that remain in a quiescent state for months or even decades before exhibiting an X-ray outburst typically lasting weeks to months. These outbursts occur due to mass transfer from the secondary star onto the black hole primary (Tanaka & Shibazaki, 1996). During an outburst, a BHXB traces an anticlockwise ‘q’ shape in the hardness-intensity diagram (HID) (Homan et al., 2001; Fender et al., 2004), displaying a hysteresis effect between the soft and hard states. As classified by Homan & Belloni (2005), there are four primary states: the low-hard state (LHS), the hard-intermediate state (HIMS), the soft-intermediate state (SIMS), and the high-soft state (HSS). Occasionally, a source may remain in an anomalous state at peak luminosity (e.g. Méndez & van der Klis, 1997; Belloni et al., 2005; Motta et al., 2012).
Before an outburst, BHXBs typically remain in a quiescent state with X-ray luminosity several orders of magnitude lower than during an outburst. As the outburst begins, the source enters the LHS, characterized by dominant hard-photon emission. With an increasing mass accretion rate from the disk onto the black hole, the source rapidly (within days) transitions to the HSS, where the X-ray spectrum becomes disc-dominated and the power-law emission steepens. Additionally, some sources may remain in the LHS and HIMS without ever entering the SIMS, leading to a so-called failed-transition outburst (Alabarta et al., 2021). Eventually, as the accretion rate decreases, the source returns to the LHS and then back to quiescence. Relativistic jets can appear during these transitions between hard and soft states (see e.g. Fender et al., 2004; Remillard & McClintock, 2006, for a review). Typically, two types of relativistic jets are observed in BHXBs, classified by their radio spectral index and morphology: a small-scale, optically thick, steady jet and an extended, optically thin, transient jet (Fender, 2006). In the hard state, or even the HIMS, a steady jet is present (Fender, 2001; Russell et al., 2019). However, during the transition from HIMS to the SIMS, the steady jet emission is quenched (Fender et al., 2004; Russell et al., 2011). Around the transition to the soft state, the steady jet disappears, and a bright transient jet is launched, consisting of discrete relativistic ejecta from the black hole (Mirabel & Rodríguez, 1994; Corbel et al., 2004; Miller-Jones et al., 2012; Russell et al., 2019).
In addition to their long-term evolution, BHXBs typically exhibit strong variability on sub-second timescales, which can be analyzed using Fast Fourier Transformation (FFT). A prominent feature of these systems is the presence of low-frequency quasi-periodic oscillations (QPOs) in the power density spectrum (PDS; see e.g., Ingram & Motta, 2019, for a review). When the centroid frequency is between millihertz and approximately 30 Hz, the QPOs are classified as low-frequency QPOs (LFQPOs; Motta, 2016). LFQPOs are further categorized into types A, B, or C based on the shape and strength of the noise component in the PDS, as well as their root mean square (rms) amplitude and phase lags (Wijnands et al., 1999; Remillard et al., 2002; Casella et al., 2005). Type-C QPOs are the most common and strongest QPOs observed in BHXBs, typically appearing in the LHS and HIMS. They have rms amplitudes that can reach up to 20 percent and high-quality factors, with (, where is the centroid frequency and FWHM is the full width at half-maximum of the QPO). Type-C QPOs frequently exhibit subharmonics, second, and occasionally third harmonics, and are associated with a strong broad-band noise component in the PDS. The most popular model explaining these QPOs is the Lense–Thirring (LT) model proposed by Stella & Vietri (1998), which attributes the QPO to a geometric effect under general relativity. Alternative models suggest that type-C QPOs result from accretion-ejection instability in a magnetized disk (Tagger & Pellat, 1999), oscillations in a transition layer within the accretion flow (Titarchuk & Fiorito, 2004), or oscillations in the corona driven by magnetoacoustic waves (Cabanac et al., 2010).
Phase lags provide additional insights into the X-ray variability in BHXBs. These lags are measured using the Fourier cross-spectrum, which is computed from light curves in two different energy bands (Miyamoto & Kitamoto, 1989; Cui et al., 1997; Nowak et al., 1999). Hard (positive) lags can occur due to the propagation of mass accretion rate fluctuations from the outer parts of the disk toward the inner disk and corona (e.g. Arévalo & Uttley, 2006; Ingram & van der Klis, 2013). Conversely, soft (negative) lags may arise when hard photons from the corona irradiate the accretion disc, causing the disk to reprocess and re-emit these photons at a later time than the corona photons that travel directly to the observer (e.g. Uttley et al., 2014; Karpouzas et al., 2020).
| Obs | OBSID | Observation Time | Exposure (ks) |
|---|---|---|---|
| 1 | 6203980102 | 2023-08-26 09:20:05.00 | 1.1 |
| 2 | 6203980106 | 2023-08-30 00:00:20.00 | 10.6 |
| 3 | 6203980113 | 2023-09-06 10:05:00.00 | 5.4 |
| 4 | 6750010502 | 2023-09-08 00:40:24.00 | 4.8 |
| 5 | 6703010106 | 2023-09-12 00:24:50.00 | 0.8 |
| 6 | 6203980118 | 2023-09-12 09:43:16.00 | 2.0 |
| 7 | 6511080101 | 2023-09-13 01:12:37.00 | 1.1 |
| 8 | 6203980119 | 2023-09-13 04:18:37.00 | 4.9 |
| 9 | 6203980120 | 2023-09-14 00:26:33.00 | 6.3 |
| 10 | 6750010202 | 2023-09-15 07:30:40.00 | 6.5 |
| 11 | 6750010203 | 2023-09-16 03:34:15.00 | 1.8 |
Although the corona around a black hole is widely believed to consist of hot electrons with temperatures up to approximately 100 keV, which can give rise to the Comptonized spectrum (Zdziarski et al., 1996; Życki et al., 1999), many open questions remain regarding the disk-corona-jet evolution. For instance, the process of disk truncation during the evolution of black hole transients is not fully understood (Esin et al., 1997), nor is the nature of the corona (Galeev et al., 1979; Haardt & Maraschi, 1991; Markoff et al., 2005). Understanding the geometry of the corona and its connection with the disk and the jet is vital to determining the geometry of the Comptonization region. Evidence suggests a connection between the corona and the radio jet, as indicated by the universal radio–X-ray correlation in the LHS (Gallo et al., 2003; Fender et al., 2004). A study of GRS 1915+105 proposed that variations in the radio–X-ray correlation could be due to changes in the corona temperature (Méndez et al., 2022). In their spectral analysis of the reflection component in MAXI J1820+070, You et al. (2021) suggested a jet-like corona model, where the corona is understood as a standing shock through which material flows. Studies on X-ray variability have shown that the size of the corona evolves continuously during the outburst, potentially linking these changes to variations in radio jet emission, thereby suggesting a disk-corona-jet connection (García et al., 2021; Ma et al., 2021; García et al., 2022; Méndez et al., 2022; Zhang et al., 2022; Fu et al., 2022; Peirano et al., 2023; Zhang et al., 2023; Ma et al., 2023; Yang et al., 2023).
The X-ray transient Swift J1727.8-1613 (hereafter J1727), initially identified as GRB 230824A, was discovered by Swift/BAT on August 24, 2023 (Page et al., 2023). A rapid increase in flux confirmed it as a new galactic X-ray transient (Negoro et al., 2023; Nakajima et al., 2023). Observations across multiple wavelengths, including optical (Castro-Tirado et al., 2023), X-ray (O’Connor et al., 2023), and radio (Miller-Jones et al., 2023), suggest that J1727 is a low-mass black hole candidate. Further optical observations revealed that J1727 consists of a black hole primary with an early K-type companion star. It has an orbital period of approximately 7.6 hours and is located at a distance of kpc (Mata Sánchez et al., 2024). Additionally, IXPE detected polarized emission in the hard intermediate state of the source, with a polarization degree of and a polarization angle of (Veledina et al., 2023). Spectral analysis from simultaneous observations with Insight-HXMT, NICER, and NuSTAR led Peng et al. (2024) to infer a black hole spin of approximately 0.98 and an orbital inclination of about 40 degrees. Furthermore, temporal and spectral analyses by Yu et al. (2024) and Chatterjee et al. (2024) suggested a high-inclination disk for this source.
In this paper, we conducted temporal and spectral analyses of NICER data to investigate the evolution of the coronal geometry of Swift J1727.8–1613 during a flare state, and examined the correlation between its temporal and spectral properties. Section 2 describes the observations and data reduction procedures. Our temporal and spectral analysis results are presented in Section 3, followed by discussion and conclusions in Section 4. A summary is provided in Section 5.
2 Observation and data reduction
NICER is a soft X-ray telescope onboard the International Space Station (ISS; Gendreau et al. 2016). NICER’s XTI (X-ray Timing Instrument) covers the 0.2–12 keV energy band with an absolute timing precision of approximately 100 ns, making it an ideal instrument for studying fast X-ray variability. The XTI of NICER comprises an array of 56 co-aligned concentrator X-ray optics, each paired with a single-pixel silicon drift detector. Currently, 52 detectors are operational, with a peak effective area of approximately 1900 cm2 at 1.5 keV.
Swift J1727.8-1613 has been observed with NICER almost daily since its discovery. In this work, we use 11 observations from NICER (see Table 1). The data are processed using the NICER data analysis software (NICERDAS v12a) available in HEASOFT V6.33.2, which includes updates addressing the optical light leak of May 2023, with the appropriate calibration database. The task nicerl2111https://heasarc.gsfc.nasa.gov/lheasoft/ftools/headas/nicerl2.html is used to generate clean event files, applying all standard calibration and data screening criteria. For some intervals of observations in the flare state, we found that the source flux changed significantly. To ensure stable temporal and spectral features from its flare state, we divided a single observation into segments and selected intervals with exposure times 400 s, maintaining a relatively constant source count rate to study the temporal and spectral properties. The intervals of each observation are given in Table 2. Further, the spectral products are extracted using the nicerl3-spect tool. The background model 3c50 is selected using the flag bkgmodeltype=3c50 during the extraction of spectral products. The detector redistribution matrix file and the auxiliary response file are generated with the tasks nicerrmf and nicerarf, respectively. The spectra are fitted in the 1–10 keV band using XSPEC v12.14.0 because NICER data below 1 keV have significant residuals due to calibration issues. The timing properties are analyzed using the stingray222https://github.com/StingraySoftware libraries (Huppenkothen et al., 2019a, b; Bachetti et al., 2023).
3 Analysis and Results
3.1 The Evolution of Swift J1727.8-1613
In this section, we perform timing and spectral analysis of the first outburst of the black hole Swift J1727.8-1613 during 2023. We studied the QPO properties of the source during the outburst as well as its spectral nature and radiation properties using NICER data.
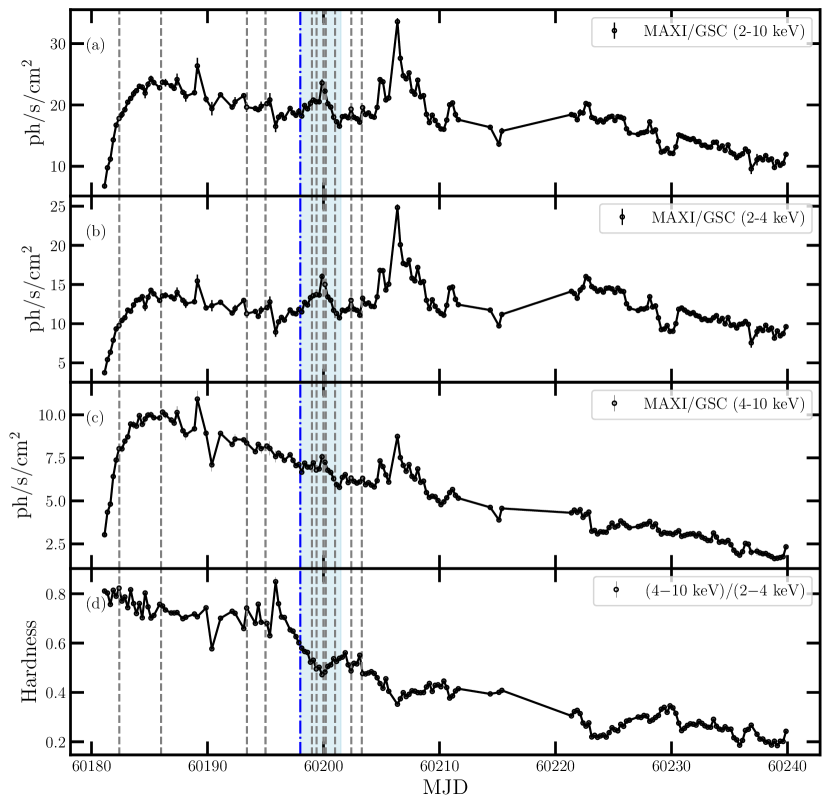
First, we extracted the daily average light curve using the MAXI/GSC3333http://maxi.riken.jp/pubdata/v7.7l/J1727-162/index.html public archive. In the left panel of Fig. 1, we show the variation of the flux during the outburst. The outburst started roughly around MJD 60180 (2023 August 24), when the flux emerged from quiescence. The MAXI/GSC flux began to rise after this date, as seen in sub-panels (a), (b), and (c) in the left panel of Fig. 1. Within five days, the flux increased very rapidly, reaching its peak on MJD 60185 (2023 August 29). Subsequently, the flux began to decrease very slowly, except for the period from MJD 60200 to 60220, where the flux showed significant variation. However, the variation in the 4-10 keV band is much smaller than in the 2-4 keV band, suggesting it originates from the soft component. In sub-panel (d), we show the variation of the hardness ratio (HR), which is the ratio of the hard 4-10 keV flux to the soft 2-4 keV flux. At the start of the outburst, the HR was approximately 1.1. From this initial value, it gradually decreased till MJD 60190 as the outburst progressed, typical of BHXB. After a brief increase, the HR declined steeply near MJD 60195 and then maintained a constant level until the next flare, suggesting that several flares dominated by soft components occurred during the outburst. Consequently, we divided the light curve into two states, the normal states and the flare states, before and after MJD 60198, respectively, following the approach of Yu et al. (2024).
3.2 Timing analysis
3.2.1 The method and Power density spectrum
We extracted the PDS using archival NICER/XTI data (see e.g. Table 1) and processed them with HENDRICS444https://hendrics.stingray.science/en/latest/, which allows for dead time correction by comparing the two modules (Bachetti et al., 2015). For generating the PDS, we utilized a time resolution of 1/256 s over 16 s intervals in the 1–10 keV energy range. This setup produces spectra up to the Nyquist frequency (128 Hz), which we then averaged across all segments. Given our focus on LFQPOs below 30 Hz, a 1/256 s resolution is adequate. The PDS is normalized to fractional rms amplitude (Belloni & Hasinger, 1990), the formula we utilized is (Bu et al., 2015), where S and B stand for source and background count rates, respectively, and P is the power normalized according to Miyamoto et al. (1991). The theoretical Poisson noise level is subtracted. We do not consider the background rate when converting the PDS to rms units, as it is negligible compared to the source rate in our observations. We logarithmically rebin the PDS such that each bin size is 1.01 times larger than the previous bin. The 1–10 keV energy range is divided into five energy bands: 1.0–1.5 keV, 1.5–2.8 keV, 2.8–5.0 keV, 5.0–6.5 keV, and 6.5–10 keV. We produce a PDS for each of these energy bands.
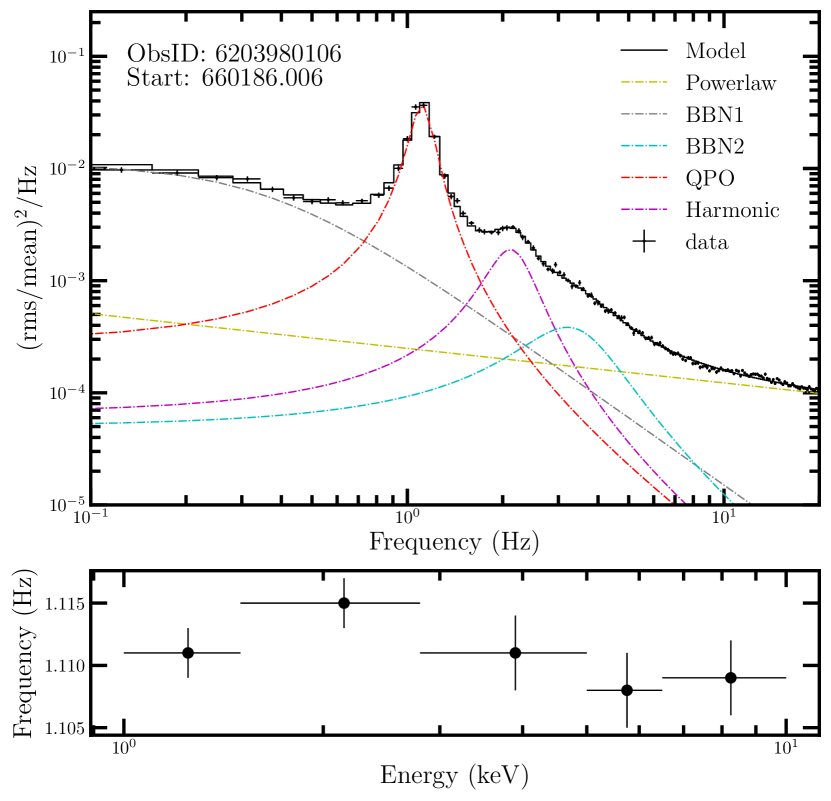
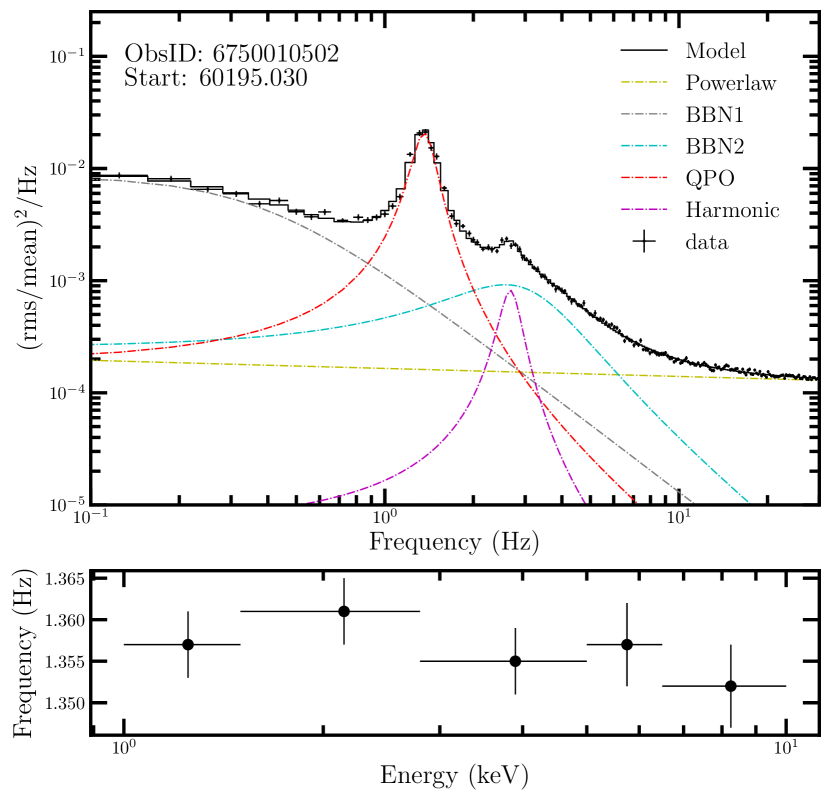
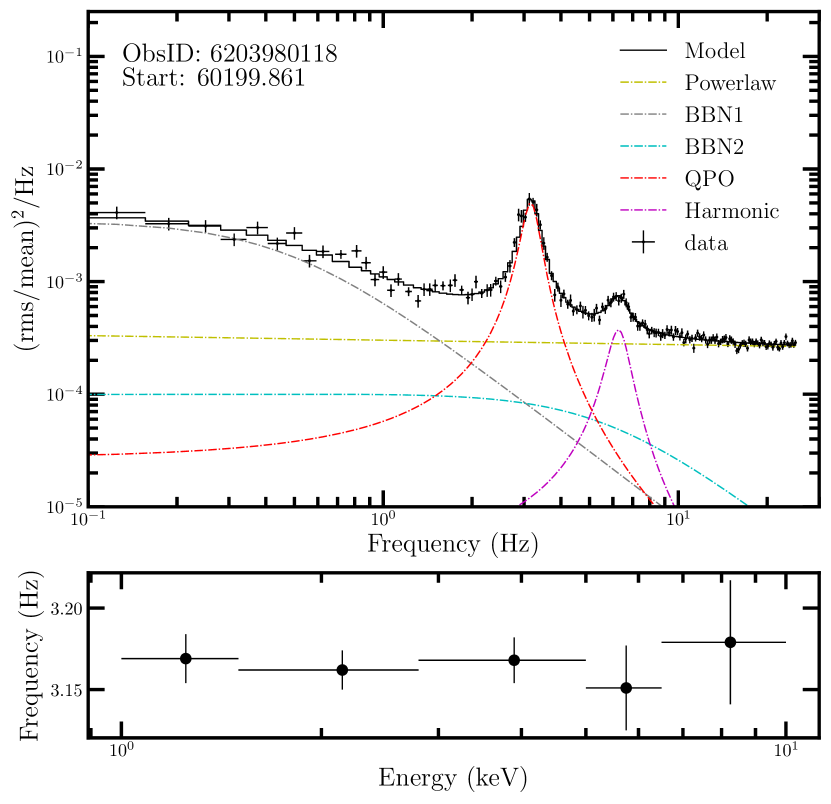
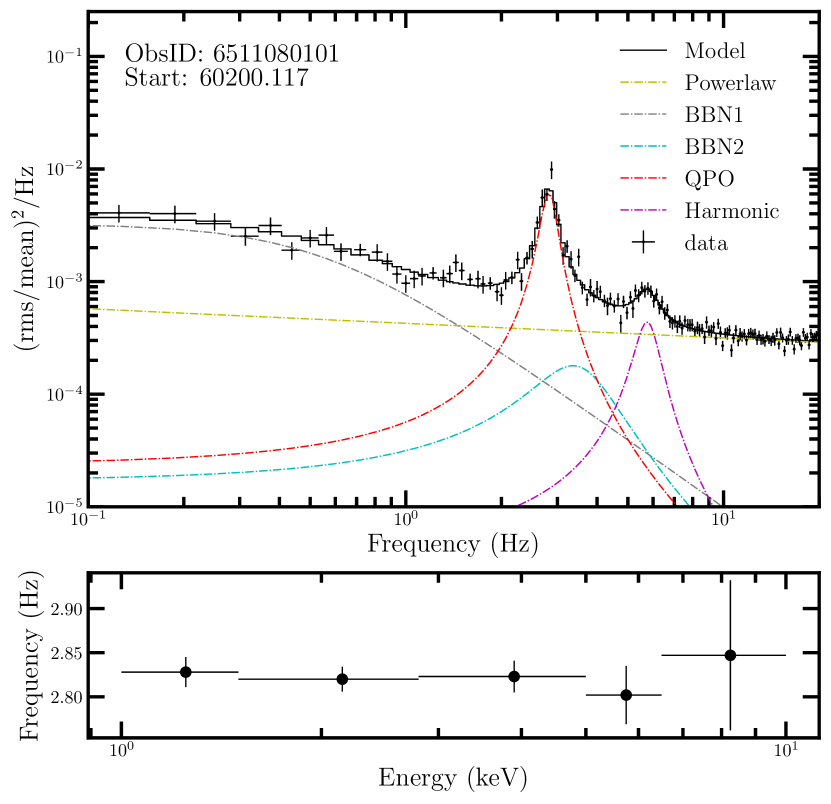
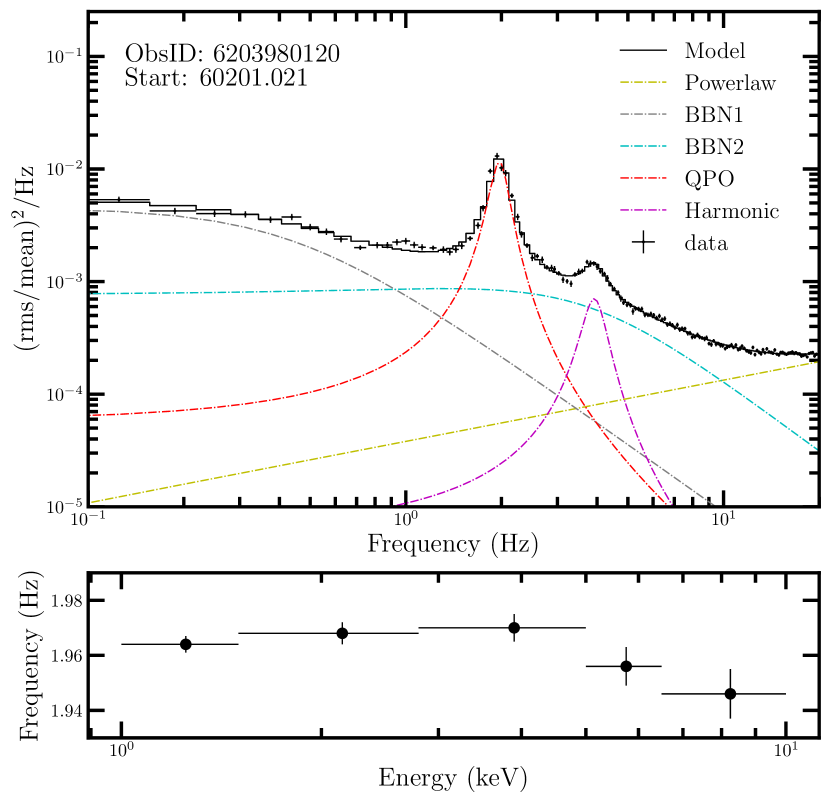
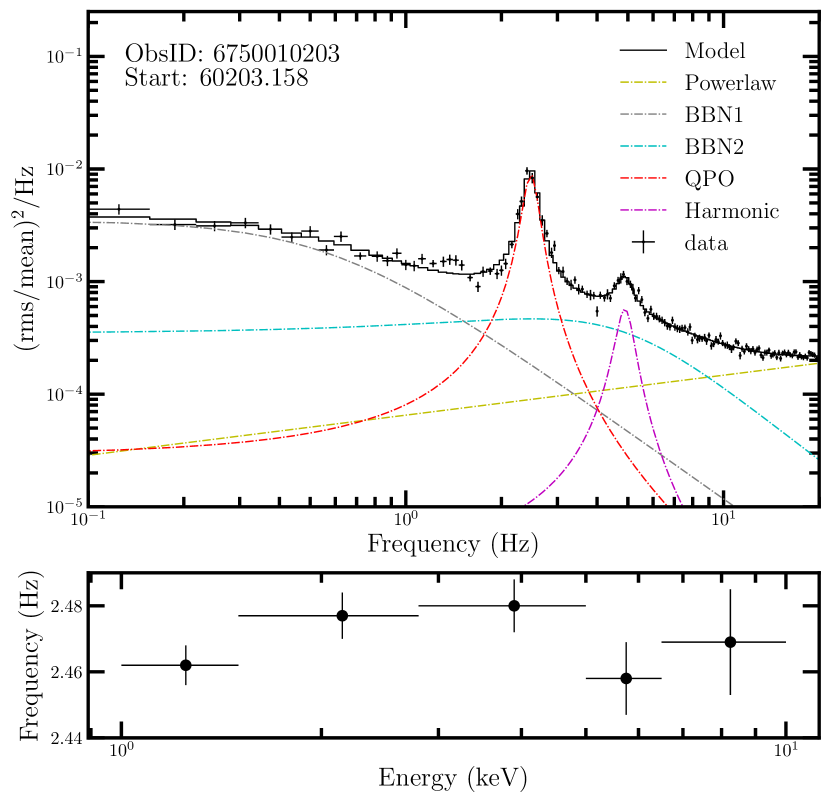
The PDS is fitted with a power law and four Lorentzian components (Belloni et al., 2002) to fit the QPO peaks between 0.1 and 20 Hz. We fit the power spectrum in XSPEC (details can be found in (Ingram & Done, 2012)), and uncertainties are given for a 90 percent confidence interval. All parameters of a Lorentzian function—the central frequency, FWHM, and the normalization—are free, except for the central frequency of one Lorentzian component which fits the broadband noise at 0. Using the models we fit the PDS of each orbit and then average them in the 1–10 keV band and in the six sub-bands (see above). QPOs are identified by fitting a multi-Lorentzian model to the entire power spectrum and searching for features with a quality factor and significance , where is the Lorentzian centroid frequency, is FWHM, and is the positive error in the normalization. We verify that the central frequency and width of the Lorentzian components do not change significantly with energy (see e.g., Fig. 2).
Finally, we also calculate rms amplitude of the variability components by taking the square root of the normalizations of the Lorentzians. The best-fit results for the PDSs are listed in Table 2. Six representative power spectra, along with the energy dependence of their central QPO frequencies, are illustrated in Fig. 2.
| Obs | MJD start | MJD stop | Frequency1 (Hz) | FWHM1 (Hz) | rms1 (%) | Frequency2 (Hz) | FWHM2 (Hz) | rms2 (%) | QPO type |
|---|---|---|---|---|---|---|---|---|---|
| 1 | 60182.587 | 60182.849 | C | ||||||
| 2 | 60186.006 | 60186.655 | C | ||||||
| 3 | 60193.424 | 60193.946 | C | ||||||
| 4 | 60195.030 | 60195.552 | C | ||||||
| 5 | 60199.217 | 60199.346 | C | ||||||
| 6 | 60199.861 | 60199.995 | C | ||||||
| 7 | 60200.117 | 60200.124 | C | ||||||
| 8 | 60200.377 | 60200.512 | C | ||||||
| 9 | 60201.021 | 60201.480 | C | ||||||
| 10 | 60202.315 | 60202.850 | C | ||||||
| 11 | 60203.158 | 60203.237 | C |
3.2.2 Fractional rms and Phase-lag spectra
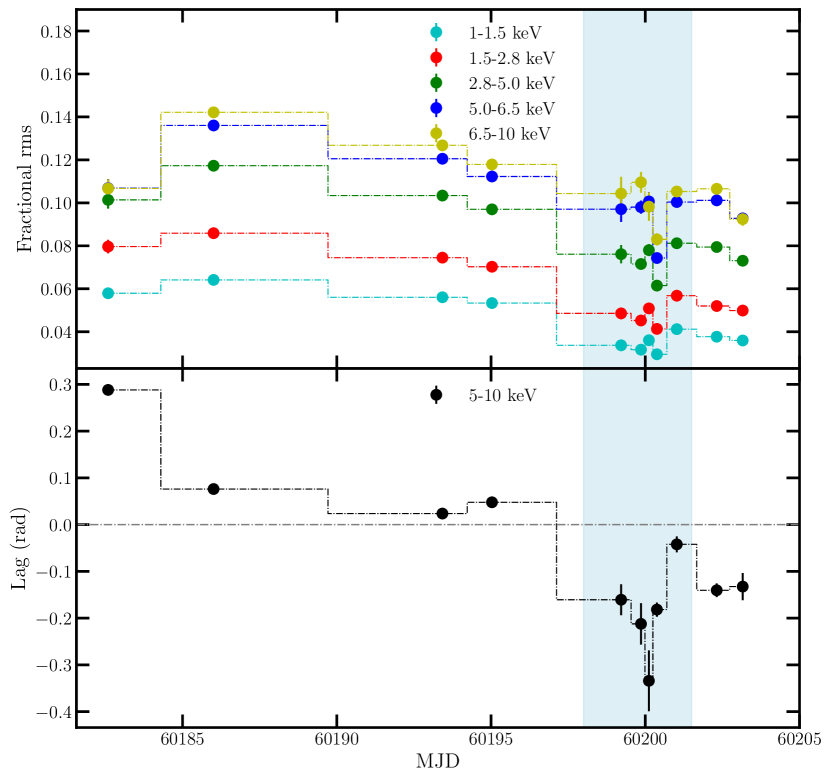
As shown in Fig. 2, we fit the PDS with four Lorentzians representing two broadband noise components, the QPO, and the second harmonic. Table 2 gives the best-fitting parameters of the Lorentzians within all the observation data. The second harmonic of QPO appears at a central frequency, consistent with being twice the central frequency of the QPO fundamental. To study the rms and phase lag of LFQPO and its energy dependence, we calculated the lag-frequency spectra for multiple energy sub-bands (see the left panel of e.g. Fig. 3). As the energy increases from 1 keV to 10 keV, the rms increases monotonically from below 7 percent to 13 percent, indicating that the type-C QPO is mainly modulated by the hot corona.
Also, we generate and average FFT in each observation using the 1–1.5 keV energy band as a reference band to compute the phase lags. We calculate the time lag from these lag spectra by averaging the time lag over the frequency range () to (), where and is the centroid frequency and FWHM of Lorentzian respectively, obtained from the fitted PDS in Section 3.2.1 (see the right panel of e.g. Fig. 3). A positive (hard) lag means that the hard photons lag behind the soft ones. The phase lag with respect to the 1–1.5 keV reference band crosses the zero line (Overlapping on the upper left corner in the right panel of Fig. 3).
3.3 Time-averaged spectrum analysis and fitting with vKompthdk
Next, we study the evolution of spectrum properties. To analyze the spectrum of Swift J1727.8–1613, we use the energy band of 1–1.7, 2.1–2.2, & 2.3–10 keV to avoid the calibration in the Si band (1.7–2.1 keV) and the Au band (2.2–2.3 keV). We then fitted jointly the time-averaged energy spectrum of Swift J1727.8–1613, and the rms and phase-lag spectra of the type-C QPO, using the model tbabs(diskbb+nthComp)+vkompthdkdilution. tbabs describes the galactic absorption column density along the line of sight. diskbb is a multi-temperature blackbody component (Mitsuda et al., 1984). vkompthdk555https://github.com/candebellavita/vkompth, which is similar to nthcomp (Zdziarski et al., 1996), is a single-component Comptonization model developed by Bellavita et al. (2022) considering that the source of the seed photons is a geometrically thin and optically thick accretion disk (Shakura & Sunyaev, 1973). In this model, represents the seed photon temperature of the Comptonized component, where these seed photons are then subjected to inverse-Compton scattering within a spherically symmetric corona, characterized by a size and temperature . The corona is maintained in thermal equilibrium through heating from an external source. Additionally, the model incorporates a feedback process, where a portion of the photons scattered into the corona are redirected back onto the accretion disc. The feedback fraction in the model, , denotes the fraction of the disk flux that is due to feedback from the corona (Karpouzas et al., 2020). The feedback fraction, , is related to the intrinsic feedback fraction, , which denotes the fraction of the photons emitted by the corona that returns to the accretion disc. This model treats the QPO as small oscillations of the spectrum around the time-averaged one. It assumes that spectrum fluctuations are caused by perturbations in the electron temperature, , through feedback mechanisms involving the seed photon source temperature, , due to an oscillating external heating rate, (for details, see Bellavita et al. 2022).
The dilution component, which is a correction to the fractional rms amplitude computed in the model to take into account the fraction of the non-variable emission, is described by Flux / Flux such that RMS = RMS * Flux / Flux. Note that this dilution component does not introduce any new parameters to the fits. The main parameters of the model are the seed photon source temperature, , the electron temperature, , the power-law photon index, , the size of the corona, , the feedback fraction, , and the variation of the external heating rate, .
In our joint fitting analysis, we employed the external component vkompthdk to fit the rms and lag spectra of the QPO as well as the spectrum of Swift J1727.8–1613. We linked the seed photon source temperature, , of vkompthdk to the inner disk temperature, , of diskbb. Additionally, we linked the electron temperature and the power-law photon index of vkompthdk to the corresponding parameters of nthcomp. Given that the high-energy cutoff of the Comptonized component is beyond the NICER energy range, we fixed the electron temperature at 50 keV. The best-fitting parameters from all observations are presented in Table 3.
| Component | Obs1 | Obs2 | Obs3 | Obs4 | Obs5 | Obs6 | Obs7 | Obs8 | Obs9 | Obs10 | Obs11 |
|---|---|---|---|---|---|---|---|---|---|---|---|
| tbabs | |||||||||||
| () | |||||||||||
| diskbb | |||||||||||
| Norm () | |||||||||||
| vkompthdk (nthcomp) | |||||||||||
| (km) | |||||||||||
| Norm | |||||||||||
| / | |||||||||||
| log | |||||||||||
| log |
Note. — Best-fitting parameters of the joint fit to the energy spectrum of Swift J1727.8-1613, and the rms and lag spectra of the LFQPO in present work, using the single-component Comptonization model vkompthdk. The error indicates the 1- confidence level. See the text for more details about the parameters.
4 Discussion
We performed a comprehensive spectral-timing analysis of Type-C QPOs observed during both the normal state and the first flare of Swift J1727.8-1613. This study provides the first comparison of the rms and lag spectra of low-frequency QPOs in a black hole X-ray binary during such a flare state. By fitting the time-averaged energy spectra of the source, as well as the rms and lag spectra of the QPOs in each observation using the time-dependent Comptonization model vkompth (Bellavita et al., 2022), we infer, for the first time, correlations between the evolution of physical parameters and the geometrical properties of the corona in a black hole candidate during a flare period originating from the thermal disk. Additionally, we propose a scenario for the evolution of the Comptonized region.
4.1 The rms and phase-lag spectrum of type-C QPOs
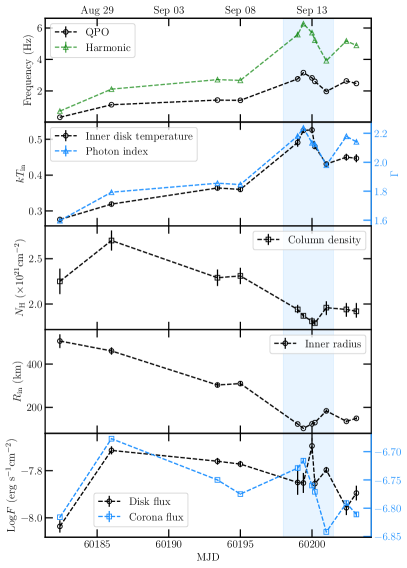
In this study, we averaged the PDSs obtained from each orbit of every observation listed in Table 2 to ensure consistency and reliability in our subsequent discussions and qualitative analysis. The Type-C QPO exhibits a centroid frequency that increases from 0.32 Hz to 2.63 Hz as it transitions from the normal state to the first flare. Notably, there is a discernible bump with a peak value of 3.16 Hz in the QPO frequency during the first flare period, where this trend is consistent with the increased soft X-ray flux around MJD 60200. Fig. 2 presents six representative PDSs, showing the type-C QPO observed in each of the energy sub-bands. Our analysis shows that the central frequency of the QPOs remains independent of energy during the first flare.
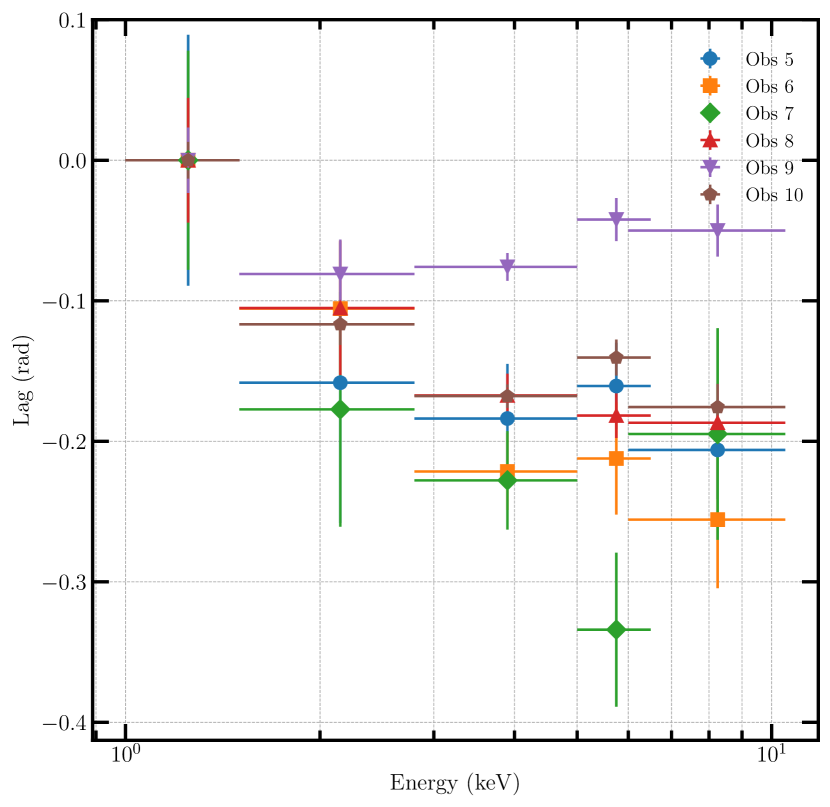
Additionally, our results in Table 2 indicate that the fractional rms increases during the rise phase, after which it remains relatively constant. As shown in Fig. 3, the evolution of rms in the normal state before MJD 60198 is consistent with the findings of Yu et al. (2024). The larger QPO rms amplitude observed above 6.5 keV suggests that the variability is driven by the corona rather than the disk. Furthermore, we have also plotted the phase lag within the energy band 5-10 keV as a function of time, assuming these type-C QPOs are driven by the same mechanism. Our findings reveal a general decreasing trend throughout the observation period. Notably, there is a rapid decline from -0.2 to -0.35, followed by a slight increase near MJD 60201. In the right panel of Fig. 3, we have plotted the phase lags for each energy sub-band, which exhibit a characteristic ‘U’ shape during this flare in the HIMS. The horizontal error bars represent the width of the energy channels. As the energy increases from 1 keV to 10 keV, the phase lags decrease, reaching a local minimum, and then increasing. The energy at which the minimum phase lag appears is consistent with the results reported by Stevens et al. (2018), which could be produced by a fractional cold seed photon from the outer accretion disk entering a slightly extended corona in the horizontal direction.
It is generally accepted that hard lags, where high-energy photons are delayed relative to low-energy ones, originate from the Comptonization of soft disk photons in the corona (Payne, 1980; Kazanas et al., 1997). Conversely, soft phase lags may be produced when hard photons from the corona irradiate the accretion disk and are reprocessed and re-emitted at a later time than the corona photons that directly reach the observer (Uttley et al., 2014; Ingram et al., 2019). Our results suggest that the corona undergoes horizontal contraction in the normal state, followed by a temporary extension and subsequent contraction in the vertical direction by the end of the flare.
4.2 Co-evolution between spectral and timing properties
The QPO frequency is tightly correlated with the evolutions of the energy spectrum in BHXBs. During the outburst phase, some sources have shown tight correlations between the timing and spectral properties (e.g., Vignarca et al. 2003; Méndez et al. 2022; Zhang et al. 2022; Fu et al. 2022; Rawat et al. 2023a, b; Chatterjee et al. 2024). In Fig. 5, we show the complete view of QPO and the energy spectral properties that evolve with time during the first flare in Swift J1727.8–161. It is evident that there is a strong correlation between QPO frequency and spectral physical parameters during the flare. Note that the is the inner disk radius which is derived from the normalization parameter of diskbb model following
| (1) |
where the norm is extracted from fitting the observed data, represents the distance to the source in units of 10 kpc, denotes the angle of the disk, and is the apparent inner disk radius which can be corrected to the true radius as . For Swift J1727.8–161, the values of (Mata Sánchez et al. 2024), (Chatterjee et al. 2024), (Shimura & Takahara 1995) and (Kubota et al. 1998) have been utilized in the calculation.
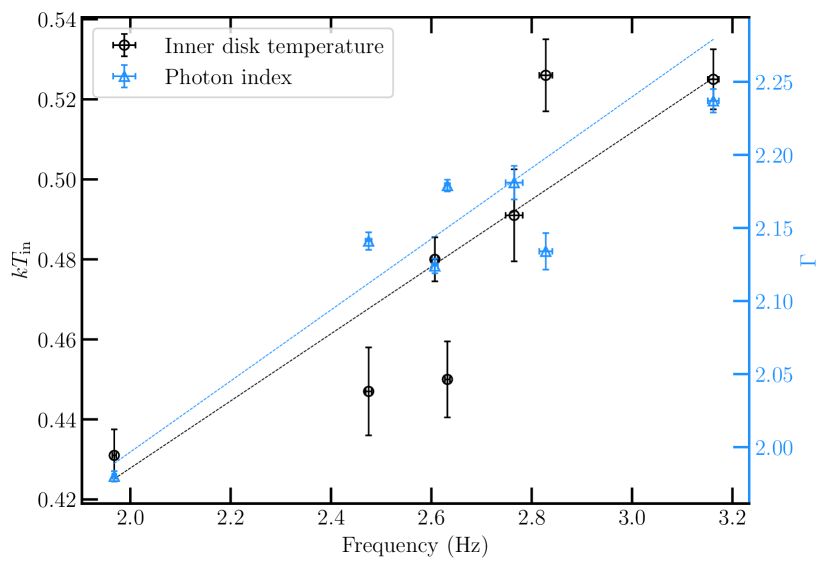
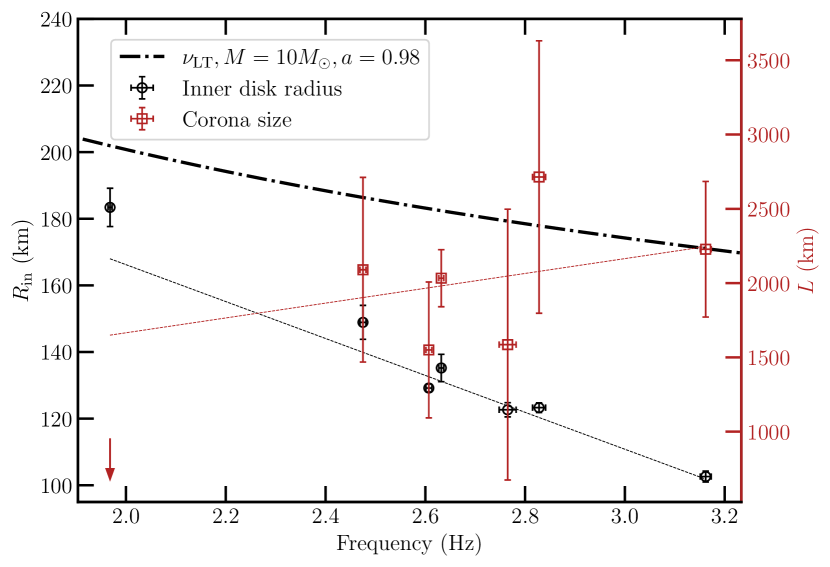
To further investigate possible co-evolution between the QPO and disk/corona, we present the variations of the disk and corona properties (i.e., inner disk temperature , photon index of power-law , inner disk radius and corona size ) as functions of the QPO frequency in Fig. 4. As the QPO frequency increases from 2 Hz to 3 Hz, the inner disk temperature increases from keV to 0.48 keV. The photon index and corona size exhibit a similar trend as the inner disk temperature. In contrast, the inner disk radius shows an opposite trend compared to the other parameters, i.e., the inner edge of the disk moves towards the black hole as the QPO frequency increases. We further calculate the Pearson correlation coefficients and the p-values to validate these correlations. All correlations were statistically significant (p-value), except for the corona size (p-value=0.70). Strong correlations () also were observed for most parameters, while the corona size showed a weak correlation (). These results suggest a significant connection between QPOs and the accretion disk. As for corona, the Pearson correlation analysis fails to establish a significant correlation between QPO frequency and corona size. However, we can not rule out the possibility that this correlation is true given the observed relationship between QPO frequency and the photon index. The high p-value and low correlation coefficient can be attributed to three factors: the exclusion of the upper-limit data point from the correlation analysis, substantial measurement errors (30 percent), and the limited sample size. These factors significantly impact the statistical results.
The LFQPOs are explicable within the framework of the relativistic precession model (RPM; Stella & Vietri 1998), which has a geometrical origin. The QPO frequency in the RPM model is assumed to be the nodal precession or LT precession frequency, and the theoretical frequency is negatively correlated with the inner disk radius as (e.g., Ingram et al. 2009)
| (2) |
| (3) |
where is the dimensionless spin parameter, and is the orbital radius in units of gravitational radius . As shown in the right panel of Fig. 4, the inner disk radius decreases as the QPO frequency increases, following a similar trend to ( from Peng et al. 2024). However, theoretical predictions suggest a higher radius at the same frequency compared to the observed data. Kubota et al. (2024) found a tight anti-correlation between the corona outer radius (truncated radius) and the LFQPO frequency which is in remarkably good qualitative and quantitative agreement with the prediction of LT precession in Ingram et al. (2009). Considering in this work was only derived from the diskbb, it represents only the inner radius of the blackbody disk, corresponding to the passive disk inner radius described in Kubota et al. (2024), rather than the corona outer radius. Consequently, the corona outer radius would be larger than . This explains why the theoretical predictions of radius from the LT precession are higher than the observational results of (black dash-dot line in the right panel of Fig. 4). Additionally, the nearly constant feedback fraction (left panel of Fig. 6, see the discussion in the next subsection) indicates that the outer radius of the corona varies as , suggesting an anti-correlation between the outer radius of the corona and QPO frequency. This could provide possible evidence that the LFQPOs are dominated by the Lense-Thirring precession.
We observe a cautiously positive correlation between the corona size and QPO frequency during a short period of the first flare of Swift J1727.8-1613, which could be partly consistent with the findings by Méndez et al. (2022); García et al. (2022). They reported the corona contracts to km as the QPO frequency decreases from Hz to Hz in GRS 1915+105, based on over a decade of data. Furthermore, the right panel of Fig. 4 shows the corona size reaches its minimum at Hz, while the QPO lag in the high-energy band is near zero (obs9 of Fig. 3) during the flare of Swift J1727.8-1613. Considering the anti-correlation between the inner disk radius and QPO frequency, it has been suggested that the LT precession of the inner edge of the accretion disk could modulate the LFQPO frequency. If LT precession dominates the QPO in the flare state of Swift J1727.8-1613, a near-zero QPO lag at 2 Hz would imply that the corona size is approximately equal to the inner disk radius (Méndez et al., 2022; García et al., 2022). This implication more or less aligns with the result shown in the right panel of Fig. 4, where km and km at a QPO frequency of approximately 2 Hz.
4.3 Tracking the geometry of the Comptonized region
Based on the combined results from fitting the rms and lag spectra of the QPO using the vkompthdk model, as well as its time-averaged spectrum, and incorporating the quasi-simultaneous radio observations reported by Peters et al. (2023), we propose a scenario for the evolution of the dynamical corona during the first flare period in HIMS.
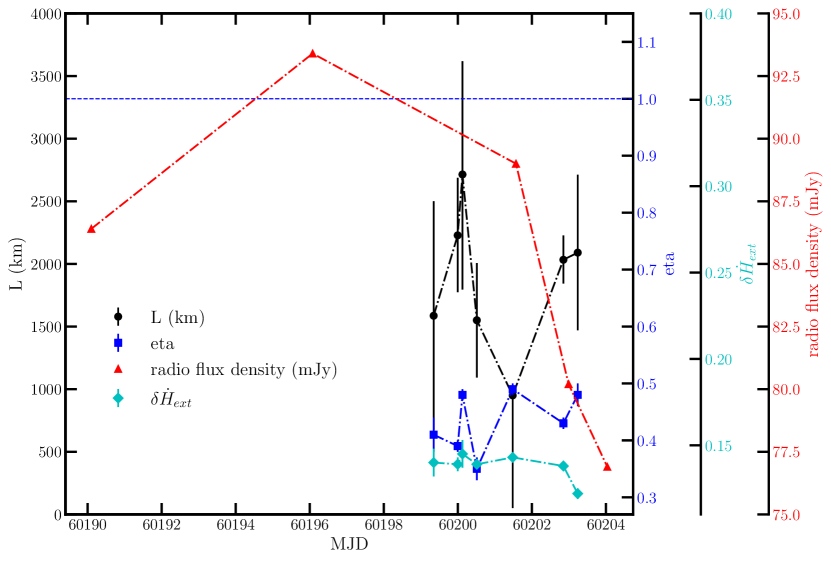
The results from corona modeling through type-C QPOs, employing model vkompthdk in Swift J1727.8–1613, suggest the presence of a temporarily extended jet-like corona. This extended corona appears to evolve dynamically, consistent with the variable trend of QPOs. During the first flare period, as the type-C QPO varies, the size of the corona expands from 1686 km to 2714 km, then rapidly contracts to below 950 km as the QPO frequency drops to 1.97 Hz. These findings align with our discussion in Section 4.1. Throughout this period, the feedback fraction remains broadly constant, ranging from 0.3 to 0.5, indicating that the corona likely maintains covering the accretion disk to some extent during the entire flare period, as shown in the right panel of Fig. 6. Meanwhile, the amplitude of the variability of the external heating rate shows a constant value near 0.14. These findings suggest that the corona is not spherical but contracts perpendicularly to the accretion disk rather than horizontally.
The LT radius (Ingram et al., 2009), calculated from the QPO frequency assuming a black hole mass of 10 M⊙ (Sridhar et al., 2019), and a spin of 0.998, decreases from 200 km to 100 km as the QPO frequency evolves from 2 Hz to 9 Hz. These radii are well below the size of the corona, suggesting that the corona consistently covers a relatively large fraction of the inner disk, consistent with . In Fig 6, we illustrate the evolution of the corona size (), the feedback fraction (), and the amplitude of the variability of the external heating rate (), derived from the time-dependent version of the model vkompthdk that fits the rms and phase-lag spectra.
Our results are consistent with those of Harikrishna & Sriram (2022), who used spectral-timing analysis of type-C to type-B QPOs in H 1743–322 to model a jet or a vertically extended optically thick Comptonization region. Similarly, Liu et al. (2022) proposed a vertically extended corona at the base of the jet in MAXI J1348–630 to explain the disappearance and reappearance of the type-B QPO, invoking the Bardeen-Petterson effect. In the study of MAXI J1535–571, Zhang et al. (2023) modeled the corona through type-B QPOs and found that the size of the jet-like corona extended vertically from approximately 3000 km to 6500 km in the intermediate state. This finding is comparable to the corona structure we observed in Swift J1727.8–1613 and can be further supported by various approaches. For instance, using the reflection model relxillCP (García et al., 2014) to fit Insight-HXMT data, You et al. (2021) found that the corona in MAXI J1820+070 outflows more rapidly as it moves closer to the black hole, suggesting a jet-like corona that gains energy as it outflows.
Next, we compare our results with the radio emissions observed from VLITE by Peters et al. (2023) for this source during the period of the HIMS to SIMS transition. If the first and second flares are driven by the same mechanism and the Radio luminosity and X-ray luminosity generally follow the non-linear relation , it is plausible that the peak of the first flare should be corrected to around MJD 60199, aligning with the MAXI observations. This is reasonable given the coherence between the radio flux density and the X-ray light curve observed by RATEN and MAXI, respectively, during the subsequent flare and quenching (details can be seen in Ingram et al. 2023; Miller-Jones et al. 2023; Peters et al. 2023). Essentially, the radio emissions during the transition period from MJD 60190 to MJD 60204 are more likely indicative of a transient jet being launched, which is bright and consists of discrete relativistic ejecta from the black hole (Miller-Jones et al., 2012; Russell et al., 2019). It is noted the radio emission is suppressed rapidly near MJD 60202, a similar behavior has been observed by Méndez et al. (2022), i.e., a low radio emission at or above a QPO frequency of 2.0 Hz. In this case, our results showing a temporarily shrinking corona after a radio brightening or an ejection are similar to observations of a contracting corona due to a quenching jet during the outburst of MAXI J1820+070 (Kara et al., 2019). Subsequently, the corona as the jet base has recovered to its original size, which is also reasonable due to material spiraling into the corona along the magnetic field as the inner disk radius decreases (Galeev et al., 1979; Haardt & Maraschi, 1991). We note that the observed connection between the corona and the jet aligns with the findings of Wang et al. (2021) and Zhang et al. (2022), where a transient jet is seen to emerge following the expansion of the corona. However, this result remains tentative due to the low sampling rate of VLITE during the first flare.
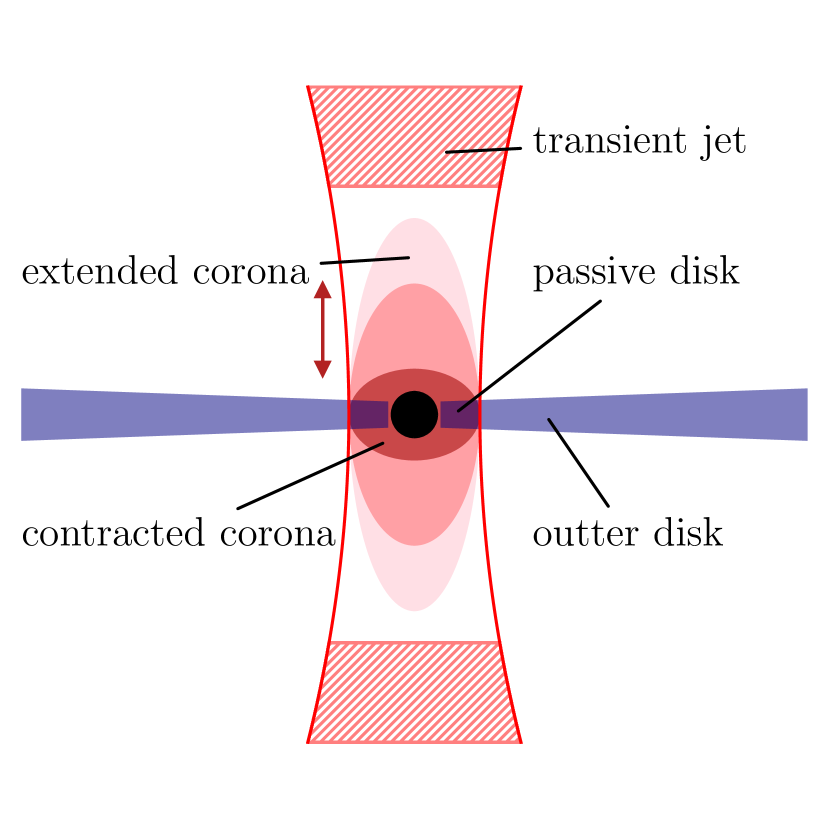
Based on the results presented, we propose an evolution model for the disk/corona during the flare state as follows (illustrated in the right panel of Fig. 6). Initially, the QPO frequency rises as the corona expands to its maximum vertical size. Once the QPO frequency reaches approximately 3 Hz, the corona contracts rapidly in the perpendicular direction, possibly due to episodic jet launching (i.e., part of the corona is converted into a jet). After this contraction, the QPO frequency increases again as the corona recovers until a new flare begins. Subsequently, the inner disk radius and the outer radius of the corona, which envelops the inner parts of the accretion disk (the passive disk) throughout the flare state, move toward or away from the black hole in a synchronous manner. Consequently, photons from the variable corona in the vertical direction irradiate the disk and then reprocess and re-emit, causing corresponding changes in negative QPO lags (see Section 4.1).
4.4 Phenomenological remarks
We have speculated on the presence of a truncated radius using two different methods. The inner radius and QPO curves predicted from the Lense-Thirring geometrical effect are higher than those derived from actual data. Additionally, the feedback fraction remains broadly constant, ranging from 0.3 to 0.5, suggesting that the corona likely maintains partial coverage of the accretion disk throughout the entire flare period, resembling an advection-dominated accretion flow (ADAF). Thus, we consider the corona to be somewhat akin to the ADAF in the below discussions. Recent research by Jiang et al. (2024) proposed a physical model for the radio and X-ray correlation in BHXBs, which may also aid in understanding the evolving corona structure of Swift J1727.8-1613 during the first flare observed in this study.
For simplicity, we present a toy model similar to the conventional ADAF case. The value of the critical accretion rate for the accretion mode transition can be estimated by equating the ion-electron equilibration timescale with the accretion timescale, which leads to
| (4) |
where
| (5) |
| (6) |
is the black hole mass, is , is , is the vertical components of the large-scale magnetic field at the disc surface, and is the commonly used critical accretion rate for a normal ADAF (Narayan & Yi, 1995; Narayan et al., 1998). For an ADAF with magnetic outflows, its luminosity can be approximated as , which means the ADAF with magnetically driven outflows is times more luminous than the conventional ADAF accreting at the critical rate. According to Jiang et al. (2024), the generated field strength of the large-scale field of the outer disc at the truncated radius can be calculated by
| (7) |
The elevated soft X-ray flux observed during the first flare, resulting from small perturbations in the accretion rate, is assumed to primarily originate from the ADAF with magnetic outflows. A constant viscosity parameter was utilized over this short timescale, with . Additionally, the trend of the accretion rate was estimated using , where the electron temperature varies with radius as a power law in the outer region of the ADAF, while the temperature distribution remains relatively flat in the inner region near the black hole (Manmoto, 2000; Xu & Cao, 2010).
Based on the relationship between the critical accretion rate of the ADAF with magnetic outflows and the truncated radius, it can be speculated that the magnetic field along the disk’s symmetry axis temporarily increases with the elevated accretion rate during short periods, such as the first flare period. Thus, the inner ADAF with magnetic outflows might expand radially or vertically, with a corresponding variable magnetic field in the radial or vertical direction. This speculation is partially supported by Bouchet et al. (2024), who observed a peak in the polarization fraction near MJD 60200 from the soft –ray data of INTEGRAL/IBIS for Swift J1727.8-1613 during its outburst. The polarization results in the soft –ray band (250-300 keV) are presented in Table 4.
Even though we have performed a simple phenomenological analysis in this work, partly supported by compiled data from polarization observations, the detailed physics within a real corona of BHXBs remains unclear. More observational data from upcoming X-ray missions with larger area detectors and polarization capabilities (e.g., eXTP; Zhang et al. 2019), as well as GRMHD simulations (Narayan et al., 2012), are required to provide a comprehensive understanding of the complete picture of the corona-jet evolution and the role of the magnetic field during the outburst of BHXBs.
| Data group | 1 | 2 | 3 | 4 | 5 |
|---|---|---|---|---|---|
| Start (MJD) | 60181.8 | 60186.6 | 60194.2 | 60200.2 | 60207.4 |
| Stop (MJD) | 60182.4 | 60193.0 | 60198.3 | 60203.7 | 60215.7 |
| PA | - | - | |||
| PF | |||||
| S/N | 29.7 | 55.3 | 43.5 | 26.1 | 20.3 |
5 Summary
We analyzed the data from 11 NICER observations during the state transition of Swift J1727.8–1613 from the LHS to the flare state. We fit the energy spectra of the source, as well as the rms and lag spectra of the type-C QPO in this source, using the one-component time-dependent Comptonization model vkompthdk. Below, we summarize our results:
(1) A type-C QPO with a centroid frequency increasing from 0.32 Hz to 2.63 Hz was detected. During the first flare, the central frequency of the QPOs showed a significant elevation, accompanied by a sudden increase in the soft X-ray flux. This correlation supports a close connection between the QPO frequency variations and the inner accretion disk.
(2) Strong correlations were found between the QPO and the inner disk properties, providing possible evidence that the type-C QPOs are modulated by Lense-Thirring precession.
(3) The data can be effectively fitted using the time-dependent Comptonization model vkompthdk. Based on this model, we have proposed a possible scenario for the evolution of the vertical jet-like corona geometry during the first flare period (a short time scale, 3 days), as derived from NICER observations and previously published radio data (see Section 4.3 for details). This evolution provides insights into the dynamic changes in the corona structure and its relationship with the observed QPO characteristics and radio emissions.
(4) We have also conducted a phenomenological analysis of the corona scenario in Swift J1727.8-1613 during the flare period, partially supported by polarization data from INTEGRAL/IBIS. However, the intrinsic physical mechanism under the variable corona remains unclear and requires further research.
Acknowledgements
This work was supported by the CAS ‘Light of West China’ Program (grant No. 2021-XBQNXZ-005), the National SKA Program of China (grant Nos. 2022SKA0120102 and 2020SKA0120300), the National Key R&D Program of China (grant Nos. 2023YFE0102300 and 2021YFA0718500), and the NSFC (grant Nos. U2031212, 12233002, and 12025301). LC acknowledges the support from the Tianshan Talent Training Program (grant No. 2023TSYCCX0099). NC, YFH, TA, and LCH acknowledge the support from the Xinjiang Tianchi Talent Program. LCH was supported by the National Key R&D Program of China (2022YFF0503401), the National Science Foundation of China (11991052, 12233001), and the China Manned Space Project (CMS-CSST-2021-A04, CMS-CSST-2021-A06). This work was also partly supported by the Urumqi Nanshan Astronomy and Deep Space Exploration Observation and Research Station of Xinjiang (XJYWZ2303).
References
- Alabarta et al. (2021) Alabarta, K., Altamirano, D., Méndez, M., et al. 2021, MNRAS, 507, 5507, doi: 10.1093/mnras/stab2241
- Arévalo & Uttley (2006) Arévalo, P., & Uttley, P. 2006, MNRAS, 367, 801, doi: 10.1111/j.1365-2966.2006.09989.x
- Bachetti et al. (2015) Bachetti, M., Harrison, F. A., Cook, R., et al. 2015, ApJ, 800, 109, doi: 10.1088/0004-637X/800/2/109
- Bachetti et al. (2023) Bachetti, M., Huppenkothen, D., Khan, U., et al. 2023, StingraySoftware/stingray: Version 1.1.2, v1.1.2, Zenodo, doi: 10.5281/zenodo.7970570
- Bellavita et al. (2022) Bellavita, C., García, F., Méndez, M., & Karpouzas, K. 2022, MNRAS, 515, 2099, doi: 10.1093/mnras/stac1922
- Belloni & Hasinger (1990) Belloni, T., & Hasinger, G. 1990, A&A, 227, L33
- Belloni et al. (2005) Belloni, T., Homan, J., Casella, P., et al. 2005, A&A, 440, 207, doi: 10.1051/0004-6361:20042457
- Belloni et al. (2002) Belloni, T., Psaltis, D., & van der Klis, M. 2002, ApJ, 572, 392, doi: 10.1086/340290
- Bouchet et al. (2024) Bouchet, T., Rodriguez, J., Cangemi, F., et al. 2024, arXiv e-prints, arXiv:2407.05871, doi: 10.48550/arXiv.2407.05871
- Bu et al. (2015) Bu, Q.-c., Chen, L., Li, Z.-s., et al. 2015, ApJ, 799, 2, doi: 10.1088/0004-637X/799/1/2
- Cabanac et al. (2010) Cabanac, C., Henri, G., Petrucci, P. O., et al. 2010, MNRAS, 404, 738, doi: 10.1111/j.1365-2966.2010.16340.x
- Casella et al. (2005) Casella, P., Belloni, T., & Stella, L. 2005, ApJ, 629, 403, doi: 10.1086/431174
- Castro-Tirado et al. (2023) Castro-Tirado, A. J., Sanchez-Ramirez, R., Caballero-Garcia, M. D., et al. 2023, The Astronomer’s Telegram, 16208, 1
- Chatterjee et al. (2024) Chatterjee, K., Mondal, S., Singh, C. B., & Sugizaki, M. 2024, arXiv e-prints, arXiv:2405.01498, doi: 10.48550/arXiv.2405.01498
- Corbel et al. (2004) Corbel, S., Fender, R. P., Tomsick, J. A., Tzioumis, A. K., & Tingay, S. 2004, ApJ, 617, 1272, doi: 10.1086/425650
- Cui et al. (1997) Cui, W., Zhang, S. N., Focke, W., & Swank, J. H. 1997, ApJ, 484, 383, doi: 10.1086/304341
- Esin et al. (1997) Esin, A. A., McClintock, J. E., & Narayan, R. 1997, ApJ, 489, 865, doi: 10.1086/304829
- Fender (2006) Fender, R. 2006, in Compact stellar X-ray sources, ed. W. H. G. Lewin & M. van der Klis, Vol. 39, 381–419, doi: 10.48550/arXiv.astro-ph/0303339
- Fender (2001) Fender, R. P. 2001, MNRAS, 322, 31, doi: 10.1046/j.1365-8711.2001.04080.x
- Fender et al. (2004) Fender, R. P., Belloni, T. M., & Gallo, E. 2004, MNRAS, 355, 1105, doi: 10.1111/j.1365-2966.2004.08384.x
- Fu et al. (2022) Fu, Y.-C., Song, L. M., Ding, G. Q., et al. 2022, Research in Astronomy and Astrophysics, 22, 115002, doi: 10.1088/1674-4527/ac8d80
- Galeev et al. (1979) Galeev, A. A., Rosner, R., & Vaiana, G. S. 1979, ApJ, 229, 318, doi: 10.1086/156957
- Gallo et al. (2003) Gallo, E., Fender, R. P., & Pooley, G. G. 2003, MNRAS, 344, 60, doi: 10.1046/j.1365-8711.2003.06791.x
- García et al. (2022) García, F., Karpouzas, K., Méndez, M., et al. 2022, MNRAS, 513, 4196, doi: 10.1093/mnras/stac1202
- García et al. (2021) García, F., Méndez, M., Karpouzas, K., et al. 2021, MNRAS, 501, 3173, doi: 10.1093/mnras/staa3944
- García et al. (2014) García, J., Dauser, T., Lohfink, A., et al. 2014, ApJ, 782, 76, doi: 10.1088/0004-637X/782/2/76
- Gendreau et al. (2016) Gendreau, K. C., Arzoumanian, Z., Adkins, P. W., et al. 2016, in Space telescopes and instrumentation 2016: Ultraviolet to gamma ray, Vol. 9905, SPIE, 420–435
- Haardt & Maraschi (1991) Haardt, F., & Maraschi, L. 1991, ApJ, 380, L51, doi: 10.1086/186171
- Harikrishna & Sriram (2022) Harikrishna, S., & Sriram, K. 2022, MNRAS, 516, 5148, doi: 10.1093/mnras/stac2527
- Homan & Belloni (2005) Homan, J., & Belloni, T. 2005, Ap&SS, 300, 107, doi: 10.1007/s10509-005-1197-4
- Homan et al. (2001) Homan, J., Wijnands, R., van der Klis, M., et al. 2001, ApJS, 132, 377, doi: 10.1086/318954
- Huppenkothen et al. (2019a) Huppenkothen, D., Bachetti, M., Stevens, A., et al. 2019a, The Journal of Open Source Software, 4, 1393, doi: 10.21105/joss.01393
- Huppenkothen et al. (2019b) Huppenkothen, D., Bachetti, M., Stevens, A. L., et al. 2019b, ApJ, 881, 39, doi: 10.3847/1538-4357/ab258d
- Ingram & Done (2012) Ingram, A., & Done, C. 2012, MNRAS, 419, 2369, doi: 10.1111/j.1365-2966.2011.19885.x
- Ingram et al. (2009) Ingram, A., Done, C., & Fragile, P. C. 2009, MNRAS, 397, L101, doi: 10.1111/j.1745-3933.2009.00693.x
- Ingram et al. (2019) Ingram, A., Mastroserio, G., Dauser, T., et al. 2019, MNRAS, 488, 324, doi: 10.1093/mnras/stz1720
- Ingram & van der Klis (2013) Ingram, A., & van der Klis, M. 2013, MNRAS, 434, 1476, doi: 10.1093/mnras/stt1107
- Ingram et al. (2023) Ingram, A., Bollemeijer, N., Veledina, A., et al. 2023, arXiv e-prints, arXiv:2311.05497, doi: 10.48550/arXiv.2311.05497
- Ingram & Motta (2019) Ingram, A. R., & Motta, S. E. 2019, New A Rev., 85, 101524, doi: 10.1016/j.newar.2020.101524
- Jiang et al. (2024) Jiang, Y., Li, S., Cao, X., et al. 2024, MNRAS, doi: 10.1093/mnras/stae1777
- Kara et al. (2019) Kara, E., Steiner, J., Fabian, A., et al. 2019, Nature, 565, 198
- Karpouzas et al. (2020) Karpouzas, K., Méndez, M., Ribeiro, E. M., et al. 2020, MNRAS, 492, 1399, doi: 10.1093/mnras/stz3502
- Kazanas et al. (1997) Kazanas, D., Hua, X.-M., & Titarchuk, L. 1997, ApJ, 480, 735, doi: 10.1086/303991
- Kubota et al. (2024) Kubota, A., Done, C., Tsurumi, K., & Mizukawa, R. 2024, MNRAS, 528, 1668, doi: 10.1093/mnras/stae067
- Kubota et al. (1998) Kubota, A., Tanaka, Y., Makishima, K., et al. 1998, PASJ, 50, 667, doi: 10.1093/pasj/50.6.667
- Liu et al. (2022) Liu, H. X., Huang, Y., Bu, Q. C., et al. 2022, ApJ, 938, 108, doi: 10.3847/1538-4357/ac88c6
- Ma et al. (2023) Ma, R., Méndez, M., García, F., et al. 2023, MNRAS, 525, 854, doi: 10.1093/mnras/stad2284
- Ma et al. (2021) Ma, X., Tao, L., Zhang, S.-N., et al. 2021, Nature Astronomy, 5, 94, doi: 10.1038/s41550-020-1192-2
- Manmoto (2000) Manmoto, T. 2000, ApJ, 534, 734, doi: 10.1086/308768
- Markoff et al. (2005) Markoff, S., Nowak, M. A., & Wilms, J. 2005, ApJ, 635, 1203, doi: 10.1086/497628
- Mata Sánchez et al. (2024) Mata Sánchez, D., Muñoz-Darias, T., Armas Padilla, M., Casares, J., & Torres, M. A. P. 2024, A&A, 682, L1, doi: 10.1051/0004-6361/202348754
- Méndez et al. (2022) Méndez, M., Karpouzas, K., García, F., et al. 2022, Nature Astronomy, 6, 577, doi: 10.1038/s41550-022-01617-y
- Méndez & van der Klis (1997) Méndez, M., & van der Klis, M. 1997, ApJ, 479, 926, doi: 10.1086/303914
- Miller-Jones et al. (2023) Miller-Jones, J. C. A., Bahramian, A., Altamirano, D., et al. 2023, The Astronomer’s Telegram, 16271, 1
- Miller-Jones et al. (2012) Miller-Jones, J. C. A., Sivakoff, G. R., Altamirano, D., et al. 2012, MNRAS, 421, 468, doi: 10.1111/j.1365-2966.2011.20326.x
- Mirabel & Rodríguez (1994) Mirabel, I. F., & Rodríguez, L. F. 1994, Nature, 371, 46, doi: 10.1038/371046a0
- Mitsuda et al. (1984) Mitsuda, K., Inoue, H., Koyama, K., et al. 1984, Astronomical Society of Japan, Publications (ISSN 0004-6264), vol. 36, no. 4, 1984, p. 741-759., 36, 741
- Miyamoto et al. (1991) Miyamoto, S., Kimura, K., Kitamoto, S., Dotani, T., & Ebisawa, K. 1991, ApJ, 383, 784, doi: 10.1086/170837
- Miyamoto & Kitamoto (1989) Miyamoto, S., & Kitamoto, S. 1989, Nature, 342, 773, doi: 10.1038/342773a0
- Motta et al. (2012) Motta, S., Homan, J., Muñoz Darias, T., et al. 2012, MNRAS, 427, 595, doi: 10.1111/j.1365-2966.2012.22037.x
- Motta (2016) Motta, S. E. 2016, Astronomische Nachrichten, 337, 398, doi: 10.1002/asna.201612320
- Nakajima et al. (2023) Nakajima, M., Negoro, H., Serino, M., et al. 2023, The Astronomer’s Telegram, 16206, 1
- Narayan et al. (1998) Narayan, R., Mahadevan, R., & Quataert, E. 1998, in Theory of Black Hole Accretion Disks, ed. M. A. Abramowicz, G. Björnsson, & J. E. Pringle, 148–182, doi: 10.48550/arXiv.astro-ph/9803141
- Narayan et al. (2012) Narayan, R., SÄ dowski, A., Penna, R. F., & Kulkarni, A. K. 2012, MNRAS, 426, 3241, doi: 10.1111/j.1365-2966.2012.22002.x
- Narayan & Yi (1995) Narayan, R., & Yi, I. 1995, ApJ, 452, 710, doi: 10.1086/176343
- Negoro et al. (2023) Negoro, H., Serino, M., Nakajima, M., et al. 2023, The Astronomer’s Telegram, 16205, 1
- Nowak et al. (1999) Nowak, M. A., Vaughan, B. A., Wilms, J., Dove, J. B., & Begelman, M. C. 1999, ApJ, 510, 874, doi: 10.1086/306610
- O’Connor et al. (2023) O’Connor, B., Hare, J., Younes, G., et al. 2023, The Astronomer’s Telegram, 16207, 1
- Page et al. (2023) Page, K. L., Dichiara, S., Gropp, J. D., et al. 2023, GRB Coordinates Network, 34537, 1
- Payne (1980) Payne, D. G. 1980, ApJ, 237, 951, doi: 10.1086/157941
- Peirano et al. (2023) Peirano, V., Méndez, M., García, F., & Belloni, T. 2023, MNRAS, 519, 1336, doi: 10.1093/mnras/stac3553
- Peng et al. (2024) Peng, J.-Q., Zhang, S., Shui, Q.-C., et al. 2024, ApJ, 960, L17, doi: 10.3847/2041-8213/ad17ca
- Peters et al. (2023) Peters, W. M., Polisensky, E., Clarke, T. E., Giacintucci, S., & Kassim, N. E. 2023, The Astronomer’s Telegram, 16279, 1
- Rawat et al. (2023a) Rawat, D., Husain, N., & Misra, R. 2023a, MNRAS, 524, 5869, doi: 10.1093/mnras/stad2220
- Rawat et al. (2023b) Rawat, D., Méndez, M., García, F., et al. 2023b, MNRAS, 520, 113, doi: 10.1093/mnras/stad126
- Remillard & McClintock (2006) Remillard, R. A., & McClintock, J. E. 2006, ARA&A, 44, 49, doi: 10.1146/annurev.astro.44.051905.092532
- Remillard et al. (2002) Remillard, R. A., Sobczak, G. J., Muno, M. P., & McClintock, J. E. 2002, ApJ, 564, 962, doi: 10.1086/324276
- Russell et al. (2011) Russell, D. M., Miller-Jones, J. C. A., Maccarone, T. J., et al. 2011, ApJ, 739, L19, doi: 10.1088/2041-8205/739/1/L19
- Russell et al. (2019) Russell, T. D., Tetarenko, A. J., Miller-Jones, J. C. A., et al. 2019, ApJ, 883, 198, doi: 10.3847/1538-4357/ab3d36
- Shakura & Sunyaev (1973) Shakura, N. I., & Sunyaev, R. A. 1973, A&A, 24, 337
- Shimura & Takahara (1995) Shimura, T., & Takahara, F. 1995, ApJ, 445, 780, doi: 10.1086/175740
- Sridhar et al. (2019) Sridhar, N., Bhattacharyya, S., Chandra, S., & Antia, H. M. 2019, MNRAS, 487, 4221, doi: 10.1093/mnras/stz1476
- Stella & Vietri (1998) Stella, L., & Vietri, M. 1998, ApJ, 492, L59, doi: 10.1086/311075
- Stevens et al. (2018) Stevens, A. L., Uttley, P., Altamirano, D., et al. 2018, ApJ, 865, L15, doi: 10.3847/2041-8213/aae1a4
- Tagger & Pellat (1999) Tagger, M., & Pellat, R. 1999, A&A, 349, 1003, doi: 10.48550/arXiv.astro-ph/9907267
- Tanaka & Shibazaki (1996) Tanaka, Y., & Shibazaki, N. 1996, ARA&A, 34, 607, doi: 10.1146/annurev.astro.34.1.607
- Titarchuk & Fiorito (2004) Titarchuk, L., & Fiorito, R. 2004, ApJ, 612, 988, doi: 10.1086/422573
- Uttley et al. (2014) Uttley, P., Cackett, E. M., Fabian, A. C., Kara, E., & Wilkins, D. R. 2014, A&A Rev., 22, 72, doi: 10.1007/s00159-014-0072-0
- Veledina et al. (2023) Veledina, A., Muleri, F., Dovčiak, M., et al. 2023, ApJ, 958, L16, doi: 10.3847/2041-8213/ad0781
- Vignarca et al. (2003) Vignarca, F., Migliari, S., Belloni, T., Psaltis, D., & van der Klis, M. 2003, A&A, 397, 729, doi: 10.1051/0004-6361:20021542
- Wang et al. (2021) Wang, J., Mastroserio, G., Kara, E., et al. 2021, ApJ, 910, L3, doi: 10.3847/2041-8213/abec79
- Wijnands et al. (1999) Wijnands, R., Homan, J., & van der Klis, M. 1999, ApJ, 526, L33, doi: 10.1086/312365
- Xu & Cao (2010) Xu, Y.-D., & Cao, X. 2010, ApJ, 716, 1423, doi: 10.1088/0004-637X/716/2/1423
- Yang et al. (2023) Yang, Z.-X., Zhang, L., Zhang, S. N., et al. 2023, MNRAS, 521, 3570, doi: 10.1093/mnras/stad795
- You et al. (2021) You, B., et al. 2021, Nature Commun., 12, 1025, doi: 10.1038/s41467-021-21169-5
- Yu et al. (2024) Yu, W., Bu, Q.-C., Zhang, S.-N., et al. 2024, MNRAS, 529, 4624, doi: 10.1093/mnras/stae835
- Zdziarski et al. (1996) Zdziarski, A. A., Johnson, W. N., & Magdziarz, P. 1996, MNRAS, 283, 193, doi: 10.1093/mnras/283.1.193
- Zhang et al. (2019) Zhang, S., Santangelo, A., Feroci, M., et al. 2019, Science China Physics, Mechanics, and Astronomy, 62, 29502, doi: 10.1007/s11433-018-9309-2
- Zhang et al. (2022) Zhang, Y., Méndez, M., García, F., et al. 2022, MNRAS, 512, 2686, doi: 10.1093/mnras/stac690
- Zhang et al. (2023) —. 2023, MNRAS, 520, 5144, doi: 10.1093/mnras/stad460
- Życki et al. (1999) Życki, P. T., Done, C., & Smith, D. A. 1999, MNRAS, 309, 561, doi: 10.1046/j.1365-8711.1999.02885.x