Disruption Risk Evaluation on Large-scale Production Network
with Establishments and Products***
This research was conducted as part of a project entitled ‘Research on Relationships between Economic Networks and National Security,’ undertaken at the Research Institute of Economy, Trade, and Industry (RIETI). The authors are grateful for the financial support of JSPS Kakenhi Grant Nos. JP23K20626, JP23K23020, JP23K25520, JP24K00247, JP24K01108, JP23H00823, JP22K18533, JST PRESTO Grant Number JPMJPR21R2, the Asahi Glass Foundation. The opinions expressed and arguments employed herein do not necessarily reflect those of RIETI, University of Hyogo, RIKEN Center for Computational Science, Waseda University, or any institution with which the authors are affiliated.
Hiroyasu Inoue†††Graduate School of Simulation Studies, University of Hyogo and RIKEN Center for Computational Science, inoue@gsis.u-hyogo.ac.jp. and Yasuyuki Todo‡‡‡Graduate School of Economics, Waseda University and RIETI, yastodo@waseda.jp.
Abstract
We constructed an establishment-level production network where each establishment inputs and outputs multiple products, using data that includes the firm-level production network and establishments covering nearly all Japanese entities. The network represents the manufacturing sector with 183,951 establishments across 157,537 firms and 919,982 inter-establishment linkages. A probabilistic model of supply chain disruptions was applied to this network. The key findings are as follows: (1) The establishment-level network exhibits greater shock propagation compared to the firm-level network. (2) Incorporating actual product information leads to a larger impact on propagation compared to using industry-level information. (3) Regional shock simulations reveal that while the firm-level network shows greater shock propagation when the shock originates in Tokyo, no such difference is observed in the establishment-level network. Keywords: Production Network; Simulation; Establishment; Product; Supply-chain; Disruption
1 Introduction
Supply chain disruptions are threats for the real economy. The disruptions can be propagated to other firms through production networks. When a disruption reduces production of some firms due to exogenous shocks, such as disasters, pandemics, or national conflicts, the suppliers of the firms directly affected by the shock must reduce their production because of a lack of demand, and their customers must also shrink production because of a shortage of material, parts, or components [Carvalho et al., 2016, Barrot and Sauvagnat, 2016]. As a result, even if the initial shock is small, it can lead to a substantial indirect effect, often more substantial than the direct effect of the shock itself [Tierney, 1997, Pelling et al., 2002] and hence large fluctuations across the economy [Bak et al., 1993, Gatti et al., 2005, Acemoglu et al., 2012]. Some earlier works rely on inter-industry analysis based on input–output (IO) tables to estimate propagations of shocks [Acemoglu et al., 2012, Haimes and Jiang, 2001, Okuyama et al., 2004].
In a production network, each company has different trading partners. The behavior of the production network emerges from these micro-interactions, which are much more complex than physical interactions, such as those between molecules, because physical interactions lack the heterogeneity of interacting entities and their numbers. In contrast, IO tables aggregate company transactions and cannot capture these individual circumstances, making it inherently limited in understanding the behavior of the production network. This means that chained collapses do not happen and the estimations tend to be smaller than reality [Inoue and Todo, 2019a] or erroneous Diem et al. [2024]. To deal with this issue, the estimations based on firm-level production network data have bloomed, especially accelerated by the recent availability of data [Poledna et al., 2018, Inoue and Todo, 2019a, Diem et al., 2022, Pichler et al., 2023].
Although these studies revealed complex behaviours of production networks, firm-level production networks still have drawbacks. When disasters or pandemics occur, shocks are given to firms and exact locations should be identified. However, if a firm does not involve locations of establishments, and generally has a headquarter’s location at best, it is obvious that the estimation is unreliable. In addition, the production networks in reality are the flow of the specific goods. However, the literature do not have such information. Instead, they consider industries of firms at most. Goods information is important to consider substitutability of supplies. If the industry is used to estimate substitutability, it is obviously too coarse. Moreover, a firm or an establishment can produce more than one goods, which means that the productivity of multiple goods should be evaluated separately even if they are produced in the same facility. In contrast, the literature only considers an industry and have not discussed the possibility of the multiple goods productions.
To fill this gap, we created various production networks. The most complex one consists of establishments and flows of multiple goods. To do so, we use the Company Information Database and Company Linkage Database collected by Tokyo Shoko Research that includes 1,520,605 firms and 5,860,726 supplier–client relationships in 2020, although we use manufacturing sector from them. In addition, we also use Economic Census for Business Activity conducted by Ministry of Economy, Trade, and Industry that includes 512,401 establishments in manufacturing sector in 2021. Importantly, the latter data includes product information establishments produce, which enables us to decompose inter-firm linkages into inter-establishment linkages through the inference of recipe. Consequently, we obtain a manufacturing production network that covers 183,951 establishments in 157,537 firms and 919,982 inter-establishment linkages. We apply a probabilistic model for supply chain disruptions to the different networks and assess their responses. The configurations include: (1) a firm-level network and an establishment-level network with industrial classifications; (2) establishment-level networks with different substitutability; (3) firm-level and establishment networks with regional shocks.
Our findings are as follows: (1) The establishment-level network shows a higher propagation of shocks than the firm-level network. There are 157,537 firms in the firm-level network and those links between firms in the network remain unchanged. A firm can be separated into multiple establishments and there are 183,951 establishments in the establishment-level network. (2) The different substitutability examinations show that the infusion of the actual products information shows a large impact of propagation than the industry information. This result is consistent with those of the first: more detailed classifications lead to increased shock propagation and that substitutability plays a substantial role. (3) The simulation for the regional shocks show that the firm-level network shows significantly greater shock propagation when the shock originates in Tokyo compared to when it originates elsewhere. However, in the establishment-level network, no such difference is observed.
2 Data
2.1 Primary data
Our primary data source of this paper is the dataset collected by Tokyo Shoko Research (TSR), specifically their company information database and company linkage database. The company information database includes attributes for each firm. Specifically, we utilize name, address, industry classification, sales, and corporate number. The company linkage database details domestic clients and suppliers. We focus on data from 2020, so that we can match it with the Economic Census explained later. The 2020 data is the available and closest data to the year of 2021 when the Economic Census conducted. The dataset comprises 1,520,605 firms and 5,860,726 trade links. This data set encompasses most firms in Japan, excluding micro enterprises, and captures the majority of significant production relationships among them. As is mentioned later, we extract the manufacturing firms from this dataset.
While the TSR data are valuable for providing firm level production network, a limitation is the lack of establishments and the goods they provide. On the other hand, in this paper, we focus on decomposing the production network from the firm level to the establishment level and accounting for the output of multiple products at these establishments. The Economic Census for Business Activity (hereafter referred as the census) is used for this purpose. The census is collected every five years by the Ministry of Internal Affairs and Communications and the Ministry of Economy, Trade and Industry [Statistics Bureau of Japan, 2021]. The census covers all establishments across all industries in Japan, including those of micro, small, and medium-sized enterprises and its data includes detailed information about the establishments, such as their name, address, phone number, number and type of employees, business activities, enterprise type, breakdown of sales, breakdown of expenses, and purchased items. However, it does not include information on which specific establishments or firms they trade with, leaving the trading partners unidentified.
We specifically use the 2021 census data, which includes 5,156,063 establishments. We integrate the census data with the TSR data using corporate numbers. This process adds 1,014,673 non-headquarter establishments to the existing headquarters data in the TSR dataset. Although the merged data covers all firms and establishments in Japan, we focus on the manufacturing sector as a subset. This is because, as we will explain, creating a network of establishments requires considering the recipe for each product, and product recipes in the manufacturing sector are relatively easier to account for. Moreover, if we include other sectors, especially wholesale sector, it is quite difficult to consider the relationships between establishments. Furthermore, we examined each firm’s purchasing amount from other domestic firms using the Basic Survey of Japanese Business Structure and Activities (Kigyo Katsudo Kihon Chosa, hereafter BSJ), conducted annually by the Ministry of Economy, Trade and Industry. This allows us to exclude firms that trade exclusively with foreign companies. As a result, the final subset includes 157,537 firms and 183,951 establishments.
2.2 Creating network data with establishment and product
As mentioned, the TSR data includes firm data and trade relationships between firms, while the census includes establishment data but lacks trade information between establishments. Therefore, there is no direct data on trade relationships between establishments, and it is not clear how they are connected. It is inappropriate to assume that all pairs of establishments between supplier and client firms have trade connections, simply because large firms often have multiple establishments that produce diverse goods. If all products were assumed to be supplied to all client establishments, it would not accurately reflect the actual relationships. Therefore, we need to infer the trade connections between establishments. This involves identifying the most plausible connections from the potential complete set of connections between all establishments of supplier and client firms.
To identify the plausible connections between establishments, we create the recipes of each product first because establishments with unnecessary supplies can be omitted from candidate suppliers by referring to the recipe for a product. We utilize the following data: inter-firm trade connections, firm-establishment associations, and output products of establishments to obtain the recipes. Note that a firm has at least one establishment and each establishment has one or more output products. As the first step, we connect all establishments of a supplier firm to all establishments of a client firm. Then, we obtain the possible recipe for a product of a client establishment. As a result, we obtain observed possible recipes for each product, which has the aggregated number of observations as inputs. Next, we put a cutoff threshold for the observations and in this paper, we use the 50% threshold. This means that if there are establishments that produce a product, the necessary observation to be considerd in the recipe as inputs, should be more than times.
As a simple example to understand this cutoff process, imagine an automobile as an output product. The establishment producing the automobile might have supplier establishments from food manufacturers, as the automobile establishment may provide meals for its employees. However, food is not a direct input for the production of an automobile. We can expect that such unnecessary inputs are not consistently observed across all automobile-producing establishments. Therefore, we set a cutoff threshold. It should be noted, however, that this threshold is arbitrarily decided. A sensitivity check is also conducted for different thresholds.
The connections between establishments are filtered by another criterion. Even after applying the cutoff based on the recipe, a client establishment may still have redundant supplier establishments. If a supplier firm has multiple establishments that produce the same product, it would be unnatural for a client establishment to maintain connections with all these supplier establishments. Therefore, we address this issue using a set cover problem with groups and priorities.
The set cover problem is a common optimization problem. It involves a universal set containing all elements and a collection of subsets, each containing some elements from the universal set. The objective is to find the smallest number of these subsets that together include every element in the universal set. Although this problem is NP-hard, it is solvable in this study due to the relatively small size of each instance.
In our context, the problem is to select the minimal combination of supplier establishments for a client establishment. The universal set consists of the collection of inputs identified by the cutoff recipe. The subsets represent supplier establishments, with their elements being the products outputted by these establishments.
Additionally, we incorporate groups into the set cover problem. A group represents a collection of subsets, corresponding to a firm in this study. The group constraint requires that at least one subset (establishment) from each group (firm) be chosen, reflecting the fact that the TSR data indicate there is at least one transaction between the supplier and client firms.
Furthermore, we introduce a priority into the set cover problem. If a subset (an establishment) is chosen, the priority of other subsets (establishments) within the same group (firm) is decreased by one. Therefore, if multiple subsets (establishments) have the same elements (output products) but belong to different groups (firms), the selection considers the priority.
It should be noted that the obtained network, constructed by solving the set cover problem and incorporating establishments and products, provides the minimal connections between establishments. However, in other potential networks, redundant suppliers offering the same products as other suppliers may exist. Since actual connection data are unavailable, it is not possible to validate the constructed network against real connections. Therefore, the obtained network represents one of many possible configurations with minimal connections.
2.3 Preliminary Analysis
Through the process described above, we have constructed a production network with establishments and products. There are 2,396 product classifications in the manufacturing sector. On the other hand, there are 595 industrial classifications in the manufacturing sector [Ministry of Internal Affairs and Communications, Japan, 2013]. The naive combinations between products, as indicated by firm-level trade relationships—where a supplier’s output products are connected to a client’s output product—total 1,182,274. This number represents the connections of products observed at least once. After applying the cutoff, the recipe includes 43,340 input-output product combinations.
The complete set of trade connections between supplier and client establishments, encompassing all establishments of supplier and client firms, amounts to 18,872,233. By applying the cutoff recipe and solving the set cover problem, we have identified 919,982 valid connections.
The two networks, consisting of firms and establishments, have 157,537 and 183,951 nodes, and 480,507 and 919,982 links, respectively. Table 1 summarizes these counts. The average number of links per node is significantly higher in the establishment-level network compared to the firm-level network.
| Average Link | |||
|---|---|---|---|
| Node | Link | per Node | |
| Firm-level | 157,537 | 480,507 | 6.1 |
| Establishment-level | 183,951 | 919,982 | 10.0 |
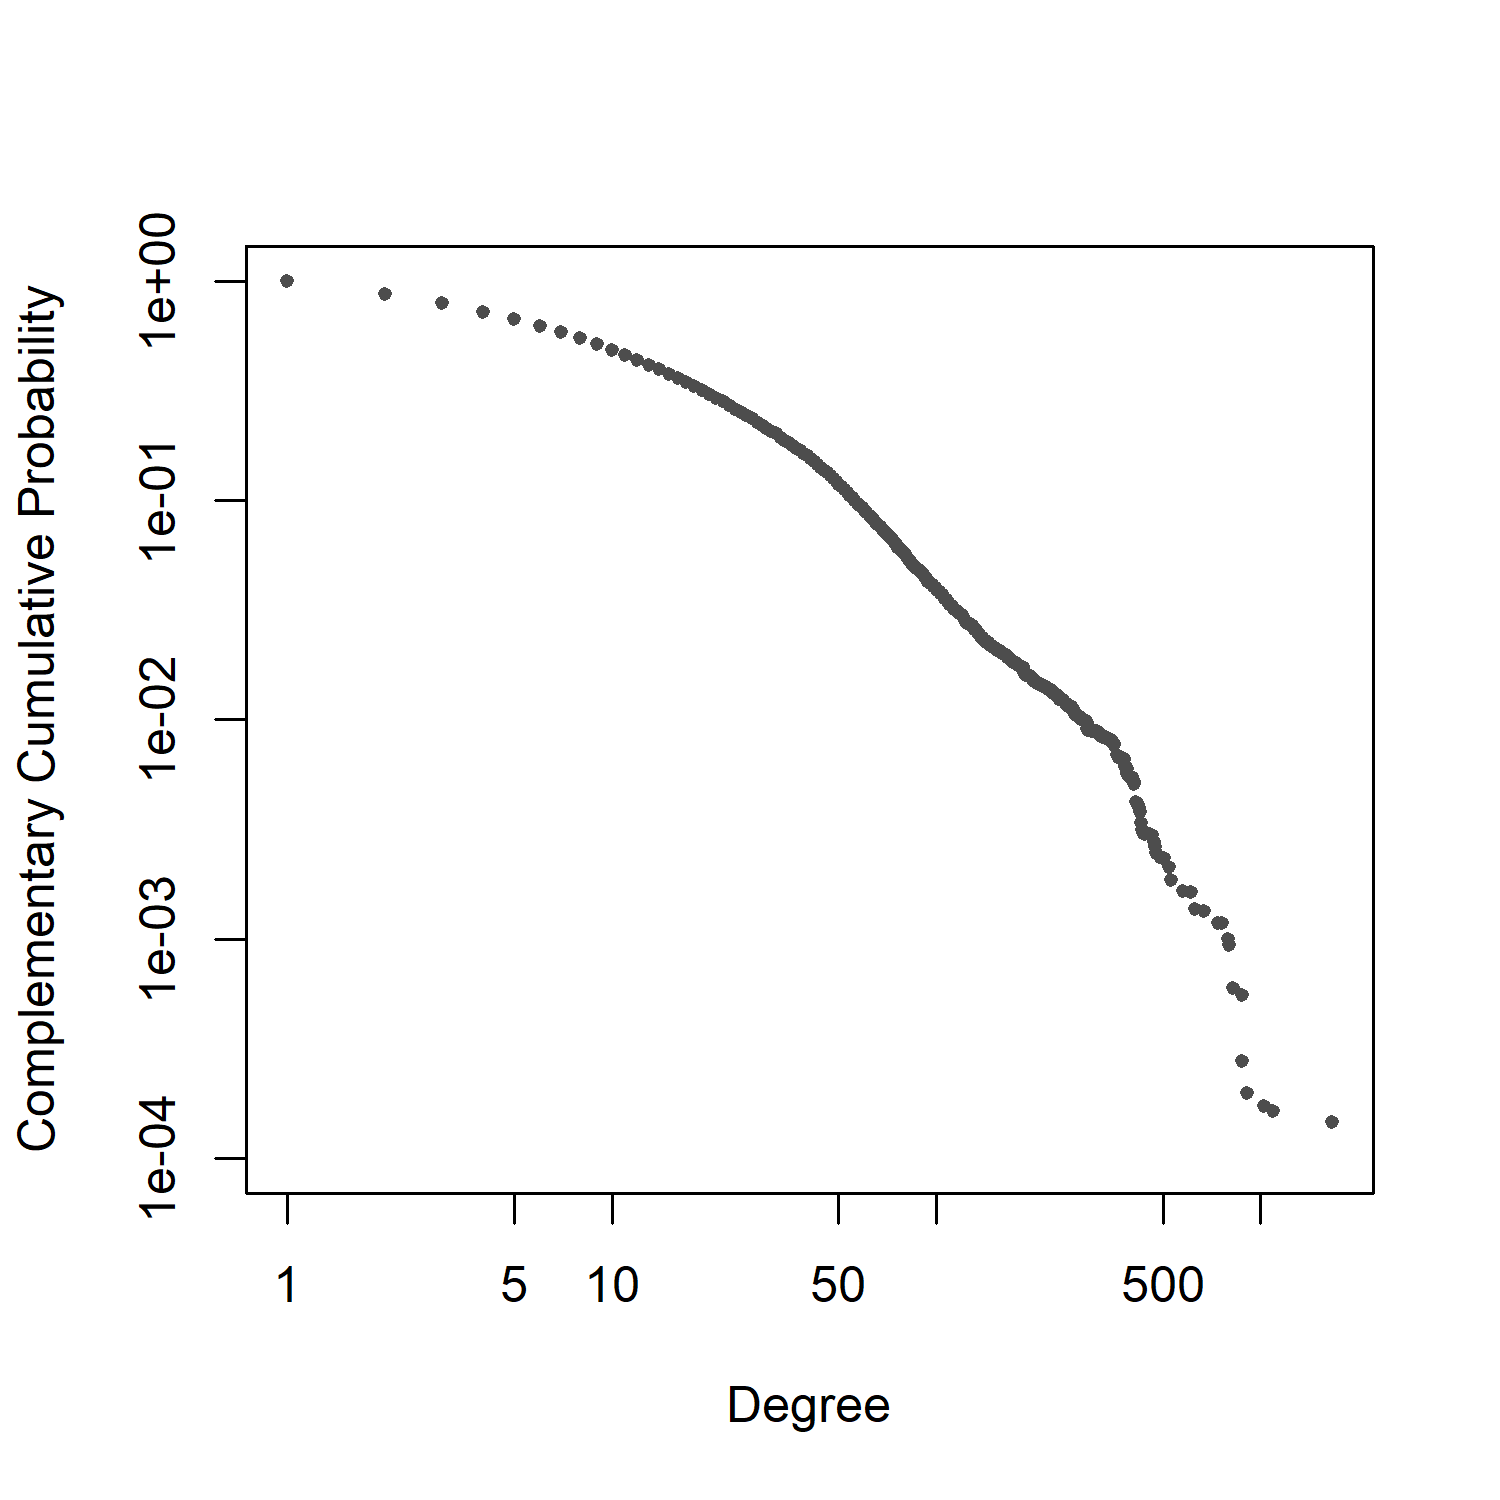
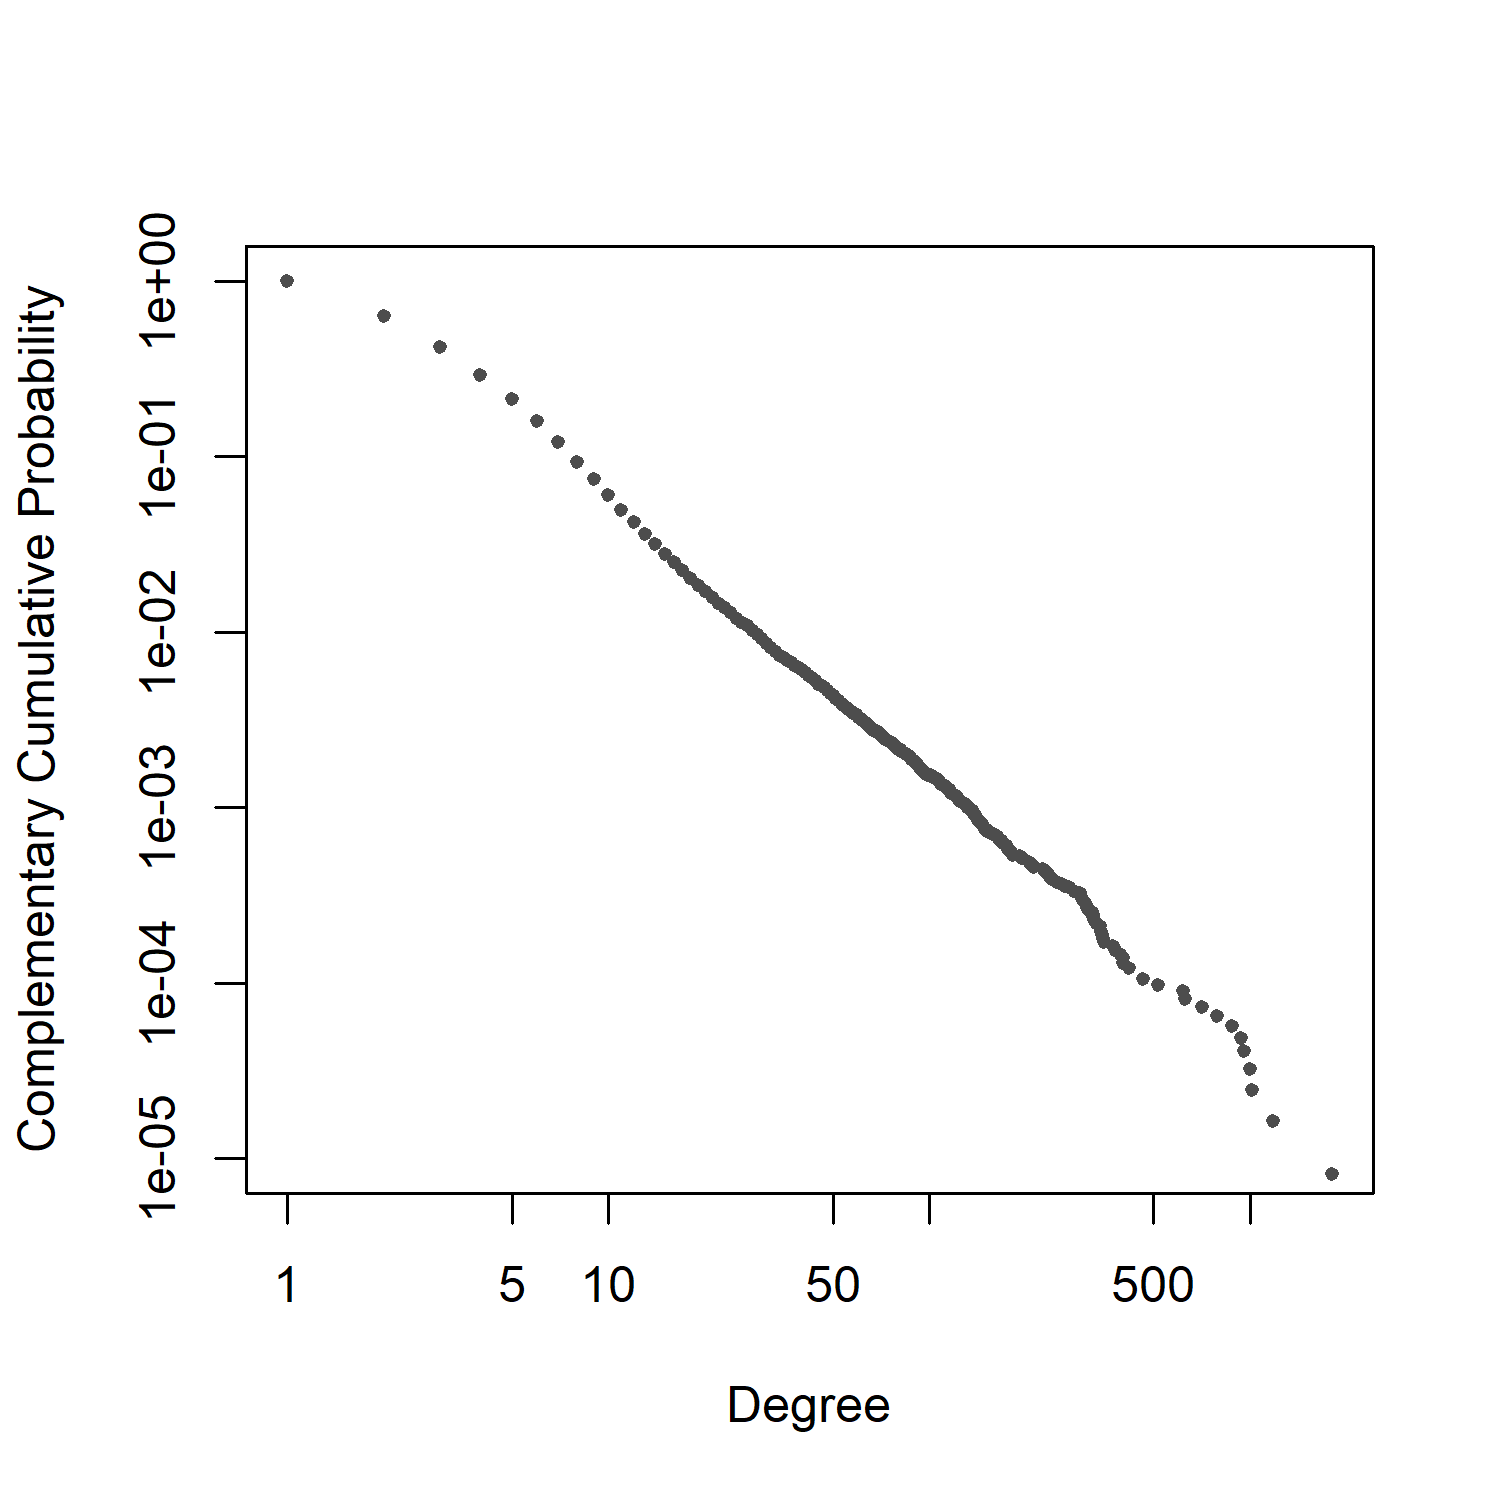
In a network, the number of links a node has is called degree. The distribution of degrees provides structural information about the network. In this study, the comparison of two production networks should be addressed: a firm-level production network represented by the primary TSR data and the establishment-level production network inferred using the process described above. Both degree distributions have a similar form and seem to follow power-law distributions (Figure 1), although the establishment-level network is infered through pruning the quite large scale data. The directions of the links are not considered in these distributions.
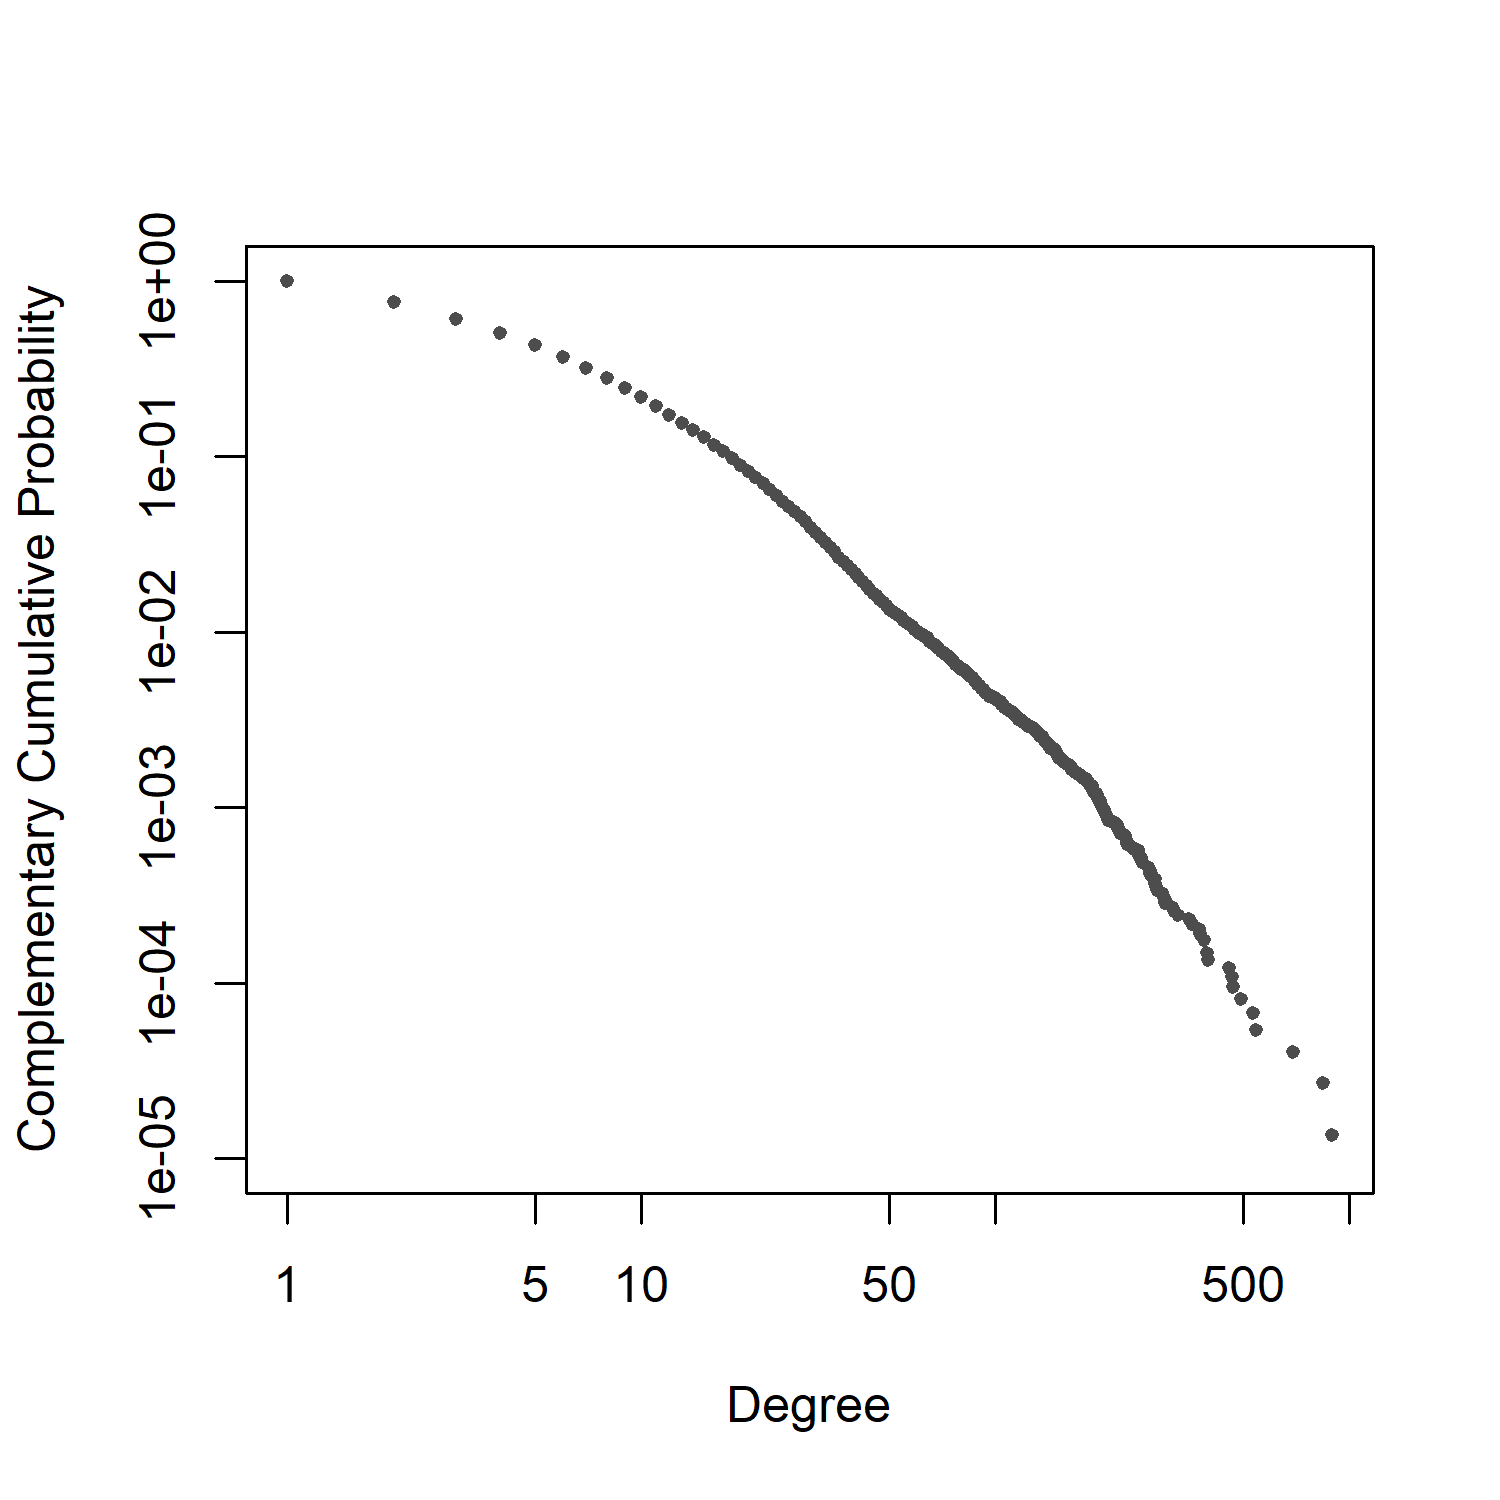
Although they are similar, there are prominent differences in the lower frequency of low-degree nodes. For example, 90% of the nodes have fewer than 7 links in the firm-level network, while 90% have fewer than 17 links in the establishment-level network. This difference may be due to the fact that every establishment needs to find supplier establishments to fulfill its recipe, often resulting in multiple connections with establishments within the same supplier firm. These connections are simply counted as 1 in the firm-level production network. This reasoning is supported by the difference observed in the distribution of the complete connections between establishments (Figure A.1). In this complete connection network, 90% of the nodes have fewer than 56 links, a significant deviation from the firm-level network.
As is described above, establishment-level networks with a power-law degree distribution have several characteristics, one of which is a very short average path length [Barabási, 2016]. This implies that a shock can propagate through the entire network quickly.
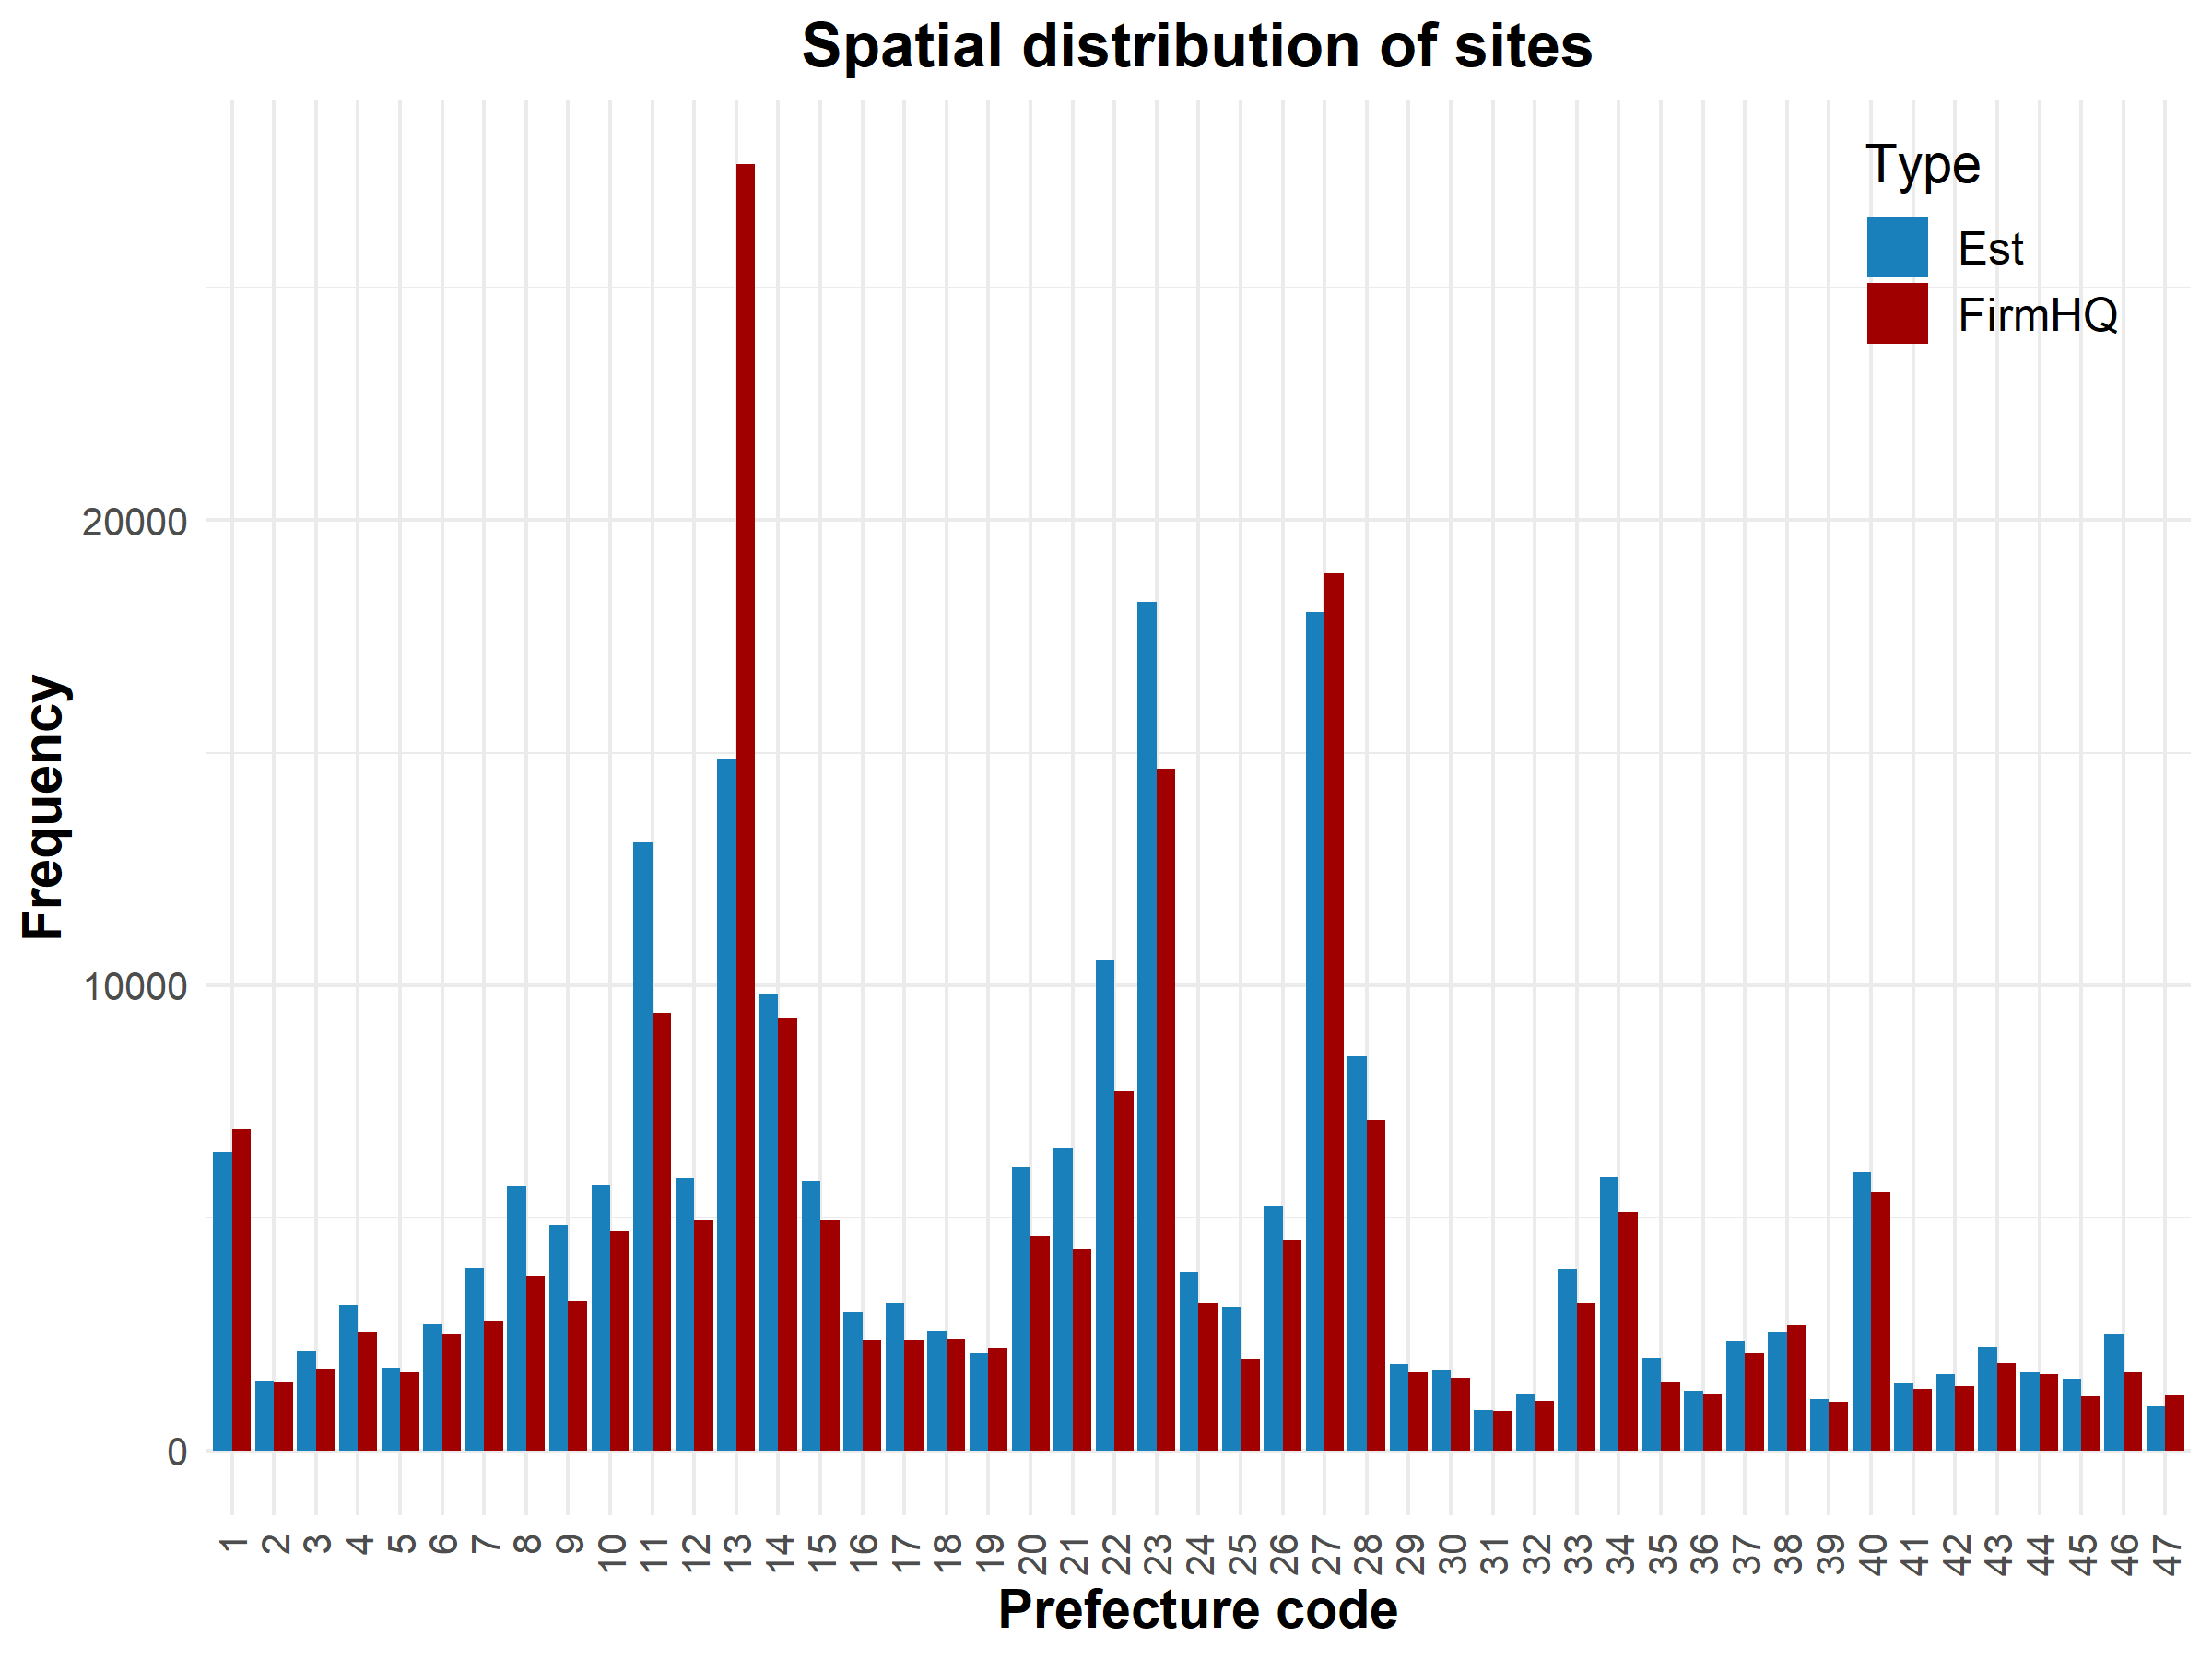
Since one of the advantages of using the establishment-level network, rather than the firm-level network, is its spatial distribution, we compare the distributions of firms and establishments by prefecture (Figure 2). As expected, Tokyo (Code 13), the capital, has a large number of headquarters, which is double the number of establishments. On the other hand, in industrial areas such as Saitama (Code 11), Shizuoka (Code 22), and Aichi (Code 23), there are more establishments than firm headquarters. The disparity, especially in Tokyo, will be examined from the perspective of initial shocks in the later section.
3 Method
In this paper, we propose a model in which externally imposed production infeasibility shocks propagate probabilistically across a production network. While many existing models account for complex behaviors within and between entities to calculate shock propagation Battiston et al. [2012], Fujiwara et al. [2016], Inoue and Todo [2019a], this paper introduces a much simpler model, allowing for straightforward comparison between different networks. A similar model can be found in Zhao et al. [2019] in terms of its simplicity; however, the key distinguishing feature of the present model is its use of a Leontief production function, determined by input goods from suppliers. In other words, substitution between different input goods is not possible. Here, it is important that each production entity, i.e. a client, fundamentally has different suppliers due to the network structure. Note that when multiple suppliers provide the same input good, the propagation of the shock is mitigated. The formal description is as follows.
First, we introduce the notations for a production network and products. The adjacency matrix is denoted by , where are institutions: establishments or firms. The element is 1 if connected and 0 if not. Since the network is directed, is asymmetric. The output products of each institution are denoted as . is a set of products. The input products of each institution are derived from them as , where means that if the left operand is equal to one, the right operand is valid, and vice versa.
Next, we describe the propagation process. Each institution has a state, which is defined as at time . can be in one of two states: active or inactive. We assign 1 and 0 for simplicity in the notations. Once an institution becomes inactive, it cannot become active again during the propagation calculation. Let be the set of institutions that became newly inactive at time . The set of active client institutions that have at least one supplier in is denoted as . For an institution in , let be the subset of that supplies to . The probability of propagation to institution at time is calculated as follows:
| (1) |
where is the probability of shock propagation to institution at time through product . This Eqn. (1) means only when there is no shock propagation for all supply products that newly inactive suppliers have, remains active and vice versa. The is expressed by the following equation:
| (2) |
where is the basic propagation probability of inactivity and is a parameter. is a common indicator function corresponding to
| (3) |
Eqn. (2) means if a client institution has supplier institutions regarding product , the propagation is mitigated by its number.
Initially, all are active. However, one institution is uniformly and randomly selected to become inactive from all institutions (or within specific candidates depending on the setting). The propagation is then calculated as described above, continuing as long as new inactives are generated. This process is considered one set, and for each setting, 100,000 sets are calculated. In addition, the propagation probability ranges from 0.2 to 1.0, increasing in steps of 0.2.
4 Simulation Results and Discussions
Using the data prepared so far and the propagation model described above, we will address three comparisons. The first comparison is between the newly constructed establishment-level network and the conventional firm-level network. The second comparison examines the differences in assumptions regarding products and substitutability within the establishment-level network. The third comparison explores whether there are differences based on the region where the initial shock node is selected.
4.1 Comparisons between firm- and establishment-level networks
In the first comparison, within the firm-level and establishment-level networks, firms and establishments are used as the nodes, respectively. Regarding the “product” in the model, we did not use actual product information, although we utilize the information of the products to infer the establishment-level network; instead, we used the industry classifications within the manufacturing sector for firms and establishments. This is because not only the input-output table analyses, but also the firm-level network analyses commonly use industries to categorize the entities. As previously mentioned, 545 industry classifications are observed. Each node, either a firm or an establishment, is assigned one industry classification, and this classification is treated as the “product” of that node in the model for the calculations. As will become important in later interpretations, this industrial classification is the same set for both firms and establishments. However, the industries of firms and establishments belonging to the firms are not necessarily identical. In addition, both firms and establishments can be classified into multiple industries, but the primary classification is used in this analysis.
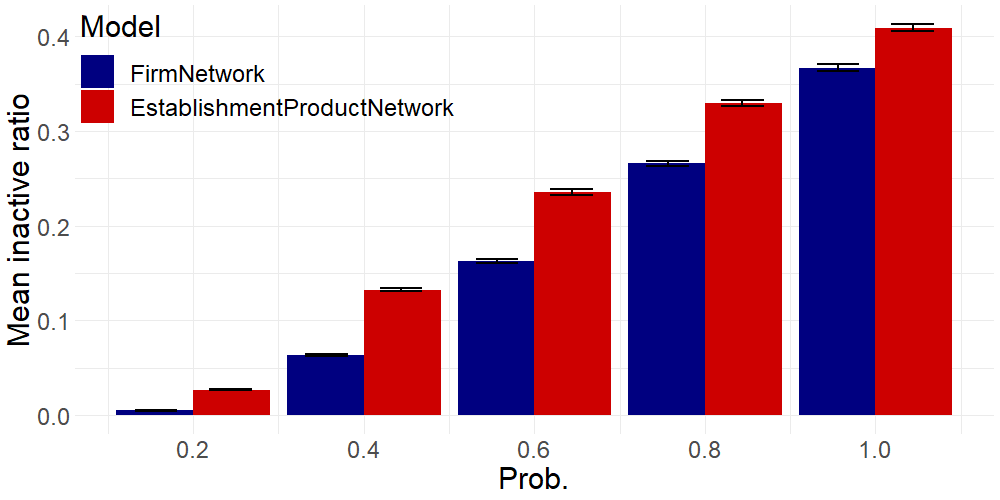
As a result, the establishment-level network shows a higher propagation of shocks (Figure 3). The difference is statistically significant based on the t-tests. As detailed in Section 2.2, to create the establishment-level network, the links between firms in the network remain unchanged, while a firm can be separated into multiple establishments, and the links between these establishments are inferred. In addition, there are 157,537 firms in the firm-level network and 183,951 establishments in the establishment-level network, which may not represent a substantial difference. Considering such minor difference, this result is noteworthy.
The reason for this difference mainly lies in the fact that the establishment-level network has diverse inputs. Since the establishment-level network has denser links than the firm-level network, we could expect the better substitutability if suppliers’ products (industries in this comparison) overlap. However, in reality, the opposite occurred; the increase of the links ends up the more diverse input products (industries). Therefore, the establishment-level network has the large propagation.
The primary reason for this difference lies in the fact that the establishment-level network has more diverse inputs. Given that the establishment-level network has denser links compared to the firm-level network, we might expect better substitutability if suppliers’ products (industries in this comparison) overlap. However, in reality, the opposite occurred: the increase in links resulted in more diverse input products (industries). Consequently, the establishment-level network experiences greater propagation.
The fact that establishments are more diverse in terms of industry than firms is natural. If establishments belong to the same industrial classification, there is generally an economic incentive to merge them. Therefore, the industrial classifications of establishments within a firm tend to be diverse, and the industries of suppliers tend to be varied as well.
It has been pointed out that analyses using input-output tables tend to underestimate supply-side shocks compared to firm-level analyses [Inoue and Todo, 2019b]. This discrepancy is often explained by the fact that, unlike the dense and nearly complete graphs represented by input-output tables, firm-level networks are sparse, with each firm connecting to different partners. This heterogeneity was cited as a primary cause. The difference between input-output table analysis and firm-level data analysis is analogous to the focus of this paper, as it reflects a shift toward more detailed analysis, moving from the firm level to the establishment level. However, there is a key difference: in the former, the heterogeneity and the sparseness of the network primarily explain the difference. In the latter, which is the focus of this paper, the analysis shows that even in an already heterogeneous network, denser networks with the establishments to reflect reality can even strengthen the shock. In other words, this analysis demonstrates that subdividing into establishments has a clear impact in creating differences of the propagation.
4.2 Substitutability in establishment-level network
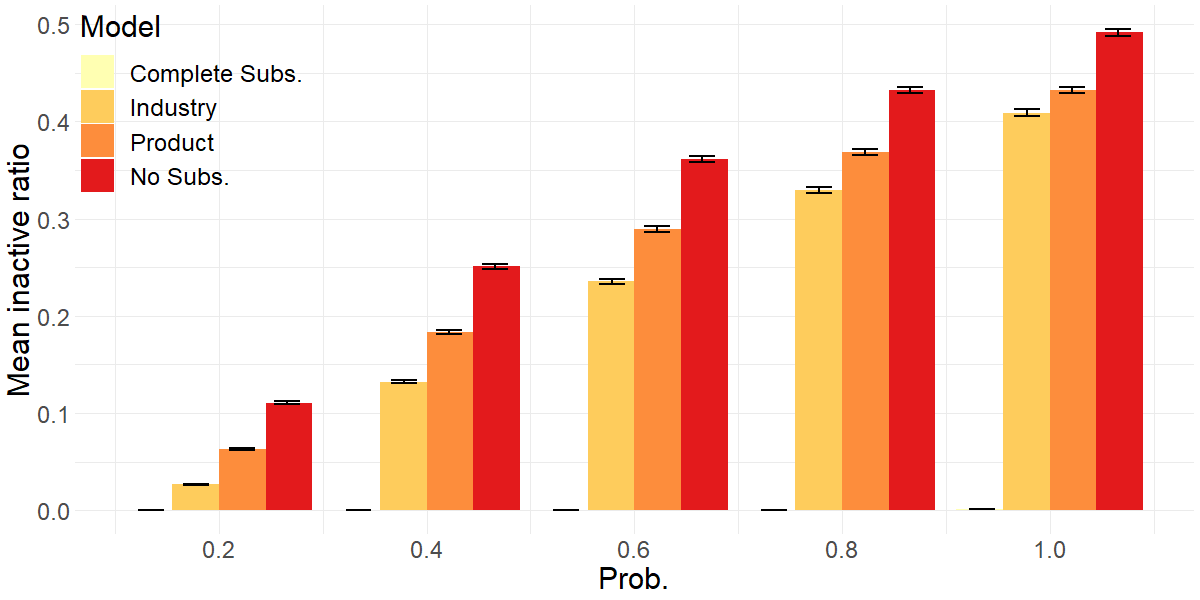
Next, we explain the second analysis. In the second analysis, we focus solely on the network structure at the establishment level and conduct the following four simulations that vary only the settings for the products handled by the establishments in the model; (1) The simulation with the products serves as the benchmark, where establishments are assigned one or more of the 2,396 product types as reported in the primary data. (2) The simulation with the industry uses the same approach as in the first analysis, where each establishment is classified into a single industry, which is treated as a product in the model. Therefore, there is no multiple product for this simulation. (3) The simulation with a unique product assumes that each establishment has a unique product. In this simulation, no shock mitigation occurs due to the mechanism of substitutability in the model, and the shock always propagates from suppliers to clients at the basic propagation probability . (4) Finally, the simulation with a product assumes that all establishments share the exact same product, although this is far from the reality. In this case, the shock mitigation within the model always occurs by a factor equal to the inverse of the in-degree.
The results, in order of the magnitude of propagation, are as follows: Unique product, Actual product, Industry, and Same product (Figure 4). The results of the second analysis are consistent with those of the first. Specifically, they demonstrate that more detailed classifications lead to increased shock propagation and that substitutability plays a substantial role. The differences between all pairs are also statistically significant according to the -test. However, additional insights are gained. While it is consistent with the first analysis that using 2,396 product types results in greater propagation than using 595 industry classifications, it is important to note that in the simulation with the products, establishments can possess multiple products. Compared to the simulation with the industrial classifications, where only one classification is assigned, the fact that establishments can have multiple products simply enhances substitutability. However, it is inferred that the effect of reduced substitutability due to finer product classifications outweighs the benefit of having multiple products. It is crucial to recognize that the approach of this paper—using establishments instead of firms, using products instead of industries, and allowing for multiple products—brings us closer to the reality of supply chain activities.
When perfect substitution is possible, almost no propagation occurs. This result can also be inferred from the network structure. In a network with a power-law degree distribution, the presence of hubs means that most nodes are attached to these hubs. Therefore, in just a few steps, the propagation will reach a hub. In other words, the hubs should be passed through to have large scale propagations. Considering the propagation process into the hubs, since hubs have a high degree, the substitutability mechanism in the model almost certainly prevents propagation. As a result, the overall propagation is negligible, with an almost zero proportion of nodes affected. This result is certainly driven by the structure with the hubs. For example, if the supply chain were a straight line, propagation would occur with probability . The observed resilience due to substitutability suggests the upper bound which can be realized by the substitution.
On the other hand, the extreme case of having no substitutability at all is also important, as it provides the lower bound of resilience. While this paper attempts a more realistic analysis by incorporating information on establishments and products, it is important to recognize that even with products, there are likely finer distinctions in reality. If accurate information on truly substitutable products were available, the results would likely fall somewhere between the simulation with the products and one with the unique products. However, it is also evident that the difference between these simulations is not as substantial as one might expect.
4.3 Comparison between regional shocks
In the final simulation setup, instead of uniformly selecting one node to be shocked at from all nodes, we restricted the selection by region. The purpose of this was not only to investigate whether there are regional differences in how shocks propagate—given that firms and establishments have already been shown to have different geographic distributions (Figure 2)–—but also to explore the potential regional impact on propagation. It is important to note that the geographic distribution itself does not influence the magnitude of shock propagation. This is because, firstly, only one node is initially selected in the simulation, and secondly, the geographic distribution of nodes is fundamentally unrelated to the network’s structure.
While various configurations are possible, given that this study focuses on Japan, the most straightforward division is between Tokyo, as the sole major metropolis, and the rest of the country. Therefore, we analyze the differences between these regions. Additionally, we compare the firm-level network and the establishment-level network in scenarios where the shock originates in Tokyo versus outside Tokyo. In all cases—–whether firms or establishments—–multiple products are assumed. Specifically, establishments are allowed to have multiple products as is used in the second analysis, and firms are assigned the products of the establishments they encompass, creating equivalent conditions. The use of actual products instead of industry proxies is intended to create a more realistic analysis. The reason industries were used in the first analysis is to understand the pure effect of introducing establishments, considering that industries have traditionally been used at the firm level.
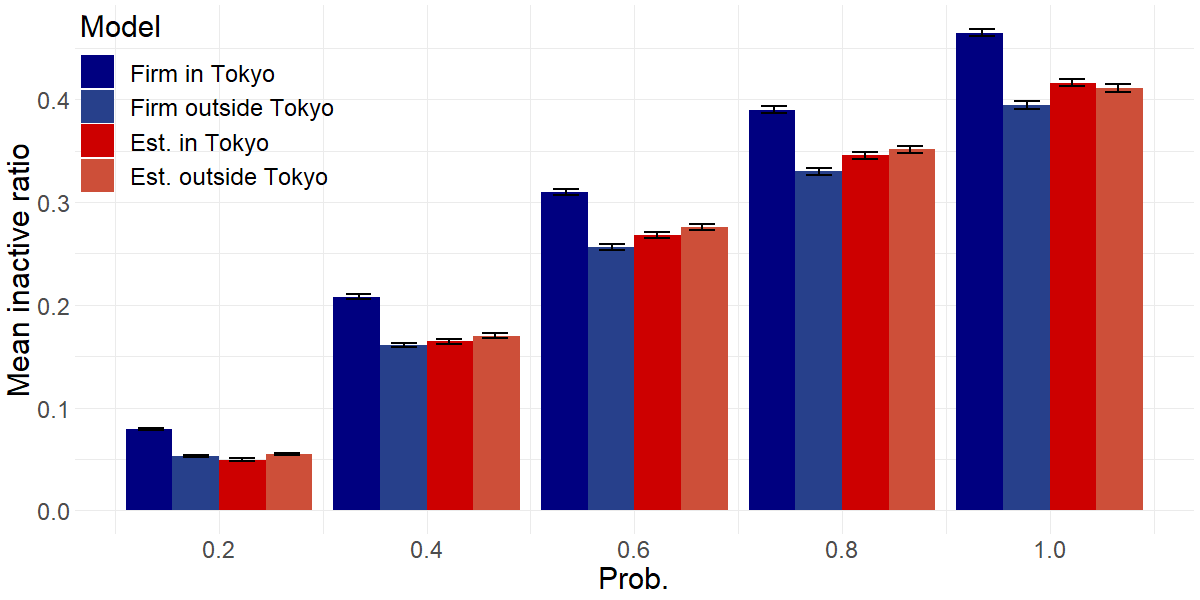
The results of this third analysis show difference between the firm- and establishment-level networks (Figure 5). The firm-level network shows significantly greater shock propagation when the shock originates in Tokyo compared to when it originates elsewhere (This difference was statistically significant according to a -test). However, in the establishment-level network, no such difference is observed (The -test showed no significant difference). This suggests that using a firm-level network might lead to incorrect conclusions, especially when the establishment-level network, which is closer to reality, shows no such regional bias. Specifically, a firm-level network might incorrectly suggest that companies in Tokyo should be more heavily protected, but this is a misleading conclusion, as indicated by the establishment-level network results.
We now examine why this difference arises. Several factors likely contribute to this, one of which may be that companies headquartered in Tokyo tend to have more establishment hubs than companies located outside Tokyo. Indeed, when examining the data, the average out-degree at the firm level (where multiple establishments are grouped) is 7.24 for Tokyo and 3.66 for other regions. In contrast, the average out-degree per establishment is 5.61 for Tokyo and 7.79 for other regions. We focus on out-degree because, in terms of shock diffusion, it is the out-degree, not the in-degree, that is relevant. Note that the degree distribution is highly skewed and average cannot grasp the hub information directly. This suggests that the concentration of large corporate headquarters in Tokyo might be one factor. However, this is only one of several factors. Since shock diffusion in a network involves substitutability and the network’s structure, this simple hypothesis alone is not sufficient. This is why simulations are conducted, as they are a core approach of this paper.
5 Conclusion and future works
In this paper, we created the establishment-level networks where an establishment can output multiple products by using the Company Information Database and Company Linkage Database collected by Tokyo Shoko Research that covers almost all Japanese firms and their supplier–client relationships in 2020 and use Economic Census for Business Activity conducted by Ministry of Economy, Trade, and Industry that covers all establishments in Japan. We inferred the inter-establishment linkages and obtain a manufacturing production network that covers 183,951 establishments in 157,537 firms and 919,982 inter-establishment linkages. We apply a probabilistic model for supply chain disruptions to the different networks and assess their responses. The configurations include: (1) a firm-level network and an establishment-level network with industrial classifications; (2) establishment-level networks with different substitutability; (3) firm-level and establishment networks with regional shocks.
Our findings are as follows: (1) The establishment-level network shows a higher propagation of shocks than the firm-level network. There are 157,537 firms in the firm-level network and those links between firms in the network remain unchanged. A firm can be separated into multiple establishments and there are 183,951 establishments in the establishment-level network. (2) The different substitutability examinations show that the infusion of the actual products information shows a large impact of propagation than the industry information. This result is consistent with those of the first: more detailed classifications lead to increased shock propagation and that substitutability plays a substantial role. (3) The simulation for the regional shocks show that the firm-level network shows significantly greater shock propagation when the shock originates in Tokyo compared to when it originates elsewhere. However, in the establishment-level network, no such difference is observed.
The results consistently indicate that a granular network shows a greater propagation of the shock, i.e., the establishment-level than the firm-level and the product classification than the industrial classification. In addition, although the multiple product outputs mitigate the propagation due to high substitutability, the impact was not significant enough to negate the effect of switching from the industrial level to the product level. All of results indicate that realistic information in the sense of granularity shows greate impact of propagation.
The results consistently indicate that a more granular network exhibits greater shock propagation, with the establishment-level showing more propagation than the firm-level, and product classification showing more than industrial classification. Additionally, while having multiple product outputs mitigates propagation due to higher substitutability, the impact was not sufficient enough to negate the effect of switching from the industrial level to the product level. Overall, the findings suggest that more granular, realistic information increases the impact of shock propagation.
As highlighted by the extreme case where all establishments produce the same product, hubs may have the potential to ensure greater substitutability, thereby greatly contributing to overall resilience. Specifically, if the inputs to these hubs are highly substitutable, shock propagation can be effectively mitigated.
In future work, we can expand the network. In this paper, we focused on firms and establishments in the manufacturing sector, using only 157,537 out of 1,520,605 firms and 183,951 out of 5,156,063 establishments. However, since other sectors also have output information, the methods described in this paper can be applied to them, potentially expanding the available data. The wholesale sector may pose a challenge, as wholesalers do not process products but simply distribute them to other sectors. Nonetheless, once we establish a set of recipes for all other sectors, it will be possible to connect the necessary suppliers and clients through the wholesale sector. These expansions will be explored in our future work.
Another potential avenue is to explore other networks generated by different algorithms. As mentioned earlier, the algorithm used in this study to infer links between establishments yields the minimal connections. However, additional factors could be considered. For example, empirical evidence suggests that establishments located closer to each other are more likely to be connected [Nakajima et al., 2012]. Other relevant aspects include sales, shared financing banks, or cross-shareholding between firms [Krichene et al., 2019]. Comparing these alternative networks in terms of their estimated propagation risks is an important area for future research.
Furthermore, since many firms operate with only one establishment, this information could be utilized more effectively. For instance, if both a supplier and a client are firms with only one establishment, their relationship can be treated as a decisive recipe, making the filtering process proposed in this study unnecessary, at least for the products involved in that specific relationship.
References
- Acemoglu et al. [2012] D. Acemoglu, V. M. Carvalho, A. Ozdaglar, and A. Tahbaz-Salehi. The network origins of aggregate fluctuations. Econometrica, 80(5):1977–2016, 2012.
- Bak et al. [1993] P. Bak, K. Chen, J. Scheinkman, and M. Woodford. Aggregate fluctuations from independent sectoral shocks: self-organized criticality in a model of production and inventory dynamics. Ricerche economiche, 47(1):3–30, 1993.
- Barabási [2016] A.-L. Barabási. Network science. Cambridge University Press, 2016.
- Barrot and Sauvagnat [2016] J.-N. Barrot and J. Sauvagnat. Input specificity and the propagation of idiosyncratic shocks in production networks. The Quarterly Journal of Economics, 131(3):1543–1592, 2016. ISSN 0033-5533.
- Battiston et al. [2012] S. Battiston, M. Puliga, R. Kaushik, P. Tasca, and G. Caldarelli. Debtrank: Too central to fail? financial networks, the fed and systemic risk. Scientific reports, 2(1):1–6, 2012.
- Carvalho et al. [2016] V. M. Carvalho, M. Nirei, Y. U. Saito, and A. Tahbaz-Salehi. Supply chain disruptions: Evidence from the great east japan earthquake. Technical Report No. 17-5, Columbia Business School Research Paper, 2016.
- Diem et al. [2022] C. Diem, A. Borsos, T. Reisch, J. Kertész, and S. Thurner. Quantifying firm-level economic systemic risk from nation-wide supply networks. Scientific reports, 12(1):7719, 2022.
- Diem et al. [2024] C. Diem, A. Borsos, T. Reisch, J. Kertész, and S. Thurner. Estimating the loss of economic predictability from aggregating firm-level production networks. PNAS nexus, 3(3):pgae064, 2024.
- Fujiwara et al. [2016] Y. Fujiwara, M. Terai, Y. Fujita, and W. Souma. Debtrank analysis of financial distress propagation on a production network in japan. 2016.
- Gatti et al. [2005] D. D. Gatti, C. Di Guilmi, E. Gaffeo, G. Giulioni, M. Gallegati, and A. Palestrini. A new approach to business fluctuations: heterogeneous interacting agents, scaling laws and financial fragility. Journal of Economic behavior & organization, 56(4):489–512, 2005.
- Haimes and Jiang [2001] Y. Y. Haimes and P. Jiang. Leontief-based model of risk in complex interconnected infrastructures. Journal of Infrastructure systems, 7(1):1–12, 2001.
- Inoue and Todo [2019a] H. Inoue and Y. Todo. Firm-level propagation of shocks through supply-chain networks. Nature Sustainability, 2(9):841–847, Sept. 2019a. ISSN 2398-9629. doi: 10.1038/s41893-019-0351-x. URL https://www.nature.com/articles/s41893-019-0351-x. Number: 9 Publisher: Nature Publishing Group.
- Inoue and Todo [2019b] H. Inoue and Y. Todo. Propagation of negative shocks across nation-wide firm networks. PLOS ONE, 14(3):e0213648, Mar. 2019b. ISSN 1932-6203. doi: 10.1371/journal.pone.0213648. URL https://journals.plos.org/plosone/article?id=10.1371/journal.pone.0213648.
- Krichene et al. [2019] H. Krichene, Y. Fujiwara, A. Chakraborty, Y. Arata, H. Inoue, and M. Terai. The emergence of properties of the Japanese production network: How do listed firms choose their partners? Social Networks, 59:1–9, Oct. 2019. ISSN 0378-8733. doi: 10.1016/j.socnet.2019.05.002. URL https://www.sciencedirect.com/science/article/pii/S0378873318303009.
- Ministry of Internal Affairs and Communications, Japan [2013] Ministry of Internal Affairs and Communications, Japan. Japan Standard Industrial Classification (Rev. 13, October 2013). https://www.soumu.go.jp/english/dgpp_ss/seido/sangyo/index13.htm, 2013. Accessed: 08.16.2024.
- Nakajima et al. [2012] K. Nakajima, Y. U. Saito, and I. Uesugi. Measuring economic localization: Evidence from japanese firm-level data. Journal of the Japanese and International Economies, 26(2):201–220, 2012.
- Okuyama et al. [2004] Y. Okuyama, G. J. Hewings, and M. Sonis. Measuring economic impacts of disasters: interregional input-output analysis using sequential interindustry model. In Modeling spatial and economic impacts of disasters, pages 77–101. Springer, 2004.
- Pelling et al. [2002] M. Pelling, A. Özerdem, and S. Barakat. The macro-economic impact of disasters. Progress in Development Studies, 2(4):283–305, 2002.
- Pichler et al. [2023] A. Pichler, C. Diem, A. Brintrup, F. Lafond, G. Magerman, G. Buiten, T. Y. Choi, V. M. Carvalho, J. D. Farmer, and S. Thurner. Building an alliance to map global supply networks. Science, 382(6668):270–272, Oct. 2023. doi: 10.1126/science.adi7521. URL https://www.science.org/doi/full/10.1126/science.adi7521. Publisher: American Association for the Advancement of Science.
- Poledna et al. [2018] S. Poledna, S. Hochrainer-Stigler, M. G. Miess, P. Klimek, S. Schmelzer, J. Sorger, E. Shchekinova, E. Rovenskaya, J. Linnerooth-Bayer, U. Dieckmann, et al. When does a disaster become a systemic event? estimating indirect economic losses from natural disasters. arXiv preprint arXiv:1801.09740, 2018.
- Statistics Bureau of Japan [2021] Statistics Bureau of Japan. Economic Census for Business Activity. https://www.stat.go.jp/english/data/e-census/2021/index.html, 2021. Accessed: 08.02.2024.
- Tierney [1997] K. J. Tierney. Business impacts of the northridge earthquake. Journal of Contingencies and crisis management, 5(2):87–97, 1997.
- Zhao et al. [2019] K. Zhao, Z. Zuo, and J. V. Blackhurst. Modelling supply chain adaptation for disruptions: An empirically grounded complex adaptive systems approach. Journal of operations Management, 65(2):190–212, 2019.
Appendix A Degree distribution of completely connected establishment network