Origin of TeV Emission in GRB 221009A:
Co-effort of the External Reverse and Forward Shocks
Abstract
The TeV emission detected in just five gamma-ray bursts (GRBs) is generally ascribed to the synchrotron emission or the synchrotron self-Compton process in the external forward shock. The brightest gamma-ray burst, GRB 221009A, with an unprecedented detected high energy flux of TeV emission, poses a serious challenge to the above scenario. Different from previous works, we involve the long bursting behavior of GRB 221009A in modeling its external-shocks. The TeV emission together with the later multi-band afterglows of GRB 221009A are all successfully reproduced. It is firstly found that the TeV emission in the early phase is mainly from the co-effort of the external reverse and forward shocks, i.e., the inverse-Compton scattering of the synchrotron emission from the external reverse-shock by the electrons in the external forward-shock. This is owing to that the long bursting behavior leads to a long lasting of energy injection into the external shock and the corresponding reverse-shock. In the later phase, the TeV emission is dominated by the synchrotron self-Compton process in the external forward-shock, which is consistent with previous scenario. Our results indicate the vital role of the external reverse-shock in shaping the early TeV emission of GRBs.
I Introduction
Gamma-ray bursts (GRBs), featured with powerful bursts of -rays followed by a long-lived afterglow emission, are the most luminous electromagnetic explosions in the Universe. They are typically associated with relativistic jets launched during the collapse of a massive star or the merger of compact star binaries, surrounded by a stellar wind or homogeneous medium, respectively [1]. The internal dissipation process or the photosphere of the relativistic jets are thought to release the prompt -rays; and the external shocks, formed during the propagation of the jets in the circum-burst medium, are responsible for the long-lived afterglows [2, 3, 4, 5]. Observationally and theoretically, the prompt emission and afterglows have been intensively studied. Very recently, B.O.A.T. (“brightest of all time”) GRB 221009A poses a serial of debates about its prompt emission and the afterglow, and a great many efforts have been made [6, 7, 8, 9, 10, 11, 12, 13]. Until now, a self-consistent scenario to model its TeV emission and the later multi-band afterglows is not presented.
GRB 221009A is one of five bursts detected with very-high-energy (VHE, 100 GeV) -rays [14, 15, 16, 17] and an unprecedentedly amount of VHE photons (64000 photons) were detected by the Large High Altitude Air Shower Observatory (LHAASO) from this burst at the early phase [18]. The burst is first detected by the Gamma-ray Burst Monitor (GBM) aboard Fermi satellite at 13:16:59.99 UTC on 9 October 2022 (hereafter ) [6]. The GBM records a continuous prompt emission lasting more than 600 s and the succeeded smooth afterglow emission up to +1464 s, in spite of -ray pile-up in some phases. The prompt emission consists of two emission episodes: a single isolated pulse from to + 20 s, i.e., the precursor; followed by a long, extremely bright, multi-pulse emission episode from about to + 600 s, i.e., the main burst. The long bursting behavior of GRB 2210009A reveals a long activity of both the central engine and the launched relativistic jets. The LHAASO detected more than 5000 VHE photons above 500 GeV within 2000 s since the GBM trigger and the highest photon energy reaches [19]. The TeV light-curve presents a sharp rise at + 230 s, turns into a relatively slow rise until the peak at + 245 s, and then changes into a decay phase. The smooth temporal profile of TeV light-curve contracts with the high variability of the prompt -rays, indicating a rather weak relation between their dissipation regions [6, 20]. Thanks to the extremely high brightness of GRB 221009A, a wealth of afterglow data from radio to GeV bands were also collected through multi-band observations [21, 22, 23, 24]. The full record of the TeV emission in the early phase and the rich of multi-band later afterglows provide a unique opportunity to decipher the nature of VHE emission in GRBs.
A general model for the origins of VHE -rays is the leptonic scenario, which is attributed to the synchrotron emission or synchrotron self-Compton process of energetic electrons accelerated by the external forward-shock [25, 26, 27]. To interpret both the TeV emission and the followed multi-band afterglows of GRB 221009A in such kind of scenario, two special ingredients are generally used: a structured jet with a narrow core component (half-opening angle ) and a stratified circum-burst environment with inner homogeneous medium surrounded by a stellar wind [18, 12, 28]. Such kind of special jet structure and the circum-burst environment are very unusual, e.g., the characteristic half-opening angle of the jet inferred based on the observed jet break time in afterglow is [29]. In fact, the narrow jet core and the inner homogeneous medium were proposed to interpret the light-curve morphology of early TeV emission. We note that the main burst of GRB 221009A overlaps on the early TeV emission, implying a continuous energy injection into the external shock in situ or subsequently. Correspondingly, a long-lasting external reverse-shock appears and accelerates the electrons therein. The continuous energy injection and the arose external reverse-shock should modify the emission of the external shock. In this letter, we model the TeV emission together with the later multi-band afterglows by involving the fact that a long-lasting energy injection into the external shock appears in GRB 221009A owing to its long bursting behavior.
II Methods
II.1 Reproduction of the jet power history
The central engine of GRB 221009A continuously drives relativistic collimated jets. The propagation of the early launched jet in the stellar wind results to the formation of the external shocks. The later launched jets catch up with the formed external shock and thus inject energy into the external shock through the reverse-shock. The history of the central engine and its launched jets are crucial. In our model, the power of the jet driven from the central engine is prescribed based on Fermi-GBM observations, i.e., , where is the isotropic luminosity of the prompt emission in 1 keV-10 MeV energy range and is the radiation efficiency of the corresponding jet. Thus, the residual energy in the jet is .
is estimated as follows. We obtain daily data covering the time range of GRB 221009A from the Fermi-GBM public data archive. Based on the position history file, we select two sodium iodide detectors (n4 n8) and one bismuth germanium oxide detector (b1) with optimal viewing angle for spectral analysis. Since the continuous spectroscopy response matrices provided by the Fermi GBM Trigger Catalog only covers before Fermi triggered and after Fermi triggered, we use the GBM Response Generato () to produce the response files for n4, n8, and b1 detectors during [, ], where the source location of (RA, Dec)= (, ) is used. The GBM Data Tools is used to extract the light-curve based on the Time Tagged Event (TTE) data. We use a polynomial algorithm to fit background with order of 3, and the observations in the periods of , and are selected as the background. The time-resolved radiation spectrum per is fitted with a Band function to obtain the 1keV-10MeV energy flux and thus is obtained, where is the luminosity distance of GRB 221009A and is the correcting factor of the energy flux described as follows.
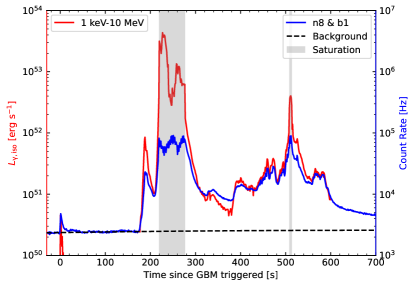
During the Bad Time Intervals (BTI) of Fermi-GBM for GRB 221009A, i.e., [219, 277]s and [508, 514]s, the obtained energy flux may not really reflect the energy flux. Then, we introduce a correcting factor . Besides the BTI of Fermi-GBM, is set. Within the BTI of Fermi-GBM, the value of is set as follows. During the BTI of Fermi-GBM, the Gravitational-wave high-energy Electromagnetic Counterpart All-sky Monitor (GECAM) is free of -ray pile-up. With GECAM, Ref. [30] has reported the energy flux in four time intervals of 231-240 s, 240-248 s, 248-326 s, and 326-650 s, i.e., , , , and , respectively. Then, we also estimate the energy flux in these four time intervals based on spectral analysis method and the observations of Fermi-GBM. The results are , , , and , respectively. Then, , , , and are set for the time intervals of 219-240 s, 240-248 s, 248-277 s, and 508s-514 s, respectively. The obtained based on Fermi-GBM observations is shown in Fig.1, and the spectral analysis resuts are reported in Table 1. To simplify, the radiation efficiency of the jet is assumed to be the same during each time interval of 214-224 s, 224-252 s, 253-326 s, 326-450 s, and 326-600 s, respectively. The bulk Lorentz factor of the jets in these time intervals is set as the same with the same half-opening angle .
| Time bin[s] | ||||
|---|---|---|---|---|
| 180-210 | ||||
| 210-218 | ||||
| 218-231 111There is no spectral analysis in this period from Ref. [30]. The radiation spectrum of this period is taken as the same as that of 231-240 s but involving the correction on the flux. | ||||
| 231-240 222The radiation spectra during the BTI of Fermi-GBM is taken from Ref. [30]. | ||||
| 240-248 222The radiation spectra during the BTI of Fermi-GBM is taken from Ref. [30]. | ||||
| 248-326 222The radiation spectra during the BTI of Fermi-GBM is taken from Ref. [30]. | ||||
| 326-375 | ||||
| 375-430 | ||||
| 430-480 | ||||
| 480-550 | ||||
| 550-600 |
II.2 Model of the external shock
The circum-burst environment of GRB 221009A is the blew-off stellar wind from the massive star [9, 22, 31]. The particle density of wind at different radii is given by with the wind parameter , where is the mass-loss rate of the massive star and is the wind velocity. According to Fig. 1, the central engine of GRB 221009A is active during 0-20 s (precursor), dies out in 20-180 s, and revives in 180-650 s (the main burst). The precursor of the central engine is very weak, compared with the first pulse (180-210 s) of the main burst. In addition, the afterglows after 230 s, e.g., the TeV emission and the later multi-band afterglows, are the main focus of this paper. Then, we take the jet produced the first pulse as the initial fireball that drives the external shocks. The isotropic kinetic energy of the initial fireball is taken as erg, corresponding to a typical -rays production efficiency of , and we also adopt the typical value for its bulk Lorentz factor, i.e., . The adopted parameters of the initial fireball do not affect our modelling on the TeV emission and the later multi-band afterglows since there is strong energy injection into the external shock subsequently. In addition, the very early afterglows based on our initial fireball are also consistent with the observed flux limits.
The initial fireball is decelerated during its propagation in the stellar wind. Observationally, GRB 221009A enters a strong bursting after the first pulse of the main burst. There is a rapid rise of the isotropic luminosity from and the Fermi-GBM detectors are -ray pile-up after a short time (9 s). The strong bursting behavior in this phase leads to an enormous energy injection into the external shock in situ or subsequently, which is consistent with the rapid rise of the TeV onset at around 230 s. In our modeling, the later launched jets, responsible for the pulses in the period of 210-600 s, would catch up and collide with the decelerated initial fireball at certain times. We take the minimum time for the later launched jets to collide with the decelerated initial fireball as . Since the values of and can not be well inferred, the value of is taken as a free parameter in our fitting.
During the development of the forward/reverse shock, the electrons are accelerated and the magnetic fields are amplified in the shock. The fractions of the shock internal energy used to accelerate non-thermal electrons and amplify the magnetic fields are generally set as () and (), respectively. Here, the subscript “…,fs” and “…,rs” represent the parameters in the forward and reverse shocks, respectively. The energy spectrum of the accelerated electrons is generally assumed as a power-law distribution, i.e., or , where is the electron’s Lorentz factor, () is the minimum Lorentz factor of the accelerated electrons, and () is the power-law index. The values of () and () are obtained by solving the equations about the total energy and total number of the non-thermal electrons [32, 33]. Since the electrons swept by the shocks are not all accelerated [34, 35], we take the fraction of electrons accelerated to the non-thermal distribution in the total electrons as or . In the forward shock, the minimum and maximum Lorentz factor of the accelerated electrons [5, 36] are respectively and , where the magnetic field is with the mass density , is the distance of the forward shock with respect to the central engine, is the bulk Lorentz factor of the post-shock medium, and , , , and are the electron mass, proton mass, electron charge, and light speed, respectively. For the reverse shock, the shock Lorentz factor is with and . Analogy to the forward shock, one can infer the post-shock magnetic field and non-thermal electrons for the reverse shock based on the same equation but replacing the subscript “…fs” with “…rs”, where . When the energy injection ceases, the evolution of the magnetic fields in the post-reverse shock region is assumed to be regulated by the energy conservation. The complete dynamics of the external shocks involving the energy injection through the reverse shock is estimated based on [37].
The non-thermal electrons suffer from the cooling due to the synchrotron emission and the inverse-Compton process [38, 39]. The inverse-Compton process of the electrons upscatters the seed photons to the VHE photons, where the synchrotron emission of the electrons in both the forward and reverse shocks and the soft photons of the prompt emission serve as the seed photons. The radiation spectra of the prompt emission listed in Table 1 are used to calculate the soft photons during the prompt emission phase. In our calculations, the synchrotron self-absorption, the Klein-Nishina effect on the inverse-Compton process, and the absorption of VHE photons due to the two-photon pair production are all considered [40, 41, 42].
III Result
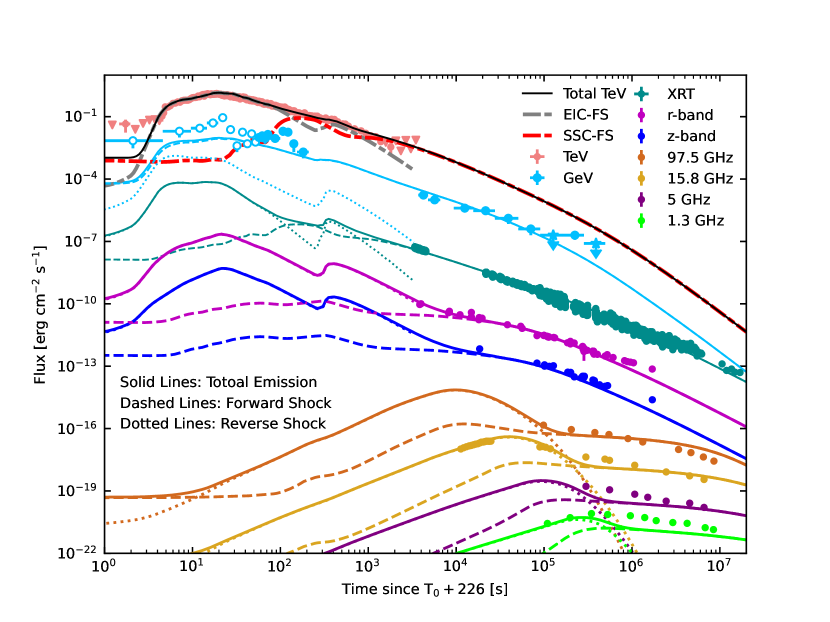
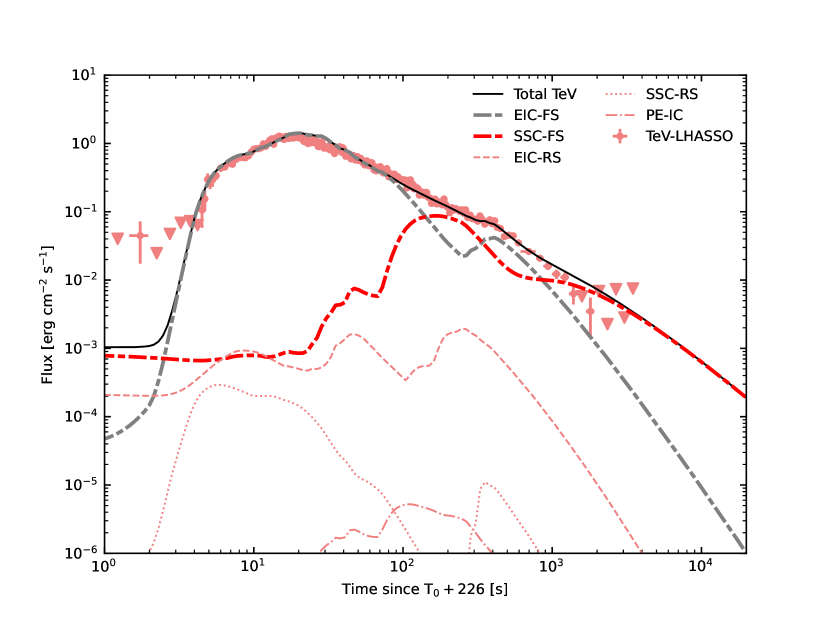
Fig. 2 shows our modeling on the TeV emission together with the contemporaneous GeV emission and the later X-ray-optical-radio afterglows, where the solid lines are the results from our model and the parameters of our model are reported in Table 2. Here, the intrinsic TeV flux data corrected for the EBL attenuation is taken from LHAASO [18], the GeV data is from Fermi-LAT [20] (and the corrected GeV data during BIT is showed with an empty circle), the X-ray data comes from the Swift-XRT, the optical data [24] is corrected for the Galactic and host galaxy extinction [43, 44], and the radio data is collected from [22, 23]. One can find that the total emission (solid lines) from both the external forward and reverse shocks well fits the multi-band afterglows. Importantly, the light-curve morphology of TeV emission, including the first sharp rise, the followed slow rise to the peak, and the slow decay, is well-reproduced based on a normal jet (opening angle ) propagating in a stellar wind (). Please see Fig. 3 for the zoom-in on the TeV light-curve modeling. The light-curve break of TeV emission at around 730 s is formed owing to the end of the energy injection into the external shock in this phase. Importantly, there are two main contributors for the TeV emission, i.e., the inverse-Compton of the synchrotron emission from the reverse shock (EIC-FS) and that from the forward shock (SSC-FS) by the electrons in the forward shock. These two contributors dominate the TeV emission by turn, with EIC-FS dominating the very early TeV emission (230-1000 s) and SSC-FS dominating the later TeV emission (1000 s). This is the first burst that the external reverse shock acts vital role in shaping the TeV emission.

The spectra in the TeV energy range for different phases are also presented in Fig. 4. As indicated in Fig. 4, the contribution from the PE-IC process is negligible for the TeV emission. During the rising to the peak of TeV emission, e.g., 231-240 s and 240-248 s, it is found that the TeV spectra is softer than the SSC spectrum [18]. This can also be found by comparing the TeV spectrum in this phase with the red dashed-dot-dotted lines in Fig. 4. In our model, the TeV emission in this phase is dominated by the EIC-FS. This is owing to the strong energy injection and thus an abundant of soft photons released in the reverse shock in this phase. In the decay phase of TeV emission, however, the energy injection becomes weak and thus the soft photons from the reverse shock is lessen. Corresponding, the SSC-FS becomes dominant, which is consistent with the TeV spectra in this phase, e.g., 326-2000 s. The spectral evolution that appears across the entire TeV afterglow can be well reproduced under the co-effort of the external reverse and forward shocks.
IV Conclusion
Compared with the external forward shock, the external reverse shock is generally found to dominate the emission in the low-energy regime (e.g., optical band) during the early phase of GRBs’ afterglow. Then, the reverse shock would play a vital role in shaping the early TeV emission produced by the inverse-Compton process. GRB 221009A is the first burst that witnesses the co-effort of the external reverse and forward shocks on the formation of the very-high-energy -rays in GRBs. It is showed that the inverse-Compton of the synchrotron emission from the reverse shock by the electrons in the forward shock is responsible for the early TeV afterglow. The synchrotron self-Compton process in the forward shock is responsible for the later TeV afterglow, consistent with the previous studies. In the future, the TeV data as an indicator for the afterglow onset and the other multi-band data during the same phase may be utilized to study the particle acceleration in the forward/reverse shock, the jet properties, and the circum-burst environment.
| Physical parameters | Symbols | Values | |
|---|---|---|---|
| Forward shock | Electron spectral index | ||
| Electron energy fraction | |||
| Non-thermal electron fraction | |||
| Magnetic energy fraction | |||
| Reverse shock | Electron spectral index | ||
| Electron energy fraction | |||
| Non-thermal electron fraction | |||
| Magnetic energy fraction | |||
| Later launched jets | Radiation efficiency111The later launched jets are responsible for the prompt emission during 210-600 s. This period is divided into 5 time bins, i.e., 210-224 s, 224-252 s, 253-326 s, 326-450 s, and 450-600 s. The radiation efficiency is estimated in each time bin and the luminosity of the prompt emission is estimated in - energy range. | ||
| Lorentz factor | |||
| Jet half-opening angle | |||
| Minimum injection time | |||
| Environment | Stellar wind | ||
| Initial fireball222For the adopted value of the initial fireball parameters, see Section II.2 for details. | Isotropic kinetic energy | ||
| Initial bulk Lorentz factor | 200 |
Acknowledgements.
We acknowledge the use of the Fermi and Swift archive’s public data. We thank Jia Ren and Shan-Shan Weng for helpful discussion and Xing Yang for helpful in computing performance. This work is supported by the National Natural Science Foundation of China (grant Nos. 12273005 and 12133003) and the National Key R&D Program of China (grant No. 2023YFE0117200).References
- Kumar and Zhang [2015] P. Kumar and B. Zhang, The physics of gamma-ray bursts & relativistic jets, Physics Reports 561, 1 (2015), arXiv:1410.0679 [astro-ph.HE] .
- Rees and Meszaros [1994] M. J. Rees and P. Meszaros, Unsteady Outflow Models for Cosmological Gamma-Ray Bursts, Astrophys. J. Lett. 430, L93 (1994), arXiv:astro-ph/9404038 [astro-ph] .
- Kobayashi et al. [1997] S. Kobayashi, T. Piran, and R. Sari, Can Internal Shocks Produce the Variability in Gamma-Ray Bursts?, Astrophys. J. 490, 92 (1997), arXiv:astro-ph/9705013 [astro-ph] .
- Mészáros and Rees [1997] P. Mészáros and M. J. Rees, Optical and Long-Wavelength Afterglow from Gamma-Ray Bursts, Astrophys. J. 476, 232 (1997), arXiv:astro-ph/9606043 [astro-ph] .
- Sari et al. [1998] R. Sari, T. Piran, and R. Narayan, Spectra and Light Curves of Gamma-Ray Burst Afterglows, Astrophys. J. Lett. 497, L17 (1998), arXiv:astro-ph/9712005 [astro-ph] .
- Lesage et al. [2023] S. Lesage, P. Veres, M. S. Briggs, A. Goldstein, D. Kocevski, E. Burns, C. A. Wilson-Hodge, P. N. Bhat, and D. Huppenkothen, Fermi-GBM Discovery of GRB 221009A: An Extraordinarily Bright GRB from Onset to Afterglow, Astrophys. J. Lett. 952, L42 (2023), arXiv:2303.14172 [astro-ph.HE] .
- Frederiks et al. [2023] D. Frederiks, D. Svinkin, A. L. Lysenko, S. Molkov, A. Tsvetkova, M. Ulanov, A. Ridnaia, A. A. Lutovinov, I. Lapshov, A. Tkachenko, and V. Levin, Properties of the Extremely Energetic GRB 221009A from Konus-WIND and SRG/ART-XC Observations, Astrophys. J. Lett. 949, L7 (2023), arXiv:2302.13383 [astro-ph.HE] .
- Burns et al. [2023] E. Burns, D. Svinkin, E. Fenimore, D. A. Kann, J. F. Agüí Fernández, D. Frederiks, and R. Hamburg, GRB 221009A: The Boat, Astrophys. J. Lett. 946, L31 (2023), arXiv:2302.14037 [astro-ph.HE] .
- O’Connor et al. [2023] B. O’Connor, E. Troja, G. Ryan, P. Beniamini, H. van Eerten, J. Granot, S. Dichiara, and R. Ricci, A structured jet explains the extreme GRB 221009A, Science Advances 9, eadi1405 (2023), arXiv:2302.07906 [astro-ph.HE] .
- Yang et al. [2023] J. Yang, X.-H. Zhao, Z. Yan, X. I. Wang, Y.-Q. Zhang, Z.-H. An, C. Cai, and X.-Q. Li, Synchrotron Radiation Dominates the Extremely Bright GRB 221009A, Astrophys. J. Lett. 947, L11 (2023), arXiv:2303.00898 [astro-ph.HE] .
- Zhang et al. [2023] B. T. Zhang, K. Murase, K. Ioka, D. Song, C. Yuan, and P. Mészáros, External Inverse-compton and Proton Synchrotron Emission from the Reverse Shock as the Origin of VHE Gamma Rays from the Hyper-bright GRB 221009A, Astrophys. J. Lett. 947, L14 (2023), arXiv:2211.05754 [astro-ph.HE] .
- Ren et al. [2024] J. Ren, Y. Wang, and Z.-G. Dai, Jet Structure and Burst Environment of GRB 221009A, Astrophys. J. 962, 115 (2024), arXiv:2310.15886 [astro-ph.HE] .
- Banerjee et al. [2024] B. Banerjee, S. Macera, A. Ludovico De Santis, A. Mei, J. Tissino, and G. Oganesyan, Camelidae on BOAT: observation of a second spectral component in GRB 221009A, arXiv e-prints , arXiv:2405.15855 (2024), arXiv:2405.15855 [astro-ph.HE] .
- Abdalla et al. [2019] H. Abdalla, R. Adam, F. Aharonian, F. Ait Benkhali, E. O. Angüner, M. Arakawa, and C. Arcaro, A very-high-energy component deep in the -ray burst afterglow, Nature (London) 575, 464 (2019), arXiv:1911.08961 [astro-ph.HE] .
- H. E. S. S. Collaboration et al. [2021] H. E. S. S. Collaboration, H. Abdalla, F. Aharonian, F. Ait Benkhali, E. O. Angüner, C. Arcaro, C. Armand, T. Armstrong, H. Ashkar, and M. Backes, Revealing x-ray and gamma ray temporal and spectral similarities in the GRB 190829A afterglow, Science 372, 1081 (2021), arXiv:2106.02510 [astro-ph.HE] .
- MAGIC Collaboration et al. [2019] MAGIC Collaboration, V. A. Acciari, S. Ansoldi, L. A. Antonelli, A. A. Engels, D. Baack, A. Babić, B. Banerjee, U. Barres de Almeida, J. A. Barrio, and J. Becerra González, Observation of inverse Compton emission from a long -ray burst, Nature (London) 575, 459 (2019), arXiv:2006.07251 [astro-ph.HE] .
- Abe et al. [2024] H. Abe, S. Abe, V. A. Acciari, I. Agudo, T. Aniello, S. Ansoldi, L. A. Antonelli, A. Arbet Engels, C. Arcaro, and M. Artero, MAGIC detection of GRB 201216C at z = 1.1, Mon. Not. R. Astron. 527, 5856 (2024), arXiv:2310.06473 [astro-ph.HE] .
- LHAASO Collaboration et al. [2023] LHAASO Collaboration, Z. Cao, F. Aharonian, Q. An, A. Axikegu, L. X. Bai, Y. X. Bai, and Y. W. Bao, A tera-electron volt afterglow from a narrow jet in an extremely bright gamma-ray burst., Science 380, 1390 (2023), arXiv:2306.06372 [astro-ph.HE] .
- Cao et al. [2023] Z. Cao, F. Aharonian, Q. An, Axikegu, Y. X. Bai, Y. W. Bao, D. Bastieri, X. J. Bi, Y. J. Bi, and J. T. Cai, Very high-energy gamma-ray emission beyond 10 TeV from GRB 221009A, Science Advances 9, eadj2778 (2023), arXiv:2310.08845 [astro-ph.HE] .
- Axelsson et al. [2024] M. Axelsson, M. Ajello, M. Arimoto, L. Baldini, J. Ballet, and M. G. Baring, GRB 221009A: the B.O.A.T Burst that Shines in Gamma Rays, arXiv e-prints , arXiv:2409.04580 (2024), arXiv:2409.04580 [astro-ph.HE] .
- Tavani et al. [2023] M. Tavani, G. Piano, A. Bulgarelli, L. Foffano, A. Ursi, F. Verrecchia, C. Pittori, C. Casentini, and A. Giuliani, AGILE Gamma-Ray Detection of the Exceptional GRB 221009A, Astrophys. J. Lett. 956, L23 (2023), arXiv:2309.10515 [astro-ph.HE] .
- Laskar et al. [2023] T. Laskar, K. D. Alexander, R. Margutti, T. Eftekhari, R. Chornock, and E. Berger, The Radio to GeV Afterglow of GRB 221009A, Astrophys. J. Lett. 946, L23 (2023), arXiv:2302.04388 [astro-ph.HE] .
- Bright et al. [2023] J. S. Bright, L. Rhodes, W. Farah, R. Fender, A. J. van der Horst, and J. K. Leung, Precise measurements of self-absorbed rising reverse shock emission from gamma-ray burst 221009A, Nature Astronomy 7, 986 (2023), arXiv:2303.13583 [astro-ph.HE] .
- Kann et al. [2023] D. A. Kann, S. Agayeva, V. Aivazyan, S. Alishov, C. M. Andrade, S. Antier, A. Baransky, P. Bendjoya, Z. Benkhaldoun, S. Beradze, and D. Berezin, GRANDMA and HXMT Observations of GRB 221009A: The Standard Luminosity Afterglow of a Hyperluminous Gamma-Ray Burst-In Gedenken an David Alexander Kann, Astrophys. J. Lett. 948, L12 (2023), arXiv:2302.06225 [astro-ph.HE] .
- Sari and Esin [2001] R. Sari and A. A. Esin, On the Synchrotron Self-Compton Emission from Relativistic Shocks and Its Implications for Gamma-Ray Burst Afterglows, Astrophys. J. 548, 787 (2001), arXiv:astro-ph/0005253 [astro-ph] .
- Wang et al. [2001] X. Y. Wang, Z. G. Dai, and T. Lu, The Inverse Compton Emission Spectra in the Very Early Afterglows of Gamma-Ray Bursts, Astrophys. J. 556, 1010 (2001), arXiv:astro-ph/0104128 [astro-ph] .
- Zou et al. [2009] Y.-C. Zou, Y.-Z. Fan, and T. Piran, The possible high-energy emission from GRB 080319B and origins of the GeV emission of GRBs 080514B, 080916C and 081024B, Mon. Not. R. Astron. 396 (2009).
- Zheng et al. [2024] J.-H. Zheng, X.-Y. Wang, R.-Y. Liu, and B. Zhang, A Narrow Uniform Core with a Wide Structured Wing: Modeling the TeV and Multiwavelength Afterglows of GRB 221009A, Astrophys. J. 966, 141 (2024), arXiv:2310.12856 [astro-ph.HE] .
- Frail et al. [2001] D. A. Frail, S. R. Kulkarni, R. Sari, S. G. Djorgovski, J. S. Bloom, T. J. Galama, D. E. Reichart, E. Berger, F. A. Harrison, P. A. Price, S. A. Yost, A. Diercks, R. W. Goodrich, and F. Chaffee, Beaming in Gamma-Ray Bursts: Evidence for a Standard Energy Reservoir, Astrophys. J. Lett. 562, L55 (2001), arXiv:astro-ph/0102282 [astro-ph] .
- Wang et al. [2023] K. Wang, Q.-W. Tang, Y.-Q. Zhang, C. Zheng, S.-L. Xiong, J. Ren, and B. Zhang, Evidence of Hadronic Emission from the brightest-of-all-time GRB 221009A, arXiv e-prints , arXiv:2310.11821 (2023), arXiv:2310.11821 [astro-ph.HE] .
- Blanchard et al. [2024] P. K. Blanchard, V. A. Villar, R. Chornock, T. Laskar, Y. Li, J. Leja, J. Pierel, and E. Berger, JWST detection of a supernova associated with GRB 221009A without an r-process signature, Nature Astronomy 8, 774 (2024), arXiv:2308.14197 [astro-ph.HE] .
- Fan et al. [2008] Y.-Z. Fan, T. Piran, R. Narayan, and D.-M. Wei, High-energy afterglow emission from gamma-ray bursts, Mon. Not. R. Astron. 384, 1483 (2008), arXiv:0704.2063 [astro-ph] .
- Geng et al. [2018] J.-J. Geng, Y.-F. Huang, X.-F. Wu, B. Zhang, and H.-S. Zong, Low-energy Spectra of Gamma-Ray Bursts from Cooling Electrons, Astrophys. J. Suppl 234, 3 (2018), arXiv:1709.05899 [astro-ph.HE] .
- Eichler and Waxman [2005] D. Eichler and E. Waxman, The Efficiency of Electron Acceleration in Collisionless Shocks and Gamma-Ray Burst Energetics, Astrophys. J. 627, 861 (2005), arXiv:astro-ph/0502070 [astro-ph] .
- Spitkovsky [2008] A. Spitkovsky, Particle Acceleration in Relativistic Collisionless Shocks: Fermi Process at Last?, Astrophys. J. Lett. 682, L5 (2008), arXiv:0802.3216 [astro-ph] .
- Kumar et al. [2012] P. Kumar, R. A. Hernández, Ž. Bošnjak, and R. Barniol Duran, Maximum synchrotron frequency for shock-accelerated particles, Mon. Not. R. Astron. 427, L40 (2012), arXiv:1210.6033 [astro-ph.HE] .
- Nava et al. [2013] L. Nava, L. Sironi, G. Ghisellini, A. Celotti, and G. Ghirlanda, Afterglow emission in gamma-ray bursts - I. Pair-enriched ambient medium and radiative blast waves, Mon. Not. R. Astron. 433, 2107 (2013), arXiv:1211.2806 [astro-ph.HE] .
- Jones [1965] F. C. Jones, Inverse Compton Scattering of Cosmic-Ray Electrons, Physical Review 137, 1306 (1965).
- Blumenthal and Gould [1970] G. R. Blumenthal and R. J. Gould, Bremsstrahlung, Synchrotron Radiation, and Compton Scattering of High-Energy Electrons Traversing Dilute Gases, Reviews of Modern Physics 42, 237 (1970).
- Rybicki and Lightman [1991] G. B. Rybicki and A. P. Lightman, Radiative processes in astrophysics (John Wiley & Sons, New York, 1991).
- Gould and Schréder [1967] R. J. Gould and G. P. Schréder, Opacity of the Universe to High-Energy Photons, Physical Review 155, 1408 (1967).
- Murase et al. [2011] K. Murase, K. Toma, R. Yamazaki, and P. Mészáros, On the Implications of Late Internal Dissipation for Shallow-decay Afterglow Emission and Associated High-energy Gamma-ray Signals, Astrophys. J. 732, 77 (2011), arXiv:1011.0988 [astro-ph.HE] .
- Schlafly and Finkbeiner [2011] E. F. Schlafly and D. P. Finkbeiner, Measuring Reddening with Sloan Digital Sky Survey Stellar Spectra and Recalibrating SFD, Astrophys. J. 737, 103 (2011), arXiv:1012.4804 [astro-ph.GA] .
- Pei [1992] Y. C. Pei, Interstellar Dust from the Milky Way to the Magellanic Clouds, Astrophys. J. 395, 130 (1992).