A Quasar-Anchored Protocluster at in the ASPIRE Survey: I. Properties of [OIII] Emitters in a 10 Mpc Overdensity Structure
Abstract
ASPIRE (A SPectroscopic survey of bIased halos in the Reionization Era) is a quasar legacy survey primarily using JWST to target a sample of 25 quasars with NIRCam slitless spectroscopy and imaging. The first study in this series found evidence of a strong overdensity of galaxies around J03053150, a luminous quasar at , within a single NIRCam pointing obtained in JWST Cycle 1. Here, we present the first results of a JWST Cycle 2 mosaic that covers 35 arcmin2 with NIRCam imaging/WFSS of the same field to investigate the spatial extent of the putative protocluster. The F356W grism data targets [Oiii]+H at and reveals a population of 124 line emitters down to a flux limit of 1.210-18 erg s-1 cm-2. Fifty-three of these galaxies lie at spanning 10 cMpc on the sky, corresponding to an overdensity within a 2500 cMpc3 volume of 12.5 2.6, anchored by the quasar. Comparing to the [Oiii] luminosity function from the Emission line galaxies and Intergalactic Gas in the Epoch of Reionization (EIGER) project, we find a dearth of faint [Oiii] emitters at log(L/erg s-1) 42.3, which we suggest is consistent with either bursty star formation causing galaxies to scatter around the grism detection limit or modest suppression from quasar feedback. While we find a strong filamentary overdensity of [Oiii] emitters consistent with a protocluster, we suggest that we could be insensitive to a population of older, more massive Lyman-break galaxies with weak nebular emission on scales cMpc.
1 Introduction
Dedicated surveys have now revealed a population of rare, extremely bright quasars at , many with measured black hole masses in excess of 109 M⊙ (e.g., Bañados et al., 2016; Yang et al., 2019; Wang et al., 2021; Fan et al., 2023; Mazzucchelli et al., 2023; Bañados et al., 2023). The existence of these billion-solar-mass black holes Gyr after the Big Bang poses a major challenge to our understanding of supermassive black hole formation (see review in Volonteri et al., 2021). These bright quasars are broadly predicted by various simulations to reside in massive host galaxies within the rarest, most massive dark matter halos in the early Universe ( M⊙; Costa et al. 2014; Angulo et al. 2012; Di Matteo et al. 2017; Lupi et al. 2023). This is observationally corroborated by their strong clustering (García-Vergara et al., 2017; Arita et al., 2023).
Given their expected halo masses, the earliest quasars should trace very strong matter overdensities associated with the seeds of present-day galaxy clusters (though the variance on scales larger than a few cMpc is significant, e.g., Angulo et al., 2012). Prior to JWST, much effort was invested towards quantifying galaxy overdensities around quasars based on imaging using either HST or large ground-based telescopes. But while overdensities were occasionally found in observations, they certainly were not ubiquitous (e.g., Kim et al., 2009; Bañados et al., 2013; Mazzucchelli et al., 2017b; Ota et al., 2018; Champagne et al., 2023; Rojas-Ruiz et al., 2024). Interpreting these results was extremely challenging given heterogeneous selection techniques, restricted fields of view, and different cosmic volumes probed by various galaxy tracers (e.g., Lyman-break galaxies, Ly emitters, and dusty star-forming galaxies). Moreover, the limited near-IR sensitivity and poor photometric redshift precision () afforded by ground and HST surveys likely caused all but the strongest true galaxy overdensities around quasars to be missed. This was also coupled with the uncertainty of the underlying spatial distribution of companion halos, compounding the issue of observational geometry (e.g. Zana et al., 2023).
Thus, the question of whether the earliest quasars routinely trace strong galaxy overdensities could not be answered without near-IR spectroscopy in wide fields of view (e.g., Lupi et al., 2022). Dark matter simulations predict that galaxy protoclusters are extended beyond tens of comoving Mpc at (Chiang et al., 2017; Muldrew et al., 2015; Overzier, 2016), which cannot be probed with, for example, single ALMA pointings (Champagne et al., 2018). Now, with the power of JWST/NIRCam’s wide-field slitless spectroscopy (WFSS) in fields of view on the scale of tens of square arcminutes, we can perform detailed case studies around individual quasar environments.
To this end, two major Cycle 1 surveys emerged targeting the environments of reonization-era quasars. The Emission-line galaxies and Intergalactic Gas in the Epoch of Reionization (EIGER) project (Kashino et al., 2022; Matthee et al., 2023; Eilers et al., 2024) has already begun to use NIRCam’s WFSS mode to characterize the environments and statistical clustering of a sample of six quasars, finding a diversity of overdensity signals. The second, the focus of this paper, is A SPectroscopic survey of bIased halos in the Reionization Era (ASPIRE) project (Wang et al. (in prep); Wang et al., 2023; Yang et al., 2023). Both of these studies perform grism spectroscopy in F356W with direct imaging in F356W, F200W, and F115W.
In total, ASPIRE targeted 25 quasars in JWST Cycle 1 with single NIRCam pointings. This paper focuses on a single quasar field from the ASPIRE sample, which is well-studied at multiple wavelengths. J03053150 was originally identified in the VIKING Survey (Venemans et al., 2013, 2016) and lies at , containing a M⊙ SMBH (Mazzucchelli et al., 2017a). Ota et al. (2018) found the first hints of an overdensity in this field, using Subaru broad- and narrowband imaging to identify 53 LBGs and 14 LAEs, corresponding to a 3 and 1 overdensity respectively across a 30′ by 30′ field. Later, Champagne et al. (2023) found an overdensity of LBGs in the field, with based on photometric redshift fitting of 42 galaxies identified with HST broadband imaging within a 6.25 arcmin2 field of view (FOV). Using ASPIRE Cycle 1 data, Wang et al. (2023) identified 41 galaxies at in a single NIRCam pointing (11 arcmin2) of the same field via the detection of [Oiii]+, 21 of which were within ( km s-1) from the quasar. Of those twenty-one, 13 [Oiii] emitters were matched to 10 spatially-unresolved LBGs from Champagne et al. (2023). Wang et al. (2023) thus provided evidence for a spectroscopic overdensity extending several comoving Mpc on the sky, which motivated us to target this field again in Cycle 2 with a NIRCam mosaic covering 6 the area to investigate the extended protocluster structure.
With spectroscopic data in hand and a suite of imaging from prior studies (Ota et al., 2018; Champagne et al., 2023) and NIRCam (Wang et al., 2023), we can investigate in detail the rest-optical properties of these galaxies and compare them to the general field population towards the end of the epoch of reionization. In this paper (Paper I), we present the galaxies detected in a NIRCam mosaic of the field of J03053150 and evaluate the protocluster nature of the overdensity. The following paper (Paper II; Champagne et al. 2024b) presents detailed SED fitting of the galaxies using the full suite of imaging and discusses the environmental dependence of galaxy evolution within the protocluster. We describe our dataset and reduction process with details on our catalog construction for [Oiii] emitters and LBGs in §2 and §3. §4 shows the 3D distribution of the filaments in the protocluster. §5 presents the [Oiii] luminosity function and equivalent width distribution for the spectroscopically confirmed protocluster members. In §6.1 we present our interpretation of the environment of the quasar within the protocluster, while we compare to simulations in §6.2 and conclude in §7. Throughout this paper we assume AB magnitudes and a flat CDM cosmology with H0 = 70 km s-1 Mpc-1, , and =0.3.
2 Observations and Data Reduction
2.1 JWST Data
J03053150 was observed as part of the Cycle 1 JWST ASPIRE (A SPectroscopic survey of biased halos In the Reionization Era) program (GO #2078, PI: F. Wang) which targets 25 quasars with F356W grism spectroscopy and F115W/F200W/F356W broadband imaging with NIRCam. More details about the ASPIRE survey can be found in Wang et al. (2023). Follow-up mosaic observations were performed in Cycle 2 (GO #3325, PI: F. Wang). We use the ASPIRE grism spectroscopy to identify [Oiii]5007 emitters, which are complemented by the additional 5-pointing mosaic in Cycle 2 centered on the quasar, for a total area coverage of 35.05 arcmin2. We briefly summarize the data reduction and processing to homogenize the data here.
2.1.1 NIRCam WFSS
ASPIRE uses Grism-R with F356W in the long wavelength (LW) channel (), with simultaneous observations with F200W in the short wavelength channel (SW).
Thus, the quasars are observed with slitless spectroscopy at 3-4 m with deep (28 mag at 5) imaging at 2 m.
The main observations are performed with a 3-point INTRAMODULEX primary dither pattern and each primary position includes two sub-pixel dithers, yielding a survey area of arcmin2 per pointing for imaging + slitless spectroscopy (the mosaicked area is 35 arcmin2 accounting for overlaps).
We use the SHALLOW4 readout pattern with nine groups and one integration which gives a total on-source exposure time of 4257 s per pointing, with the deepest data centered on the quasar.
Full details of the reduction steps including astrometric and spectral calibrations, dispersion modeling, and extraction of spectra can be found in Wang et al. (2023).
That study noted a half-pixel offset between the spectral tracing model and the data along the spatial direction, but that the offset along the dispersion direction requires in-flight wavelength calibration that is still not available.
They quote a conservative constant offset of 100 km s-1 which translates to for the [Oiii] emitters, which we adopted here as well.
2.1.2 NIRCam imaging
To maximize the sky area coverage, both NIRCam modules are used by ASPIRE for direct imaging.
In order to match spectra to their sources from the grism spectroscopy, direct (near the quasar) and out-of-field imaging (to capture sources outside of the NIRCam field of view whose spectra may land on the WFSS detector) were performed with the same readout pattern as the main observations, with the F115W filter in the SW and the F356W filter in the LW.
Therefore, J0305 was observed with F115W, F200W, and F356W, with the latter being the deepest.
Reduction of the NIRCam images was performed using version 1.10.2 of the JWST Calibration Pipeline (CALWEBB).
We use the reference files (jwst_1015.pmap) from version 11.16.21 of the standard Calibration Reference Data System (CRDS) to calibrate our data.
The details of the Stages 2 and 3 steps, including creating background images, the measurement of the 1/f noise, astrometric alignment, image drizzling and final background subtraction can be found in Wang et al. (2023); Yang et al. (2023).
During the resampling step, we used a fixed pixel scale of 0.031″ for the SW images and 0.0315″ for the LW images with adopted pixfrac=0.8.
The mosaicked images are further aligned to the reference catalog from Gaia DR3 (Gaia Collaboration, 2020) for absolute astrometric calibration, yielding precise relative alignment (RMS 15 mas) and absolute astrometric calibration (RMS 50 mas).
The 5 depths, calculated by placing random empty 032-diameter apertures across the image, are 27.2, 28.0, and 28.3 in F115W, F200W, and F356W respectively.
3 Catalog Construction
3.1 The [OIII] catalog
We used SourcExtractor++ (Bertin et al., 2020) on the NIRCam imaging to create an initial photometric catalog. Details of the SourcExtractor++ and photometric measurements can be found in Paper II; we use this catalog only as positional priors to extract [Oiii] line emitter candidates. We cross-matched our photometric catalog with the catalog of [Oiii] emitters reported by Wang et al. (2023), which was extracted only from the central pointing of our mosaic data, using a search radius of 01 (chosen to be close to the PSF size and to accommodate potential astrometric offsets from the Cycle 1 dataset). Wang et al. (2023) reported 41 [Oiii] emitters at , all of which remain robust and with no positional offsets after using improved reduction procedures. Details on the line extraction procedure can be found in Wang et al. (2023), but briefly we use both a boxcar extraction of diameter 5 pixels as well as an optimal extraction with an iterative background subtraction procedure. Combining with the new 5-pointing mosaic across 35 arcmin2, our updated line-search procedure yielded 83 new [Oiii] emitters which are added to our sample. This corresponds to a total of 53 [Oiii] emitters that are members of the overdensity at and 71 at (124 in all). The 5 limiting flux in the deepest central part of the mosaic, assuming a linewidth of 50 Å (2 the spectral resolution, approximately 250 km s-1), is 1.210-18 erg s-1 cm-2. This corresponds to a luminosity of erg s-1 at . There are two serendipitously discovered overdensities along the line of sight at and which we will discuss in detail in §5.
Rest-frame equivalent widths (EW) are measured for the [Oiii] emitters using the [Oiii] line fluxes (obtained by integrating the best-fit Gaussian to the [Oiii] doublet in the 1D spectrum) and the F356W broadband photometry after subtracting out the line contribution, assuming a flat continuum in .
3.2 The LBG catalog
We use the catalog from Champagne et al. (2023) who identified LBGs using a single pointing of 5-band HST WFC3 and ACS imaging. We do not identify any new LBGs within the HST footprint that are not already in the [Oiii] catalog, nor do we add any new HST data covering the WFSS mosaic. Champagne et al. (2023) searched for LBGs in a wide redshift range of due to the coarse sampling of the SED with only HST. We cross-matched that LBG catalog with our new photometric catalog which used F356W as the detection image (see Paper II) and included the NIRCam photometry to refit their SEDs using EAZY (Brammer et al., 2008). Of the 42 LBGs reported in Champagne et al. (2023), three are visible in the F356W detection image but not formally detected, which could be due to different deblending or detection parameters between the original HST/F160W and JWST/F356W detection images. Of the remaining 39 LBGs, 18 do not have photo-’s consistent with after the inclusion of NIRCam and Subaru photometry (this is the median offset between and ; see paper II for template SED fitting), 11 are confirmed [Oiii] emitters not at the quasar redshift (), and 3 [Oiii] emitters are already included in our primary overdensity sample. The remaining 7 are still robust LBGs with .
Since the grism data is sensitive to a wide range of , any LBGs from Champagne et al. (2023) should have been detected in [Oiii] even for those with high photo- uncertainty. While they might be lower- interlopers given the sparse rest-UV/optical filter coverage, the total lack of emission lines in the remaining LBGs could be due to an inherent faintness of nebular emission. We hypothesize that they have lower specific star formation rates which would result in undetectable [Oiii] emission at the ASPIRE flux limit, a consequence of stochastic star formation histories (discussed further in Paper II). For those LBGs which are not confirmed in [Oiii] but have robust photo- estimates (defined as % of the EAzY redshift PDF lying between ), we derive an upper limit on the EW using the observed F356W magnitude and a 5 limiting line flux at the location of the LBGs ( erg s-1 cm-2).
4 A Protocluster at
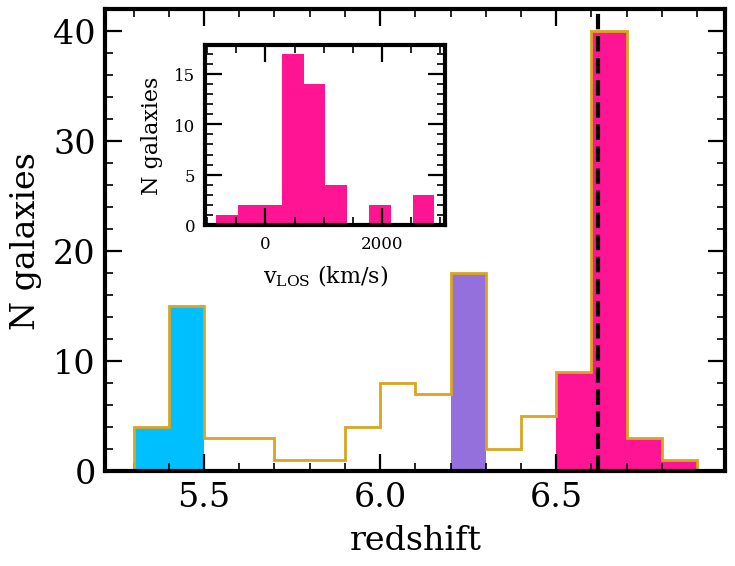
The quasar overdensity consists of 53 galaxies at . Within the overdensity, a surprising 41 lie at exactly the quasar redshift ( km s-1). Two other overdensities are revealed in the full distribution of [Oiii] emitters: a compact overdensity at consisting of 20 galaxies, and an overdensity extended across the field at composed of 18 galaxies. The remaining 33 line emitters between comprise our field sample. This serendipitous confluence of line-of-sight overdensities helps to explain the high number of LBGs found in this field by Champagne et al. (2023), but the number of galaxies with [Oiii]-based spectroscopic confirmation at the quasar redshift remains remarkable.
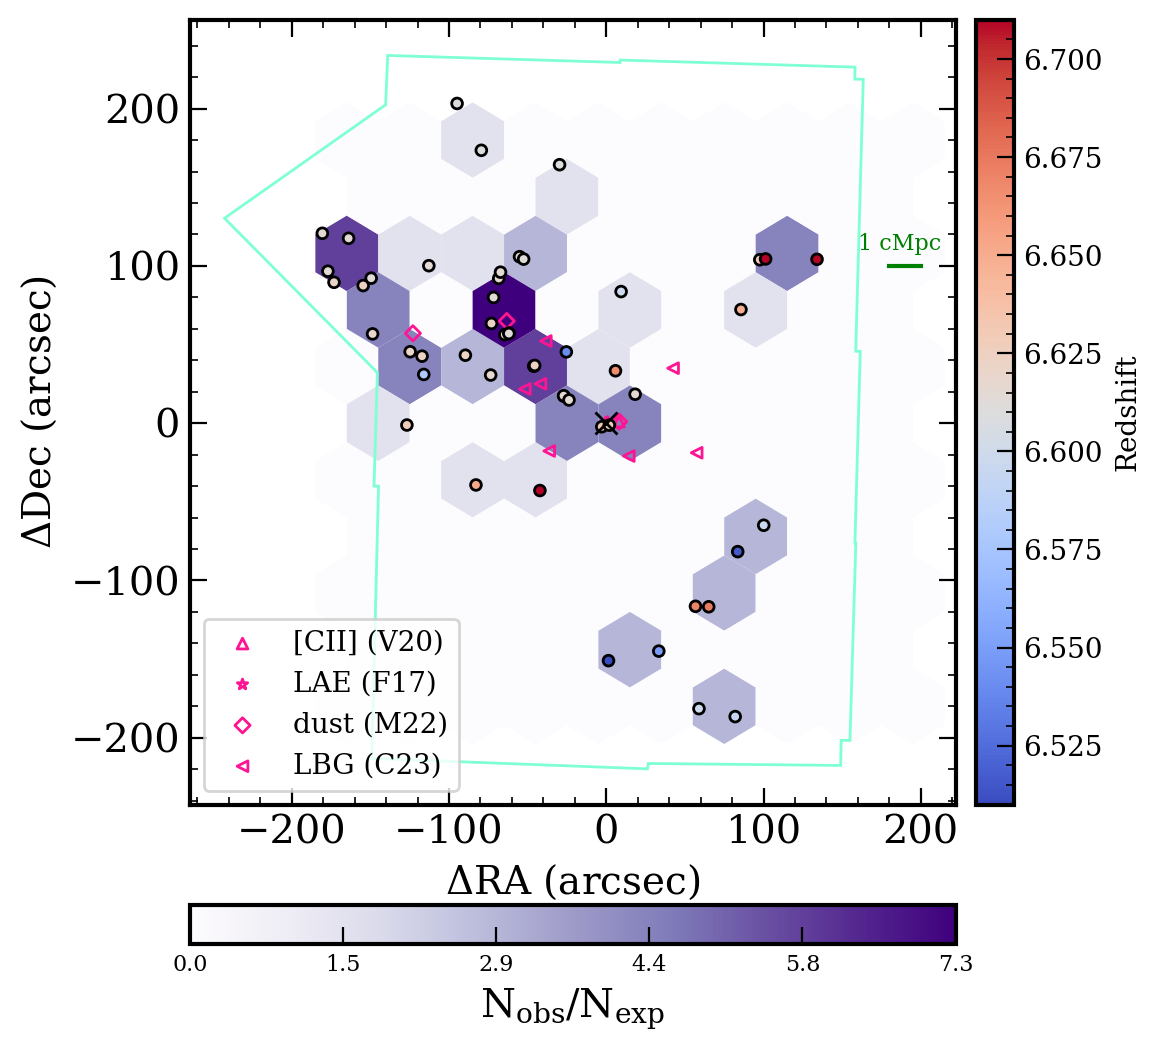
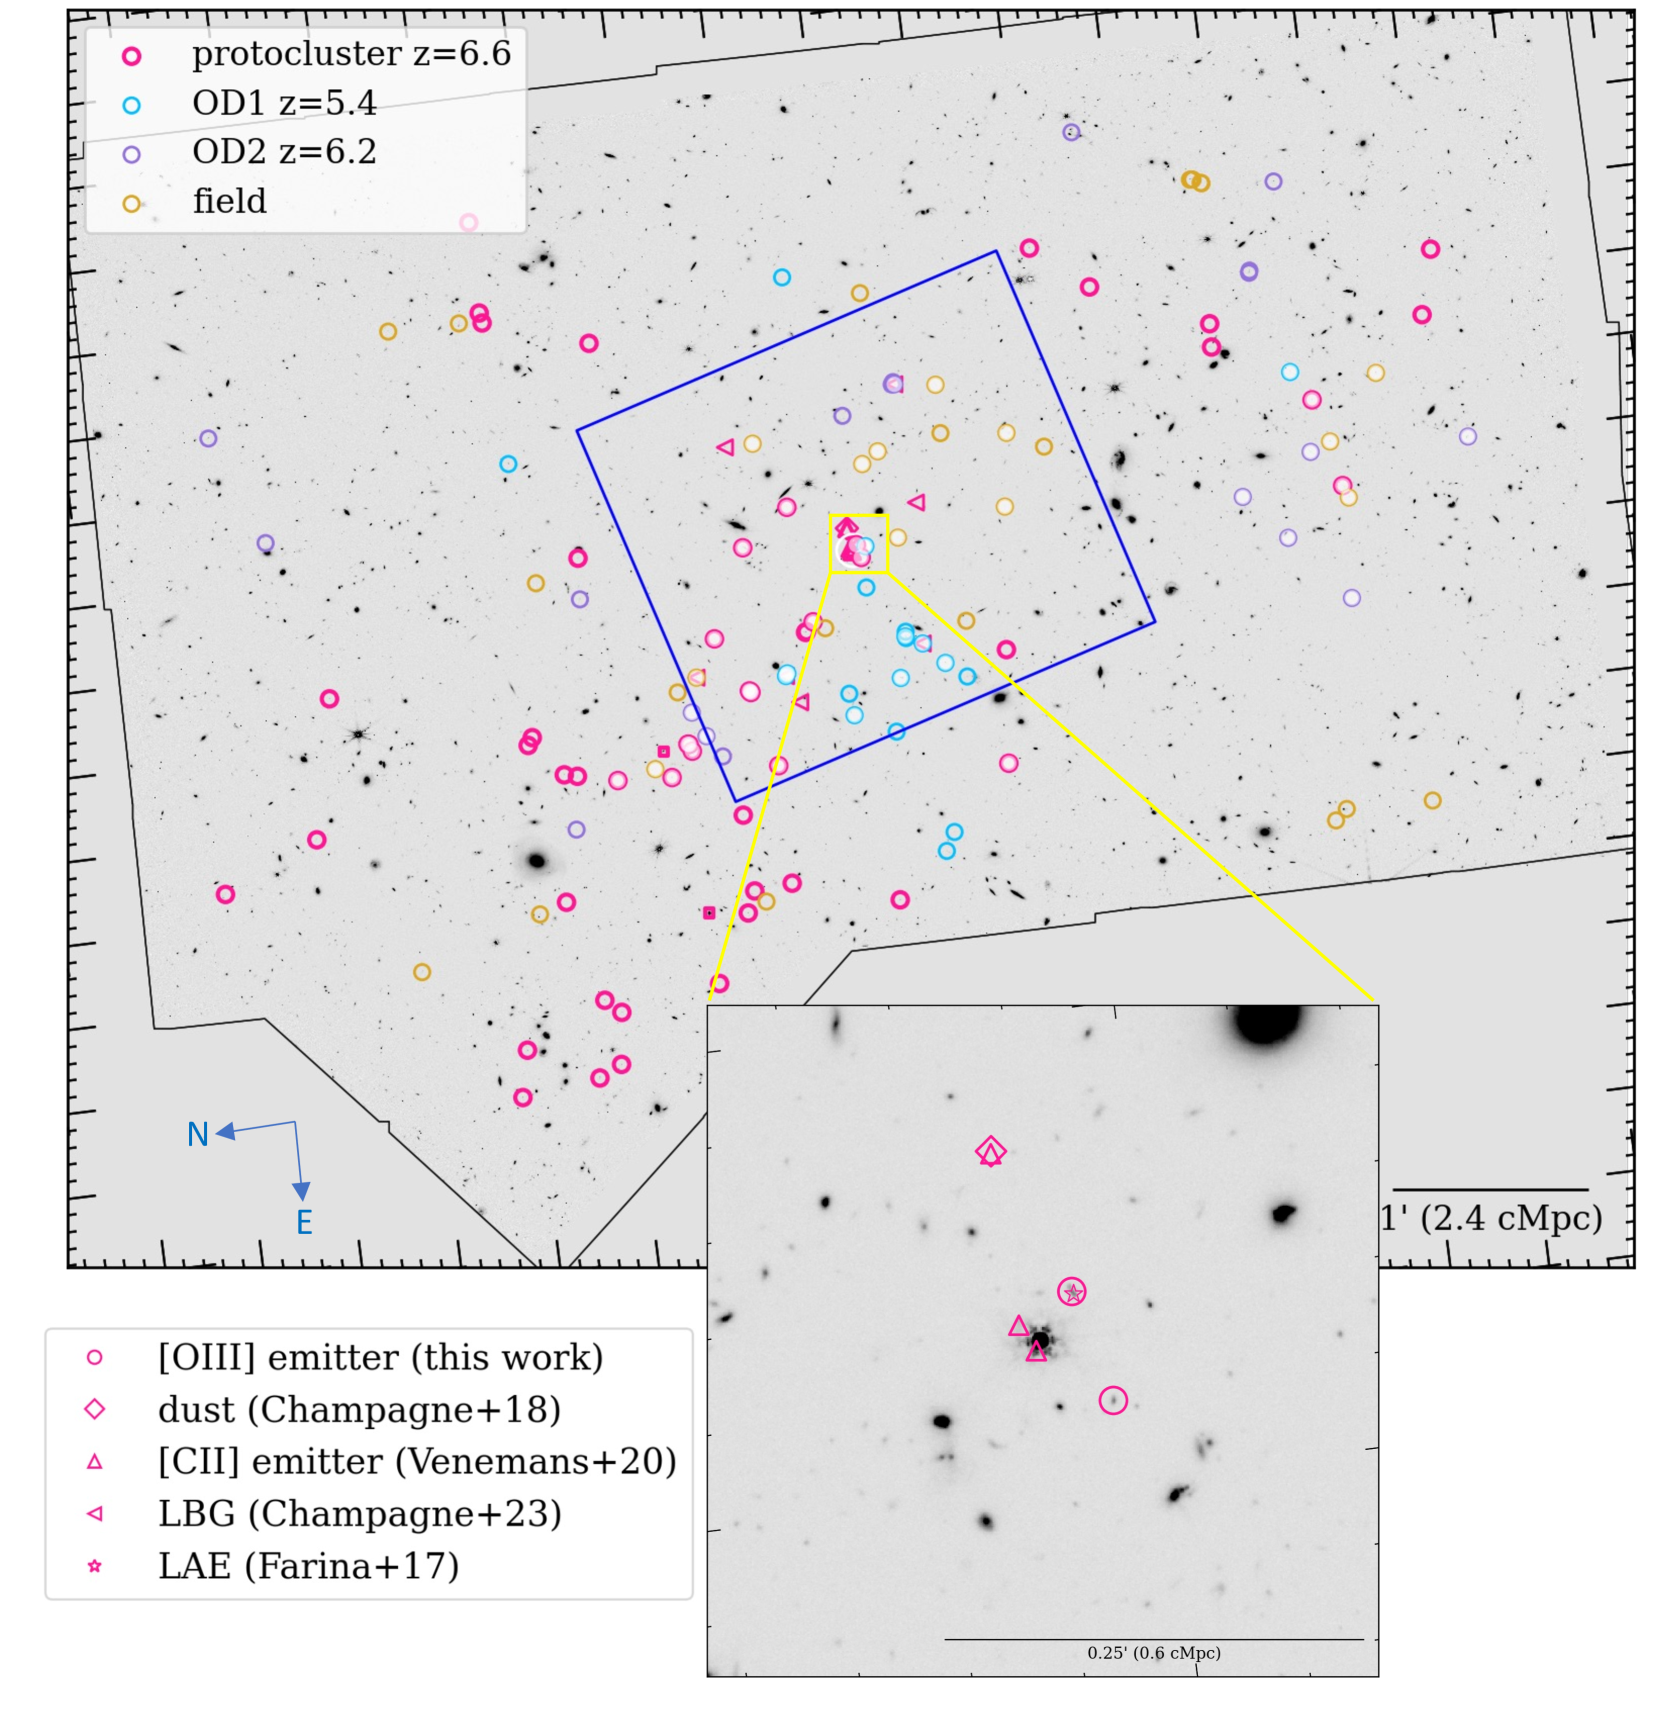
Figure 1 shows the F356W image with all of the [Oiii] emitters overlaid, denoting the quasar overdensity members, the lower redshift overdensities, and the field galaxies, in addition to other galaxies (dust continuum and [Cii]) identified in the field by ALMA (Champagne et al., 2018; Venemans et al., 2020; Meyer et al., 2022). The redshift histogram of all 124 line emitters is shown in Figure 2, highlighting the three primary overdensities. The inset shows all galaxies within from the quasar; while these galaxies are likely not all associated with the same structure at such a wide line-of-sight distance, the overdensity signal remains strong across a continuous range in redshift at and a transverse area of (10 cMpc)2, so we consider them all to be members for the sake of this study. Basic information about the [Oiii] emitters in the protocluster can be found in Table 2 at the end of this manuscript.
Figure 3 shows a 2D representation of the overdensity around the quasar, highlighting a filament extending behind the quasar across a transverse distance of cMpc. The 2D overdensity hexbins are calculated based on the area expected to contain 1 LBG at according to the luminosity function at parameterized by Finkelstein (2016). The quasar actually does not sit at the center of the overdensity, but instead inhabits the SW side of the spatial distribution. Further, it lies at the lower end of the galaxy redshift distribution by about 500 km s-1. The full overdensity extends well into the NIRCam mosaic, with galaxies at the quasar redshift found within a (10 cMpc)2 box on the sky. In fact, the overdensity may extend well beyond the current FOV given that many sources are found on the comparatively shallow edges of the mosaic (see exposure map in Figure 4). It is distinctly distributed across multiple overdense filaments, with the densest region found about cMpc from the quasar at very slightly lower redshift (, ). This is comparable to the redshift uncertainty of and could potentially be due to peculiar motion, but regardless the quasar still does not lie at the spatial center of the overdensity. Observationally, protoclusters identified at lower redshift in the fields of DSFGs or AGN are often not centered on the “main” galaxy (e.g., Dannerbauer et al., 2014; Cucciati et al., 2018; Toshikawa et al., 2024) and are observed in an unrelaxed (i.e., non-spherical) distribution. From a theoretical perspective, the BlueTides simulation (Di Matteo et al., 2017) finds that the most massive SMBH are not necessarily in the most spatially overdense regions, but instead in specific environments that favor radial matter inflows (perhaps in this case, on the edge of the overdensity).
Notably, as seen in the inset of Figure 1 and in Figure 3, the immediate environment of the quasar is characterized by a rich population of neighboring galaxies. There are multiple submm-detected galaxies (Venemans et al., 2020) not seen in [Oiii], and there is a relative dearth of [Oiii] emitters compared to the strong overdensities further from the quasar; we revisit the physics of this in §6.1. This lack of line emitters in the immediate vicinity of the quasar has been seen in other studies tracing LAEs, albeit with much larger “holes” on the scale of 5 pMpc (e.g., Lambert et al., 2024). Given the richness of the overdensity within a relatively small area on the sky — consistent with theoretical expectations (e.g., Overzier et al., 2009) — we strongly suspect that this is a bona fide galaxy protocluster, i.e. a progenitor to a massive cluster of M M⊙ at later times (e.g., Costa et al., 2014).
5 The [Oiii] Sample
5.1 Luminosity function
We next compare our findings to the field [Oiii] luminosity function (LF) measured by the EIGER project (Matthee et al., 2023; Kashino et al., 2022). The luminosity function is the usual formula:
| (1) |
where is the completeness, is the number of objects per bin, and is the detectable volume subtended by our survey. We bin the [Oiii]-emitters in bins of log(/erg s-1) = 0.2 and compute Vmax as a function of redshift and luminosity. Since the sensitivity of NIRCam WFSS is position- and wavelength-dependent, this translates to a redshift dependence of the detectability of [Oiii] in addition to the overall luminosity limit. The survey volume is computed following Sun et al. (2023): for a specific redshift, we compute the effective sky area based on the spectral tracing and grism dispersion models in order to construct RMS maps, done using continuum-subtracted WFSS stage2 cal files. The maximum sky area at each redshift is the area of the RMS map with values smaller than the maximum RMS for a line detection of log(/erg s-1) = 42.
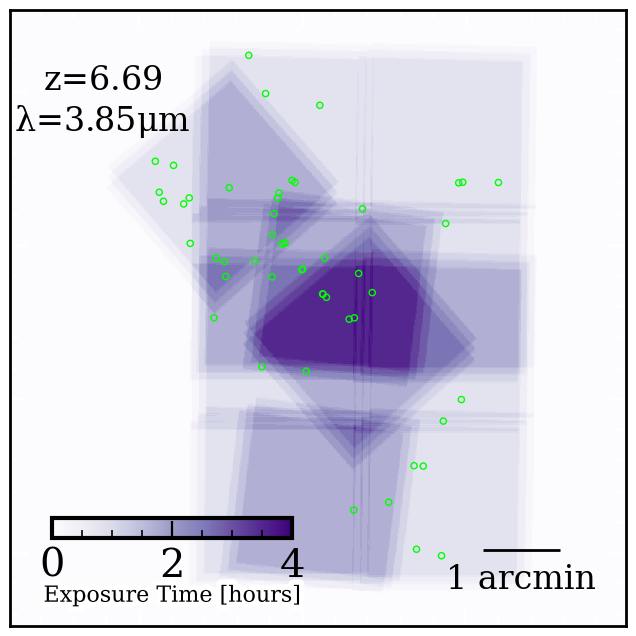
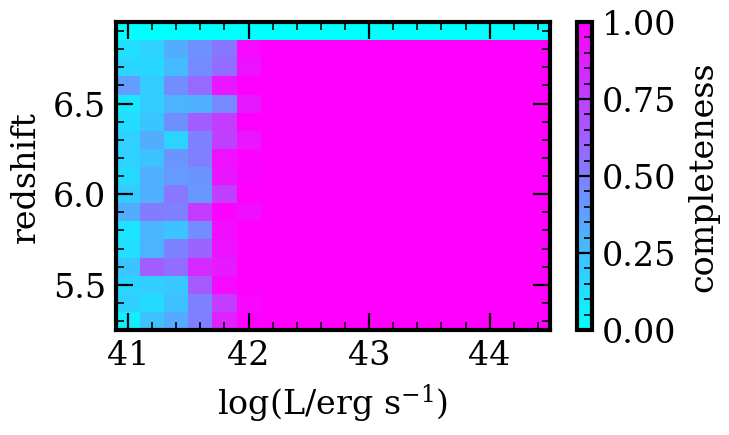
To measure completeness, we run 1D source injection simulations. We begin with a noise spectrum with the average line-free rms of our sample at the deepest point of the mosaic (centered on the quasar) which is perturbed within 1 for every realization. Then we insert Gaussian emission lines with the same wavelength resolution as the real data at a randomly sampled range of intrinsic luminosities (), redshifts (), and intrinsic FWHM (drawing from a Gaussian centered on 200 km/s with km/s). We then re-fit the Gaussian to the line and measure the recovered flux and SNR. The completeness varies as a function of wavelength, so we repeat this procedure in bins of such that the completeness is measured as a function of both luminosity and redshift. Figure 4 shows the exposure map for the mosaic as well as the results of our completeness simulations in the deepest part of the mosaic. We find a 100% recovery rate of galaxies at the quasar redshift above log(L/erg s-1) = 42.0 in the center of the mosaic at . For each source at a given location on the exposure map, the value of the completeness moves along the luminosity axis by the square root of the exposure time at that location relative to the deepest exposure111Note that NIRCam Module A is about 20% more sensitive than Module B in the same exposure time, but we found that scaling the completeness by exposure time or RMS does not change the results..
Figure 5 shows the results of our [Oiii] luminosity function for the overdensity samples and the field sample. We calculate the quasar overdensity factor by first integrating the [Oiii] luminosity function derived by Matthee et al. (2023) for the EIGER project, who searched for [Oiii] emitters with an identical observational setup to ASPIRE in the field of the quasar J0100+2802 in a 26 arcmin2 mosaic. We normalize the EIGER LF by the area (35 arcmin2) and volume covered by our field to calculate the expected number of [Oiii] emitters between and arrive at a lower limit of = 3.7 1.5. However, the 53 galaxies in the overdensity are distinctly clustered in a (10 cMpc)2 box on the sky (roughly 200200 arcsec2), so if we instead integrate the EIGER luminosity function in this smaller region to arrive at the expected number of [Oiii] emitters, 2.6. This is consistent with found by Wang et al. (2023) in a single NIRCam pointing of the J0305 field. Thus, the filamentary structure extending well into the NIRCam mosaic footprint remains overdense with respect to the field at least out to 10 cMpc (possibly further), consistent with the size of protoclusters at (e.g., Chiang et al., 2017).
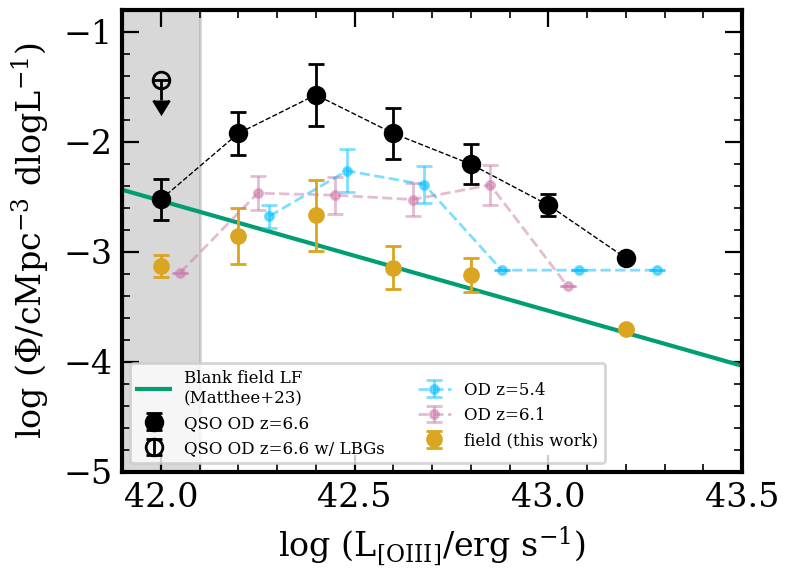
The luminosity function of the quasar overdensity reveals two curious features: the slope of the protocluster LF at the bright end exhibits a sharper decline than the field relation, and there is a turnover in the protocluster LF at log(/erg s 42.4. Compared to the similar area coverage of the EIGER project in the J0100+2802 field, we would have expected to find a similar occurrence rate of bright (log(/erg s 43) objects (14 3 in the field at , 2.2 1 in the quasar overdensity), but this is not reflected either in the field nor the protocluster. A simple Kolmogorov-Smirnov (KS) test between the protocluster [Oiii] flux distribution and the field (normalized to the comoving volume of the protocluster within ) shows a -value of 0.35, so the two distributions are not distinguishable. However, we are limited by comparing only two fields that are likely subject to strong field-to-field variance (see, e.g., more results from EIGER; Eilers et al., 2024), so the lack of bright galaxies is not statistically significant.
More interesting than the lack of [Oiii]-bright galaxies, however, is the turnover at the faint end. We argue that the turnover is physically real: our 5 limiting line luminosity at is erg/s, and we are presumably complete above erg/s at all redshifts between according to our 1D injection simulations. Further, the field shows no such turnover, so we do not believe this is due to completeness.
A genuine dearth of faint galaxies compared to bright galaxies within the protocluster could point to physics governing the strength of [Oiii] emission, which varies on the timescale of the lifetime of O stars (about 10 Myr; Eldridge & Stanway, 2022). A population of intrinsically faint (i.e. below the grism detection limit) galaxies with respect to their nebular emission could point to the idea that the majority of the galaxies in the protocluster are undergoing less recent star formation. This could be the result of more massive and evolved galaxies having higher metallicity and higher continuum, and thus weaker [Oiii]. This is supported by the fact that, if we assume the 7 LBGs are at the quasar redshift and calculate the upper limits of their [Oiii] luminosity, the turnover in the luminosity function disappears. However, we cannot immediately rule out that quasar feedback could also influence the number counts of faint [Oiii] emitters. Yet we also note, qualitatively, that a similar downturn at the faint end of the LF is seen in the two lower-redshift overdensities, implying that it is not the mere existence of the quasar influencing the [Oiii] distribution. We return to this point in Section §6.2.
Figure 5 also shows the luminosity function of the two lower-redshift overdensities mentioned in §3.1. These show a similar order of magnitude overdensity above the EIGER relationship and our field LF. It is beyond the scope of this paper to declare whether these are also protocluster structures, but we note it would be interesting to follow them up with further observations. An analysis of the galaxy properties of all three overdensities (quasar and line-of-sight) is left to Paper II.
5.2 [Oiii]+H strength
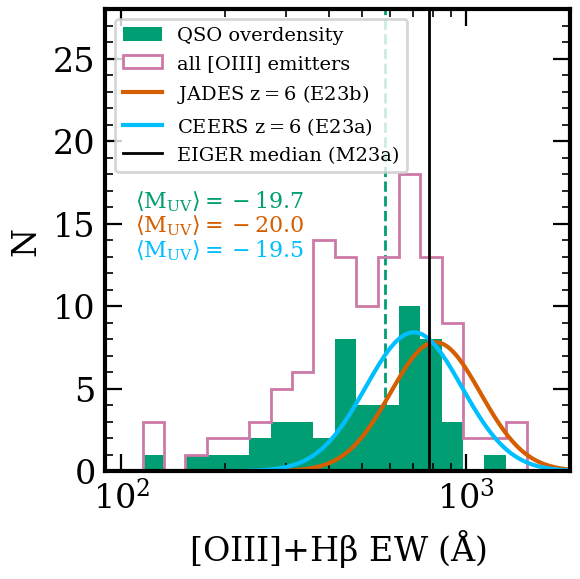
Next, in Figure 6 we turn to the nebular line equivalent width distribution, which is a proxy for the ratio of young stellar populations (nebular emission lines powered by OB stars) to older populations (powering the stellar continuum). Endsley et al. (2023a) finds that the median [Oiii]+H EW (measured from CEERS NIRCam photometric excesses rather than spectra), is 780 Å for UV-faint (M) LBGs at with a dispersion of dex; an even higher median of 890 Å is found for the JADES sample at similar redshift (Endsley et al., 2023b). The median EW of the protocluster population measured from the grism spectra, on the other hand, is only 580 15 Å. Even for the sample of non-overdensity galaxies in the field, however, the median EW is only marginally higher at 630 Å (and a KS -value of 0.21, so they are consistent with being drawn from the same distribution); this is more comparable to the median EW of 650 Åof UV-bright galaxies in COSMOS (Endsley et al., 2021; Whitler et al., 2022). Our measured median EW is also below the EIGER median stack value of 845 70 Å (Matthee et al., 2023), which could point to a potential systematic selection effect in our data. Notably, the EIGER median stack excludes galaxies at the redshift of the quasar, so there is tentative evidence for a physical difference in the nebular line emission between galaxies within and outside of overdensities. We again suggest that the EW distribution in the protocluster is biased low due to the presence of more evolved galaxies with earlier formation times, resulting in low nebular emission and high continuum from the dominating presence of moderately-aged stars.
Studies differ on the definition of an extreme emission line galaxy (EELG) but here we use the definition of EW([Oiii]+H) 750Å (e.g., Boyett et al., 2024). Only 10/53 (19%) of the protocluster galaxies satisfy this definition while 11/33 (33%) field galaxies can be considered EELGs. Thus, the fraction of EELGs in the protocluster is lower at the 2 level according to Poisson statistics. It is consistent with the fact that, despite our wide area coverage which should have been able to pick up a handful of bright objects, the majority of the [Oiii] emitters are rather faint.
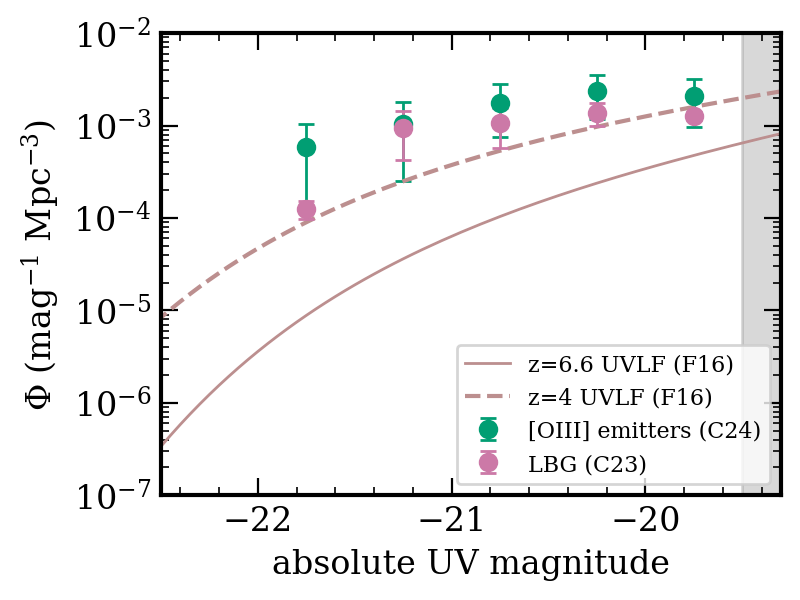
Going beyond the spectroscopic data, the question remains, are quasar companion galaxies preferentially brighter compared to the field? We finally compare our results to the UV luminosity function derived in the field (Finkelstein, 2016). Champagne et al. (2023) suggested a preferential enhancement of bright () LBGs in the vicinity of quasars, including J03053150, even after correcting the faint end for completeness. Computing the LBG luminosity function in similar bins as the field UV luminosity function of Finkelstein (2016), they found that the slope and normalization of the LBG luminosity function in the field of J03053150 was most consistent with the field UVLF at , suggestive of accelerated evolution compared to the field. Now that the [Oiii] emitters in the same field are spectroscopically confirmed, we can return to the question of whether brighter galaxies prevail in the overdensity, or galaxy evolution is enhanced in the full mass range we probe.
While the [Oiii] luminosity distribution peaks at relatively low luminosities, we find that the distribution of the [Oiii] emitters (measured from their rest-frame SEDs at 1500 Å, see Paper II for SED details) follows the same slope as that of the LBGs in Champagne et al. (2023): a flattening of the bright end most consistent with evolution accelerated by several hundred Myr (Figure 5, right panel). This is in line with descendant populations, i.e., more evolved bona-fide protoclusters, at . For example, Hill et al. (2020) and Pensabene et al. (2024) and both find preferential enhancements of bright galaxies within protoclusters at cosmic noon, implying that more massive galaxies evolve faster than their lower-mass counterparts. This is consistent with the distribution of low [Oiii]+H EWs, implying older ages (and thus lower specific star formation rates) and higher metallicity among massive galaxies, as both effects contribute to lowering the H+[Oiii] equivalent width.
6 Discussion
6.1 Immediate Quasar Environment
Figure 1 clearly shows a very busy immediate (100 kpc) environment around the quasar, marked by 3 [Cii] emitters (Venemans et al., 2019), a dust continuum emitter (Champagne et al., 2018), one LAE (Farina et al., 2017), and 2 [Oiii] emitters from this work (one of which is the LAE)222In Paper II, we search for AGN activity in the protocluster members, but for now we assume all of the [Oiii] emitters are normal star-forming galaxies.. Note that the three [Cii]-emitters from Venemans et al. (2019) and the dust continuum emitter from Champagne et al. (2018) are each found in single ALMA pointings (″ diameter in Band 6), but no other [Cii] or dust sources are found in a 1.1′ mosaic centered on the quasar (Wang et al., in prep.).
It is interesting to note the relative dearth of [Oiii]-emitting galaxies within 100 kpc from the quasar host compared to the much stronger overdensities found further away from the quasar (Figure 3). One way to explain this could be that the quasar host galaxy has grown through major mergers with its immediate neighbors. The [Cii] emitters without [Oiii] counterparts could imply the existence of massive gas reservoirs but with relatively low instantaneous star formation, which would result in a non-detection of the short-lived [Oiii] line. Indeed, Venemans et al. (2019) suggest that the small molecular gas masses ( smaller than the quasar host) and unusual kinematics of the [Cii] companion galaxies could imply prior interactions with the host galaxy.
A second explanation for the perceived lack of galaxies very close to the quasar is the result of high dust extinction in the rest-optical. While Wang et al. (in prep.) finds no dust continuum counterparts for the [Oiii] emitters nor new sources, the quantity of dust could be below the ALMA detection limit but still significant enough to weaken the [Oiii] or indeed the Ly line. In fact, Ota et al. (2018) imaged this field with on a much wider FOV with Subaru and found 14 narrowband-selected LAE candidates at the quasar redshift, but none closer than 2 arcmin (0.5 cMpc) from the quasar. Galaxies very close to the quasar could thus be undergoing a dustier mode of star formation than those on the outskirts of the overdensity. Venemans et al. (2019) measures SFRs for the [Cii] companions in the range of 25–160 M⊙ yr-1 — which, again, have no [Oiii] counterparts — so indeed some vigorous star formation is taking place not accounted for by our [Oiii] selection method.
A final way to explain the relative dearth of [Oiii] emitters very close to the quasar host is through radiative feedback from the quasar. Indeed, Yang et al. (2023) present blueshifted [Oiii] outflows from quasar hosts at similar redshift which could be the result of radiatively driven AGN feedback in kinetic mode, i.e., where radiation pressure produces outward motion of heated gas. Photoionization heating from the central quasar can suppress star formation in surrounding low-mass haloes within the so-called proximity zone, whose size is largely determined by the quasar lifetime and UV luminosity (Satyavolu et al., 2022). The photoionization heating can be described by the quantity (Kashikawa et al., 2007; Bosman et al., 2020). This quantity, relating the quasar’s UV intensity at the Lyman limit (912 Å) to its environment, is typically applied to the low-mass haloes hosting Lyman- emitters (LAEs). Assuming that the low-mass [Oiii] emitters (median stellar mass M⊙; see SED details in Paper II) occupy similar haloes, we calculate the UV flux density as a function of distance to the quasar using the following equation:
| (2) |
where
| (3) |
where = 20.89 mag (Venemans et al., 2013), is the continuum slope which is measured to be using archival photometry of the quasar (Protušovà in prep.), is the angular diameter distance from the quasar, and is the luminosity distance to the quasar. Then is the isotropic UV intensity erg s-1 cm-2 Hz-1 sr-1 where . Evaluating these equations at 2 pMpc (15.2 cMpc, approximately the full angular extent of the protocluster) we find that = 1.110-19 erg s-1 cm-2 Hz-1, and thus = 9.8 0.9.
Some studies (e.g., Kashikawa et al., 2007; Chen, 2020) have suggested that values of can completely suppress star formation in low-mass halos, but we do not see such an effect in our field as there are indeed at least 56 galaxies within 2 pMpc of the quasar. For one, we expect that the [Oiii] emitters occupy halos of M⊙(see §6.2) which is above the halo mass limit where we expect to see significant suppression (e.g., Bosman et al., 2020). Secondly, not all galaxies in the vicinity of the quasar will be equally exposed to the quasar radiation due to 1) patchy dust obscuration within the host galaxy and 2) the fact that the UV flux from the quasar is radiated in a beam with a modest opening angle rather than isotropically. Such a double-cone shape is indeed accommodated by the non-spherical distribution of [Oiii] emitters (Figure 3), though we note the mosaic is not uniformly sensitive across the whole area. Modest suppression of slightly higher-mass halos may still be occurring in the very inner regions close to the quasar, where J, given the low number of close companions. This is supported by the shape of the [Oiii] luminosity function (Figure 5), where we see hints of a potential suppression of the lowest-mass [Oiii] emitters. We explore in the next section whether the turnover in the LF could primarily be attributed to intrinsic star formation properties of the galaxies or a direct result of interaction with the quasar.
6.2 Comparison to simulations
Given the extended filamentary nature of the quasar protocluster, we can already conclude the structure is not virialized. If we assume we can translate the redshift distribution to peculiar velocities with dispersion , we could use the virial theorem (Mh = 3R/G) to estimate a total protocluster halo mass. Taking the galaxies which live within km s-1 from the quasar (41), which span pMpc (12 cMpc) on the sky, we calculate M⊙. However, this “cluster” mass is unreasonably high according to theoretical halo mass functions at such a redshift (e.g., Behroozi et al., 2019); thus the galaxies in the protocluster likely occupy many smaller satellite halos. Simulations suggest that galaxies in the crowded cores of protoclusters will merge to become the brightest cluster galaxy (BCG) at early times (; Rennehan et al., 2020), but the spatially-wide, non-spherical distribution of galaxies in this reionization-era protocluster does not imply that it is currently approaching any relaxed state. Bearing this in mind, we can still evaluate the protocluster structure in the context of very large halos in the early Universe.
We finally wish to investigate whether the observed distribution of [Oiii]-emitters follows what we would expect from simulations of such massive halos. Cosmological hydrodynamical simulations such as BlueTides (Di Matteo et al., 2017) as well as empirical models such as Trinity (Zhang et al., 2023b) suggest that quasars hosting SMBH masses similar to J03053150 should occupy massive halos on the order of M⊙. We first compare with halos and galaxies in the UniverseMachine mock catalogs based on the Small MultiDark-Planck N-body simulation (SMDPL, box size: 400 Mpc/, particle number: 38403, halo mass limit: 333This halo mass limit roughly corresponds to an [Oiii] line flux of 1042 erg/s, which is our 80% completeness limit. The contribution from low-mass haloes to our measured companion number counts is expected to be small due to decreasing completeness below this limit.; see Klypin et al. 2016) as well as the quasar host halos based on the cosmological zoom-ins from Costa (2023).
6.2.1 UniverseMachine
We use the UniverseMachine (Behroozi et al., 2019) to investigate the properties of galaxies in overdensities within massive halos. Since UniverseMachine does not contain SMBH information and Trinity does not contain star formation histories (and thus ages) of individual galaxies, we use both together. We use the empirical Trinity model (Zhang et al., 2023a) to estimate a distribution of halo masses that could host a quasar with the luminosity and SMBH mass of J03053150. To extract halos from UniverseMachine, we use the grism RMS footprint over the whole mosaic. We convert the RMS to a 5 limiting line flux map by integrating a point source across a 250 km/s linewidth at . We thus extract 187,368 halos with M⊙ containing overdensities of galaxies in order to assess whether the quasar halo hosts an unusual distribution of galaxies compared to other massive halos in the field. UniverseMachine provides, among other quantitites, and star formation histories of the simulated galaxies populating each halo.
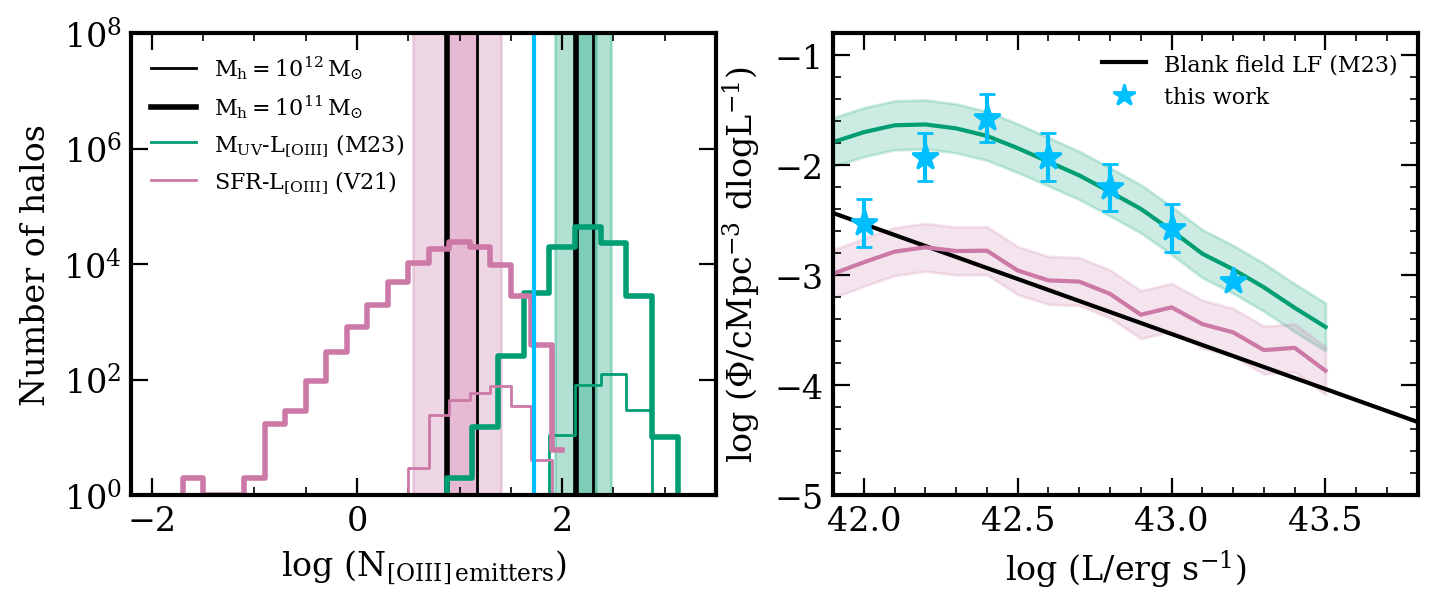
We assign [Oiii] luminosities to the extracted galaxies using two methods: one sampling the (dust-uncorrected) SFR-L relation from Villa-Vélez et al. (2021) and one using the relation from EIGER (Matthee et al., 2023). We find that the two methods result in a wide spread of predicted [Oiii] emitters in our footprint, with the former method predicting companions with log(erg s in a M⊙ halo: a factor of a few below what we observe, but consistent with the blank-field luminosity function from EIGER (Figure 7). The latter method instead predicts companions compared to our observed 53, which again opens the question of suppressed SFR in galaxies exposed to quasar radiation.
Figure 7 shows the median theoretical [Oiii] luminosity function for both methods mentioned above. We plot the LF for galaxies residing in M⊙ halos after applying the same and completeness corrections as we did to our real data. The shape of the completeness-corrected theoretical overdensity LF measured using the EIGER relation closely matches what we observe in the quasar overdensity, that is, a peak in the overdensity around log(erg s and a faint-end turnover. However, the turnover is weaker than what we observe. Modulo small number statistics, we might have expected only a handful more [Oiii]-bright (log (L/erg s 43) galaxies within the quasar overdensity, so the overall paucity of observed [Oiii] emitters compared to the simulation comes from the faint end.
On one hand, we posit that the grism data could be missing a real population of galaxies that are bright in the UV but have intrinsically weaker nebular emission (or patchy dust content obscuring the emission, e.g., Faisst & Morishita, 2024) and scatter below our grism detection limit. On the other hand, there is substantial scatter in the scaling relations used to predict [Oiii] luminosity from the simulated observables, which will particularly impact the steep faint-end of the LF. Indeed, UniverseMachine does not capture the variance of star formation on timescales traced by [Oiii] due to the coarse time resolution; thus it would not capture galaxies bright in the UV but with a recent downturn of star formation resulting in weak [Oiii] emission, i.e. a departure from the canonical or relationships.
6.2.2 Comparing to Costa (2023)
Distinctly, UniverseMachine does not contain black hole physics, so our predictions do not encode any potential baryonic effects induced by the quasars in the center of the simulated fields. We thus also compare to the simulated quasar halos from Costa (2023) who used cosmological zoom-in simulations based on the Millennium dark matter-only simulation, assuming steady-state ISM and star formation physics (Springel & Hernquist, 2003) and the relation from Matthee et al. (2023). Costa (2023) considered low-mass (‘LM’, M⊙) and high-mass (‘HM’, M⊙) quasar host halos and predicted the number counts of high-mass and moderate-mass companions. We can potentially rule out J0305 residing in a HM halo as, even within the variance, that study would predict tens of M⊙ and 1-10 M⊙ companions, while we find only 9 and 0 respectively (see paper II for calculation of stellar masses); this rejection is also supported by Trinity’s prediction of a host halo mass of M⊙. Yet Costa (2023) still predicts high-mass and moderate-mass companions even for the LM halos, while the majority of the galaxies in our sample have relatively low stellar mass (median log ; see Paper II). However, the simulation does not account for strong AGN feedback due to super-Eddington bursts and may not accurately model the dust attenuation, both of which could result in an overprediction of the number of companions. On the other hand, this also suggests that we could be missing more massive galaxies which would only be revealed by deeper and wider NIRCam imaging of LBGs (or ALMA observations targeting FIR lines), or that we are missing some physics governing the evolution of galaxies within overdensities. Indeed, the discovery of massive [Cii] companions (Decarli et al., 2018; Venemans et al., 2019) without [Oiii] counterparts as well as seven LBGs consistent with the quasar redshift supports this argument.
Overall, the faintness of the [Oiii] emitters and the low-mass nature of the companions in the quasar overdensity paints a picture wherein galaxies experience stochastic episodes of star formation, causing galaxies to scatter in and out of the [Oiii] detection limit on the scale of 5–10 Myr (Wilkins et al., 2023; Faisst & Morishita, 2024). The fact that both simulations we compare to here predict a higher population of detectable bright and massive galaxies than what is observed is puzzling, but could be explained if we are not sensitive to massive galaxies with older stars and less [Oiii] emission (e.g., Looser et al., 2023a, b). On the other hand, suppression of lower-mass halos by the central quasar engine could affect the presence of faint [Oiii] emitters close to the quasar, as discussed previously. While UniverseMachine does not resolve halos below M⊙ where suppression should be strongest, the disagreement at the faint end between the observations and the simulation could be ascribed to the lack of strong quasar feedback in the simulation.
In the end, we are dealing with small number statistics in a relatively small area, and the simulations we compare to indeed predict a high amount of variance in the number of companions. The simulated [Oiii] luminosities are highly sensitive to the chosen scaling relation since they are not directly predicted by the simulations, thus it is difficult to predict the absolute number of companions. A larger sample of quasars, both hosting and not hosting overdensities, is required to answer these questions, which will indeed be delivered by the full ASPIRE sample (Wang et al., in prep.; Champagne et al., in prep.)
7 Conclusions
In this work we have characterized a sample of 124 [Oiii] emitters identified in the ASPIRE grism+imaging quasar legacy survey, identified over an area of 35 arcmin2 surrounding the quasar J03053150. 53 of these galaxies are members of a quasar-anchored protocluster at , while 18 and 20 galaxies occupy serendipitously discovered overdensities at and . The remaining galaxies served as a field sample as a comparison between the evolution of galaxies within and without overdensities during the epoch of reionization. We found that:
-
•
The protocluster structure suggested by in Wang et al. (2023) across 3 Mpc in a single NIRCam pointing in fact extends over 10 Mpc within a 35 arcmin2 mosaic. The 53 galaxies at represent an overdensity of . They are distinctly distributed along filaments extending down the line of sight from the quasar.
-
•
The [Oiii] luminosity function in the quasar protocluster has a distinct peak at log(L/erg s-1) = 42.3, with a faint-end turnover that is not due to incompleteness. We suggest that we are missing a population of galaxies with [Oiii] emission just below the grism detection limit since bursty star formation will affect the strength of [Oiii] emission on very short (tens of Myr) timescales.
-
•
There is a dearth of [Oiii] emitters within 80 ckpc from the quasar while there are three massive [Cii] emitters and an LAE; we suggest that this could be due to mergers with the host galaxy, dust extinction, and/or mild suppression of low-mass [Oiii] emitters due to photoionization heating from the quasar.
-
•
After computing the quasar host halo mass from Trinity, we compare our [Oiii] flux distribution with galaxies in similar halos extracted from UniverseMachine and a hydrodynamic zoom-in simulation from Costa (2023). The number of companion galaxies is very sensitive to the scaling relation used to paint on [Oiii] luminosity, but our results are consistent with the protocluster overdensity being weaker than expected. This supports our argument that galaxies with stochastic SFHs are not picked up by this survey and would appear as LBGs with no line emission in a dedicated photometric survey. Indeed, a subset of our NIRCam data is covered by HST which shows 7 LBGs without [Oiii] counterparts but with photometric redshifts consistent with the protocluster; further multiwavelength imaging would be required across the full mosaic field of view to confirm this trend at larger distances.
A larger quasar sample will be presented in future ASPIRE publications which will help build up population statistics for quasar environments. Wang et al. (in prep.) will present the ALMA counterpart to ASPIRE which includes mosaicked 1.1 arcmin 1.1 arcmin Band 6 data in this field targeting dust continuum and [Cii]. In future studies, it will be crucial to obtain better photometric coverage of the rest-optical and NIR emission of many ASPIRE fields, especially through NIRCam medium bands and/or MIRI broadband photometry to probe low-sSFR galaxies not detectable by the grism spectroscopy. It will also be interesting to compare the population of [Oiii] emitters with a follow-up sample of Ly emitters in the same field to assess the correlations between Ly enhancement and high nebular line EW. Paper II (Champagne et al. 2024b) will present detailed SED fitting and an environmental analysis of the [Oiii] emitters identified in this field.
| Name | RA | Dec | log L[OIII] | EW[OIII] | EW[OIII]+Hβ | |
|---|---|---|---|---|---|---|
| (J2000) | (J2000) | 1042 erg s-1 | ||||
| J0305-O3E-PC-001 | 03:05:28.955 | -31:48:55.22 | 6.616 | |||
| J0305-O3E-PC-002 | 03:05:28.724 | -31:49:19.32 | 6.615 | |||
| J0305-O3E-PC-003 | 03:05:28.463 | -31:49:26.41 | 6.621 | |||
| J0305-O3E-PC-004 | 03:05:27.846 | -31:48:58.42 | 6.616 | |||
| J0305-O3E-PC-005 | 03:05:27.226 | -31:49:28.47 | 6.625 | |||
| J0305-O3E-PC-006 | 03:05:26.887 | -31:49:23.75 | 6.614 | |||
| J0305-O3E-PC-007 | 03:05:26.828 | -31:49:59.19 | 6.618 | |||
| J0305-O3E-PC-008 | 03:05:25.235 | -31:50:10.56 | 6.621 | |||
| J0305-O3E-PC-009 | 03:05:24.442 | -31:49:15.83 | 6.614 | |||
| J0305-O3E-PC-010 | 03:05:25.373 | -31:50:57.16 | 6.628 | |||
| J0305-O3E-PC-011 | 03:05:23.246 | -31:47:32.68 | 6.611 | |||
| J0305-O3E-PC-012 | 03:05:24.732 | -31:50:13.34 | 6.623 | |||
| J0305-O3E-PC-013 | 03:05:24.657 | -31:50:25.01 | 6.579 | |||
| J0305-O3E-PC-014 | 03:05:22.216 | -31:48:02.45 | 6.609 | |||
| J0305-O3E-PC-015 | 03:05:22.893 | -31:50:12.74 | 6.622 | |||
| J0305-O3E-PC-016 | 03:05:21.698 | -31:49:36.02 | 6.615 | |||
| J0305-O3E-PC-017 | 03:05:21.478 | -31:49:23.91 | 6.617 | |||
| J0305-O3E-PC-018 | 03:05:21.403 | -31:49:19.96 | 6.615 | |||
| J0305-O3E-PC-019 | 03:05:21.786 | -31:49:52.57 | 6.621 | |||
| J0305-O3E-PC-020 | 03:05:21.820 | -31:50:25.36 | 6.617 | |||
| J0305-O3E-PC-021 | 03:05:22.445 | -31:51:35.27 | 6.652 | |||
| J0305-O3E-PC-022 | 03:05:21.222 | -31:49:59.74 | 6.617 | |||
| J0305-O3E-PC-023 | 03:05:20.596 | -31:49:10.13 | 6.616 | |||
| J0305-O3E-PC-024 | 03:05:21.041 | -31:49:58.66 | 6.618 | |||
| J0305-O3E-PC-025 | 03:05:21.049 | -31:49:58.98 | 6.612 | |||
| J0305-O3E-PC-026 | 03:05:20.424 | -31:49:11.65 | 6.612 | |||
| J0305-O3E-PC-027 | 03:05:18.900 | -31:48:11.61 | 6.609 | |||
| J0305-O3E-PC-028 | 03:05:19.997 | -31:50:19.68 | 6.619 | |||
| J0305-O3E-PC-029 | 03:05:19.972 | -31:50:19.58 | 6.616 | |||
| J0305-O3E-PC-030 | 03:05:19.955 | -31:50:19.26 | 6.624 | |||
| J0305-O3E-PC-031 | 03:05:19.735 | -31:51:38.81 | 6.74 | |||
| J0305-O3E-PC-032 | 03:05:18.612 | -31:50:10.65 | 6.54 | |||
| J0305-O3E-PC-033 | 03:05:18.717 | -31:50:38.77 | 6.619 | |||
| J0305-O3E-PC-034 | 03:05:18.729 | -31:50:38.53 | 6.616 | |||
| J0305-O3E-PC-035 | 03:05:18.499 | -31:50:41.23 | 6.615 |
| Name | RA | Dec | log L[OIII] | EW[OIII] | EW[OIII]+Hβ | |
|---|---|---|---|---|---|---|
| 1042 erg s-1 | ||||||
| J0305-O3E-PC-036 | 03:05:16.291 | -31:49:32.29 | 6.599 | |||
| J0305-O3E-PC-037 | 03:05:17.110 | -31:50:58.24 | 6.632 | |||
| J0305-O3E-PC-038 | 03:05:16.530 | -31:50:22.65 | 6.667 | |||
| J0305-O3E-PC-039 | 03:05:16.794 | -31:50:57.26 | 6.628 | |||
| J0305-O3E-PC-040 | 03:05:15.698 | -31:50:37.57 | 6.616 | |||
| J0305-O3E-PC-041 | 03:05:16.824 | -31:53:27.01 | 6.503 | |||
| J0305-O3E-PC-042 | 03:05:14.691 | -31:53:20.93 | 6.549 | |||
| J0305-O3E-PC-043 | 03:05:13.138 | -31:52:52.45 | 6.67 | |||
| J0305-O3E-PC-044 | 03:05:11.209 | -31:49:43.71 | 6.648 | |||
| J0305-O3E-PC-045 | 03:05:10.353 | -31:49:04.97 | 6.815 | |||
| J0305-O3E-PC-046 | 03:05:10.411 | -31:49:12.04 | 6.627 | |||
| J0305-O3E-PC-047 | 03:05:12.580 | -31:52:52.76 | 6.673 | |||
| J0305-O3E-PC-048 | 03:05:12.990 | -31:53:57.53 | 6.599 | |||
| J0305-O3E-PC-049 | 03:05:10.165 | -31:49:11.53 | 6.755 | |||
| J0305-O3E-PC-050 | 03:05:11.348 | -31:52:17.67 | 6.517 | |||
| J0305-O3E-PC-051 | 03:05:10.246 | -31:52:00.90 | 6.596 | |||
| J0305-O3E-PC-052 | 03:05:11.455 | -31:54:02.57 | 6.593 | |||
| J0305-O3E-PC-053 | 03:05:07.985 | -31:49:11.78 | 6.748 |
References
- Angulo et al. (2012) Angulo, R. E., Springel, V., White, S. D. M., et al. 2012, MNRAS, 425, 2722, doi: 10.1111/j.1365-2966.2012.21783.x
- Arita et al. (2023) Arita, J., Kashikawa, N., Matsuoka, Y., et al. 2023, ApJ, 954, 210, doi: 10.3847/1538-4357/ace43a
- Bañados et al. (2013) Bañados, E., Venemans, B., Walter, F., et al. 2013, ApJ, 773, 178, doi: 10.1088/0004-637X/773/2/178
- Bañados et al. (2016) Bañados, E., Venemans, B. P., Decarli, R., et al. 2016, ApJS, 227, 11, doi: 10.3847/0067-0049/227/1/11
- Bañados et al. (2023) Bañados, E., Schindler, J.-T., Venemans, B. P., et al. 2023, ApJS, 265, 29, doi: 10.3847/1538-4365/acb3c7
- Behroozi et al. (2019) Behroozi, P., Wechsler, R. H., Hearin, A. P., & Conroy, C. 2019, MNRAS, 488, 3143, doi: 10.1093/mnras/stz1182
- Bertin et al. (2020) Bertin, E., Schefer, M., Apostolakos, N., et al. 2020, in Astronomical Society of the Pacific Conference Series, Vol. 527, Astronomical Data Analysis Software and Systems XXIX, ed. R. Pizzo, E. R. Deul, J. D. Mol, J. de Plaa, & H. Verkouter, 461
- Bosman et al. (2020) Bosman, S. E. I., Kakiichi, K., Meyer, R. A., et al. 2020, ApJ, 896, 49, doi: 10.3847/1538-4357/ab85cd
- Boyett et al. (2024) Boyett, K., Bunker, A. J., Curtis-Lake, E., et al. 2024, arXiv e-prints, arXiv:2401.16934, doi: 10.48550/arXiv.2401.16934
- Brammer et al. (2008) Brammer, G. B., van Dokkum, P. G., & Coppi, P. 2008, ApJ, 686, 1503, doi: 10.1086/591786
- Champagne et al. (2023) Champagne, J. B., Casey, C. M., Finkelstein, S. L., et al. 2023, ApJ, 952, 99, doi: 10.3847/1538-4357/acda8d
- Champagne et al. (2018) Champagne, J. B., Decarli, R., Casey, C. M., et al. 2018, ApJ, 867, 153, doi: 10.3847/1538-4357/aae396
- Chen (2020) Chen, H. 2020, ApJ, 893, 165, doi: 10.3847/1538-4357/ab80c6
- Chiang et al. (2017) Chiang, Y.-K., Overzier, R. A., Gebhardt, K., & Henriques, B. 2017, ApJ, 844, L23, doi: 10.3847/2041-8213/aa7e7b
- Costa (2023) Costa, T. 2023, arXiv e-prints, arXiv:2308.12987, doi: 10.48550/arXiv.2308.12987
- Costa et al. (2014) Costa, T., Sijacki, D., Trenti, M., & Haehnelt, M. G. 2014, MNRAS, 439, 2146, doi: 10.1093/mnras/stu101
- Cucciati et al. (2018) Cucciati, O., Lemaux, B. C., Zamorani, G., et al. 2018, A&A, 619, A49, doi: 10.1051/0004-6361/201833655
- Dannerbauer et al. (2014) Dannerbauer, H., Kurk, J. D., De Breuck, C., et al. 2014, A&A, 570, A55, doi: 10.1051/0004-6361/201423771
- Decarli et al. (2018) Decarli, R., Walter, F., Venemans, B. P., et al. 2018, ApJ, 854, 97, doi: 10.3847/1538-4357/aaa5aa
- Di Matteo et al. (2017) Di Matteo, T., Croft, R. A. C., Feng, Y., Waters, D., & Wilkins, S. 2017, MNRAS, 467, 4243, doi: 10.1093/mnras/stx319
- Eilers et al. (2024) Eilers, A.-C., Mackenzie, R., Pizzati, E., et al. 2024, arXiv e-prints, arXiv:2403.07986, doi: 10.48550/arXiv.2403.07986
- Eldridge & Stanway (2022) Eldridge, J. J., & Stanway, E. R. 2022, ARA&A, 60, 455, doi: 10.1146/annurev-astro-052920-100646
- Endsley et al. (2021) Endsley, R., Stark, D. P., Chevallard, J., & Charlot, S. 2021, MNRAS, 500, 5229, doi: 10.1093/mnras/staa3370
- Endsley et al. (2023a) Endsley, R., Stark, D. P., Whitler, L., et al. 2023a, MNRAS, 524, 2312, doi: 10.1093/mnras/stad1919
- Endsley et al. (2023b) —. 2023b, arXiv e-prints, arXiv:2306.05295, doi: 10.48550/arXiv.2306.05295
- Faisst & Morishita (2024) Faisst, A. L., & Morishita, T. 2024, arXiv e-prints, arXiv:2402.13316, doi: 10.48550/arXiv.2402.13316
- Fan et al. (2023) Fan, X., Bañados, E., & Simcoe, R. A. 2023, ARA&A, 61, 373, doi: 10.1146/annurev-astro-052920-102455
- Farina et al. (2017) Farina, E. P., Venemans, B. P., Decarli, R., et al. 2017, ApJ, 848, 78, doi: 10.3847/1538-4357/aa8df4
- Finkelstein (2016) Finkelstein, S. L. 2016, PASA, 33, e037, doi: 10.1017/pasa.2016.26
- Finkelstein et al. (2015) Finkelstein, S. L., Ryan, Russell E., J., Papovich, C., et al. 2015, ApJ, 810, 71, doi: 10.1088/0004-637X/810/1/71
- Gaia Collaboration (2020) Gaia Collaboration. 2020, VizieR Online Data Catalog, I/350
- García-Vergara et al. (2017) García-Vergara, C., Hennawi, J. F., Barrientos, L. F., & Rix, H.-W. 2017, ApJ, 848, 7, doi: 10.3847/1538-4357/aa8b69
- Hill et al. (2020) Hill, R., Chapman, S., Scott, D., et al. 2020, MNRAS, 495, 3124, doi: 10.1093/mnras/staa1275
- Kashikawa et al. (2007) Kashikawa, N., Kitayama, T., Doi, M., et al. 2007, ApJ, 663, 765, doi: 10.1086/518410
- Kashino et al. (2022) Kashino, D., Lilly, S. J., Matthee, J., et al. 2022, arXiv e-prints, arXiv:2211.08254, doi: 10.48550/arXiv.2211.08254
- Kim et al. (2009) Kim, S., Stiavelli, M., Trenti, M., et al. 2009, ApJ, 695, 809, doi: 10.1088/0004-637X/695/2/809
- Klypin et al. (2016) Klypin, A., Yepes, G., Gottlöber, S., Prada, F., & Heß, S. 2016, MNRAS, 457, 4340, doi: 10.1093/mnras/stw248
- Lambert et al. (2024) Lambert, T. S., Assef, R. J., Mazzucchelli, C., et al. 2024, arXiv e-prints, arXiv:2402.06870, doi: 10.48550/arXiv.2402.06870
- Looser et al. (2023a) Looser, T. J., D’Eugenio, F., Maiolino, R., et al. 2023a, arXiv e-prints, arXiv:2302.14155, doi: 10.48550/arXiv.2302.14155
- Looser et al. (2023b) —. 2023b, arXiv e-prints, arXiv:2306.02470, doi: 10.48550/arXiv.2306.02470
- Lupi et al. (2023) Lupi, A., Quadri, G., Volonteri, M., Colpi, M., & Regan, J. A. 2023, arXiv e-prints, arXiv:2312.08422, doi: 10.48550/arXiv.2312.08422
- Lupi et al. (2022) Lupi, A., Volonteri, M., Decarli, R., Bovino, S., & Silk, J. 2022, MNRAS, 510, 5760, doi: 10.1093/mnras/stac014
- Matthee et al. (2023) Matthee, J., Mackenzie, R., Simcoe, R. A., et al. 2023, ApJ, 950, 67, doi: 10.3847/1538-4357/acc846
- Mazzucchelli et al. (2017a) Mazzucchelli, C., Bañados, E., Decarli, R., et al. 2017a, ApJ, 834, 83, doi: 10.3847/1538-4357/834/1/83
- Mazzucchelli et al. (2017b) Mazzucchelli, C., Bañados, E., Venemans, B. P., et al. 2017b, ApJ, 849, 91, doi: 10.3847/1538-4357/aa9185
- Mazzucchelli et al. (2023) Mazzucchelli, C., Bischetti, M., D’Odorico, V., et al. 2023, A&A, 676, A71, doi: 10.1051/0004-6361/202346317
- Meyer et al. (2022) Meyer, R. A., Decarli, R., Walter, F., et al. 2022, ApJ, 927, 141, doi: 10.3847/1538-4357/ac4f67
- Muldrew et al. (2015) Muldrew, S. I., Hatch, N. A., & Cooke, E. A. 2015, MNRAS, 452, 2528, doi: 10.1093/mnras/stv1449
- Ota et al. (2018) Ota, K., Venemans, B. P., Taniguchi, Y., et al. 2018, ApJ, 856, 109, doi: 10.3847/1538-4357/aab35b
- Overzier (2016) Overzier, R. A. 2016, A&A Rev., 24, 14, doi: 10.1007/s00159-016-0100-3
- Overzier et al. (2009) Overzier, R. A., Guo, Q., Kauffmann, G., et al. 2009, MNRAS, 394, 577, doi: 10.1111/j.1365-2966.2008.14264.x
- Pensabene et al. (2024) Pensabene, A., Cantalupo, S., Cicone, C., et al. 2024, arXiv e-prints, arXiv:2401.04765, doi: 10.48550/arXiv.2401.04765
- Rennehan et al. (2020) Rennehan, D., Babul, A., Hayward, C. C., et al. 2020, MNRAS, 493, 4607, doi: 10.1093/mnras/staa541
- Rojas-Ruiz et al. (2024) Rojas-Ruiz, S., Mazzucchelli, C., Finkelstein, S. L., et al. 2024, arXiv e-prints, arXiv:2404.02960, doi: 10.48550/arXiv.2404.02960
- Satyavolu et al. (2022) Satyavolu, S., Kulkarni, G., Keating, L. C., & Haehnelt, M. G. 2022, arXiv e-prints, arXiv:2209.08103, doi: 10.48550/arXiv.2209.08103
- Springel & Hernquist (2003) Springel, V., & Hernquist, L. 2003, MNRAS, 339, 289, doi: 10.1046/j.1365-8711.2003.06206.x
- Sun et al. (2023) Sun, F., Egami, E., Pirzkal, N., et al. 2023, ApJ, 953, 53, doi: 10.3847/1538-4357/acd53c
- Toshikawa et al. (2024) Toshikawa, J., Wuyts, S., Kashikawa, N., et al. 2024, arXiv e-prints, arXiv:2404.15910, doi: 10.48550/arXiv.2404.15910
- Venemans et al. (2019) Venemans, B. P., Neeleman, M., Walter, F., et al. 2019, ApJ, 874, L30, doi: 10.3847/2041-8213/ab11cc
- Venemans et al. (2016) Venemans, B. P., Walter, F., Zschaechner, L., et al. 2016, ApJ, 816, 37, doi: 10.3847/0004-637X/816/1/37
- Venemans et al. (2013) Venemans, B. P., Findlay, J. R., Sutherland, W. J., et al. 2013, ApJ, 779, 24, doi: 10.1088/0004-637X/779/1/24
- Venemans et al. (2020) Venemans, B. P., Walter, F., Neeleman, M., et al. 2020, ApJ, 904, 130, doi: 10.3847/1538-4357/abc563
- Villa-Vélez et al. (2021) Villa-Vélez, J. A., Buat, V., Theulé, P., Boquien, M., & Burgarella, D. 2021, A&A, 654, A153, doi: 10.1051/0004-6361/202140890
- Volonteri et al. (2021) Volonteri, M., Habouzit, M., & Colpi, M. 2021, Nature Reviews Physics, 3, 732, doi: 10.1038/s42254-021-00364-9
- Wang et al. (2021) Wang, F., Fan, X., Yang, J., et al. 2021, ApJ, 908, 53, doi: 10.3847/1538-4357/abcc5e
- Wang et al. (2023) Wang, F., Yang, J., Hennawi, J. F., et al. 2023, ApJ, 951, L4, doi: 10.3847/2041-8213/accd6f
- Whitler et al. (2022) Whitler, L., Stark, D. P., Endsley, R., et al. 2022, arXiv e-prints, arXiv:2206.05315. https://arxiv.org/abs/2206.05315
- Wilkins et al. (2023) Wilkins, S. M., Lovell, C. C., Vijayan, A. P., et al. 2023, MNRAS, 522, 4014, doi: 10.1093/mnras/stad1126
- Yang et al. (2019) Yang, J., Wang, F., Fan, X., et al. 2019, AJ, 157, 236, doi: 10.3847/1538-3881/ab1be1
- Yang et al. (2023) —. 2023, ApJ, 951, L5, doi: 10.3847/2041-8213/acc9c8
- Zana et al. (2023) Zana, T., Carniani, S., Prelogović, D., et al. 2023, arXiv e-prints, arXiv:2309.03940, doi: 10.48550/arXiv.2309.03940
- Zhang et al. (2023a) Zhang, H., Behroozi, P., Volonteri, M., et al. 2023a, MNRAS, 518, 2123, doi: 10.1093/mnras/stac2633
- Zhang et al. (2023b) —. 2023b, arXiv e-prints, arXiv:2309.07210, doi: 10.48550/arXiv.2309.07210