A Compact, Low-cost Force and Torque Sensor for Robot Fingers
with LED-based Displacement Sensing
Abstract
Force/torque sensing is an important modality for robotic manipulation, but commodity solutions, generally developed with other applications in mind, do not generally fit the needs of robot hands. This paper introduces a novel method for six-axis force/torque sensing, using LEDs to sense the displacement between two plates connected by a transparent elastomer. Our method allows for finger-size packaging with no amplification electronics, low cost manufacturing, and easy integration into a complete hand. On test forces between 0-2 N, our prototype sensor exhibits a mean error between 0.05 and 0.07 N across the three force directions, suggesting future applicability to fine manipulation tasks.
Index Terms:
Force/Torque Sensing, Robot Hand, Robotic ManipulationI Introduction
Force and torque (F/T) measurements are useful for dexterous manipulation [1, 2, 3, 4, 5], as integrating an F/T sensor into the fingers can either replace or complement tactile sensors. While tactile sensors convey either the exact location of contact or a pressure map, often with some information about contact force and area, an F/T sensor only provides a net wrench. In an ideal world, tactile sensors could thus render F/T sensors redundant, but, as tactile sensors offering full fingertip coverage are still not ubiquitous technology, F/T sensors can still have a role to play in robot fingers.
However, F/T sensors are primarily developed with industrial applications in mind [6, 7, 8], leading to limitations when being used for dexterous manipulation. Manipulation often benefits from compliance [9, 10, 11, 12], whereas most F/T sensors are optimized to be as stiff as possible, thus requiring precision engineering and leading to a high cost. Industrial applications also tend to favor a higher resolution than is needed for manipulation, but compromise by limiting the overload protection [6]. This leads to sensors that are easily damaged in the uncertain environments that robotics need to interact with. Finally, off-the-shelf F/T sensors can be difficult to package and integrate into the hand [13, 14, 15]. Others have attempted to solve this problem by designing sensors for manipulations to be placed within the fingertips [16, 17, 18, 19]. This limits the design of the finger to the needs of the sensor, and can also limit the inclusion of other modalities within the finger.
We thus set out to build an F/T sensor that addresses the needs of robotic manipulation. First, such a sensor must be easy to manufacture using low-cost components and processes, so that it is affordable and practical to include multiple in a multi-fingered hand. Second, it must have the size and profile suited for the base of a fingertip, which will increase ease of integration into a hand. This also frees up the finger design for alternate sensors, or allows more flexibility in design of a finger for manipulation. Third, some amount of compliance could be beneficial to manipulation, and thus there is no need to avoid compliance at all cost. Finally, the ideal sensor would have a Signal to Noise Ratio (SNR) that allows it to be useful for manipulation without sacrificing overload protection.
To that end, we develop a novel F/T sensor based on light transport. Our sensor consists of two plates, connected by an elastomeric layer allowing 6 Degrees of Freedom (DOF) between them. To measure this displacement, we use a network of LEDs on each plate as both light emitters and light receivers. As the plates shift relative to each other due to an externally applied wrench, the signal measured by the receivers changes due to the relative movement and positioning of the emitters. This allows us to track the displacement, which can be used as a proxy for 6-axis F/T between the two plates. We map the change in signal from the light receivers to F/T signal using a neural network. Overall, our primary contributions are:
-
•
To the best of our knowledge, we are introducing a novel modality for F/T sensing, using LEDs to track the displacement between plates and mapping the signal to force and torque.
-
•
Our method results in a compact, low-cost F/T sensor that is compliant, easy to integrate in robot fingers, and has an observed resolution of .06 N and 2.6 N-mm.
| Modality | Cost | Size |
Min Forces
and Torques |
Max Forces
and Torques |
Accuracy (R2) | Bandwidth | ||||||||||||||||||||||
|---|---|---|---|---|---|---|---|---|---|---|---|---|---|---|---|---|---|---|---|---|---|---|---|---|---|---|---|---|
| Barometer [20] | $20 |
|
|
|
|
50 Hz | ||||||||||||||||||||||
| Camera [21] | $40 |
|
|
|
|
25 Hz | ||||||||||||||||||||||
| Camera [18] | $400 |
|
Not reported |
|
|
40 Hz | ||||||||||||||||||||||
| Capacitance [19] | $100 |
|
|
|
|
200 Hz |
II Related Work
In Table 1, we organize other low-cost F/T sensors developed to address the needs in manipulation. For example, Guggenheim et al. embedded barometers in a rubber flexure and placed them between two rigid plates [20]. These plates are relatively large with the length and width being 75mm. The size is constrained by the number of barometer modules needed to get full 6-axis forces and torques.
Camera-based sensors are more compact as they only need a single camera module, but require a completely translucent or hollow flexure. Some low-cost F/T sensors use small cameras to track the displacement of a marker fixed on some flexure. Ouyang et al. suspended a fiducial marker above a small camera module, using a compression spring as the flexure [21]. However, this design requires a relatively tall structure at 51mm. The Visiflex, a camera-based F/T sensor developed by Fernandez et al., is much more compact [18]. However, it only tracks forces and torques applied directly on the surface of the sensor. Therefore, contact anywhere else on the manipulator will not be sensed. In contrast, Kim et al. developed a very compact and capable F/T sensor using cylindrical capacitors [19]. The overall package of the sensor is very small, especially compared to the other low-cost sensors listed in Table I. While force range is high, torque range is limiting, as is the absolute accuracy reported.
Overall, we note that different sensors in Table I shine in different respects. In this context, the method introduced in this paper allows for compact size (27mm diameter and 20mm height), high bandwidth (2.5KHz) and high absolute accuracy, at a low manufacturing cost ($100 in small quantities). We have not yet investigated maximum forces and overload protection, as these are highly depended on the geometry of the sensor and can thus be further optimized. Overall, we believe each of these technologies holds promise for advancing manipulation, and different sensors will suit different use cases and application scenarios.
III Sensor Concept
F/T sensors, at a high level, measure displacement between two rigid plates. This displacement can be measured through a variety of different electronic modalities. The rigid plates are fixed with some electronics that allow us to measure very small displacements and map them back to the force and torques applied. These plates are then attached to each other by some flexure.
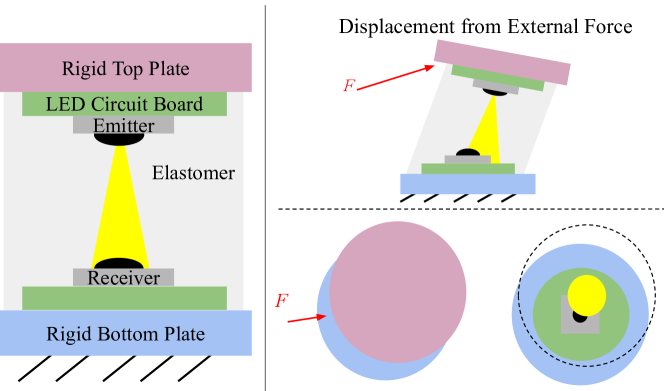
As shown in Fig. 2, the electronics fixed to each rigid plates in our sensor will be a circuit boards with receiving and emitting LEDs. The plates are then suspended in a solid cylinder of PDMS that will allow for elastic displacements. At a neutral position, the emitter LED and the receiving LED are directly above each other. When an external force is applied, the plates will displace relative to each other and the cone of the emitting LED will change how it shines on the receiving LED. This will yield a change in signal resulting from a displacement, which was induced by some force. We will then use a data-driven approach to map this change in LED signal to the force applied.
PDMS enables us to use light as a sensing modality due to its low attenuation. Light offers three primary advantages. First, it provides a fast response time, as photodiode readings are gated by the ADC rather than the diodes. Second, its components require minimal space, which aids with reducing our footprint. Third, we can select LEDs in the IR spectrum, making the sensor resistant to the majority of environment noise that light based sensors suffer from without the need to design a cover or skin.
Using LEDs as both a receiver and emitter gives us several advantages over the other modalities menioned in Table I. Photodiodes have both a photoconductive mode (operating the diode via reverse-biased) which provides higher response time and a photovoltaic mode (operating the diode with zero-bias) which minimizes noise due to dark current. Since photovoltaic mode is well within the response range and time we need, we opt for that in order to minimize the noise and help maximize SNR. The decision between LEDs and Photodiodes was made based on 3 factors. 1) LEDs have a smaller form factor than most photodiodes in the price range. 2) LEDs are optimized for operation in their wavelength range, minimizing noise from external sources. 3) LEDs have a smaller viewing angle, which is useful for increasing sensitivity given our size constraints.
IV Analysis of Single Emitter-Receiver Pair
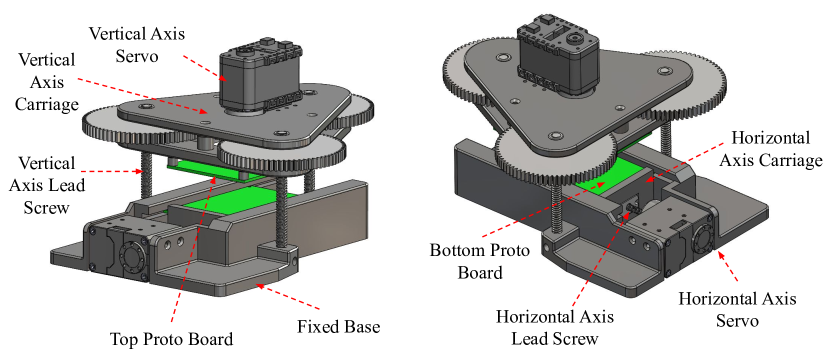
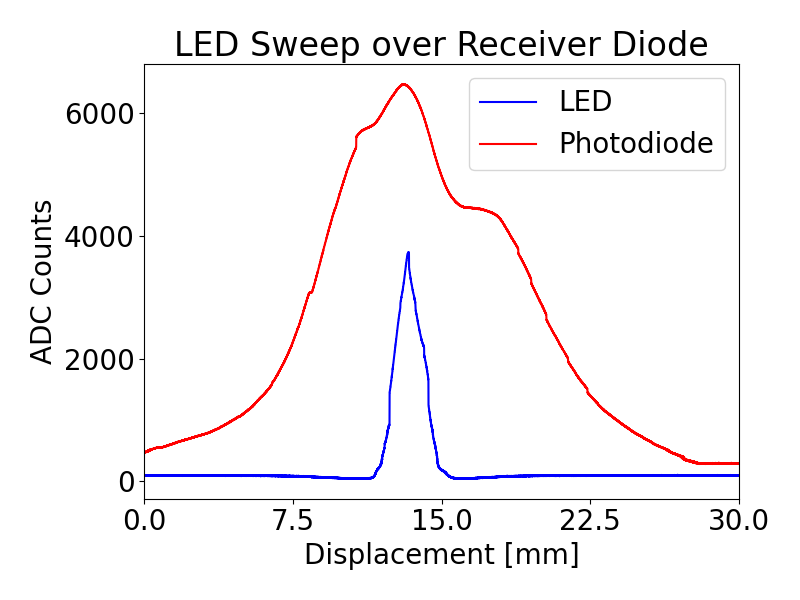
We started with tests to verify both the validity of LEDs as a basic building block, and the assumptions that LEDs would be better suited for our purposes than photodiodes. We created simple test boards with single LEDs as emitters, single LEDs as receivers, and photodiodes as receivers. We attached them to a servo-driven testing rig, shown in Fig. 3, which allowed us to measure the signal change over a horizontal and vertical displacement. By using lead screws and precise servos, we were able to test displacements as small as 0.1mm. This process revealed that the LED-to-LED pairing was sufficiently sensitive, especially to small displacements. In fact, both its sensitivity and its Signal to Noise Ratio (SNR) was higher than the photodiode, with a much sharper detection cone.
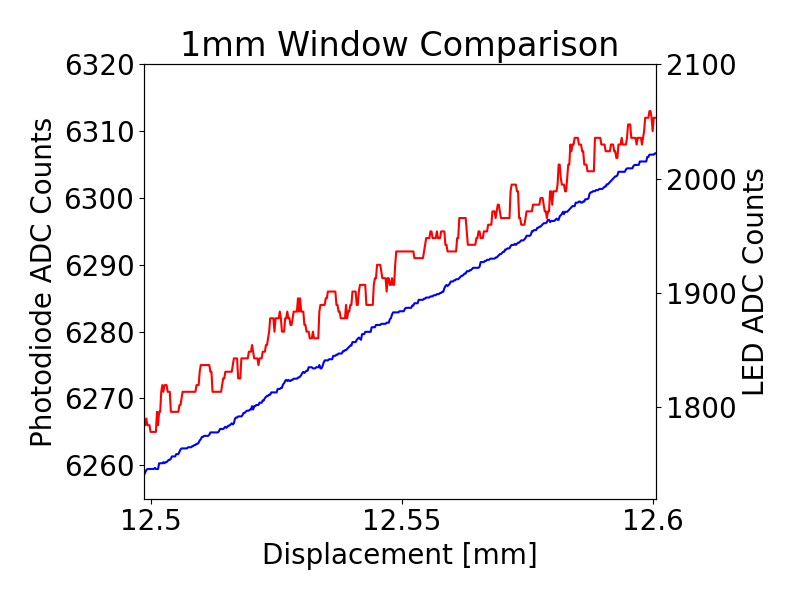
To understand the effect PDMS would have on our signal, we needed a different approach, since the LEDs could not be freely displaced as with air. Instead, for our receiver board, we used an array of LEDs mounted every 2.5mm, and measured how the cone shifted from air to PDMS. Since PDMS has a larger index of refraction relative to air, our assumption under Snell’s Law was that this would lead to a smaller cone with a sharper signal concentrated on a smaller area. What we found is that not only was the signal decreasing due to attenuation, we also measured a wider emission cone than in air. This informed our decision to switch LEDs to one with an even narrower cone, so that our cone would be in the desired width in PDMS. Overall, our LED-to-LED testing revealed that using LEDs as both emitters and receivers leads to a high signal-to-noise ratio that is capable of distinguishing displacement below .1mm and will be a good choice for our F/T sensor.
V Complete Sensor Design
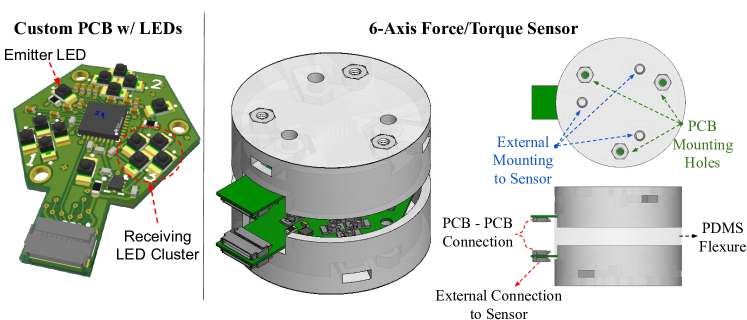
With the core concept verified, we implement a preliminary design for the sensor. As we wanted to mount this at the base of a finger, we constrained our design to a 1 inch (25.4 mm) diameter. The goal was to maximize the amount of data signals within the space. The primary size constraint became the op-amps, which meant we could support a maximum of 12 signals per board. As shown in the left of Fig. 5, we divided the signals into clusters of 4 receivers, so that each board had 3 clusters, for a total of 24 signals broken across 12 clusters. We now must suspend the PCB boards above each other and attach them with an elastic flexure.
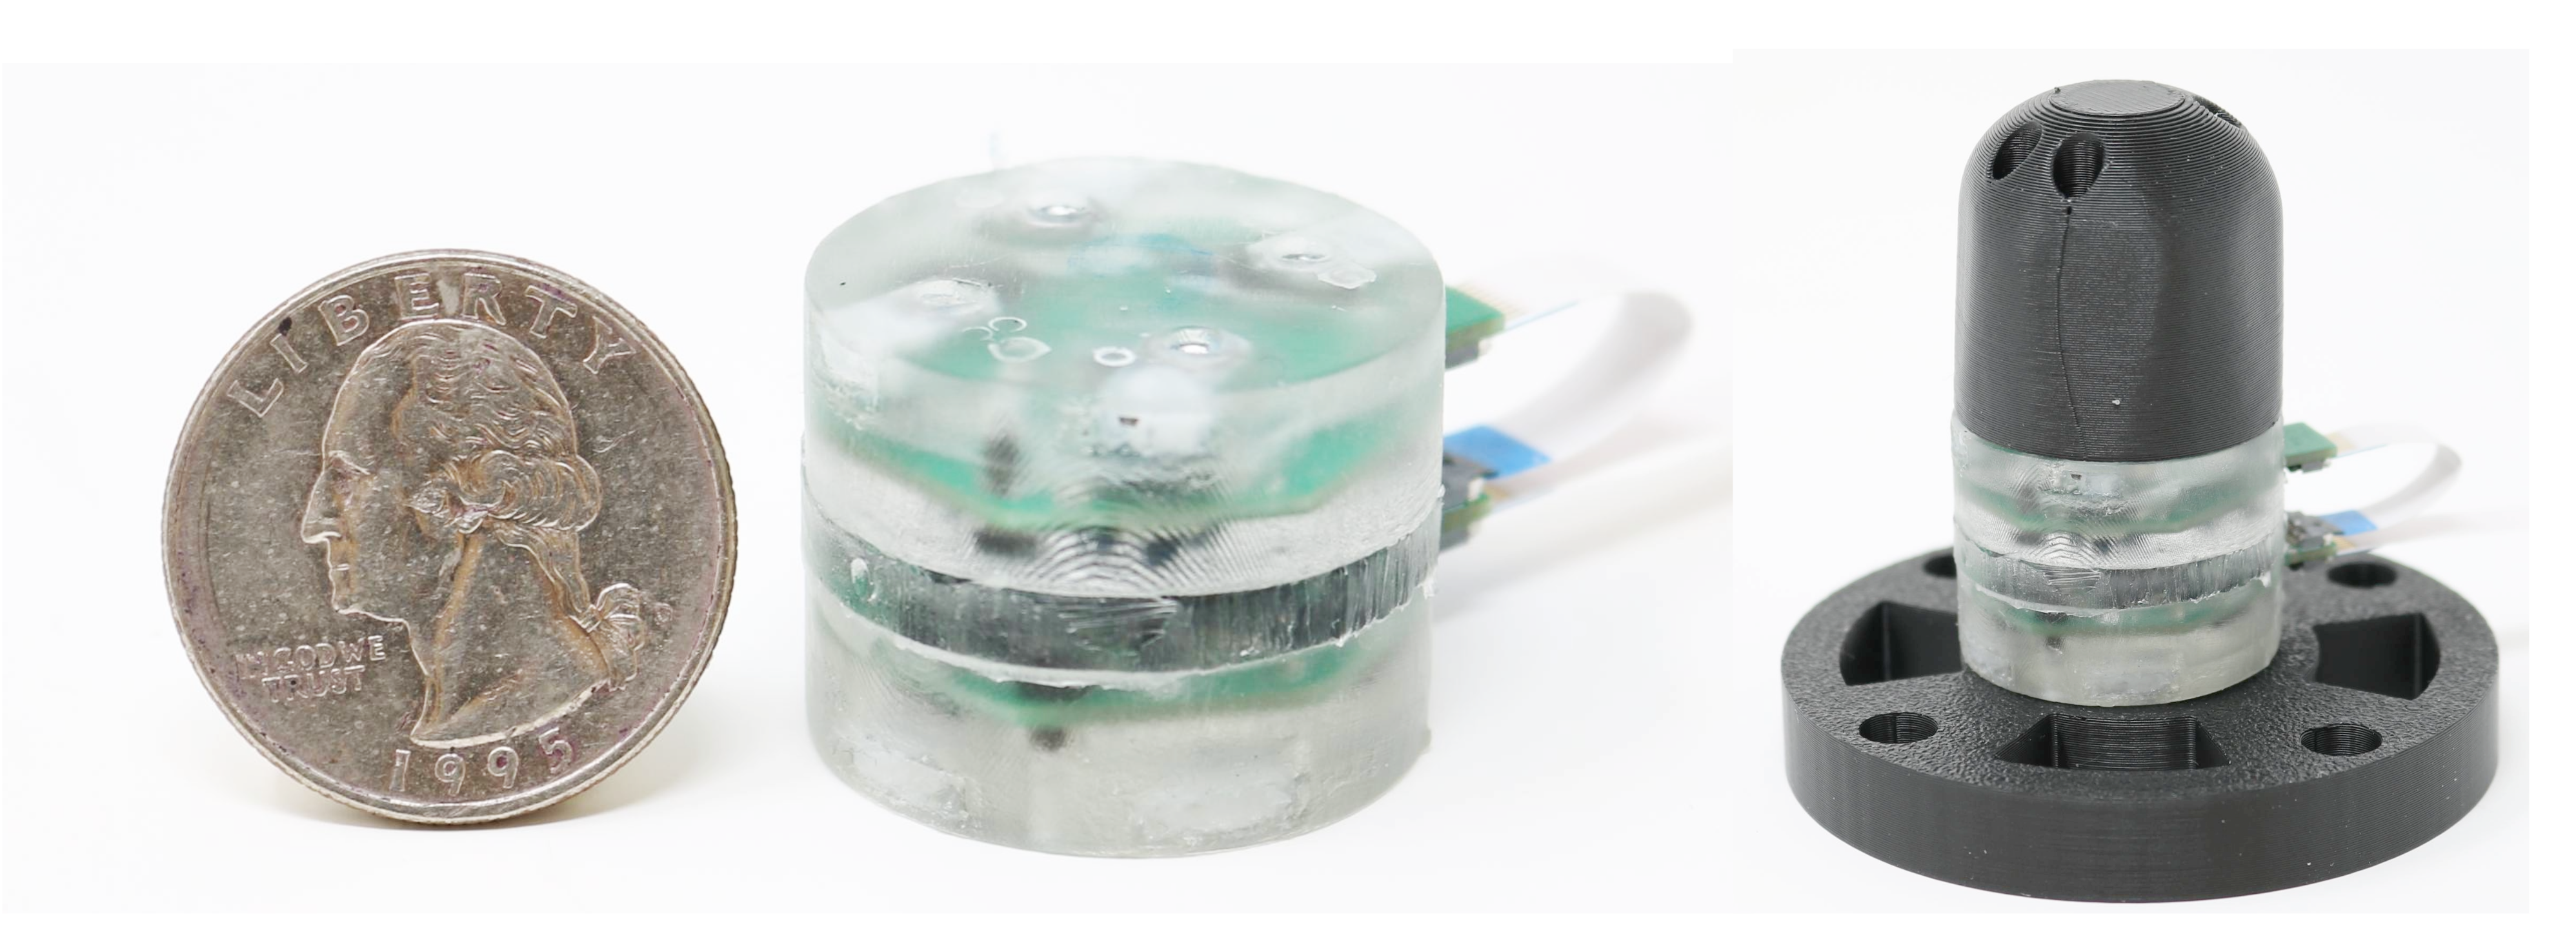
We fasten the bottom and top PCB boards, as shown in Fig. 5, each to a rigid, 3-D printed plate. The plates each have three M2 inserts that we can mount external hardware too. We use these inserts to attach these rigid plates to a mold that we then fill with an uncured mixture of PDMS. We cure the filled mold at for 8 hours, which gives us the sensor shown in Fig. 5 and 1. The overall dimensions of the sensor is 20.82mm in height and a diameter of 27mm, which is just above our target diameter.
Mechanically, our biggest concerns related to the stiffness of PDMS and sheer resistance. The PDMS needed to be compliant enough to displace at low forces, but stiff enough to survive the larger forces. We cured the PDMS at a 10:1 ratio of base to curing agent, as we observed this best achieved the desired sensor stiffness and surface finish. We observed that the PDMS does not adhere well to the PCB face, which makes the sensor vulnerable to shear failure. To address this issue, we treated the PCB boards with silicone primer to promote strong adhesion between the PDMS and PCB faces. We also added a lip to the rigid plates that helps prevent the PDMS from shearing off of the PCB faces.
Our electronics also need to take into account concerns with integration in a robot hand. To that end, we want to minimize the number of signals transmitted between the board and the controller. Using an on-board ADC provides four advantages: 1) It allows for higher quality signals than utilizing the built-in ADCs on the microcontroller. 2) It allows us to use SPI protocol with only 7 wires. This also enables chaining of the top plate and bottom plate of the sensor using the SPI protocol. 3) It allows us to only transmit digital signals across the cables, minimizing transmission noise. 4) We maintain higher response time by avoiding external multiplexing.
VI Experiments
VI-A Data Collection
To gather the dataset, we mounted a 3D-printer, finger on top of the sensor and contacted it from all around its circumference. The sensor was attached to an ATI SI-130-10 for ground truth labels. The dataset gathered for this paper focused exclusively on forces coming horizontally at the finger, rather than vertically at the finger tip. Each data file consists of three contacts within a 20 second span. It included a range of forces at each height to ensure that force and torque were decoupled. The dataset focused on forces primarily between 0-2N and torques between 0-.2Nm, but contained data expanding all the way up to 10N of force.
We selected 10 contact locations, spaced equally around the circumference of the finger. At each location, we collected data for 15 different contacts. Every set of three contacts was collected at different heights between the top, middle, and bottom of the finger, and focused on a different force range, to ensure full coverage. Forces were grouped into below 1N, around 1N, and around 2N, with 3 contacts for each force grouping followed by 6 more contacts split randomly between them. Contacts were done by pushing against the finger for between 2 and 5 seconds. For the test set, this process was repeated, but with only 1 contact per surface for each force grouping. The test set was randomly split across the height groupings to be representative of the different torque-force pairings.
During data collection, the sensor was measured sending data slightly upwards of 2.5KHz, but data was collected at 500Hz due to the limitations of the Virtual Machines used for data collection. We also observed that, for this version of the sensor, 4 LED signals exhibited high noise level, likely an artifact of traces along the PCB. The signals were thus dropped from the dataset during training. This left the model with 20 signals to learn from rather than the full 24. Resolving the electrical issues that caused these noisy signals is one of the areas for improvement.
VI-B Learning Algorithms
Before training the model, we filtered our data with a 45 Width Median Filter to reduce noise. The ground truth data was filtered via a 13 width Median Filter. Given our rate of 500Hz, this introduces under a tenth of a second delay. Additionally, we threshold all data points with a total force magnitude below .1N as ”no contact” when training our model. To prevent dataset over saturation of ”no contact” points, we down-sampled these points so they only comprise 10% of the training data. Additionally, rather than training directly on the raw signals, we trained the model on the change in signals, with respect to a no-contact baseline taken as the mean of 50 points from the start of the each data file. Finally, both features and labels are normalized around a mean of 0 and a standard deviation of 1.
For all experiments on the sensor, we use feed forward neural network architectures. The model consists of 6 layers with ReLU activation functions, broken up evenly between shared layers and 6 output heads, 1 for each of the 6 Force and Torque DOFs. The 3 shared layers were all size 128, while the output heads layers were 64, 32, then 1. The final layer does not have an activation function. We use mean squared error as a loss function. The network is trained for 50 epochs with ADAMoptimizer, a batch size of 2000 and an initial learning rate of 0.001. Additionally, the model reported on here uses time series data. Data from the four most recent time-steps are concatenated into a single linear input before being fed into the model.
VI-C Results and Discussion
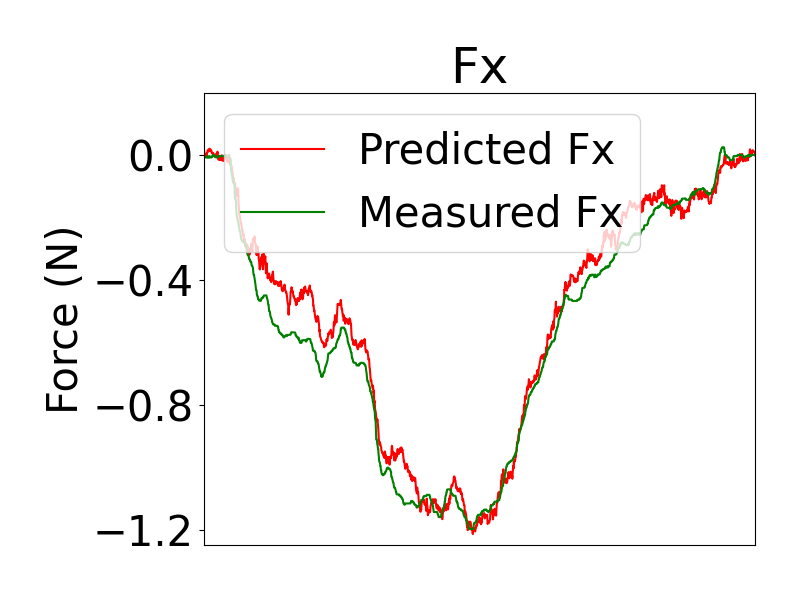
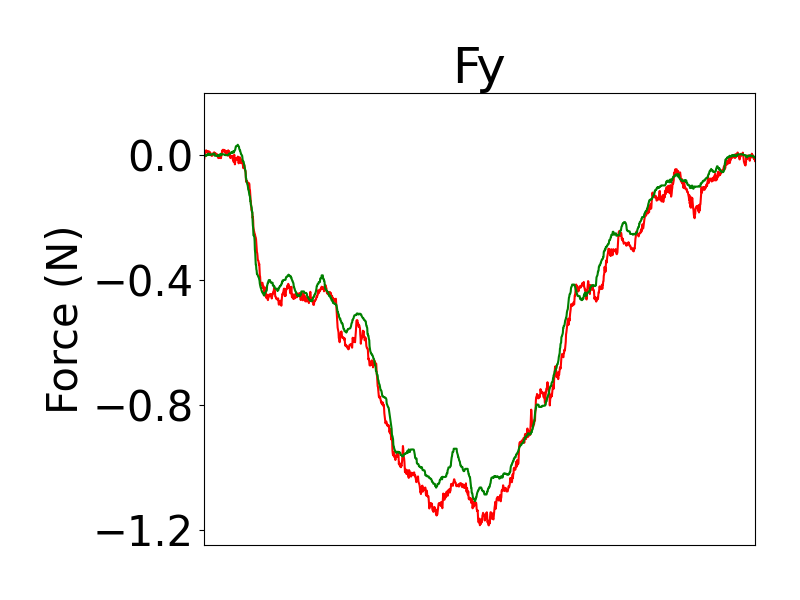
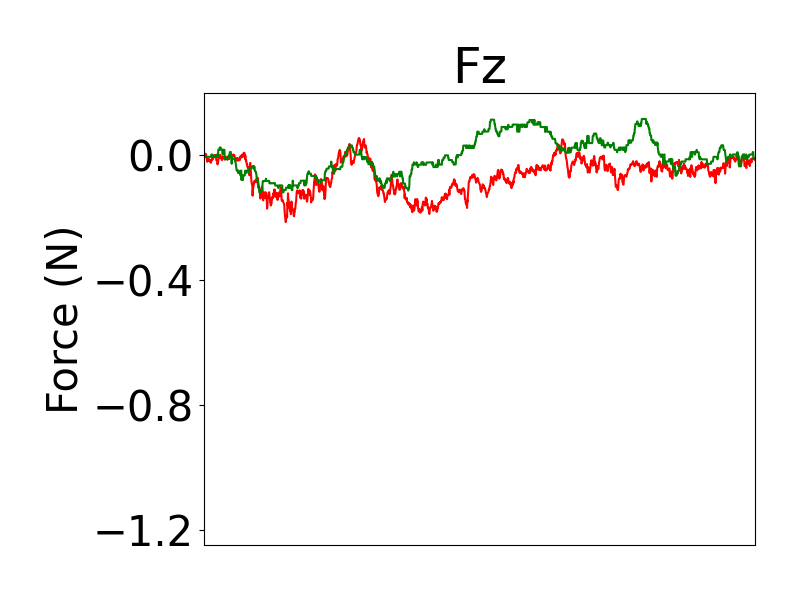
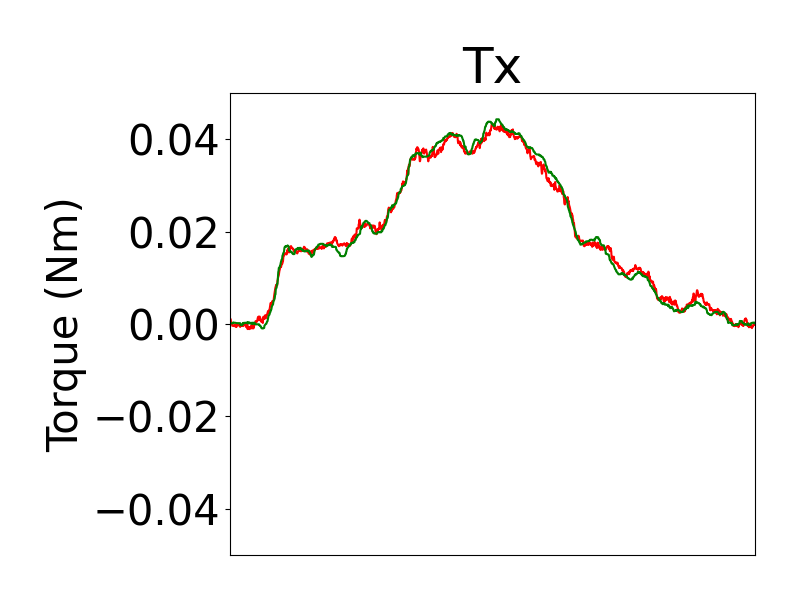
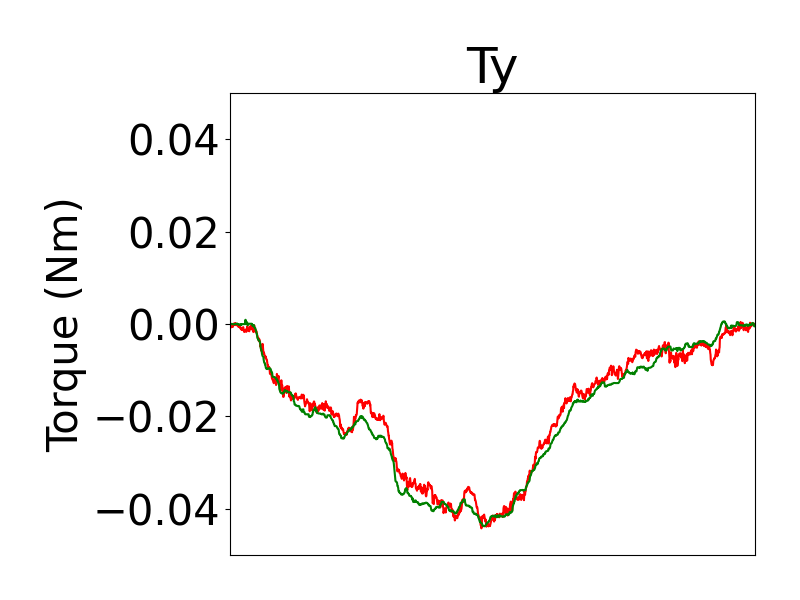
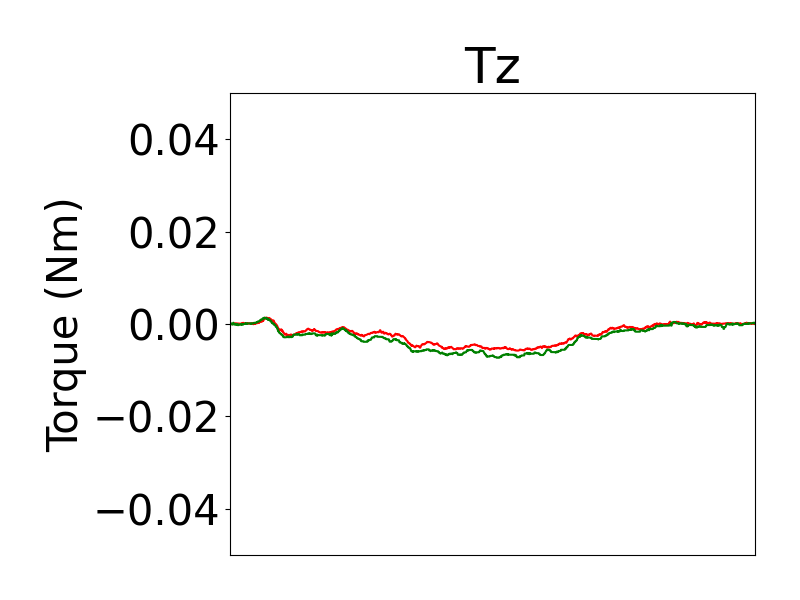
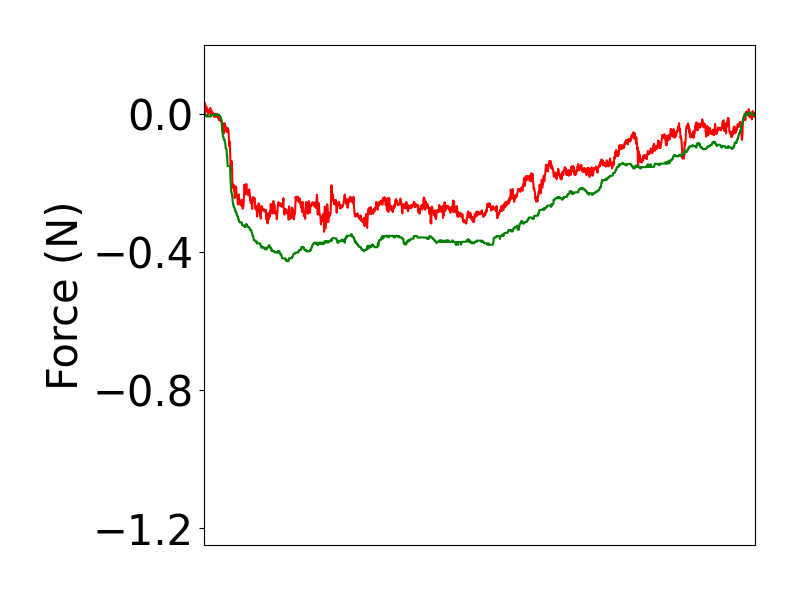
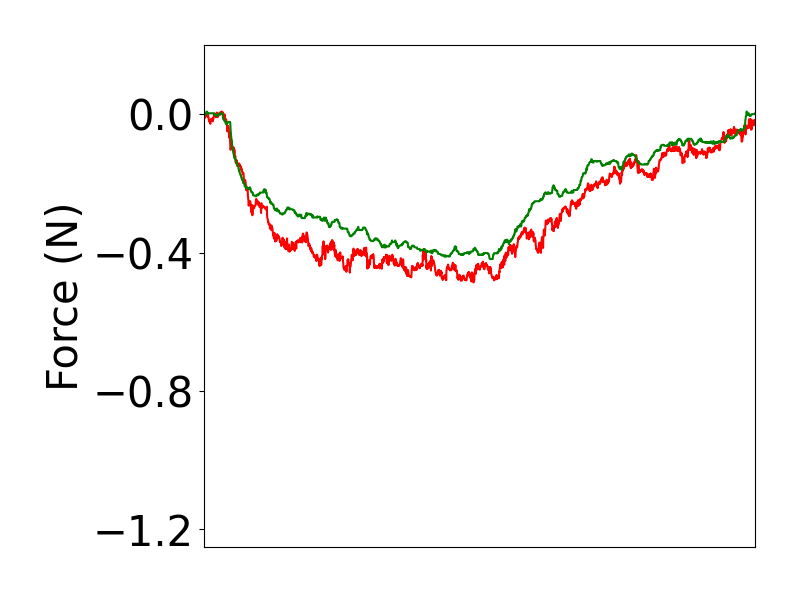
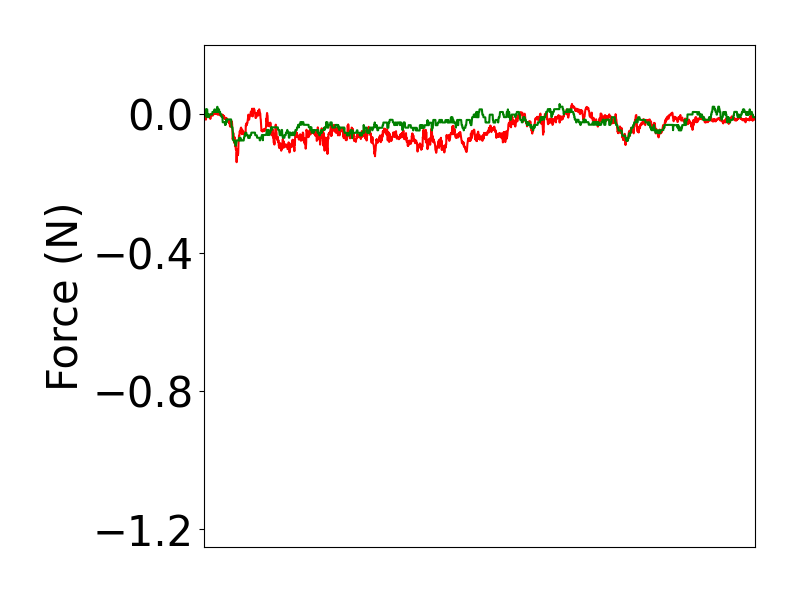
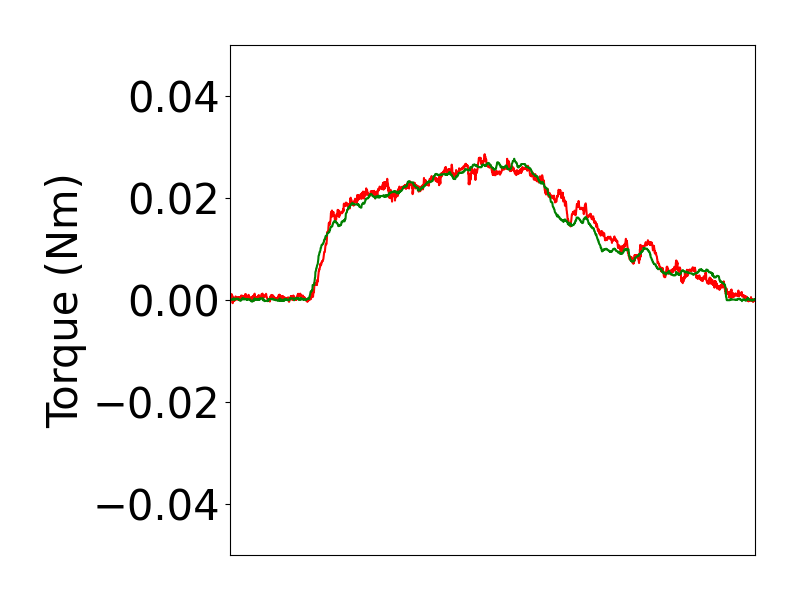
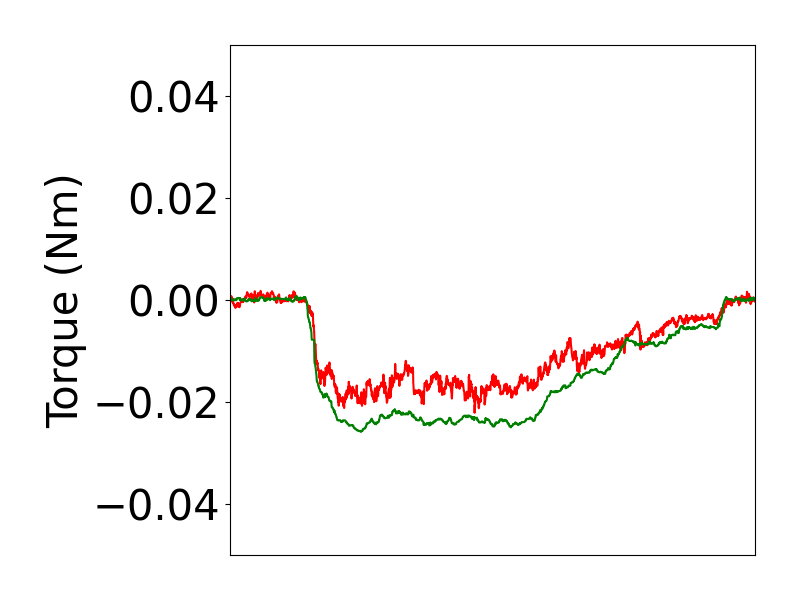
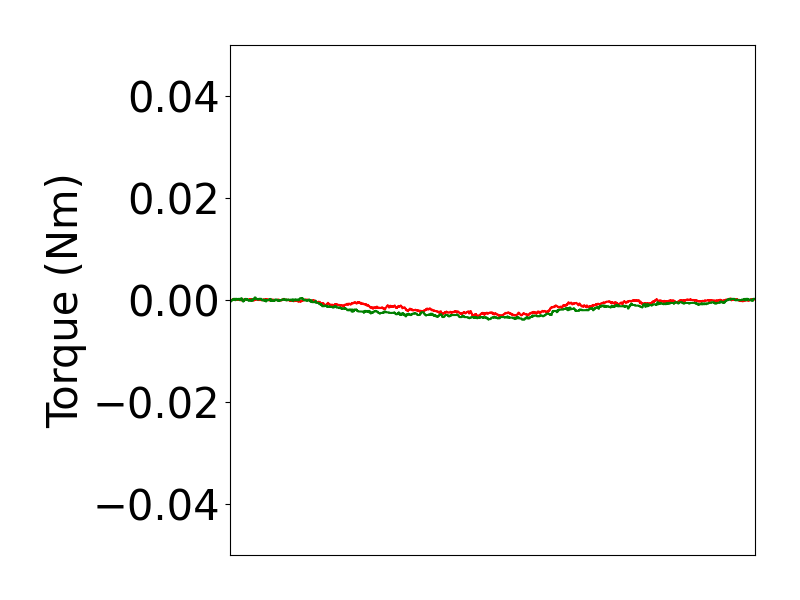
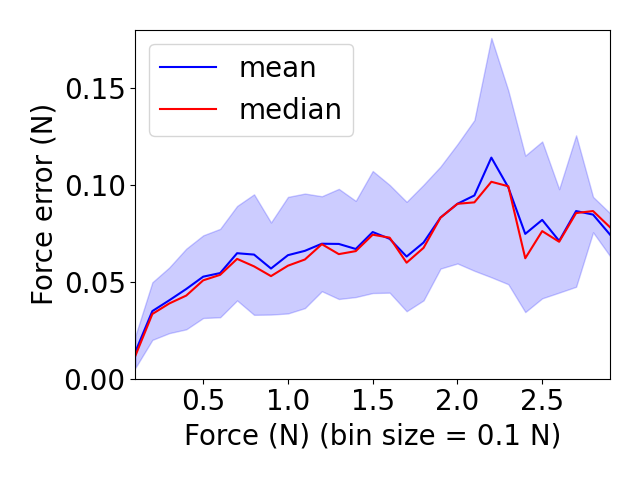
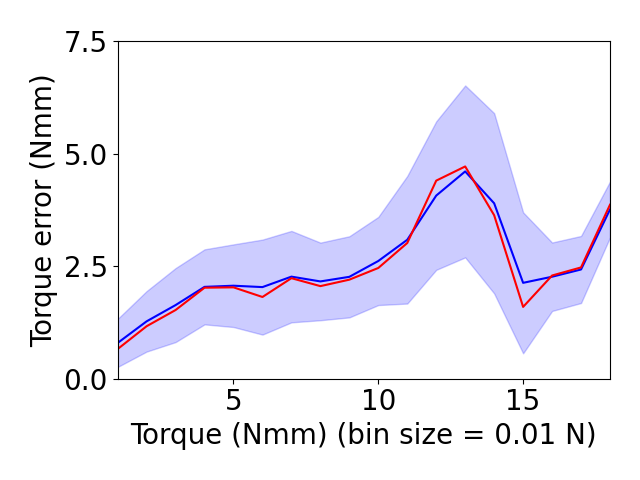
The overall results of our sensor are shown in Table II and Figure 7. In particular, Table II show the performance for each direction of force and torque, as well as overal force and torque magnitude. Figure 7 plots mean absolute error as a function of applied force/torque. In addition, Figure 6 illustrates the performance of the sensor in detail using all six force/torque dimensions over two contacts, different in terms of the quality of the model fit.
We observe that the sensor provides accurate measurements in both force and torque for the x and y axes, but less so for the z axis. Noise levels are generally low, and predictions are accurate in terms of overall force magnitude, but can occasionally suffer from accuracy at higher forces in individual DOFs. We note again that the test data consisted of contacts never seen in training. The model was evaluated primarily on the 0-2N range of forces, but experimentation showed that training on data that extended beyond this range proved useful for the models learning.
| Variable | Mean Abs. Error | Std. Dev. | R2 |
| Force x (N) | .0560 | .0714 | .990 |
| Force y (N) | .0533 | .0687 | .993 |
| Force z (N) | .0690 | .0890 | .560 |
| Force magnitude (N) | .0640 | .0801 | .978 |
| Torque x (Nmm) | 2.62 | 3.45 | .995 |
| Torque y (Nmm) | 2.68 | 3.41 | .991 |
| Torque z (Nmm) | .636 | .730 | .923 |
| Torque magnitude (Nmm) | 2.90 | 3.85 | .986 |
We believe that one likely source of error is hysteresis introduced by the PDMS. This is particularly prevalent with larger forces, where signals will take some time to settle back to their baselines, which introduces noise to forces done before the resettling. It also introduces noise into the zero-force data. The physical sensors also introduced light bleed and reflections that were not present in our test set ups. With the wider emission cones caused by the PDMS, signals from emitters which were supposed to be picked up only by the cluster directly opposite of them were bleeding onto the other clusters. Additionally, the emitters were reflecting back onto the board they were on, creating signal even if only one board was powered. We believe that future versions of our sensor could leverage this effect to help increase z-sensitivity as we train more deliberately for Fz and Tz in the future.
We also verified our assumption that noisy raw LED signals are harmful to learning, by trained models with and without the 4 such signals observed to exhibit high noise. We found that the model without any of the 4 most noisy signals learned best. This leaves us optimistic that developing a version with the noise reduced via improved traces will lead to better predictions. Future versions will also analyze the possibility of removing some of the LEDs to shrink the overall form factor.
VII Conclusion and Future Work
In this paper, we introduce a new method for building low-cost, compliant 6-axis F/T sensors designed to meet the needs for integration into robot hands. Our method relies on sensing the displacement between two sensor plates, each mounted with LEDs acting as light emitter or receivers. We analyzed such an LED-LED pair in isolation, and found it to be highly sensitive to relative displacements of the emitter and the receiver. We thus designed a sensor with 6 LEDs acting as emitters and 24 LEDs acting as receivers, distributed between the top and bottom plates of the sensor.
We showed that a simple supervised learning model trained on data from the 24 receiver LEDs can learn to map changes in these signals to external forces and torques applied between the two plates via the induced displacements. The sensor output was particularly accurate for force/torques along/around the x and y axes, with additional work needed to improve sensitivity for the z axis.
Future work of the sensor falls under two categories: further improvement of the sensor, and implementation within actual use cases. Sensor improvement in turn will have mechanical, electronic, and learning components. Mechanically, we would like to increase the overload protection, reduce hysteresis, and ensure more consistency in the parts for better alignment. Electronically, we will continue to look for sources of noise in LED signals. We also want to minimize the form factor as much as possible, so further experiments would include use of fewer LEDs in each cluster (or potentially even fewer clusters). Learning wise, we will further tune the model as we gather more data for Z axis and explore alternate architectures with both time series and single-snapshot models.
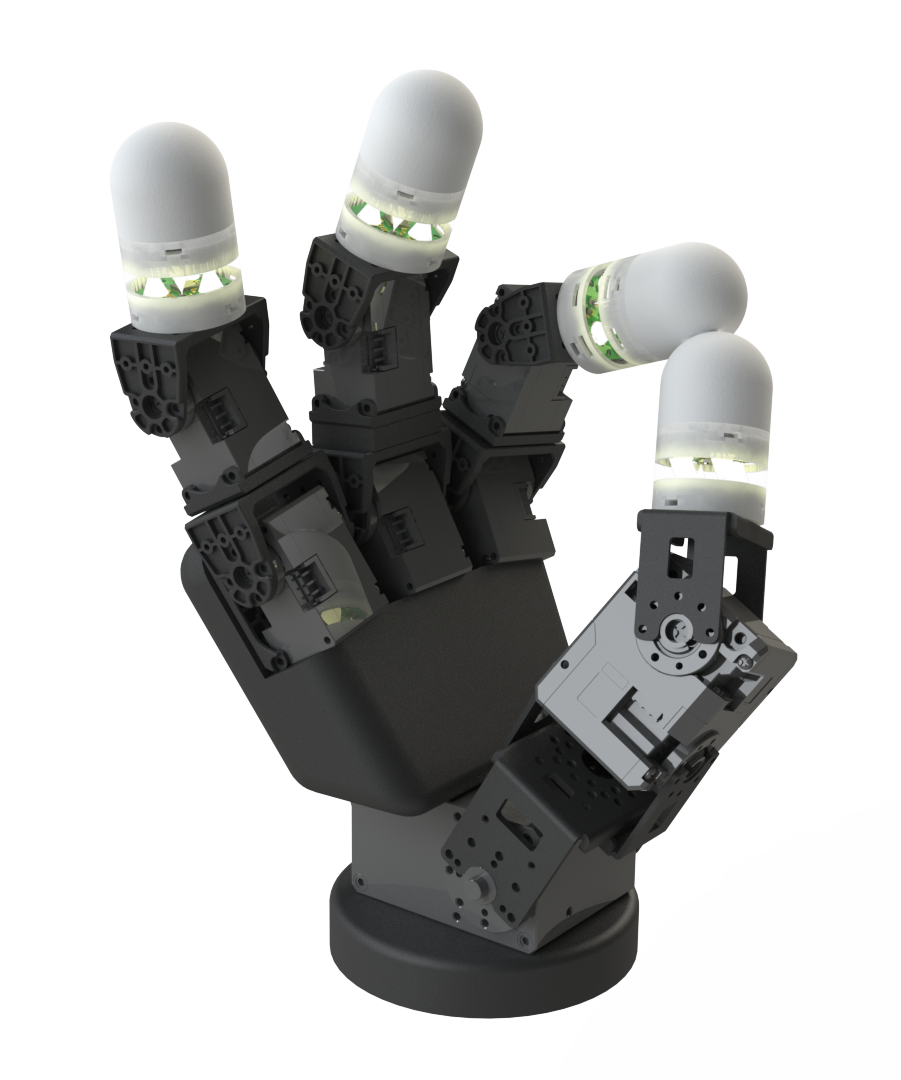
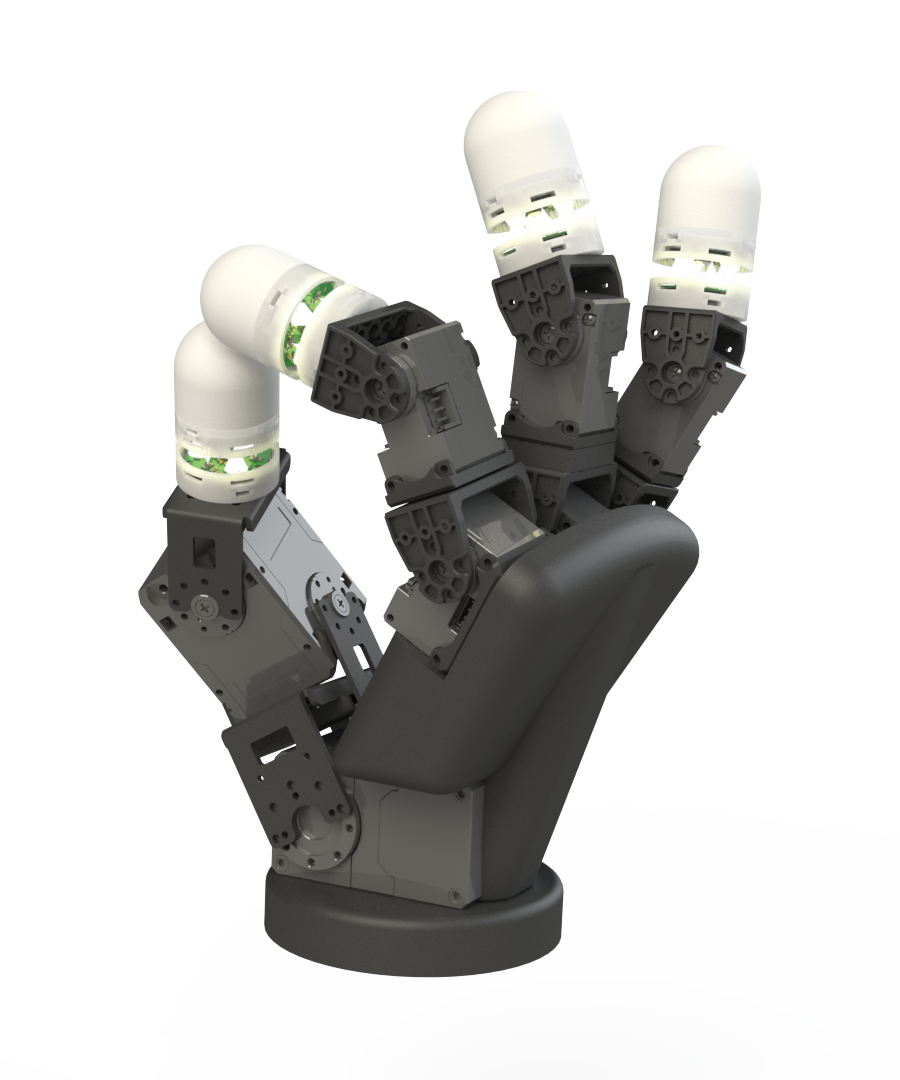
For deployment of the sensor, we look to take advantage of the features of the sensor which make it particularly attractive for integration in robot hands. In particular, the form factor and ease of integration (the sensor directly connects to a microcontroller board with no additional amplification electronics) are highly appealing. Figure 8 shows a possible design of an anthropomorphic hand with one of our sensors at the base of the distal phalanx of each finger. Such integration will also allow us to test the hypothesis that slight compliance in the sensing element can prove beneficial, or at least non-detrimental, to dexterous manipulation.
As motor learning for dexterous manipulation makes continuous advances, we believe that sensing will prove key for future performance of robot hands. Having a multitude of sensors at our disposal, each with various strengths, will increase the ability of combining the right sensor with the right motor learning method to achieve novel capabilities. We hope that the sensing method presented here represents a step in this direction.
References
- [1] L. Gao, P. Lee, and R. Bai, “Learning dexterous manipulation from human demonstrations for robotic in-hand manipulation tasks,” IEEE Robotics and Automation Letters, vol. 5, no. 2, pp. 3015–3022, 2020.
- [2] H. Liu, Z. Li, and D. Sun, “Multi-sensory robotic systems for dexterous manipulation: A survey,” IEEE/ASME Transactions on Mechatronics, vol. 24, no. 2, pp. 457–470, 2019.
- [3] J. Maurice, P. Letier, F. Flacco, and A. De Luca, “Machine learning techniques for estimating object manipulation forces from force/torque sensor data,” in Proceedings of the 2022 IEEE International Conference on Robotics and Automation (ICRA), 2022, pp. 5600–5606.
- [4] O. Leslie, D. Córdova Bulens, and S. J. Redmond, “Design, fabrication, and characterization of a novel optical six-axis distributed force and displacement tactile sensor for dexterous robotic manipulation,” Sensors, vol. 23, no. 24, p. 9640, 2023.
- [5] S. Pirozzi, G. Carbone, and F. Mangione, “Design and calibration of a force/tactile sensor for dexterous manipulation,” Sensors, vol. 19, no. 4, p. 966, 2019.
- [6] A. Jafari and N. G. Tsagarakis, “Force/torque sensors: From industrial robotics to human-robot interaction,” IEEE Robotics and Automation Magazine, vol. 27, no. 2, pp. 34–43, 2020.
- [7] K. Min, F. Ni, and H. Liu, “An efficient and accurate force/torque sensing method based on an excitation trajectory,” Industrial Robot, vol. ahead-of-print, 2023.
- [8] D. Yamamoto, S. Shirogane, and S. Sugano, “Development of force/torque sensor with omni-directional multi-axis load detection for dexterous robotic hands,” Sensors and Actuators A: Physical, vol. 317, p. 112478, 2021.
- [9] R. Chi and A. Dollar, “On dexterity and dexterous manipulation,” Frontiers in Robotics and AI, 2021.
- [10] M. Hughes et al., “A hybrid robotic gripper for dexterous manipulation with compliance,” International Journal of Robotics Research, 2023.
- [11] W. Zhu et al., “A soft-rigid hybrid gripper with lateral compliance and dexterous in-hand manipulation,” arXiv preprint arXiv:2110.10035, 2021.
- [12] M. Tavakoli et al., “A novel type of compliant and underactuated robotic hand for dexterous manipulation,” IEEE Transactions on Robotics, 2014.
- [13] X. Zhang and F. Gao, “Design of new-style six-dimension force sensor system for robot finger,” Journal of Transducer Technology, vol. 22, no. 9, pp. 22–27, 2003.
- [14] S. Pirozzi, “Design and calibration of a force/tactile sensor for dexterous manipulation,” Sensors, vol. 19, no. 4, p. 966, 2019.
- [15] S. Ong and S. Phee, “Force sensors for dexterous manipulation in robotics,” Sensors and Actuators A, vol. 134, pp. 42–50, 2006.
- [16] H. Wang, “A fingertip force sensor for underwater dexterous hand,” Journal of Mechanical Science and Technology, vol. 37, pp. 1159–1172, 2023.
- [17] K. Wu et al., “Research of a novel miniature tactile sensor for five-finger dexterous robot hand,” in IEEE International Conference on Mechatronics and Automation. IEEE, 2010, pp. 422–427.
- [18] A. J. Fernandez, H. Weng, P. B. Umbanhowar, and K. M. Lynch, “Visiflex: A low-cost compliant tactile fingertip for force, torque, and contact sensing,” IEEE Robotics and Automation Letters, vol. 6, no. 2, pp. 3009–3016, 2021.
- [19] U. Kim, H. Jeong, H. Do, J. Park, and C. Park, “Six-axis force/torque fingertip sensor for an anthropomorphic robot hand,” IEEE Robotics and Automation Letters, vol. 5, no. 4, pp. 5566–5572, 2020.
- [20] J. W. Guggenheim, L. P. Jentoft, Y. Tenzer, and R. D. Howe, “Robust and inexpensive six-axis force–torque sensors using mems barometers,” IEEE/ASME Transactions on Mechatronics, vol. 22, no. 2, pp. 838–844, 2017.
- [21] R. Ouyang and R. D. Howe, “Low-cost fiducial-based 6-axis force-torque sensor,” in 2020 IEEE International Conference on Robotics and Automation (ICRA). IEEE, 2020, pp. 1653–1659.