Probabilistic Allocation of Payload Code Rate and Header Copies in LR-FHSS Networks
Abstract
We evaluate the performance of the LoRaWAN Long-Range Frequency Hopping Spread Spectrum (LR-FHSS) technique using a device-level probabilistic strategy for code rate and header replica allocation. Specifically, we investigate the effects of different header replica and code rate allocations at each end-device, guided by a probability distribution provided by the network server. As a benchmark, we compare the proposed strategy with the standardized LR-FHSS data rates DR8 and DR9. Our numerical results demonstrate that the proposed strategy consistently outperforms the DR8 and DR9 standard data rates across all considered scenarios. Notably, our findings reveal that the optimal distribution rarely includes data rate DR9, while data rate DR8 significantly contributes to the goodput and energy efficiency optimizations.
Index Terms:
LR-FHSS, Internet-of-Things, Machine-Type Communications.I Introduction
The rapid growth of Internet of Things (IoT) spurred applications across diverse domains, including agriculture, industry, environmental monitoring, and smart cities [1, 2], each with its own unique set of requirements. Within this diverse ecosystem, one particularly challenging scenario is related to massive IoT (mIoT). This involves applications that support a vast number of network devices with constraints of low power consumption and complexity, while tolerating reduced data rates [3, 4]. In response to these demands, Low-Power Wide Area Networks (LPWANs) emerge as a collection of technologies designed to meet mIoT requirements. LPWANs enable long-distance communication that is also energy-efficient, aligning with the goals of mIoT [5, 6, 7, 8].
Among various alternatives for addressing such challenging scenarios, LoRa emerges as a remarkable solution [9, 10]. This technology, patented by Semtech [11], utilizes Chirp Spread Spectrum (CSS) and achieves a balance between data rate and receiver sensitivity through the use of different spreading factors [12]. Moreover, LoRa typically operates within a star topology under the LoRaWAN protocol [13, 14]. In this architecture, the end-devices communicate directly with a gateway using an Aloha-based protocol, which operates without any collision prevention mechanism.
A recent expansion of the LoRaWAN specification [15] has incorporated the Long Range Frequency Hopping Spread Spectrum (LR-FHSS) technique in the uplink to support an increased number of end-devices [16, 17], with improved robustness to interference [18]. LR-FHSS, which falls into the category of Telegram Splitting Multiple Access (TSMA) techniques [19], divides the coded payload into small segments known as fragments, which are then transmitted in a pseudo-random fashion across various frequency hops. Additionally, prior to the transmission of payload fragments, multiple replicas of the header are sent using different frequencies [20]. This strategy exploits diversity to improve the packet transmission success rate, while maintaining similar, if not larger, communication range as in standard LoRa [21].
The LR-FHSS modulation has recently gained significant attention due to its relevance in the scope of mIoT [16, 22, 23, 20, 24, 25, 26, 27]. An initial study of the LR-FHSS performance is reported in [16], demonstrating that this technique outperforms conventional LoRa CSS modulation in massive network scenarios. Furthermore, an analytical approach to derive the outage probability of LR-FHSS in Direct-to-Satellite (DtS) networks is presented in [22], considering diverse effects related to the wireless medium. The authors highlight a significant performance improvement in terms of network capacity compared to the conventional LoRa. Additionally, the packet delivery rate using analytical and simulation models is investigated in [23], emphasizing the impact of the header success probability on the overall reliability of LR-FHSS.
Several approaches have been explored to enhance the performance of LR-FHSS networks. In the context of satellite networks, the trajectory information is leveraged in [20] to propose uplink transmission policies that improve network scalability. Meanwhile, the authors in [24] focus on developing an accurate framing scheme for LR-FHSS, in which a robust signal detector is proposed for the receiver. Additionally, the work in [25] delves into different coded frequency hopping designs, incorporating segment-level coding with erasure detection. This enhancement improves the resilience against clustered errors that can be commonly encountered in LR-FHSS, ultimately enhancing communication reliability.
Given that the LR-FHSS protocol is built upon Aloha with message replication [28], strategies to improve the performance of any Aloha-based network could also prove beneficial within the context of LR-FHSS. Recently, [26] has considered the asynchronous contention resolution diversity Aloha protocol to mitigate collisions. The proposed scheme demonstrates significant improvements in various network performance metrics. Furthermore, considering the dominant role of headers in the overall system performance, a network-coded-aided inter-header combination scheme is proposed in [27]. The method aims at increasing header protection against both erasures and collisions, resulting in important improvements in terms of packet error rate under several scenarios.
Most of the literature, as well as the LR-FHSS specification, exploit message replication for improved performance. Against this background, and considering the benefits of irregular repetition strategies in Aloha networks [29], which exploit the diversity of repetition strategies among end-devices, we propose a device-level probabilistic strategy for payload code rate and header replica allocation. In this approach, we define a varied set of replicas and code rate configurations for end-devices, aiming to improve key network performance indicators such as goodput and energy efficiency in IoT applications with numerous users. The end-devices randomly select configuration setups for each transmission based on a probability distribution provided by the network server. An important aspect of this work is that we consider only the code rates available in current LR-FHSS-enabled chipsets, ensuring compatibility with the existing infrastructure. Moreover, it is worth mentioning that the proposed method can be incorporated into any of the previously mentioned related works.
The contributions of this work can be summarized as:
-
•
We analyze the impact of different probabilistic configurations (in terms of payload code rate and header replicas) in the network goodput and energy efficiency, for different numbers of end-devices and payload sizes.
-
•
Through an extensive analysis, we show that the proposed probabilistic approach outperforms the standardized data rates, both in terms of goodput and energy efficiency.
-
•
The proposed approach achieves near-optimal results with low quantization resolution of the probability distribution, demonstrating that only three bits of feedback at the downlink are sufficient to inform the end-devices.
II Preliminaries
LR-FHSS is a modulation technique recently added to the LoRaWAN specification [25]. Its primary purpose is to enhance uplink capacity, allowing improved performance in dense networks served by a single gateway, such as the case of DtS IoT networks [30]. In LR-FHSS, the total available bandwidth is segmented into many multiple physical channels, each with a bandwidth of 488 Hz [26]. Furthermore, these physical channels are organized into time-frequency grids, with physical channels per grid.
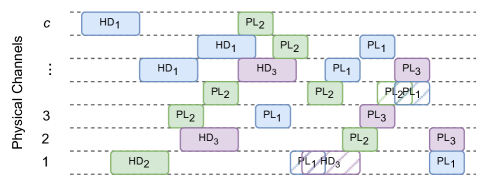
The transmission of a LR-FHSS packet involves both a header and a payload transmission. To boost robustness against collision events, an end-device sends multiple header copies sequentially across different physical channels, as illustrated in Fig. 1. Additionally, the payload is coded by a convolutional code of a certain rate. The coded payload is then divided into several fragments, which are transmitted sequentially over different physical channels within the grid. Each header replica has a Time-on-Air (ToA) of ms, representing the time for each frequency hop. Furthermore, the ToA for each payload fragment is ms [15]. Let us remark that the LR-FHSS technique includes various data rate (DR) models, each associated with a specific pair of payload code rate and number of header replicas.
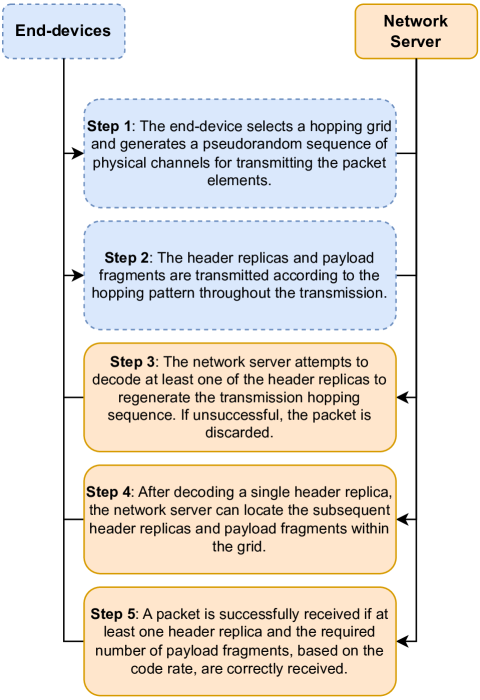
An overview of the LR-FHSS packet communication process is provided in Fig. 2. The process begins with an end-device selecting a hopping grid and then randomly picking a seed to generate a pseudorandom sequence of physical channels prior to the transmission of the first header replica, as shown in Step 1. During transmission, the end-device hops to a new physical channel for every header replica and payload fragment, changing the carrier frequency according to the hopping sequence, as illustrated in Step 2. The header includes crucial information, such as an indicator for generating the pseudorandom frequency hopping sequence. To regenerate this sequence, the gateway must decode at least one header replica, as described in Step 3, enabling it to locate the payload fragments within the grid, as depicted in Step 4. Additionally, a minimum number of payload fragments, determined by the code rate in use, must be decoded for successful message recovery, as illustrated in Step 5.
III Proposed Strategy
We consider an LR-FHSS network with end-devices, using transmit power to send bytes of payload to a single gateway, which is connected to a network server. Furthermore, the time between transmissions from each end-device follows an exponential random variable with mean . This implies that, on average, transmissions occur per second, with inter-arrival time probability distribution , for .
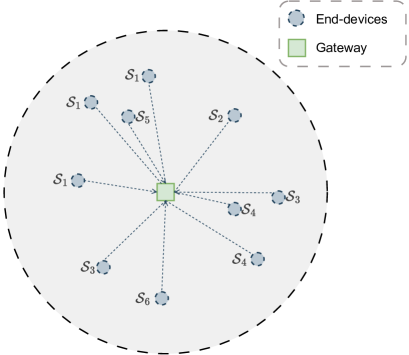
According to the strategy we propose, for each transmission attempt, the end-devices randomly choose a setup , with , associated with a number of header replicas and payload code rates. Moreover, the network server selects a set , with , which corresponds to a probability distribution that should be respected by the end-devices when choosing a transmission setup. In other words, is the assignment probability for each 111The transmission of this probability distribution to the end-devices could be made by means of a multicast strategy or by simply piggybacking it in the downlink messages for Class A LoRaWAN devices. It is important to highlight that all LoRaWAN devices must support Class A implementation, which involves two short receive windows for downlink messages from the network once the uplink transmission is completed [31].. A high-level illustration of the proposed strategy is shown in Fig. 3, for end-devices and possible setups of header replicas and payload code rates.
Following a methodology similar to [23], we write the average number of header and payload fragment transmissions in the network per unit of time respectively as
| (1) |
and
| (2) |
where represents the average number of header replicas per message, taking into account the proportion of end-devices using each specific setup, which is expressed as
| (3) |
where is the number of header replicas associated with . Moreover, is the average number of coded payload fragments, which can be obtained as
| (4) |
where depends on the code rate and can be obtained as [15]
| (5) |
where is the code rate. Then, the average ToA of a message across the network is .
We assume that the devices are within the coverage of the gateway, so that decoding errors are strongly dominated by potential collisions with transmission from different devices. Such assumption is reasonable in mIoT scenarios limited by interference, and it has been often considered in the literature [32, 16, 33, 23, 34, 26], as a good compromise between mathematical tractability and precision. Then, for a header replica transmitted at time for a specific end-device, we define its vulnerability interval as . Assuming the same size for all payload fragments, we calculate the average number of packet elements, headers, and payload fragments that arrive during the vulnerable interval of a header replica, including itself, as
| (6) |
where is the average number of headers transmitted within the header vulnerable interval, while is the average number of payload fragments transmitted in the same interval. Additionally, the operation is included to guarantee that , since we are assuming that at least one header replica has been transmitted.
Similarly, for payload fragments, whose vulnerable interval is , the average number of packet elements arriving at the gateway in the payload fragment vulnerable interval, including itself, is
| (7) |
Thus, an LR-FHSS packet is successfully recovered when the gateway correctly receives at least one of the headers, as well as an amount of from the total payload fragments, where is the ceiling operator.
Let us then refer to as the probability of successfully receiving at least one of the header replicas when employing . Therefore, given that there are physical channels within the grid, the aforementioned probability is [23]
| (8) |
where is the probability of correctly receiving a single header replica without collisions while considering the network average header vulnerable interval defined in (6).
Similarly, the probability of successfully receiving a single payload fragment is
| (9) |
Therefore, the probability of successfully receiving at least payload fragments when adopting is
| (10) |
where is the binomial coefficient.
Finally, the overall packet success probability is determined by the weighted contribution of each setup as
| (11) |
III-A Network Metrics
The performance of the proposed strategy is evaluated in terms of two metrics, namely goodput and energy efficiency. The goodput, , represents the average number of successfully received bytes per second and is defined by
| (12) |
Another metric of interest is the energy efficiency, defined as
| (13) |
which is the ratio of the goodput to the average power expended by the end-devices, which, in turn, is
| (14) |
where corresponds to the fraction of time that a device is actively transmitting.
III-B Optimization of
The optimization of a given metric involves finding the optimal distribution , that maximizes the desired metric, which can be formally defined as
| (15a) | ||||
| (15b) | ||||
where is the optimal probability distribution related to -th setup. However, due to the complexity of (12) and (13), which depend on the configurations of header replicas and code rates, it is hard (if possible) to derive a closed-form equation for that maximizes either the goodput or the energy efficiency. Notably, the objective functions exhibit neither concave nor convex behavior depending on the number of end-devices.
Thus, we perform such a task by means of an exhaustive search. This search is carried out on a discrete set of values, which the network server evaluates and communicates back to the end-devices. In terms of complexity, considering a scenario with different setups and possible values of , the exhaustive search requires iterations, resulting in computational complexity . However, it is important to note that this computational burden is confined to the network server and may vary depending on its hardware capabilities, while remaining transparent from the end-devices perspective.
IV Numerical Results
This section presents some numerical results to assess the performance of the proposed scheme. The evaluation was conducted using a discrete-event simulator implemented within the SciPy framework in Python, as detailed in [34]. Unless specified otherwise, we adopt dBm, s with a simulation duration of s, channels and bytes.
We compare the proposed strategy with approaches that employ LoRaWAN configurations DR8 or DR9, which are standard data rates specified in [15], as summarized in Table I. Moreover, based on the features of current LR-FHSS radios [35], the proposed approach considers combinations of header replicas and payload code rates as listed in Table II. It is important to note that Table II defines a varied set of configuration setups to be employed by the end-devices, according to a probability distribution associated with each setup, guided by the network server. Moreover, note that according to the LoRaWAN parameters [15], the standard DR8 model is equivalent to , while the DR9 model corresponds to , both highlighted in boldface in Table II. Therefore, our proposed strategy incorporates standard DR models to enhance performance by leveraging the benefits of diversity in the context of Aloha networks.
| LoRaWAN | DR8 | DR9 |
|---|---|---|
| Header Replicas () | ||
| Code Rate () |
| Header Replicas () | ||||||
| Code Rate () |
IV-A Goodput Optimization
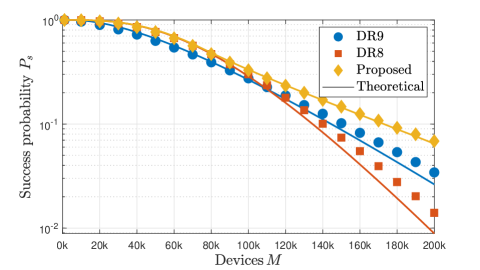
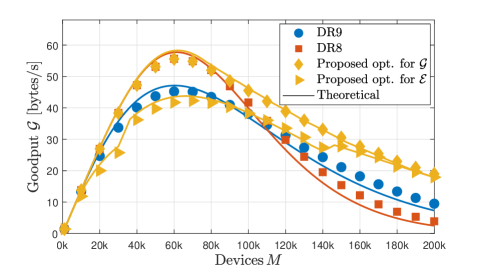
Initially, Fig. 4 illustrates the packet success probability, , as a function of the number of devices, . As we can observe, decreases with , a consequence of the more congested scenario leading to increased collisions among users. Compared with standard DRs, the proposed method shows improved performance. Moreover, the theoretical expressions obtained in (11) are employed in the optimization problem given by (15a). An exhaustive search is used to find the optimal that maximizes the goodput, and the results are in good agreement with the simulations222The discrepancies between theoretical and simulated results occur because the former ignores the correlation between header copies and payload fragments. When one fragment collides, the likelihood of another fragment from the same message also colliding increases. This interdependence is not considered in (11), where all transmissions are assumed to be independent.. The proposed method considers the distribution that maximizes for the given number of devices, as will be detailed later. Let us note that, following (12), for a given payload the optimization for is also an optimization for the goodput . Thus, Fig. 5 plots the proposed strategy optimized for versus , showing its superior performance compared to standard DRs, especially in crowded scenarios. Additionally, the goodput of the strategy optimized for is also presented, demonstrating that optimizing for energy efficiency does not guarantee maximum goodput.
To complement the analysis, Table III presents the optimal distribution of header replicas and code rate combinations to maximize for the proposed strategy. One can see that for a relatively small number of end-devices, prioritizing a higher number of header replicas increases the packet success probability at the gateway. Thus, (equivalent to DR8, with and ) dominates in the region, being chosen with probability . In contrast, with an increase in the number of end-devices, it becomes crucial to find a balanced mix of header replicas and code rates. This is demonstrated by the balance between the (with and ) and setups. Notably, setups , (equivalent to DR9), and have not been used in this scenario.
| - | - | - | - | - | % | |
| - | - | - | - | - | % | |
| - | - | - | - | - | % | |
| % | - | - | - | - | % | |
| % | - | - | - | - | % | |
| % | - | - | - | - | % | |
| % | - | - | - | - | % | |
| % | - | - | - | - | % | |
| % | - | - | - | - | % | |
| % | - | - | - | - | % |
IV-B Energy Efficiency Optimization
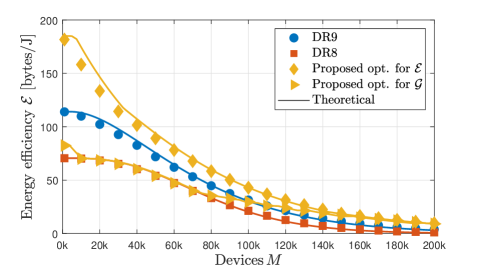
In this section, we focus on maximizing the energy efficiency of the network, by adopting the distribution presented in Table IV. Fig. 6 shows the proposed method optimized for as a function of the number of end-devices. As observed, the proposed strategy significantly outperforms the standard DRs, allowing for a more judicious use of energy resources. The goal of this optimization is to achieve a balance between energy consumption — associated with the average ToA, which is a function of the total number of header replicas and payload fragments — and the optimal number of packets successfully received by the gateway. Additionally, the energy efficiency obtained with the distribution presented in Table III, which maximizes goodput, is illustrated. In this case, standard DR9 outperforms the proposed strategy in terms of energy efficiency. However, it is important to note that DR9 is not superior to the proposed scheme when optimized for goodput (Fig. 5). Thus, one can see that a trade-off between goodput and energy efficiency is established by comparing the results from Fig. 5 with those of Fig. 6.
| % | - | - | - | - | - | |
| - | % | - | - | - | - | |
| - | % | - | - | - | - | |
| - | % | - | - | - | - | |
| - | % | - | - | - | - | |
| - | % | - | - | - | - | |
| % | % | - | - | - | - | |
| % | - | - | - | - | % | |
| % | - | - | - | - | % | |
| % | - | - | - | - | % |
In particular, observing Table IV, the optimization that maximizes favors configurations with fewer header replicas and lower code rates, which diverges from the strategy to maximize goodput detailed in Table III. This is evidenced by the prevalence of configurations and up to approximately end-devices. With a lower number of end-devices, there are fewer collisions, leading to an optimal distribution that employs setups with fewer header replicas and payload fragments to maximize the energy efficiency of the network, although sacrificing goodput. However, as the number of devices increases, the proposed strategy efficiently adjusts the setup mix, adopting a more resilient approach to increase the success of packet delivery by incorporating configuration into the system. The inclusion of can be explained by the higher number of collisions and the need to improve the packet success probability while maintaining the overall average energy consumption of the network at limited values. Moreover, note again that configuration (equivalent to DR9), has never been used in Table IV.
IV-C Influence of the Payload Length
The influence of the payload length on the goodput and the energy efficiency of the proposed scheme are illustrated, respectively, in Fig. 7 and Fig. 8, for payload sizes bytes. Note that, for the sake of conciseness, we compare the proposed method with the maximum between the performances achieved by DR8 and DR9. Even considering such optimistic measure for the standardized DRs, the proposed method presents considerable advantage in terms of goodput and energy efficiency, for both payload sizes.
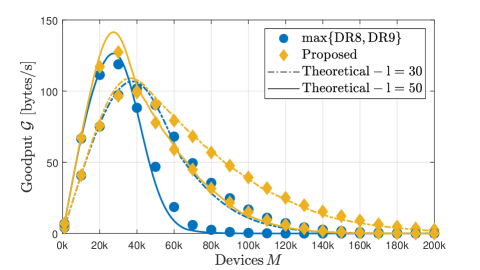
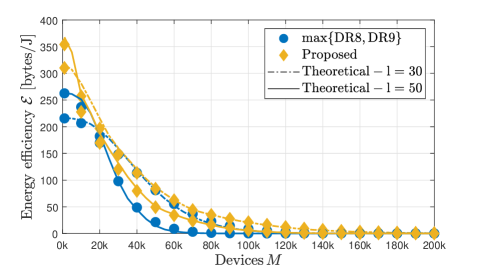
Table V illustrates the optimal distribution to maximize for the aforementioned payload values (, and are not used, thus omitted), while the optimal distribution from the energy efficiency perspective is shown in Table VI. Notably, the setup is once more not utilized to maximize goodput, being finally used to maximize in Table VI, but only for a relatively low number of devices.
| bytes | bytes | |||||
|---|---|---|---|---|---|---|
| - | % | - | - | % | - | |
| - | % | - | % | % | - | |
| % | - | % | % | - | % | |
| % | - | % | % | - | % | |
| % | - | % | % | - | % | |
| % | - | % | % | - | % | |
| % | - | % | % | - | % | |
| % | - | % | % | - | % | |
| % | - | % | % | - | % | |
| % | - | % | % | - | % | |
| bytes | bytes | |||||||||||
| % | - | - | - | - | - | - | - | % | - | - | - | |
| - | % | % | - | - | - | % | - | - | - | % | - | |
| % | - | - | % | - | - | % | - | - | - | - | % | |
| % | - | - | - | - | % | % | - | - | - | - | % | |
| % | - | - | - | - | % | % | - | - | - | - | % | |
| % | - | - | - | - | % | % | - | - | - | - | % | |
| % | - | - | - | - | % | % | - | - | - | - | % | |
| % | - | - | - | - | % | % | - | - | - | - | % | |
| % | - | - | - | - | % | % | - | - | - | - | % | |
| % | - | - | - | - | % | % | - | - | - | - | % | |
IV-D Quantization of
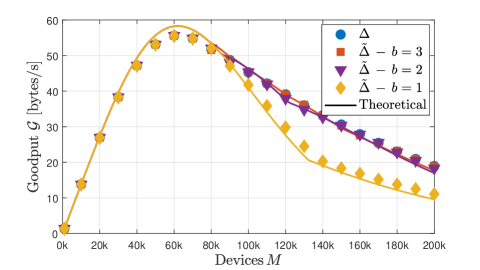
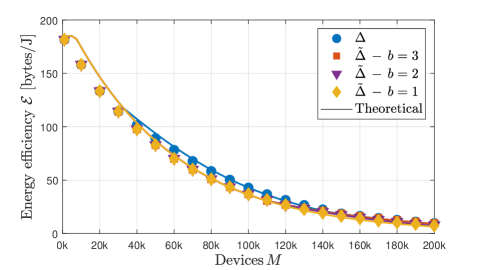
Due to the prevalence of setups and in the optimal distribution to maximize or in the previous analyzes, and with a real deployment in mind, we next consider a simplified scenario where only are available. Furthermore, as the network server must inform the appropriate distribution for joining devices, or for those already connected, must fit into a typical downlink packet. To achieve this, first note that , where denotes the probability associated with setup . Hence, it is sufficient for the downlink message from the network server to inform . We will next investigate the impact of quantizing with a resolution of bits.
Figs. 9 and 10 illustrate and for different numbers of bits as the number of end-devices increases. Notably, a quantization resolution of merely bits is sufficient to achieve near-optimal goodput and energy efficiency. These results demonstrate the feasibility of the proposed approach, as only a minimal number of downlink bits are required from the network server to the end-devices to convey an adequate probability distribution of the setups.
V Conclusions
We investigated the performance of the LR-FHSS technique using a device-level probabilistic strategy for code rate and header replica allocation, comparing it to the standard DRs. Our results demonstrated that by properly tuning the distribution of header replicas and payload code rates, considerably superior goodput or energy efficiency can be achieved. Notably, data rate DR9, specified in the LoRaWAN standard, was rarely included in our results, while data rate DR8 played a crucial role in the goodput and energy efficiency optimizations. Additionally, regarding downlink transmission from the gateway to end-devices, we found that near-optimal results in terms of goodput and energy efficiency can be attained by transmitting merely 3 bits to inform the appropriate probability distribution, ensuring an adequate probability distribution of the setups with minimal additional downlink traffic load.
References
- [1] A. N. Arun, A. B. Das, C. G. Brinton, D. J. Love, and J. V. Krogmeier, “Do small cells make sense for simple low cost LPWANs?” IEEE Wireless Communications Letters, pp. 1–1, 2024.
- [2] Y. Guo, J. Niu, X. Zhou, T. Gu, Y. Li, and D. Fang, “Power-efficient transmissions in LoRa uplink systems,” IEEE Transactions on Vehicular Technology, pp. 1–13, 2024.
- [3] 6G Flagship, “Key Drivers and Research Challenges for 6G Ubiquitous Wireless Intelligence,” University of Oulu, Tech. Rep. 6G Research Visions 1, Sep. 2019.
- [4] M. Jouhari, N. Saeed, M.-S. Alouini, and E. M. Amhoud, “A survey on scalable LoRaWAN for massive IoT: Recent advances, potentials, and challenges,” IEEE Communications Surveys & Tutorials, vol. 25, no. 3, pp. 1841–1876, 2023.
- [5] O. J. Pandey, T. Yuvaraj, J. K. Paul, H. H. Nguyen, K. Gundepudi, and M. K. Shukla, “Improving energy efficiency and QoS of LPWANs for IoT using Q-Learning based data routing,” IEEE Transactions on Cognitive Communications and Networking, vol. 8, no. 1, pp. 365–379, 2022.
- [6] M. Pérez, F. E. Sierra-Sánchez, F. Chaparro, D. M. Chaves, C.-I. Paez-Rueda, G. P. Galindo, and A. Fajardo, “Coverage and energy-efficiency experimental test performance for a comparative evaluation of unlicensed LPWAN: LoRaWAN and SigFox,” IEEE Access, vol. 10, pp. 97 183–97 196, 2022.
- [7] J. A. Fraire, O. Iova, and F. Valois, “Space-terrestrial integrated Internet of Things: Challenges and opportunities,” IEEE Communications Magazine, vol. 60, no. 12, pp. 64–70, 2022.
- [8] A. W. Azim, R. Shubair, and M. Chafii, “Chirp spread spectrum-based waveform design and detection mechanisms for LPWAN-based IoT: A survey,” IEEE Access, vol. 12, pp. 24 949–25 017, 2024.
- [9] J. P. Shanmuga Sundaram, W. Du, and Z. Zhao, “A survey on LoRa networking: Research problems, current solutions, and open issues,” IEEE Communications Surveys & Tutorials, vol. 22, no. 1, pp. 371–388, 2020.
- [10] H. Jiang, D. Qu, J. Ding, Z. Wang, H. He, and H. Chen, “Enabling LPWAN massive access: Grant-Free random access with massive MIMO,” IEEE Wireless Communications, vol. 29, no. 4, pp. 72–77, 2022.
- [11] O. B. A. Seller, “Wireless communication method,” 2017, US Patent 9,647,718. [Online]. Available: http://www.google.it/patents/US9647718
- [12] G. Pasolini, “On the LoRa Chirp Spread Spectrum Modulation: signal properties and their impact on transmitter and receiver architectures,” IEEE Transactions on Wireless Communications, vol. 21, no. 1, pp. 357–369, 2022.
- [13] U. Raza, P. Kulkarni, and M. Sooriyabandara, “Low Power Wide Area Networks: An overview,” IEEE Communications Surveys & Tutorials, vol. 19, no. 2, pp. 855–873, 2017.
- [14] N. S. Chilamkurthy, O. J. Pandey, A. Ghosh, L. R. Cenkeramaddi, and H.-N. Dai, “Low-Power Wide-Area Networks: A broad overview of its different aspects,” IEEE Access, vol. 10, pp. 81 926–81 959, 2022.
- [15] LoRa Alliance Technical Committee Regional Parameters Workgroup, Version 1.0.4 and Regional Parameters RP002, LoRa Alliance, Sept. 2022. [Online]. Available: https://resources.lora-alliance.org/technical-specifications/rp002-1-0-4-regional-parameters
- [16] G. Boquet, P. Tuset-Peiró, F. Adelantado, T. Watteyne, and X. Vilajosana, “LR-FHSS: Overview and performance analysis,” IEEE Communications Magazine, vol. 59, no. 3, pp. 30–36, 2021.
- [17] S. Herrería-Alonso, M. Rodríguez-Pérez, R. F. Rodríguez-Rubio, and F. Pérez-Fontán, “Improving uplink scalability of LoRa-based Direct-to-Satellite IoT networks,” IEEE Internet of Things Journal, vol. 11, no. 7, pp. 12 526–12 535, 2024.
- [18] K. Lin, M. A. Ullah, H. Alves, K. Mikhaylov, and T. Hao, “Subterranean mMTC in remote areas: Underground-to-satellite connectivity approach,” IEEE Communications Magazine, vol. 61, no. 5, pp. 136–142, 2023.
- [19] “Short Range Devices; Low Throughput Networks (LTN); Protocols for radio interface A,” ETSI TS 103 357 V1.1.1, pp. 1–113, June 2018.
- [20] G. Álvarez, J. A. Fraire, K. A. Hassan, S. Céspedes, and D. Pesch, “Uplink transmission policies for LoRa-based Direct-to-Satellite IoT,” IEEE Access, vol. 10, pp. 72 687–72 701, 2022.
- [21] I. Cheikh, R. Aouami, E. Sabir, M. Sadik, and S. Roy, “Multi-layered energy efficiency in LoRa-WAN networks: A tutorial,” IEEE Access, vol. 10, pp. 9198–9231, 2022.
- [22] A. Maleki, H. H. Nguyen, and R. Barton, “Outage probability analysis of LR-FHSS in satellite IoT networks,” IEEE Communications Letters, vol. 27, no. 3, pp. 946–950, 2023.
- [23] M. A. Ullah, K. Mikhaylov, and H. Alves, “Analysis and simulation of LoRaWAN LR-FHSS for Direct-to-Satellite scenario,” IEEE Wireless Communications Letters, vol. 11, no. 3, pp. 548–552, 2022.
- [24] S. Jung, S. Jeong, J. Kang, J. G. Ryu, and J. Kang, “Transceiver design and performance analysis for LR-FHSS-Based Direct-to-Satellite IoT,” IEEE Communications Letters, vol. 27, no. 12, pp. 3310–3314, 2023.
- [25] D. Wang, A. Elzanaty, and M.-S. Alouini, “Coded frequency hopping for Direct-to-Satellite IoT systems: Design and analysis,” IEEE Internet of Things Journal, pp. 1–1, 2024.
- [26] J. M. S. Sant’Ana, O. d. S. Neto, A. Hoeller, J. L. Rebelatto, R. D. Souza, and H. Alves, “Asynchronous contention resolution-aided ALOHA in LR-FHSS networks,” IEEE Internet of Things Journal, vol. 11, no. 9, pp. 16 684–16 692, 2024.
- [27] D. N. Knop, J. L. Rebelatto, and R. D. Souza, “LR-FHSS with network-coded header replication,” IEEE Transactions on Vehicular Technology, vol. 73, no. 6, pp. 9066–9070, 2024.
- [28] H. E. Susilo and J. Suryana, “Research on LPWAN direct to satellite IoT: A survey technology and performance on LEO satellite,” in 2023 29th International Conference on Telecommunications (ICT), 2023, pp. 1–7.
- [29] V. Tralli and E. Paolini, “IRSA-based random access over the gaussian channel,” IEEE Transactions on Information Theory, vol. 70, no. 6, pp. 4117–4139, 2024.
- [30] AN1200.64: LR-FHSS System Performance,, Semtech Corp., 2022, Rev. 1.3. [Online]. Available: https://www.semtech.com/products/wireless-rf/lora-connect/lr1121#documentation
- [31] LoRaWAN ® 1.1 Specification, LoRa Alliance, Oct. 2017. [Online]. Available: https://resources.lora-alliance.org/technical-specifications/lorawan-specification-v1-1
- [32] B. Paul, “A novel mathematical model to evaluate the impact of packet retransmissions in LoRaWAN,” IEEE Sensors Letters, vol. 4, no. 5, pp. 1–4, 2020.
- [33] W. Xiao, M. Kaneko, N. El Rachkidy, and A. Guitton, “Integrating LoRa collision decoding and MAC protocols for enabling IoT massive connectivity,” IEEE Internet of Things Magazine, vol. 5, no. 3, pp. 166–173, 2022.
- [34] J. M. S. Sant’Ana, A. Hoeller, H. Alves, and R. D. Souza, “LR-FHSS-Sim: A discrete-event simulator for LR-FHSS networks,” arXiv preprint arXiv:2404.09539, 2024.
- [35] LR1121 Transceiver - User Manual, Semtech Corp., 2023, Rev. 2.0. [Online]. Available: https://www.semtech.com/products/wireless-rf/lora-connect/lr1121#documentation