A negligible contribution of two luminous galaxies to the ionizing photon budget of reionization
Abstract
We present indirect constraints on the absolute escape fraction of ionizing photons () of the system GN 42912 which comprises two luminous ( magnitudes of and ) galaxies at , GN 42912-NE and GN 42912-SW, to determine their contribution to the ionizing photon budget of the Epoch of Reionization (EoR). The high-resolution James Webb Space Telescope (JWST) NIRSpec and NIRCam observations reveal they are separated by only (0.5 kpc) on the sky and have a 358 km s-1 velocity separation. GN 42912-NE and GN 42912-SW are relatively massive for this redshift (log() 8.4 and 8.9, respectively), with gas-phase metallicities of 18 per cent and 23 per cent solar, O32 ratios of 5.3 and , and slopes of and , respectively. We use the Mg ii 2796,2803 doublet to constrain . Mg ii has an ionization potential close to that of neutral hydrogen and, in the optically thin regime, can be used as an indirect tracer of the LyC leakage. We establish realistic conservative upper limits on of 8.5 per cent for GN 42912-NE and 14 per cent for GN 42912-SW. These estimates align with trends observed with , O32, and the H equivalent width at . The small inferred ionized region sizes ( pMpc) around both galaxies indicate they have not ionized a significant fraction of the surrounding neutral gas. While these constraints do not decisively determine a specific reionization model, they support a minor contribution from these two relatively luminous galaxies to the EoR.
keywords:
galaxies: high-redshift – dark ages, reionization, first stars – galaxies: starburst1 Introduction
The Epoch of Reionization (EoR) is a significant phase transition in the Universe (Barkana & Loeb, 2001; Furlanetto et al., 2006). After recombination, the hydrogen gas within the inter-galactic medium (IGM) existed in a neutral state. The formation of the first stars, galaxies, and active galactic nuclei (AGN) led to the production and propagation of a sufficient quantity of ionizing photons (photons with 912Å, also known as Lyman Continuum or LyC photons) to reionize the neutral hydrogen in the circum-galactic medium (CGM) and IGM (Dayal & Ferrara, 2018; Dayal et al., 2020). This intricate process remains largely enigmatic, with significant debate over which sources (e.g. star-forming galaxies, AGN, intermediate-mass black holes) contributed most to the total ionizing budget needed to explain reionization (Robertson et al., 2013; Madau & Haardt, 2015; Rosdahl et al., 2018; Finkelstein et al., 2019).
To gauge the contribution of the primary sources of ionizing photons, we must determine their ionizing emissivity, i.e., the rate at which they emit ionizing photons per unit time and volume (Madau et al., 1999; Miralda-Escudé et al., 2000). The combined emissivity of all sources must be sufficient to ionize the hydrogen atoms in the IGM while accounting for potential recombination events. The emissivity of a source of ionizing photons, , is derived as
| (1) |
where is the relative density of the emitting sources across various UV brightness bins to some assumed limiting luminosity, is the intrinsic production of ionizing photons per unit non-ionizing UV luminosity, and is the fraction of ionizing photons that successfully escapes the interstellar medium (ISM) and CGM of galaxies () and contributes to the IGM-hydrogen reionization.
Prior to the James Webb Space Telescope (JWST) era, studies extrapolated post-reionization observations to formulate the relevant reionization models (e.g. Robertson et al., 2013, 2015; Madau & Haardt, 2015; Finkelstein et al., 2019; Naidu et al., 2020; Matthee et al., 2022; Chisholm et al., 2022). These models aimed to satisfy specific constraints, such as the opacity of the Cosmic Microwave Background (, Planck Collaboration et al. 2016), and observations of damped Lyman- (Ly) wings in quasars (e.g. Greig et al., 2019) which provides insights into neutral gas fractions at .
In the pre-JWST era, several studies favored star-forming galaxies (SFGs) as the dominant sources of cosmic reionization (e.g. Ouchi et al., 2009; Robertson et al., 2013; Finkelstein et al., 2012; Naidu et al., 2020). SFG-based reionization models are typically separated into faint galaxy and bright galaxy models (e.g. Greig & Mesinger, 2015). In the latter scenario, rare luminous galaxies, located in the highest-density regions of the universe, generate a substantial number of ionizing photons and dominate the ionizing budget of the EoR (Marques-Chaves et al., 2022; Naidu et al., 2020). In contrast, the faint-galaxy scenario builds upon galaxies found in smaller haloes, more numerous but producing fewer ionizing photons individually. While both types of models match the current constraints on and the neutral gas fraction at , they have significantly distinct implications for the timeline, morphology, and structure of cosmic reionization (Robertson et al., 2013; Finkelstein et al., 2019; Kannan et al., 2022; Gazagnes et al., 2021).
The advent of the JWST has offered unique insights into the high-redshift () universe. Interestingly, while SFGs-dominated models were favored, JWST observations unveiled an unexpected abundance of faint AGN at (e.g. Maiolino et al., 2023, 2024; Matthee et al., 2024; Larson et al., 2023; Kocevski et al., 2023, 2024; Furtak et al., 2024). While these AGN are predominantly dust-reddened (Dayal et al., 2024; Casey et al., 2024), their contribution to reionization is still debated (Madau et al., 2024). Additionally, JWST observations introduced new complexities to the overall picture of SFG-based reionization models. JWST unveiled super-early luminous galaxies at redshifts greater than 9 (Donnan et al., 2023; Finkelstein et al., 2024; Harikane et al., 2023), as well as galaxies at redshifts greater than 6 exhibiting a relative high ionizing photon production ( 25.5) (Atek et al., 2024; Simmonds et al., 2024; Endsley et al., 2023b; Prieto-Lyon et al., 2023; Hsiao et al., 2024) and star formation activity (Finkelstein et al., 2023; Harikane et al., 2023; Eisenstein et al., 2023). This observed increase in and at high-redshift results suggests there may be too many ionizing photons escaping SFGs at , leading to a reionization timeline incompatible with the current constraints on and the neutral gas fraction at (Muñoz et al., 2024).
In light of the new insights provided by JWST, determining the distribution of across SFGs has become a critical need. Indeed, both faint and bright galaxy models rely on different -to- relations (e.g. Chisholm et al., 2022; Matthee et al., 2022). Furthermore, the observation of a lower average than assumed by pre-JWST reionization models (3% instead of 5-10%) could reconcile these models with current constraints on and (Muñoz et al., 2024). Thus, determining the of SFGs is pivotal for understanding the process and timeline of reionization (Sharma et al., 2016; Naidu et al., 2020; Finkelstein et al., 2019).
Currently, few studies have set tight constraints on the of reionization-era objects (e.g. Mascia et al., 2024; Jaskot et al., 2024b). This is because robustly constraining at high redshift is virtually impossible. It necessitates direct observations below 912Å, which are unfeasible at redshifts greater than 4 due to IGM absorption (Worseck et al., 2014; Vanzella et al., 2015). Hence, our best approach for constraining relies on indirect diagnostics, established from the Universe, where direct constraints can be made and compared to other UV and optical properties observable with JWST. Fortunately, the past decade has seen an exponential growth in the discovery of LyC leaking galaxies at (Leitet et al., 2013; Borthakur et al., 2014; Leitherer et al., 2016; Izotov et al., 2016b, 2018a, a, 2018b, 2021; Vanzella et al., 2015; de Barros et al., 2016; Shapley et al., 2016; Bian et al., 2017; Steidel et al., 2018; Fletcher et al., 2019; Rivera-Thorsen et al., 2019; Pahl et al., 2021). In particular, the Low- Lyman Continuum Survey (LzLCS, Flury et al. 2022a) has substantially augmented the number of LyC detections, adding 35 new LyC galaxies at and enhancing the diversity and completeness of the sample. This endeavor has advanced our understanding of ionizing photon escape and laid the groundwork for establishing LyC diagnostics applicable to high- studies (Saldana-Lopez et al., 2022; Flury et al., 2022b; Leclercq et al., 2024; Amorín et al., 2024; Chisholm et al., 2022; Bait et al., 2023; Wang et al., 2021).
Both theoretical and observational studies of LyC leaking galaxies emphasized that the properties of neutral gas, particularly its density, and geometry, along with dust extinction, are key regulators of the ionizing leakage (e.g. Gazagnes et al., 2018, 2020; Kimm et al., 2017; Chisholm et al., 2020). Consequently, spectral features and properties that trace neutral gas and dust (e.g. Ly, slopes, low ionization states of metal lines) are generally robust indicators of LyC escape. Importantly, the best diagnostics should combine insights into both neutral gas and dust properties (Chisholm et al., 2022; Gazagnes et al., 2024).
The Mg ii2796,2803 doublet is one of the most promising diagnostics for constraining at high-. Since the IGM is predominantly neutral at , direct neutral gas diagnostics like Ly are heavily impacted by the neutral gas and can only trace the most luminous leakers residing in large ionized bubbles that favor Ly transmission (Mason & Gronke, 2020). Mg ii presents a powerful alternative; its ionization potential is closely aligned with that of H i (15 eV versus 13.6 eV), suggesting that Mg ii can serve as a tracer for neutral gas density and thereby indirectly infer LyC escape (Henry et al., 2018; Chisholm et al., 2020; Chang & Gronke, 2024). Observational studies have highlighted a remarkable agreement between LyC escape fraction derived using Mg ii-based approaches and directly-constrained at low- (Chisholm et al., 2020; Leclercq et al., 2024; Xu et al., 2022, 2023).
Building upon these results, a Cycle 1 program (ID: 1871, PI: Chisholm) was granted hours of observations to capture the Mg ii emission of 20 reionization-era galaxies in the GOODS-North field and establish the very first indirect constraints of high-redshift galaxies. In this paper, we analyze the JWST Near Infrared Spectrograph (NIRSpec, Böker et al., 2023) high-spectral resolution observations of GN 42912, a bright Ly system at = 7.5 (Finkelstein et al., 2013; Hutchison et al., 2019; Jung et al., 2020). Our objective is to establish the first constraints on the absolute for this reionization-era system, integrating insights on both neutral gas and dust content. We will evaluate the significance of our findings within the framework of pre-JWST reionization models from Chisholm et al. (2022) and Matthee et al. (2022) and the current ionizing photon budget crisis (Muñoz et al., 2024).
This paper is organized as follows: Section 2 introduces the observations and reduction strategy of the JWST data. In Section 3, we analyze the Spectral Energy Distribution (SED) properties and Mg ii, [O iii], [O ii], and Balmer emission lines of GN 42912. We present the Mg ii-based constraints on the in Section 4. In Section 5, we discuss the reliability of these estimates. We compare these constraints to low- LyC leakers, trends, and alternative diagnostics in Section 6. Finally, we consider these constraints in the context of reionization models in Section 7. We conclude in Section 8.
Throughout this paper, we use a cosmology with H0=67.4 km s-1 Mpc-1 and =0.315 (Planck Collaboration et al., 2016) and the solar metallicity is defined as 12+log(O/H) of 8.69 (Asplund et al., 2021). All magnitudes are reported as absolute AB magnitudes and the restframe wavelengths of emission lines quoted are given in Angstroms (Å) in the vacuum frame using the National Institute of Standards and Technology database (NIST, Kramida et al., 2022). The uncertainties on all measurements and equations include the propagation of all the uncertainties involved in each, using the python package uncertainties (Lebigot, 2023).
2 Observations
Here we describe the JWST observations of GN 42912. Section 2.1 briefly presents the JWST Cycle 1 program. Section 2.2 and Section 2.3 describe the NIRcam and NIRSpec data reduction.
2.1 JWST Project ID 1871
This paper focuses on GN 42912, a system observed in Cycle 1 of JWST as part of the JWST Project ID 1871 (PI: Chisholm). Chisholm et al. (2024) describes the details of the program and its data reduction, and we summarize the important steps here. Project ID 1871 selected 20 high-redshift star-forming galaxies within the GOODS-North (GN) field with photometric redshifts from Finkelstein et al. (2015), and some with Ly-based redshift estimation from Jung et al. (2020). The goal was to capture the velocity profiles of the Mg ii 2796,2803 emission lines and deduce the neutral gas column density (and associated LyC escape fraction, Henry et al. 2018; Chisholm et al. 2020). The data were acquired from the JWST (McElwain et al., 2023; Rigby et al., 2023) on February 10, 2023, utilizing the NIRSpec micro-shutter assembly (MSA) G235H/F170LP and G395H/F290LP grating capabilities. The MSA observations were centered on a prominent, bright Ly emitter at in the GOODS-North field (GN 42912, Finkelstein et al., 2013; Hutchison et al., 2019; Jung et al., 2020).
Of the 20 selected targets, 9 have the Mg ii 2796Å and 2803Å emission lines falling inside the NIRSpec gratings coverage. Among these 9 objects, GN 42912 stands out with the most robust detection of the Mg ii doublet (exceeding ), making it the primary focus of this paper. The other galaxies with Mg ii coverage do not show significant Mg ii detections. The next sections provide a comprehensive overview of the data reduction.
2.2 NIRcam Data Reduction
The NIRCam imaging is from the First Reionization Epoch Spectroscopically Complete Observations (FRESCO, Oesch et al., 2023) and span the medium-band filters (F182M and F210M) in the short-wavelength channel and the F444W filter in the long-wavelength channel. The total exposure times are 4456, 3522, and 934 seconds for the F182M, F210M, and F444W filters, respectively.
The FRESCO NIRCam images were processed following the methodology from Endsley et al. (2023c), using the JWST Science Calibration Pipeline (v1.11.3). As detailed in Chisholm et al. (2024), we removed snowball and wisp artifacts, integrating sky flats and wisp templates derived from publicly available data, and took the photometric zero points from Boyer et al. (2022) within jwst_1106.pmap. The noise and 2D background subtraction in the *_cal.fits files was done on an amplifier-by-amplifier basis, utilizing the sep package (Barbary, 2016).
The CHArGE Hubble Space Telescope (HST) Wide Field Camera 3 (WFC3)/F160W reductions of the GN field were used to align the *_cal.fits files to the Gaia astrometric frame. During the pipeline’s final stage, we resampled all NIRCam mosaics to a uniform World Coordinate System with a 30 mas pixel-1 scale and then adjusted the images to match the point-spread function (PSF) of the F444W filter using PSFs defined within the FRESCO mosaics.
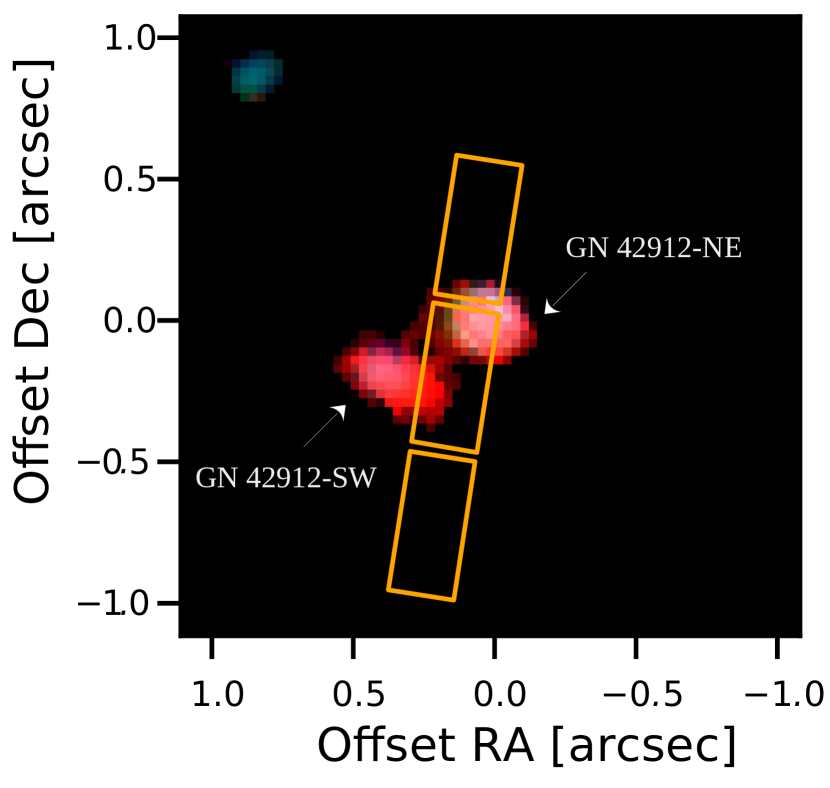
Figure 1 presents a composite image (F180M, F210M, F444W) of GN 42912. The resolution of the NIRCAM filters can resolve the presence of two components separated by 01 on the sky ( kpc). We further detail the properties of both components in Section 3.1. In the rest of this paper, we refer to these two components as GN 42912-NE and GN 42912-SW to denote the one in the northeast and the southwest, respectively.
2.3 NIRSpec Data Reduction
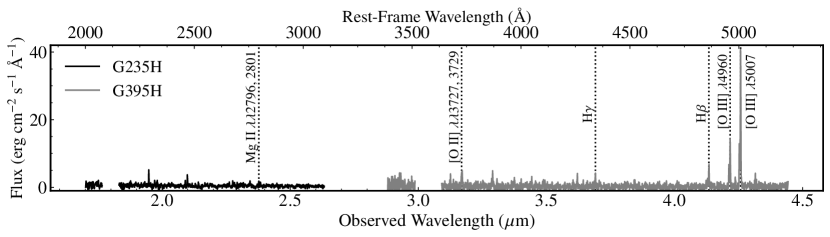
The NIRSpec observations were divided between the G235H and G395H grating configurations. The G235H observations, focusing on the restframe 2000–3600 Å wavelength range for sources at redshift 7.5, cover the Mg ii 2796,2803 emission lines. Given its importance for the program’s scientific goals, the G235H grating was allocated a longer exposure time: 53,044 s (approximately 14.7 hours) across 36 exposures. In contrast, the G395H grating, covering the restframe 3400–6000 Å wavelength range for sources at redshift 7.5, contains optical emission lines brighter than Mg ii, required significantly less exposure time, 9716 seconds (around 2.7 hours) over 6 integrations. Both configurations operated under the NRSIRS2 readout mode, and the standard three-shutter nod pattern was employed to capture sufficient background and enable a robust background subtraction.
Concerning the NIRSpec reduction pipeline, we employed the reference files cataloged under jwst_1235.pmap, accessible via the CDRS website111https://jwst-crds.stsci.edu/, made available on May 24, 2024. We processed the NIRSpec data using the msaexp v0.8.4 Python package (Brammer, 2023)222https://github.com/gbrammer/msaexp. msaexp applies a 1/f correction, identifies snowballs on all the rate files, removes each exposure’s biases using a median, and performs a specific noise re-scaling based on empty parts of the exposure. Then msaexp runs parts of the Level 2 JWST calibration pipeline and performs a manual background subtraction based on the 2D slit cutouts. For the Level 2 JWST calibration pipeline functions, we used the standard Space Telescope Science Institute data reduction pipeline version 1.14.0. The wavelength calibration is based on the NIRSpec instrument model, using a parametric calibration that interpolates between long-slit calibrations (Lützgendorf et al., 2022). All exposures are incorporated into the final data co-addition. We did not perform any slitloss correction given the complex morphology of the GN 42912 system. Figure 2 shows the final G235H + G395H combined spectrum (top panel). We checked that the final noise array returned by msaexp is consistent with the flux array standard deviation.
| Property | GN 42912-NE | GN 42912-SW |
|---|---|---|
| RA | 12:36:37.91 | |
| DEC | +62:18:08.63 | |
| 7.50153 0.00403 | 7.49178 0.00409 | |
| F182M | 124 4 | 90 5 |
| F210M | 123 4 | 84 6 |
| F444W | 266 6 | 240 8 |
| F606W | 3 | 4 |
| F775W | 3 3 | 3 4 |
| F814W | 2 | 3 3 |
| F850LP | 4 8 | 10 |
| F105W | 78 6 | 34 9 |
| F125W | 120 6 | 74 8 |
| [mag] | ||
| log10() | 8.43 | 8.87 |
| [″] | 0.026 0.013 | 0.128 0.015 |
3 Galaxy properties
Here we detail the galaxy and emission line properties of the GN 42912 system. Section 3.1 presents an overview and discusses the two-components morphology. Section 3.2 details the SED properties and slopes, and Section 3.3 presents the analysis of the observed emission lines in both galaxies.
3.1 GN 42912: two luminous companions at
GN 42912 was originally reported as a bright () object at (Finkelstein et al., 2013; Hutchison et al., 2019; Jung et al., 2020). Observations with Keck/MOSFIRE highlighted a significant detection of Ly (S/N10.2) with an equivalent width of 33.2Å (Jung et al., 2020). The close correspondence between the mechanisms regulating the escape of ionizing photons and the escape of Ly photons (Verhamme et al., 2015, 2017; Dijkstra et al., 2016; Gazagnes et al., 2020; Flury et al., 2022b) hinted at a potential non-null in this system.
The high spatial resolution of the JWST NIRCam and NIRSpec instruments revealed that GN 42912 is composed of two nearby galaxies. We determined the redshift of each object as the median redshift and standard deviation of prominent emission lines fits such as H, H, [O iii] 5008Å, [O iii] 4960Å, and [Ne iii] 3869Å (see Section 3.3 for the fits details). The northeast component is at a slightly higher redshift compared to the southwest component (7.50153 versus 7.49178, see Table 1). The redshift of GN 42912-NE is within of the value reported in Hutchison et al. (2019) (7.5032) measured using the C iii] 1909Å emission line.
GN 42912-NE and GN 42912-SW are separated by 3.1 cMpc assuming Hubble flow, and 358 km s-1 in velocity. Figure 1 shows that these two objects are separated by 01 on the sky, which corresponds to kpc. Although these distances indicate that the two galaxies are not currently interacting, it does not rule out non-Hubble flows or past interactions between them.
It is worth noting that, despite its significant Ly detection reported in Jung et al. (2020), Ly is absent in the PRISM observations of the same object from the JADES program (Eisenstein et al., 2023; Bunker et al., 2023). However, the slit position of NIRSpec in these observations is oriented almost perpendicular to the axis passing through the centers of each component, which means that the PRISM observations only partially cover a small portion of each source. Hence, the Ly emission is likely originating from the non-covered portions in the JADES observations, making it challenging to pinpoint whether it comes from a specific region of one or the other components based on the current data. We discuss further the Ly properties of the GN 42912 system in Section 7.1 where we infer the size of the ionized region around the two galaxies.
3.2 SED properties and slopes
Utilizing the NIRCam observations, we derive constraints on the SED properties of GN 42912-NE and GN 42912-SW. The F444W imaging, covering wavelengths up to 4.98 m (restframe 7500 Å at ), is particularly suited for measuring stellar masses () because it traces the redder portion of the rest-frame optical spectrum which is more sensitive to older stars. The inference of involves fitting the SED using the Bayesian Analysis of Galaxies for Physical Inference and Parameter EStimation (bagpipes, Carnall et al. 2018) code. bagpipes employs stellar population synthesis templates from Bruzual & Charlot (2003), a Kroupa & Boily (2002) stellar initial mass function, and incorporates nebular emission through the processing of stellar emission via cloudy v17.00 (Ferland et al., 2017). We allow for a broad range of stellar masses, metallicities, and ionization parameters, applying log-uniform priors to all three physical properties. is determined by constraining the underlying restframe UV to optical continuum, as well as the strength of the prominent [O iii] and H.
With bagpipes, we infer a log(/) of for GN 42912-NE and for GN 42912-SW (Table 1). The , derived from the F125W filter (restframe 1500 Å), is 20.89 and 20.37 for the NE and SW components respectively. Finally, we derive the slopes using a power-law fit to the photometric slope F125W - F182M, which corresponds to the slope between 1500Å and 2200Å at . GN 42912-SW is relatively redder than its NE companion, with a of , compared to . These values are consistent with their as they fall within the trend - trend from Bouwens et al. (2014) which predicts for GN 42912-SW and for GN 42912-NE. However, the two galaxies are less massive than expected from the to stellar mass empirical relations from Finkelstein et al. (2012).
3.3 Emission lines and Metallicity
| Lines with NE and SW components | Lines with NE component only | |
|---|---|---|
 |
|
 |
 |
|
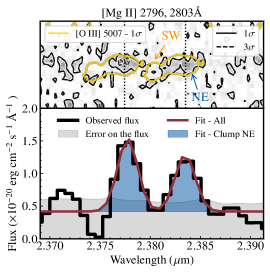 |
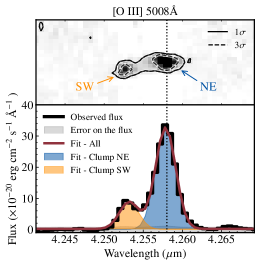
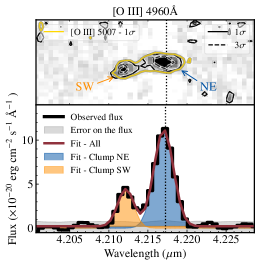
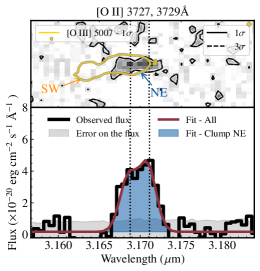
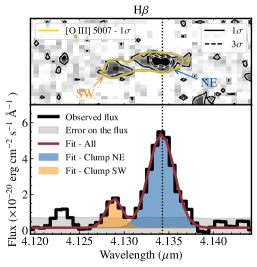
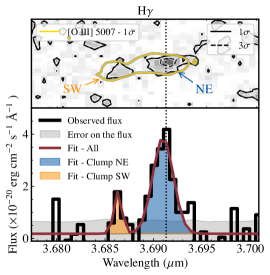
Here we outline our methodology for measuring the emission line properties of GN 42912-NE and GN 42912-SW. Our analysis focuses on the [O iii] 5008Å, [O iii] 4960Å, [O ii] 3727+3279Å, H, H, and Mg ii 2796Å and 2803Å emission lines, which will be used to derive indirect constraints on the relative and absolute escape fraction of ionizing photons in Section 4. These lines are all detected at a significance level of for the NE component. However, in the SW component which mostly falls outside the slit, we do not detect [O ii] 3727+3729Å nor Mg ii 2796+2803Å. Figure 2 bottom panels show the 2D and 1D extracted spectra for each of the lines of interest, distinguishing between lines detected in both galaxies and those detected only in GN 42912-NE.
We employ a single Gaussian profile to fit each resolved line and use a double Gaussian to fit the blended [O ii] 3727+3279Å lines. A separate paper will delve into a more sophisticated fitting approach to analyze potential contributions from a broad component (Saldana-Lopez, in prep). For our current analysis, we find that using a single Gaussian profile is sufficiently accurate to replicate the observed profiles. The velocity widths of lines from the same ion are tied together. The fits are displayed in Figure 2. In cases where we do not detect emission lines in GN 42912-SW, we establish an upper limit on the fluxes of these lines by integrating the error spectrum across the same line width observed for the NE component (100 km s-1). The integrated flux measurements are reported in Table 2.
We calculate the rest-frame equivalent widths for all lines by using a continuum taken as the median flux within a 5,000 km s-1 feature-free interval on both sides of the lines. Since we cannot disentangle the contributions of each object in the observed continuum of the final spectra, we adjust the continuum values by the ratio of the photometric values, taking the mean ratio over the three JWST filters F182M, F210M, and F444W. Specifically, for the NE galaxy, we multiply the continuum by a factor 0.566, and for the SW component by 0.434.
The emission line measurements for GN 42912-NE and GN 42912-SW are reported in Table 2. The latter table also presents some relevant line ratios for the present work. The O32 ratio, defined as [O iii] 5008Å/[O ii] 3727+3279Å, is 5.30.7 for GN 42912-NE and a lower limit of 5.8 for GN 42912-SW. The H/H Balmer line ratio provides insights into the dust extinction in both objects. In GN 42912-SW, we find H/H ratio of 0.462, close to the theoretical expectation of for an H ii region under Case B recombination at = 10,000K and cm-3 (Osterbrock & Ferland, 2006). This ratio indicates a relatively dust-free nebular environment, which contrasts with the relatively dusty continuum suggested by the photometry with . In GN 42912-NE, we find a Balmer H/H ratio of 0.5230.087. This value is larger than the theoretical dust-free value. The relatively significant errors on these line ratios prevent us from concluding whether such deviations from the theoretical predictions are true or are the result of statistical errors in the flux determination.
In the context of our study, Balmer decrements are important for correcting the influence of dust on the nebular emission lines. Given the large uncertainties on the measured H/H ratios and the absence of a clear model that could help us disentangle attenuation due to dust from other physical processes affecting the Balmer line ratios at high redshift (see e.g. Scarlata et al., 2024; Yanagisawa et al., 2024), we do not use these ratios to correct for the dust attenuation. Instead, we adopt two distinct approaches for our analysis. In the first scenario, we assume a dust-free case, thus considering the observed flux values as intrinsic (hereafter, this case is referred to as no-dust-case or NDC). Alternatively, in the second scenario, we correct for dust in the nebular emission lines using the values as proxies for the colour excess (hereafter, this case is referred to as -dust-case or DC). To estimate from , we use equation 7 from Chisholm et al. (2022). Because the shape of the dust extinction is unconstrained for reionization-era galaxies, we use both the SMC dust attenuation law (Gordon et al., 2003) and the dust law proposed by Reddy et al. (2016), derived from a large dataset of 933 far-UV observations of Lyman Break Galaxies at .
Using both the NDC and DC dust scenarios, along with two different dust extinction laws, allows for a comprehensive investigation into the impact of dust on the derived for both objects. However, this approach does not imply that all scenarios considered are equally plausible. The measured slopes for both objects indicate that the escaping radiation is attenuated by dust, suggesting that the NDC scenario may represent an extreme case. Moreover, reflects the dust attenuation along the stellar line of sight, while nebular dust extinction is generally greater (by a factor of approximately 0.44; Calzetti et al. 2000). Consequently, the DC scenario may underestimate the true level of nebular dust extinction. In Section 5.1, we further explore how these assumptions affect the final estimates, demonstrating that a higher nebular dust extinction than considered here would lead to lower estimates and, therefore, would not alter the overall conclusions of this study.
3.3.1 Metallicity
Here, we estimate the O/H abundance ratio in GN 42912-NE and GN 42912-SW (needed to estimate the intrinsic Mg ii emission and calculate below). We combine two direct empirical metallicity calibrations utilizing the R23 ratio (defined below) and the O32 ratio from Curti et al. (2020). The relation between R23 or O32 and 12+log(O/H) is given as
| (2) | ||||
| (3) | ||||
| (4) |
represents the dust-attenuation-corrected flux values of each line. The approach we used relies on finding the log(O/H) value that minimizes both differences to the measured R23 or O32 based on the empirical relations found in Curti et al. (2020). We note that we have also applied the same strategy using the empirical relations from Sanders et al. (2024) which presents relations based on high- observations and found consistent estimates.
For GN 42912-NE, we derive 8.41.3 and 12+log(O/H) = 7.930.11 in the NDC case, and 8.51.4 and 12+log(O/H) = 7.950.16 in the DC. The absence of significant changes is expected because the [O ii] emission is sufficiently weak that the dust correction has minimal impact on the results. Given the consistent central value, we adopt the value calculated with the DC which is more conservative.
For GN 42912-SW, the [O ii] 3727,3729 doublet is not detected, but we find that using the reported upper limit or assuming ([O ii]) = 0 only marginally influences the final 12+log(O/H) estimate by 0.01. Further, similar to GN 42912-NE, using either the NDC or the DC case does not influence the final 12+log(O/H) estimate. We find 11.8 3.3, resulting in 12+log(O/H) 8.05 0.24. Finkelstein et al. (2013) reported with 95 per cent confidence that the gas-phase metallicity in this system (not resolved in their observations) was sub-solar, with a stellar metallicity between 20 per cent and 40 per cent based on SED fitting. This is consistent with our estimates, where GN 42912-NE is 18 per cent of Z⊙ and GN 42912-SW is 23 per cent of Z⊙.
In the next section, we detail the two Mg ii-based strategies to derive an estimate and an upper limit on the escape fraction of ionizing photons in GN 42912-NE and GN 42912-SW, respectively.
| Properties | GN 42912-NE | GN 42912-SW | ||
| [O iii] 5008 | 1052 26 | 1012 45 | 271 22 | 341 51 |
| [O iii] 4960 | 342 20 | 329 27 | 109 24 | 136 32 |
| H | 188 14 | 179 28 | 37 9 | 46 26 |
| H | 99 17 | 105 27 | 17 9 | 24 20 |
| [O ii] 3727 | 89 16 | 73 28 | - | |
| [O ii] 3729 | 108 17 | 89 28 | - | |
| Mg ii 2796 | 28 4 | 15 4 | - | |
| Mg ii 2803 | 22 4 | 12 4 | - | |
| R | 1.28 0.26 | - | ||
| O32 | 5.3 0.7 | 5.8 | ||
| H/H | 0.523 0.087 | 0.462 0.167 | ||
| R23 | 8.4 1.3 | 11.8 3.3 | ||
| 12+log(O/H) | 7.95 0.16 | 8.05 0.28 | ||
4 Mg II Escape Fractions
In this section, we outline our methodology for deriving indirect constraints utilizing the Mg ii 2796,2803Å doublet lines. The Mg ii doublet has been suggested as a potential indirect indicator of LyC escape fraction (Henry et al., 2018), owing to its low ionization potential which is close to that of hydrogen. This characteristic makes it a valuable tracer of neutral gas and more easily observed at higher redshifts compared to Ly, which is directly affected by the optically thick H i IGM at . While a recent study from Katz et al. (2022b) has noted important caveats to using Mg ii as a LyC tracer from an optically thick medium (these concerns are discussed in Section 5.2), observational studies have demonstrated a close correspondence between direct measurements at 912Å and indirect estimates based on the Mg ii 2796,2803Å emission lines (Chisholm et al., 2020; Xu et al., 2023; Leclercq et al., 2024). In this study, we explore two approaches for calculating from these Mg ii lines: using the doublet ratio method (Section 4.1) and using photoionization models (Section 4.2).
4.1 Mg ii Doublet ratio method
The Mg ii emission line ratio depends on their emissivities, where the emissivity relates to the Einstein A coefficient of the Mg ii transitions and on the number density of electrons populating the upper levels. When collisions dominate the Mg+ excitation, the intrinsic flux ratio of the Mg ii 2796Å and 2803Å emission lines (hereafter R(Mg ii)) is . This value is confirmed by cloudy photoionization modeling (Henry et al., 2018) and Monte Carlo radiative transfer simulations (Chang & Gronke, 2024). In the scenario where the excitation is dominated instead by resonant scattering and photon absorption, the emission flux ratio is dominated by the ratio of the Einstein A coefficients. Both Mg ii 2796Å and 2803Å lines have similar A21 values, so R(Mg ii) would come closer to 1 instead of 2.
Chisholm et al. (2020) showed that, in the optically thin regime, one can use the variation of the R(Mg ii) values to infer the neutral hydrogen column density, which in turn provides a constraint on the relative absorption of the LyC photons by the H0 gas. Such an approach is possible because (1) in the optically thin regime, resonant radiative transfer effects on the Mg ii lines are negligible and (2) the Mg0 and Mg+ phases overlap with H0, so a column density of Mg+ can be transformed into H0 under some assumption of the Mg/H abundance in the galaxy.
A robust Mg+ to H0 conversion requires accurate estimates of the depletion fraction of Mg and of the Mg/H abundance ratio. Accurately determining the fraction of Mg that is depleted into dust is complex, and even more complex for reionization-era galaxies where the number of studies on the topic remains scarce. For consistency with previous studies using a similar approach, we assume a depletion fraction of 27 per cent based on Jenkins (2009), derived from Milky Way observations. As noted in Chisholm et al. (2020), there exists a substantial scatter in the distribution of measurements of the depletion factor, yet, this factor should not appreciably vary with metallicity for star-forming galaxies (Guseva et al., 2013, 2019). Regarding the Mg/H abundance ratio, since both oxygen and magnesium are elements primarily produced by core-collapse supernovae, the Mg/O value should not appreciably vary (Guseva et al., 2019). This means that we can approximate the Mg/H abundance ratio using the observed O/H abundance ratio and make the conversion assuming a solar O/Mg abundance ratio of 12.3 (Asplund et al., 2021).
Under these assumptions, Chisholm et al. (2020) showed that the H i column density can then be derived as
| (5) |
From the estimate of , we can derive a relative escape fraction, (LyC) as
| (6) |
where is the ionisation cross-section of hydrogen (6.310-18 cm-2). represents the amount of escaping LyC photons solely based on the quantity of neutral hydrogen and disregarding the influence of dust within the galaxy. To correct for the ionizing photons absorbed by dust, we calculate the absolute escape fraction accounting for the reduction in the relative escape fraction due to the expected dust attenuation at 912Å:
| (7) |
where is the line-of-sight colour excess and is the predicted dust attenuation from the chosen dust attenuation law at 912Å. We note that direct and indirect measurements of the absolute established from observations are line-of-sight dependent, as these observations only allow us to trace the photons escaping towards us. In practice, the overall (i.e., angle-averaged) is the quantity that is relevant for cosmological reionization models. Since the LyC escape is highly anisotropic (Gazagnes et al., 2020; Saldana-Lopez et al., 2022; Mauerhofer et al., 2021; Flury et al., 2022b; Choustikov et al., 2023), transforming line-of-sight constraints into a global constraint can be done using the average of line-of-sight-dependent constraints over a statistically significant sample of galaxies. While more high redshift observations are needed to build these samples, the constraints set in the work may be considered a first step toward this goal.
The doublet ratio method is only applicable to galaxies that have detections of the Mg ii 2796 and 2803 Å lines. Hence, in this work, we only apply this method to GN 42912-NE. We derive using Equation 5, taking the O/H abundance measured from the R23 ratio (Table 2). We obtain a of cm-2. We find that using either the NDC or DC scenarios yields similar values.
Using Eq 6, we find that the measured value corresponds to of . Physically, this means that the neutral hydrogen absorbs approximately 48 per cent of the escaping LyC radiation. As a comparison, galaxies with a significant detection of the LyC leakage tend to have closer to 100 per cent (see Chisholm et al. 2022 and further comparisons in Section 5).
In the NDC scenario, where we assume that the galaxy is completely devoid of dust, is also since no attenuation is expected below 912Å. In the DC scenario, we derive using Equation 7 and values transformed from using Equation 7 from Chisholm et al. (2022). To investigate the impact of the dust attenuation law choice, we utilize both the SMC attenuation curve (Gordon et al., 2003) and the attenuation curve from Reddy et al. (2016) (hereafter R16). We selected these two laws because their attenuation curves differ significantly in the UV, enabling us to compare the variations in resulting from this choice. We derive an (R16) of and (SMC) of . The consistency between the two estimates, both within of each other, indicates that the choice of the dust attenuation law has little impact on the constraint on the LyC leakage in GN 42912-NE.
The doublet ratio method comes with a notable caveat: its reliability strongly depends on the validity of the optically thin regime where the ratio effectively traces . However, when the observed ratio deviates from this optically thin scenario (i.e., R(Mg ii) closer to 1), resonant radiative transfer effects can become non-negligible, introducing a bias in the relationship from R(Mg ii) to . R(Mg ii) is 1.28 in GN 42912-NE, suggesting that the optically thin assumption may not be valid in this case. This caveat suggests that we should view the derived with the doublet ratio method as an upper limit rather than a well-defined measurement. We discuss this aspect further in Section 5.2.1.
| Property | GN 42912-NE | GN 42912-SW | ||
| NDC | DC | NDC | DC | |
| Mg ii Doublet Ratio method ———————— | ||||
| R | 1.28 0.26 | - | ||
| N | (1.05 0.55) cm-2 | - | ||
| 0.518 0.176 | - | |||
| (LyC) | 0.518 0.176 | 0.105 0.040 (R16) | - | |
| 0.142 0.052 (SMC) | - | |||
| Mg ii Photoionization models method ———————— | ||||
| R2796 | ||||
| 0.359 0.089 | 0.310 0.079 | |||
| 0.359 0.089 | 0.063 0.019 (R16) | (R16) | ||
| 0.085 0.022 (SMC) | (SMC) | |||
| Final estimates ———————— | ||||
4.2 Mg ii Photoionization method
Using cloudy photoionization models, Henry et al. (2018) showed that there exists a tight correlation between the intrinsic flux of Mg ii and the extinction-corrected flux of [O iii] 5008 Å and [O ii] 3727,3729 Å, offering an alternative approach to indirectly deriving . Henry et al. (2018) fitted a quadratic equation that relates the intrinsic flux ratio of Mg ii 2796/[O iii] 5008 and the O32 ratio. Xu et al. (2022) extended the work of Henry et al. (2018) by deriving the coefficient of this equation for three different gas-phase metallicities log() of , , and 0.5, and two geometries, the ionization bounded geometry, where most clouds are neutral and optically thick to escaping photons, and the density bounded geometry, where most clouds are optically thin. Here, we adopt the equation with gas-phase metallicity closer to the derived 12+log(O/H) values (i.e. 18 per cent solar for GN 42912-NE and 23 per cent solar for GN 42912-SW). Given the moderate O32 ratio observed in GN 42912-NE (5.30.7), we adopt the coefficients derived under the ionization-bounded scenario and log() = such that the intrinsic flux ratio of Mg ii 2796/[O iii] 5008 from Xu et al. (2022) is expressed as follows:
| (8) | ||||
where O32 denotes the dust-free (NDC) and extinction-corrected (DC) O32 ratio depending on the case considered. We also explored using the coefficients corresponding to the density-bounded scenario case and for a different gas-phase metallicity. We found a maximum variation of 10 per cent in our estimates of the relative escape fractions, which corresponds to the typical uncertainty on this measurement.
We use Equation 8 and the dust-corrected O32 and [O iii] emission line fluxes to derive the intrinsic Mg ii 2796 Å line flux (the strongest line of the doublet) for GN 42912-NE and GN 42912-SW. We compare these estimates with the dust-corrected Mg ii line fluxes to deduce the relative escape fractions at 2796 Å (), considering both the NDC and the DC scenarios. For GN 42912-NE, we derive = 0.369 0.089 in the NDC and 0.310 0.079 in the DC. For the NDC, this relative escape fraction directly translates to the absolute LyC escape fraction because we have assumed that there is no dust in the system. For the DC, we convert the relative escape fraction into an absolute by multiplying it by the dust attenuation at 912 Å, employing values extrapolated from (Chisholm et al., 2022). We find to be 0.063 0.019 using the R16 dust attenuation law and 0.085 0.022 using the SMC law. These values are consistent at 1 with the values derived using the doublet ratio method (Section 4.1).
The absence of Mg ii and [O ii] detections prevent us from applying the same approach to GN 42912-SW. This is because the current lower limit on O32 can only set an upper limit on the intrinsic Mg ii flux. Since the Mg ii 2796 Å line flux is also an upper limit, we cannot constrain a reliable estimate of . Hereafter, we use , which is the most conservative limit we can set, as it assumes all the intrinsically Mg ii photons are escaping in the absence of dust. With this assumption and using the expected dust attenuation at 912 Å, we derive using the R16 law and using the SMC dust extinction law.
Table 3 summarizes all the estimates derived in this section. Overall, for GN 42912-NE, the photoionization model approach to constraining yields results very consistent with the doublet ratio method. For GN 42912-SW, due to the absence of [O ii] and Mg ii detections, can range from 0 to 100 per cent in the NDC and between 0 and 14 per cent in the DC. As mentioned in Section 3.3, we chose to consider different dust scenarios to explore their implications for , but further discussion is warranted regarding the plausibility of each scenario. Additionally, Mg ii-based approaches to estimating also suffer caveats that we must carefully consider. The next section will focus on this discussion, aiming at establishing a final estimate with greater confidence for GN 42912-NE and GN 42912-SW.
5 A plausibly weak ionizing leakage in GN 42912-NE and GN 42912-SW
In the previous section, we used Mg ii to estimate for both GN 42912-NE and GN 42912-SW, considering instances where both galaxies are either dust free (NDC) or have dust extinction scaling with the measured values for both objects (DC). Across these scenarios, we found a wide range of estimates for both objects. While this extensive range might initially appear to prevent definitive conclusions regarding the contribution of these galaxies during the EoR, this section highlights several key factors supporting the idea that the LyC escape from these two objects is likely weak, if not negligible.
In Section 5.1, we discuss the NDC and DC assumptions. Section 5.2 examines our estimates in light of the caveats associated with Mg ii-based indirect methods, as highlighted in Katz et al. (2022a). Section 5.3 summarizes the discussions from Section 5.1 and Section 5.2 to establish final reliable upper limits for GN 42912-NE and GN 42912-SW.
5.1 The uncertainties on dust
We first discuss the validity of the NDC scenario versus the DC scenario in Section 5.1.1, and then comment on the impact of the choice of the dust extinction law on in Section 5.1.2.
5.1.1 NDC and DC scenarios
The impact of dust on nebular lines is usually corrected using the Balmer ratios. In Section 3.3, we highlighted that GN 42912-NE has H/H larger, although within 1, than the theoretical ratio under typical Case B assumptions, while GN 42912-SW has a H/H ratio consistent with an absence of dust attenuation. Both cases suggest a dust-free nebular environment, which contrasts with the observed slopes of and . Given the significant uncertainties on the Balmer ratios and recent studies highlighting "unphysical" Balmer ratios in high-redshift objects (Topping et al., 2024; Cameron et al., 2023), we opted not to use these ratios for deriving the extinction-corrected emission line fluxes. Instead, we considered two scenarios: one assuming no dust (NDC) and another where is used as a proxy for nebular dust extinction.
Unsurprisingly, the NDC scenario yields the highest estimates of LyC escape fractions, as the final escape fraction at 912Å relies solely on absorption from the neutral gas. However, the NDC scenario should be considered an extreme and likely unrealistic case. Indeed, an absence of dust attenuation for galaxies with and 12+log(O/H)8 seems highly unlikely since such galaxies should have had time to form metals and dust particles.
A dust-free scenario is also inconsistent with the slopes of GN 42912-NE and GN 42912-SW ( and , respectively). slopes are typically intertwined with both the age of populations emitting the intrinsic stellar continuum and dust extinction. However, Chisholm et al. (2022) demonstrated that for galaxies dominated by relatively young stellar populations, predominantly correlates with the amount of dust extinction in the galaxy. Using the remarkably tight -to- relation observed at Chisholm et al. (2022), we show that the slopes of GN 42912-NE and GN 42912-SW should correspond to values of approximately 0.134 (0.043) and 0.204 (0.066), under the R16 (SMC) dust extinction law, suggesting relatively dusty environments.
The DC case is likely the most physically motivated scenario for these two objects. This scenario can also be considered conservative, as the nebular dust extinction is typically larger than the stellar dust extinction along the line of sight, traced by (by a factor , Calzetti et al., 2000). Following Equation 8, adopting a larger nebular dust extinction would yield larger predicted intrinsic Mg ii flux, hence leading to lower relative escape fractions and absolute escape fractions overall.
5.1.2 On using different dust extinction curves
In this study, we also separately evaluated estimates based on the R16 dust extinction laws (Reddy et al., 2016) and based on the SMC extinction law (Gordon et al., 2003). Due to significant differences in their shapes, this approach offers valuable insights into how the choice of the dust extinction curve, which remains largely uncertain for galaxies at , influences values. The variations in final estimates when considering either law are relatively minor (e.g. 0.063 0.020 versus 0.085 0.025 for GN 42912-NE) and falling within uncertainties. As the attenuation at 912Å (A(912Å)=((912Å)) is larger for the R16 law, the estimates derived using this curve are always smaller than when using the SMC law (see also discussion in Saldana-Lopez et al., 2022, 2023). Given the absence of constraints on the shape of the dust extinction curve for galaxies, hereafter, we use only the values derived using the SMC law since they are more conservative. Yet, opting for the R16-based estimates would not affect the discussion in the following sections.
5.2 Caveats of indirectly predicting with Mg ii
Predicting LyC escape fractions indirectly is complex. LyC-diagnostic trends in the low- universe exhibit scatter over established empirical relationships (Flury et al., 2022b), and all indirect LyC diagnostics have caveats that must be carefully considered to understand the limitations of the estimates. Katz et al. (2022b) used radiation hydrodynamics simulations post-processed with radiative transfer to investigate a comprehensive list of caveats associated with Mg ii-based approaches, which we discuss in this section. We address the limitations of the doublet ratio method in Section 5.2.1 and explore the caveats of the photoionization models approach in Section 5.2.2.
5.2.1 Caveats of the Mg ii doublet ratio method
One significant caveat of the Mg ii doublet ratio method is its reliance on the optically thin regime for accurate estimates. This approach is most reliable when the doublet ratio is close to 2 (Chisholm et al., 2020; Chang & Gronke, 2024). However, as we move further into the optically thick regime, resonant radiative transfer effects become increasingly significant. These effects enhance the observed flux by scattering light from directions outside the line of sight into the line of sight and alter the shape of the doublet lines. This scattering process complicates the direct relationship between the doublet ratio value and the actual amount of neutral hydrogen gas present in the galaxy, making it more challenging to quantify the neutral gas content accurately.
When radiative transfer effects become significant, there is a risk of overpredicting the derived using the doublet ratio method. This effect is observed in the analysis of Katz et al. (2022a), whose authors conducted tests on the reliability of this approach using galaxies from the sphinx cosmological simulation suite (Rosdahl et al., 2018). For example, their Figure 17 emphasizes that predictions based on R(Mg ii) can substantially overestimate the true escape fraction by one order of magnitude. This overestimation is most significant for cases with low , which are cases where the neutral gas environment is overall optically thick.
In our analysis, we derived a doublet ratio of 1.28 for GN 42912-NE. Additionally, we find that the Mg ii lines are slightly broader than other optical lines (150 km s-1 for Mg ii versus 100 km s-1 for the [O ii] lines), which is indicative of possible resonant scattering effects altering the line shapes. Both aspects support that we may not validate the optically-thin assumption for this galaxy (see also the discussion in Section 6.1). Therefore, our estimates based on the doublet ratio may overpredict the true LyC escape in GN 42912-NE and therefore should be regarded as upper limits.
5.2.2 Caveats of the photoionization-based method
The photoionization-based method relies on cloudy models (Ferland et al., 2013, 2017) to deduce the intrinsic Mg ii luminosity based on [O ii] and [O iii] optical lines. Initially proposed by Henry et al. (2018) using idealized cloudy models, this approach was later refined and extended by Xu et al. (2022). In our study, we utilized the Mg ii to O32 relation from the latter work to estimate the intrinsic flux for GN 42912-NE and GN 42912-SW.
However, using galaxies from the sphinx cosmological suite, Katz et al. (2022b) observed that, while the Mg ii to O32 relation proposed by Henry et al. (2018) generally matches the simulated galaxies reasonably well, there is a certain scatter, with most sphinx galaxies tending to lie above the Henry et al. (2018) relation. Consequently, predictions based on the latter relation could underestimate the Mg ii intrinsic flux by to dex (see Figure 15 in Katz et al. 2022b), and therefore overestimate the relative escape fractions derived from these estimates. Given that the relations from Xu et al. (2022) are derived using a similar methodology, it is plausible that they may suffer from similar biases.
Katz et al. (2022b) proposed updated equations (their equations (3) and (4)) to derive a more accurate Mg ii intrinsic luminosity based on [O ii] and [O iii] lines. Using their equation in the DC, we derived a relative escape fraction of ionizing photons of two times lower for GN 42912-NE. This aspect suggests that the photoionization-based estimates derived in Section 4.2 might overestimate both the true relative and absolute escape fractions for both objects.
5.3 Reaching a consensus for realistic estimates in GN 42912-NE and GN 42912-SW.
So far, the discussion detailed in this section has highlighted three key points. First, the DC scenario is likely more realistic than the NDC scenario to describe the environment of GN 42912-NE and GN 42912-SW. It is also a conservative way to estimate the nebular dust extinction since traces the stellar attenuation, typically lower than the nebular (Calzetti et al., 2000). Assuming a larger nebular dust attenuation than in this work would only impact the dust-corrected flux values, which would be larger, hence yielding lower relative and absolute escape fractions than those reported in Table 4.
Second, we found that the absolute estimates obtained using the SMC dust extinction law or R16 dust extinction law are consistent within in GN 42912-NE. Since the SMC law (Gordon et al., 2003) yields larger and more conservative estimates, it is, in the context of this work, a more prudent approach to setting estimates of the escape of ionizing photons in both galaxies.
Finally, the doublet ratio from Chisholm et al. (2020) and photoionization model methods based on Henry et al. (2018) are consistent within 1. These two methods have been validated on LyC leaking galaxies observations at low-, yet simulations at suggest that these methods may actually overpredict the relative escape fraction of LyC photons (Katz et al., 2022b).
Considering these three aspects collectively, we establish the final estimates for each galaxy as follows: for GN 42912-NE, we adopt the from the photoionization-based method with the SMC dust extinction law, resulting in a relative escape fraction of 31.0 per cent and an absolute LyC escape fraction of 8.5 per cent. Given the previously mentioned factors suggesting potential overestimation, we regard these values as upper limits. For GN 42912-SW, due to the lack of stringent constraints on the relative escape fraction, we apply a conservative upper limit on of 100 per cent, leading to an upper limit on the absolute escape fraction of 14 per cent when using the SMC dust extinction curve. In the following section, we evaluate these constraints in the context of samples of leaking and non-leaking galaxies at . We also examine these results alongside other indirect predictions obtained using alternative approaches from Jaskot et al. (2024a).
6 Comparison with low- Mg ii profiles and trends
In the previous section, we established reliable upper limits on the escape fractions of ionizing photons for GN 42912-NE and GN 42912-SW at 8.5 per cent and 14 per cent, respectively. Here, we delve into how these estimates compare to observations of LyC leaking galaxies at low redshifts. Section 6.1 compares the Mg ii profile of GN 42912-NE with those of a similar low-redshift leaking and non-leaking galaxy, Section 6.2 places our estimates in context with trends observed in low-redshift samples, and Section 6.3 explores the consistence of the estimates with alternative prediction models from Mascia et al. (2023) and Jaskot et al. (2024a).
6.1 Comparison to low- Mg ii profiles
For over two decades, observations of LyC-leaking galaxies were exceedingly rare (Leitet et al., 2013; Leitherer et al., 2016; Borthakur et al., 2014). A major breakthrough occurred with the detection of ten such galaxies in a series of Hubble Space Telescope observations, revealing significant values of up to 73 per cent (Izotov et al., 2016b, a, 2018a, 2018b). Building upon the lessons learned from these first detections, the LzLCS program (PI: Jaskot) Flury et al. (2022a) targetted a large number of LyC leaking candidates and nearly doubled the number of known LyC-leaking galaxies at , providing a valuable sample for deriving indirect diagnostics relevant to high redshifts (Flury et al., 2022b) and shedding light on the physical mechanisms behind the escape of ionizing photons (e.g. Saldana-Lopez et al., 2022; Amorín et al., 2024; Leclercq et al., 2024; Jaskot et al., 2024a; Wang et al., 2021; Bait et al., 2023).
Xu et al. (2023, 2022) and Leclercq et al. (2024) presented the Mg ii emission profiles of the LyC leaking and non-leaking galaxies from the LzLCS sample (Flury et al., 2022a). Here we compare the Mg ii profile of GN 42912-NE with the Mg ii profiles of two low-redshift galaxies from this sample. For a consistent comparison, we colvolve the line profiles of the low- galaxies to the resolution of the NIRSpec-G235H instrument.
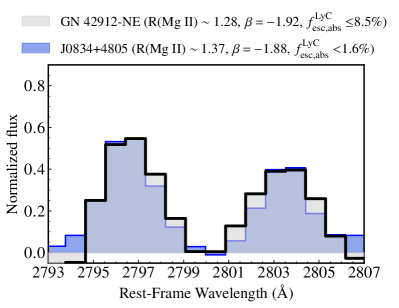
In the left panel of Figure 3, we compare GN 42912-NE with J1648+4957, a , , log( galaxy with an escape fraction of LyC photons, determined directly using observations of the ionizing flux (Å), of 2.6 per cent. We chose this galaxy because its Mg ii profile is typical of the profile of LyC leaking galaxies at low redshift. R(Mg ii) is 1.83, close to that optically thin limit of 2, and corresponds to a Mg ii relative escape fraction of 49 per cent (determined using the photoionization model approach; Xu et al., 2023). The Mg ii lines in GN 42912-NE are noticeably broader than those in J1648+4957, suggesting that resonant scattering significantly influences the line shape, while, in contrast, the Mg ii lines in J1648+4957 likely validate the optically thin assumption. It is interesting to observe that despite an R(Mg ii) close to the optically thin limit, the absolute of J1648+4957 is relatively low. This can be explained by the presence of a significant dust extinction of the ionizing photons as J1648+4957 is relatively red, with . This case particularly emphasizes that accurate constraints must account for both the neutral gas and the dust extinction along the line of sight.
The right panel of Figure 3 compares the Mg ii profile of GN 42912-NE with that of J0834+4805 at with and log(. Direct observations of the ionizing flux in J0834+4805 put constraints on per cent (Flury et al., 2022a). The comparison with this galaxy is most interesting because J0834+4805 has striking similarities with GN 42912-NE, with a highly consistent Mg ii profile (with R1.37), a slope of , and an O32 ratio of 4.3 as compared to 5.3 in GN 42912-NE. The similarities between both galaxies suggest that the upper limit established for GN 42912-NE is realistic, if not too conservative. Overall, the comparison to both low- galaxies further strengthens the idea that the in GN 42912-NE is likely weak if not absent.
Comparing higher-redshift objects to lower-redshift analogues comes with the assumption that both populations closely resemble each other. Although the first few years of JWST observations have revealed a population of high-redshift objects with significantly different properties than those found in the local universe, (e.g. subdued dust contents, Cullen et al. 2023, or higher ionization, Bunker et al. 2023; Tang et al. 2023), multiple studies have pointed out the similarities in the spectral properties of high and low redshift star-forming galaxies (Schaerer et al., 2022; Trump et al., 2023; Rhoads et al., 2023). GN 42912-NE’s Mg ii features show remarkable similarities to galaxies in the nearby universe. This similarity brings confidence to the conclusion that GN 42912-NE is very likely not a dominant contributor to the ionizing photon budget of reionization.
6.2 Comparison to lower redshift trends
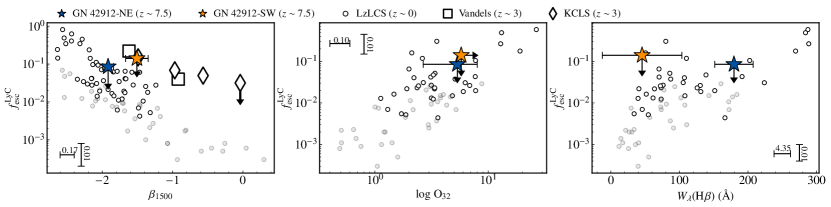
Here, we compare the upper limits on for GN 42912-NE and GN 42912-SW with LyC trends observed within the universe. We compare to publicly available properties of leaking and non-leaking galaxies from the LzLCS sample at (Flury et al., 2022a), the VANDELS sample at (McLure et al., 2018; Pentericci et al., 2018; Begley et al., 2022), and the KCLS sample at (Steidel et al., 2018; Pahl et al., 2021). In all three samples, the constraints are determined using spectral or photometric observations of the ionizing flux. All three samples have established significant correlations between and various properties such as Ly profile properties, O32, , and the surface density of star formation .
Here, we focus exclusively on the relationship of with three properties: the slopes at 1500Å (measured from wavelengths between 1500 and 2000 Å), the O32 ratios, and (H). We note that the KCLS and VANDELS samples only appear in the - slopes comparison as we do not have the O32 ratios and (H) for the same points. We also deliberately exclude Ly from this comparison. This may seem surprising given that GN 42912 has a Ly equivalent width constraint of Å from Jung et al. (2020) and observational studies have shown strong correlations between LyC and Ly properties. However, as discussed in Section 3.1, the absence of Ly detection in the PRISM observation of the same system from JADES indicates that Ly emission may only be coming from one of the two components. The current observations do not provide enough information to determine which component it is emerging from. Therefore, we exclude Ly from this section to avoid potential misinterpretation.
Figure 4 shows the three panels comparing the constraints of the GN 42912-SW and GN 42912-NE with , O32, and (H) trends. We observe that the upper limit derived for GN 42912-NE consistently aligns with the trends observed in the LzLCS sample. Regarding GN 42912-SW, its upper limit stands slightly above the and (H). This is not unexpected since we used the most conservative upper limit of 100 per cent on the relative escape fraction of LyC photons in this galaxy given the absence of Mg ii and [O ii] detection. Assuming a of 50 per cent instead would have yielded an absolute escape fraction to 7 per cent, aligning with the observed trends.
The comparison between constraints and the slopes shown in the first panel of Figure 4 presents interesting outcomes. This comparison includes data from the three samples of leaking and non-leaking galaxies at and . As noted in previous studies (e.g. Saldana-Lopez et al., 2023), the values of galaxies from the KCLS and VANDELS samples are significantly higher than those of low- galaxies from the LzLCS sample for similar slopes. This suggests that, for equivalent dust extinction properties, the galaxies allow more ionizing photons to escape compared to their low-redshift counterparts. This implies an evolution of the relative escape fraction of ionizing photons, potentially indicating a more neutral gas-depleted environment in these higher-redshift galaxies (see also discussion in Saldana-Lopez et al., 2023). However, the upper limit of GN 42912-NE aligns consistently with the trends observed at , while GN 42912-SW’s upper limit is consistent with both the and trends. Although our data is limited and prevents a definite conclusion, these first two constraints may challenge the hypothesis of a simple linear redshift evolution of the relative escape fraction and, by extension, the neutral gas content. Further observations of LyC-leaking galaxies across different cosmic times are necessary to better understand the potential evolution of the relative escape fraction across redshifts.
In summary, Figure 4 highlights that the upper limits determined for GN 42912-NE and GN 42912-SW align with the trends observed in the universe, suggesting that the low- empirical relations may be appropriate for high-redshift studies. However, the validity of this comparison hinges on the extent to which higher redshift objects can be appropriately compared with their low-redshift counterparts. Ultimately, only future observations and constraints on the of high- galaxies will bring clarity on this matter.
6.3 Comparison to alternative predictions
Two recent studies proposed alternative approaches to indirectly estimating using galaxy properties that are accessible with JWST. Mascia et al. (2023) introduced a multivariate equation for determining based on , the half-light radii (), and the O32 ratio. This equation was also adapted for cases where (H) is measured instead of the O32 ratio, since both quantities are tightly correlated (Mascia et al., 2024). More recently, Jaskot et al. (2024a) utilized the Cox proportional hazards model (Cox, 1972) to generate multivariate models for . They found that models incorporating (or alternatively E(B-V)UV), O32, and the surface density star formation rate () successfully reproduced values in LyC leaking and non-leaking galaxies at and . Both Jaskot et al. (2024a) and Mascia et al. (2023) developed their models using primarily the LzLCS sample and generally provide consistent estimates. However, Jaskot et al. (2024a) noted that in the low regime (0.05), the recipe from Mascia et al. (2023) tends to overpredict . This mainly occurs because their linear multivariate analysis does not robustly account for non-detections and upper limits, while the Cox proportional hazards model does.
In this section, we compare the Mg ii-based estimates with predictions derived using the models of Jaskot et al. (2024a) and Mascia et al. (2023), utilizing the constraints on , O32, SFR, and for GN 42912-NE and GN 42912-SW. For GN 42912-NE, the models from Jaskot et al. (2024a) predict of 0.020, which is negligible and consistent with the upper limit derived using Mg ii. Models from Mascia et al. (2023) yield an expected leakage of 0.108, which is higher but still consistent with the Mg ii-based upper limit. The difference between the predictions from Mascia et al. (2023) and Jaskot et al. (2024a) is intriguing yet not unexpected since Jaskot et al. (2024a) found similar discrepancies when is used instead of . Since Jaskot et al. (2024a) predictions better reproduce the of LyC leaking galaxies, its prediction may more accurately represent the expected leakage in GN 42912-NE.
For GN 42912-SW, both approaches yield consistent estimates: Jaskot et al. (2024a)’s model predicts of 0.005, while Mascia et al. (2023)’s model predicts 0.026. These values are derived using the lower limit on O32. Assuming an O32 of 20 instead would increase the central value by approximately 3% in both cases, maintaining minimal expected leakage. Overall, these estimates are consistent with the Mg ii-based upper limit of 14%.
7 The expected contribution of GN 42912-NE and GN 42912-SW to reionization
Using the constraints established in this work, we discuss here the expected impact of GN 42912-NE and GN 42912-SW on the neutral IGM (Section 7.1) and their constraints in the context of the - relations predicted by pre-JWST reionization models (Section 7.2).
7.1 Ionizing emissivity and bubble size
The exact impact of galaxies on their surrounding medium depends on as well as the number of ionizing photons produced by the stars within the galaxy, . This parameter can be estimated using the H luminosity (L(H)), as hydrogen recombination lines are relatively insensitive to metallicity and electron temperature (Charlot & Longhetti, 2001). We follow the same approach described in Marques-Chaves et al. (2022), using the equation that relates L(H) to
| (9) |
where is the nebular emission coefficient over the recombination rate in the Case B scenario (Osterbrock & Ferland, 2006). Using the DC scenario, we infer s-1 for GN 42912-NE and s-1 for GN 42912-SW. From , we can directly infer an upper limit on , the escaping rate of ionizing photons, which is simply . We find s-1 for GN 42912-NE and s-1 for GN 42912-SW.
While the emission rate of ionizing photons provides valuable information, it is more insightful to translate this into an estimate of the size of the ionized regions that both objects can create during the EoR given their ionizing escape rate. This aspect has been explored in other studies (e.g. Larson et al., 2022; Endsley et al., 2021; Torralba-Torregrosa et al., 2024), particularly in the context of understanding the detection of Ly at high redshift (), where the IGM is expected to be predominantly optically thick. In such scenarios, Ly detections may be attributed to the presence of sufficiently large ionized regions that allow the transmission of Ly photons (typically 1 pMpc allow 50% of the Ly photons in the absence of kinematic effects, Mason & Gronke 2020; Endsley et al. 2022; Jung et al. 2024b). Following the methodology of Larson et al. (2022); Endsley et al. (2021); Mason & Gronke (2020), which originates from Cen & Haiman (2000), we estimate the size of the ionized region around the two galaxies as
| (10) |
where is the duration of the current star formation phase and is the mean hydrogen density of the redshift of the source. Here we do not have robust constraints on the star-formation history so we adopt Myrs, similarly as in Larson et al. (2022).
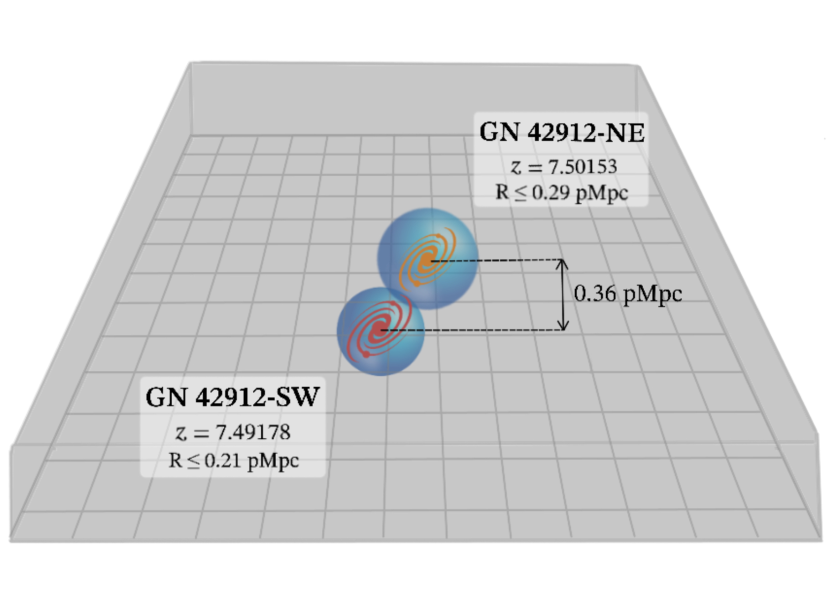
Using the values inferred above, we estimate the sizes of the ionized regions around GN 42912-NE and GN 42912-SW to be approximately 0.29 pMpc and 0.21 pMpc, respectively (see Figure 5). Assuming a time span of 10 Myr, the sizes would be 0.23 pMpc for GN 42912-NE and 0.16 pMpc for GN 42912-SW. These regions are relatively small and indicate a minimal contribution to the ionization of the surrounding neutral IGM. However, the transverse separation between both objects is 3.1 cMpc, which is 0.36 pMpc at this redshift. This means that the ionized regions around both objects may overlap.
A typical ionized region size of 1 pMpc is required for significant Ly photon transmission in the absence of kinematic effects (Mason & Gronke, 2020). While the ionized bubbles around GN 42912-NE and GN 42912-SW are smaller than this threshold, Jung et al. (2020) reported a significant Ly detection with an equivalent width of 33.2Å, indicating favorable conditions for Ly photon propagation from at least one of these galaxies. We explore several scenarios that might explain the Ly detection in the GN 42912 system.
One possibility is that fainter galaxies, which are currently undetected, could be contributing to the ionizing emissivity around both objects, potentially enlarging the actual size of the ionized region beyond what is accounted for by the ionizing photons escaping the two most luminous objects. However, Endsley et al. (2023a) did not find evidence of a significant photometric overdensity around the GN 42912 system, which would support this hypothesis.
Another scenario to reconcile the significant Ly emission detection is the overlap of their ionized bubbles. The combined maximum size of the regions around each object (0.29 pMpc and 0.21 pMpc) exceeds their physical separation at this redshift (0.36 pMpc). In this case, Ly photons from GN 42912-NE could experience enhanced transmission due to the larger effective bubble size created by overlapping bubbles.
Additionally, kinematic effects may contribute to the Ly detection. The transmission of Ly photons depends on the velocity offset of the Ly emission relative to the systemic velocity (Mason & Gronke, 2020; Endsley et al., 2022). For a velocity offset of 400 km s-1, an ionized region with a radius of 0.2 pMpc corresponds to a 40% transmission rate, which drops to 20% for a 750 km s-1 offset. Jung et al. (2020) determined that the peak of the Ly emission is at m. This wavelength translates to a velocity offset of approximately 150 km s-1 for GN42912-NE and 500 km s-1 for GN42912-SW. If the Ly originates from GN42912-NE, the measured bubble size (not considering potential overlap) would only transmit 5% of the escaping Ly photons, necessitating a significant intrinsic Ly emission to explain the detection. Conversely, if Ly originates from GN42912-SW, the 500 km s-1 velocity offset results in about a 30% transmission rate within an ionized region of 0.2 pMpc, making the Ly detection plausible in this scenario.
Overall, further spatial Ly mapping is required to pinpoint the origin and physical mechanisms behind the significant Ly detection in the GN 42912 system. Importantly, the derived limits on the ionizing escape rates and ionized regions support the conclusion that both galaxies contribute minimally to the ionization of the surrounding neutral gas, emphasizing their weak role in reionizing the IGM hydrogen.
7.2 the constraints of GN 42912 in the context of state-of-the-art reionization models
Understanding reionization from the perspective of star-forming galaxies would have been straightforward in the perspective of the pre-JWST era because many past theoretical studies assumed that star-forming galaxies produced stars at a nearly constant rate that produced a single, subdued value. In this context, one only needs to constrain the ionizing emissivity of both faint and bright galaxies and identify which sources dominated the ionizing photon budget. However, recent JWST observations have significantly altered our understanding of reionization with the observations of early galaxies with remarkably high ionizing efficiencies ( 25.5 Atek et al., 2024; Simmonds et al., 2024; Endsley et al., 2023b; Prieto-Lyon et al., 2023; Hsiao et al., 2024; Pahl et al., 2024), alongside highly star-forming galaxy populations at (Finkelstein et al., 2023; Harikane et al., 2023; Eisenstein et al., 2023). Both aspects pose challenges to theoretical ionizing budgets, suggesting an extremely rapid reionization ending at (Muñoz et al., 2024; Atek et al., 2024). This rapid reionization timeline conflicts with the measurements from Planck (Planck Collaboration et al., 2021) and observations of damped Ly wings in quasars at (e.g Greig et al., 2019).
Muñoz et al. (2024) explores potential solutions to this ionizing photon budget crisis, proposing that the average of galaxies could be lower (around 3 per cent) than previously anticipated from models based on lower redshift observations. In this scenario, the high ionizing efficiencies of star-forming galaxies would not contradict current constraints on the reionization history, because the actual amount of ionizing photons escaping from these galaxies is minimal. This scenario, already hinted by the observations of galaxies with unexpectedly low escape fractions at (Jung et al., 2024a), becomes plausible if high-redshift galaxies are surrounded by larger and denser neutral gas environments, which would significantly reduce the effective and thus their overall contribution to the reionization process.
In this context, constraining the of high- objects is not only crucial for understanding the contributions of faint and bright galaxies to reionization but has now become essential to determine if these objects exhibit sufficiently low LyC leakage to reconcile theoretical models with current observations. In this section, we compare our estimates for GN 42912-NE and GN 42912-SW against pre-JWST reionization models and the ongoing ionizing photon budget crisis.
In Figure 6, we present three pre-JWST models describing the evolution of the average as a function of UV magnitude at 1500Å. The first model is by Chisholm et al. (2022), based on observations of LyC-leaking galaxies from the LzLCS sample (Flury et al., 2022a). This model builds on the to relation established in the latter sample and the evolution of the –MUV colour–luminosity relationship established by Bouwens et al. (2014). Since fainter galaxies are empirically found to be bluer, the to relation suggests that fainter galaxies have higher .
The other two models are from Matthee et al. (2022), based on observations of bright Ly emitters (LAEs) at with fiducial LyC escape fractions of around 50 per cent (Naidu et al., 2022). These models posit that a sub-population of LAEs dominates the reionization budget, naturally reproducing the evolution of emissivity at . Here we plot two of these models, Model 1 assumes that half of the LAEs have = 50 per cent, and Model 2 assumes = 25 per cent. This translates to the faintest LyC-contributing galaxy having a limiting Ly luminosity of 1042.2 erg s-1 in Model 1, and 1041.2 erg s-1 in Model 2.
Figure 6 illustrates how these different models behave as a function of . Chisholm et al. (2022)’s faint-galaxy model shows a steady increase with 5 per cent for . Model 1 from Matthee et al. (2022), with half of the LAEs having = 50 per cent, peaks at with an average around 12 per cent. Model 2, with = 25 per cent, peaks at with an average around 8 per cent. Interestingly, Model 2 and Chisholm et al. (2022)’s model, despite their distinct assumptions, are consistent up to . The main difference lies in the - relation in Matthee et al. (2022)’s models, where the reionization budget is dominated by a sub-population of LAEs, leading to a peaked relation that depends on the assumed for the LAE sub-population.
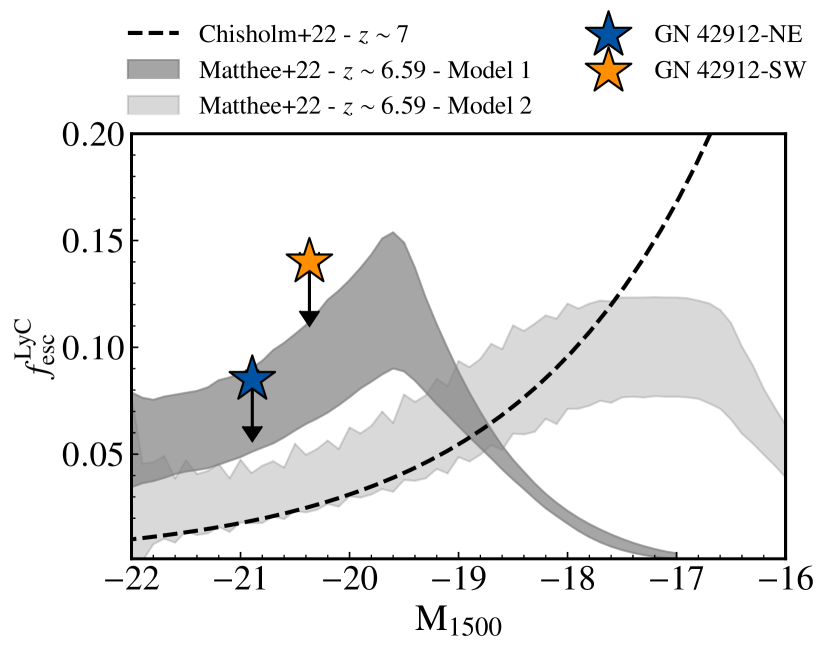
We overlaid the of GN 42912-NE and GN 42912-SW on Figure 6. As conservative upper limits, Figure 6 demonstrates that these constraints alone do not offer conclusive evidence for favoring any model over the others. Yet, both models from Matthee et al. (2022) assume that 50 per cent of the LAEs contributing to reionization have 25 per cent (Model 2) and 50% (Model 1). The upper limits of per cent for GN 42912-NE and per cent for GN 42912-SW suggest these two galaxies do not resemble the luminous LAEs that could explain reionization in such models.
While the contributions of GN 42912-NE and GN 42912-SW to the early universe’s reionization are expected to be minimal, these isolated constraints are insufficient to significantly favor a faint or bright galaxy-dominated reionization model. Accurately determining the most relevant reionization model likely necessitates establishing for galaxies with faint UV magnitudes, specifically around mag, where the average predicted by each model is sufficiently different to be distinguishable. Future JWST programs focusing on the faint end of the galaxy population may be key to tipping the balance toward a certain reionization model.
Finally, the constraints of GN 42912-NE and GN 42912-SW also fall short of addressing whether reionization-era galaxies have lower than those predicted by pre-JWST models, a factor that could potentially resolve the current ionizing budget crisis (Muñoz et al., 2024). Indeed, the upper limits derived do not definitively exclude the possibility of being greater than 3-5 per cent. If bright galaxies indeed emit an excessive number of ionizing photons, our findings do not conclusively argue that a reduced would align these observations with the reionization history of the universe. In general, while this study represents an important initial effort to constrain at high redshifts, it underscores the critical need for additional, and preferably more precise, constraints on in high-redshift galaxies to reconcile existing models with new observational data.
8 Conclusions
In this study, we analyzed the JWST NIRSpec high-resolution G235H and G395H observations of GN 42912, a bright Ly system at initially reported by Finkelstein et al. (2013). These observations were part of the JWST program 1871 (PI: Chisholm), with the primary objective of detecting the Mg ii 2796,2803 doublet to indirectly estimate the escape fraction of ionizing photons, building upon methodologies established and calibrated in the low- universe by Henry et al. (2018) and Chisholm et al. (2020).
The JWST observations unveiled that GN 42912 comprises two galaxies, denoted as GN 42912-NE and GN 42912-SW, separated by 358 km s-1 in velocity and 01 on the sky ( kpc). GN 42912-NE has a stellar mass of , a UV magnitude of mag, , a moderate O32 ratio of 5.3, and a gas-phase metallicity estimated at using metallicity calibrations based on R23 and O32. Meanwhile, GN 42912-SW features a stellar mass of , a UV magnitude of mag, , an O32 ratio exceeding 5.5, and a gas-phase metallicity estimated around .
Our analysis primarily focused on the Mg ii observations of GN 42912-NE to constrain the escape of ionizing photons in this object. GN 42912-NE exhibits clear detections of both lines, enabling us to employ two distinct approaches to estimate , the Mg ii doublet approach relying on the ratio of the two lines (Chisholm et al., 2020), and a comparison to the Mg ii intrinsic flux determined using photoionization models (Henry et al., 2018). We found that the estimates determined from both approaches are consistent within . We calculated several estimates of the LyC escape fraction considering scenarios with and without dust and using two dust attenuation laws (the SMC law by Gordon et al. 2003 and the Reddy et al. 2016 attenuation law) to explore the consequent variations on the indirect measurements. We find that the scenario without dust yields large estimates ( per cent), yet GN 42912-NE has a slope of , rendering this scenario an extreme scenario. constraints based on a more realistic scenario where is used as an empirical tracer of the dust extinction yields absolute escape fraction estimates between 6 and 14 per cent.
The absence of Mg ii and [O ii] detections in GN 42912-SW prevents us from using the Mg ii based indirect approaches to establish constraints on the relative escape fraction of LyC photons in this galaxy. We assumed an upper limit of 100 per cent on the relative escape fraction (i.e., an absence of neutral gas), which yields absolute escape fractions less than 14 per cent (8.9 per cent) once accounting for the dust extinction at 912Å and using the SMC (R16) dust extinction law.
We addressed the caveats of using Mg ii to estimate (Section 5.2). Mostly, these caveats, found by analyzing the relation between Mg ii and in simulations, suggest that the estimates derived using the Chisholm et al. (2020) or Henry et al. (2018) methods may be overpredicting and should be regarded as strict upper limits. We concluded that is realistically less than 8.5 per cent in GN 42912-NE and less than 14 per cent in GN 42912-SW. These two estimates are consistent with alternative prediction models from Mascia et al. (2023) and Jaskot et al. (2024a) which also support a weak ionizing leakage in both objects (Section 6.3).
In Section 6, we compared these estimates to trends established from LyC leakers and non-leakers in the universe from the LzLCS (z0.3, Flury et al., 2022a), KCLS (z3, Steidel et al., 2018), and VANDELS (z3, McLure et al., 2018; Pentericci et al., 2018) samples. We showed that the values of GN 42912-NE and GN 42912-SW are consistent with the -, -O32, and -(H) trends seen at . This suggests that local indirect tracers of LyC escape may be appropriate for observations of galaxies within the epoch of reionization. On the other hand, at fixed , these constraints stand in line or lower than the constraints, suggesting that their neutral gas distributions may be more similar to leakers.
We derived the limit on the expected size of the ionized region around each object in Section 7.1. We found that the ionizing escape rate in GN 42912-NE corresponds to an ionized bubble with R pMpc for GN 42912-NE and R pMpc for GN 42912-SW, given the expected hydrogen density at . These small inferred sizes further emphasize that both GN 42912-NE and GN 42912-SW likely have a minimal impact on the ionization of the hydrogen in the IGM at .
Finally, Section 7 discusses these first constraints in the context of three reionization models, namely one model where relatively faint galaxies () dominate reionization (Chisholm et al., 2022), and two models where a sub-population of luminous LAEs with =50 per cent or =25 per cent furnish the bulk of ionizing photons (Matthee et al., 2022). We show that the current observations give limited constraints on the prevalence of one or the other models, but, given the weak expected leakage in these two luminous objects, these galaxies do not resemble the few potential bright objects that could explain reionization by having large .
This paper presents the first Mg ii-based constraints on the of galaxies during the EoR. While these constraints alone are insufficient to significantly determine the overall contribution of luminous galaxies to reionization, they represent an initial step by indicating a weak or possibly negligible leakage from two relatively bright galaxies at . Given the current context where JWST has revealed galaxies with exceptionally high intrinsic production of ionizing photons, further constraints are crucial. These will help to assess whether the actual ionizing photon leakage from galaxies in the EoR is lower than previously anticipated by pre-JWST models.
Acknowledgements
This work is based on observations made with the NASA/ESA/CSA James Webb Space Telescope. The data were obtained from the Mikulski Archive for Space Telescopes at the Space Telescope Sci- ence Institute, which is operated by the Association of Universities for Research in Astronomy, Inc., under NASA contract NAS 5-03127 for JWST. These observations are associated with program #01871. Support for program #01871 was provided by NASA through a grant from the Space Telescope Science Institute, which is operated by the Association of Universities for Research in Astronomy, Inc., under NASA contract NAS 5-03127. SG is grateful for the support enabled by the Harlan J. Smith McDonald fellowship. Y.I. and N.G. acknowledge support from the Simons Foundation and the National Academy of Sciences of Ukraine (Project 0121U109612). ASL acknowledges support from Knut and Alice Wallenberg Foundation.
Data Availability
The data underlying this paper is available upon reasonable request.
References
- Amorín et al. (2024) Amorín R. O., et al., 2024, A&A, 682, L25
- Asplund et al. (2021) Asplund M., Amarsi A. M., Grevesse N., 2021, A&A, 653, A141
- Atek et al. (2024) Atek H., et al., 2024, Nature, 626, 975
- Bait et al. (2023) Bait O., et al., 2023, arXiv e-prints, p. arXiv:2310.18817
- Barbary (2016) Barbary K., 2016, The Journal of Open Source Software, 1, 58
- Barkana & Loeb (2001) Barkana R., Loeb A., 2001, Phys. Rep., 349, 125
- Begley et al. (2022) Begley R., et al., 2022, Monthly Notices of the Royal Astronomical Society, 513, 3510
- Bian et al. (2017) Bian F., Fan X., McGreer I., Cai Z., Jiang L., 2017, The Astrophysical Journal, 837, L12
- Böker et al. (2023) Böker T., et al., 2023, PASP, 135
- Borthakur et al. (2014) Borthakur S., Heckman T. M., Leitherer C., Overzier R. A., 2014, Science, 346, 216
- Bouwens et al. (2014) Bouwens R. J., et al., 2014, ApJ, 793, 115
- Boyer et al. (2022) Boyer M. L., et al., 2022, Research Notes of the American Astronomical Society, 6, 191
- Brammer (2023) Brammer G., 2023, msaexp: NIRSpec analyis tools, Zenodo, doi:10.5281/zenodo.7299500
- Bruzual & Charlot (2003) Bruzual G., Charlot S., 2003, MNRAS, 344, 1000
- Bunker et al. (2023) Bunker A. J., et al., 2023, arXiv e-prints, p. arXiv:2306.02467
- Calzetti et al. (2000) Calzetti D., Armus L., Bohlin R. C., Kinney A. L., Koornneef J., Storchi-Bergmann T., 2000, ApJ, 533, 682
- Cameron et al. (2023) Cameron A. J., Katz H., Witten C., Saxena A., Laporte N., Bunker A. J., 2023, Nebular dominated galaxies in the early Universe with top-heavy stellar initial mass functions (arXiv:2311.02051)
- Carnall et al. (2018) Carnall A. C., McLure R. J., Dunlop J. S., Davé R., 2018, MNRAS, 480, 4379
- Casey et al. (2024) Casey C. M., Akins H. B., Kokorev V., McKinney J., Cooper O. R., Long A. S., Franco M., Manning S. M., 2024, arXiv e-prints, p. arXiv:2407.05094
- Cen & Haiman (2000) Cen R., Haiman Z., 2000, ApJ, 542, L75
- Chang & Gronke (2024) Chang S.-J., Gronke M., 2024, MNRAS, 532, 3526
- Charlot & Longhetti (2001) Charlot S., Longhetti M., 2001, MNRAS, 323, 887
- Chisholm et al. (2020) Chisholm J., Prochaska J. X., Schaerer D., Gazagnes S., Henry A., 2020, MNRAS, 498, 2554
- Chisholm et al. (2022) Chisholm J., et al., 2022, MNRAS, 517, 5104
- Chisholm et al. (2024) Chisholm J., et al., 2024, arXiv e-prints, p. arXiv:2402.18643
- Choustikov et al. (2023) Choustikov N., et al., 2023, arXiv e-prints, p. arXiv:2304.08526
- Cox (1972) Cox D. R., 1972, Journal of the Royal Statistical Society: Series B (Methodological), 34, 187
- Cullen et al. (2023) Cullen F., et al., 2023, arXiv e-prints, p. arXiv:2311.06209
- Curti et al. (2020) Curti M., Mannucci F., Cresci G., Maiolino R., 2020, MNRAS, 491, 944
- Dayal & Ferrara (2018) Dayal P., Ferrara A., 2018, Phys. Rep., 780, 1
- Dayal et al. (2020) Dayal P., et al., 2020, MNRAS, 495, 3065
- Dayal et al. (2024) Dayal P., et al., 2024, arXiv e-prints, p. arXiv:2401.11242
- Dijkstra et al. (2016) Dijkstra M., Gronke M., Venkatesan A., 2016, ApJ, 828, 71
- Donnan et al. (2023) Donnan C. T., et al., 2023, MNRAS, 518, 6011
- Eisenstein et al. (2023) Eisenstein D. J., et al., 2023, arXiv e-prints, p. arXiv:2306.02465
- Endsley et al. (2021) Endsley R., Stark D. P., Charlot S., Chevallard J., Robertson B., Bouwens R. J., Stefanon M., 2021, Monthly Notices of the Royal Astronomical Society, 502, 6044
- Endsley et al. (2022) Endsley R., et al., 2022, MNRAS, 517, 5642
- Endsley et al. (2023a) Endsley R., et al., 2023a, arXiv e-prints, p. arXiv:2306.05295
- Endsley et al. (2023b) Endsley R., Stark D. P., Whitler L., Topping M. W., Chen Z., Plat A., Chisholm J., Charlot S., 2023b, MNRAS, 524, 2312
- Endsley et al. (2023c) Endsley R., Stark D. P., Whitler L., Topping M. W., Chen Z., Plat A., Chisholm J., Charlot S., 2023c, MNRAS, 524, 2312
- Ferland et al. (2013) Ferland G. J., et al., 2013, Rev. Mex. Astron. Astrofis., 49, 137
- Ferland et al. (2017) Ferland G. J., et al., 2017, Rev. Mex. Astron. Astrofis., 53, 385
- Finkelstein et al. (2012) Finkelstein S. L., et al., 2012, ApJ, 758, 93
- Finkelstein et al. (2013) Finkelstein S. L., et al., 2013, Nature, 502, 524
- Finkelstein et al. (2015) Finkelstein S. L., et al., 2015, ApJ, 810, 71
- Finkelstein et al. (2019) Finkelstein S. L., et al., 2019, ApJ, 879, 36
- Finkelstein et al. (2023) Finkelstein S. L., et al., 2023, ApJ, 946, L13
- Finkelstein et al. (2024) Finkelstein S. L., et al., 2024, ApJ, 969, L2
- Fletcher et al. (2019) Fletcher T. J., Tang M., Robertson B. E., Nakajima K., Ellis R. S., Stark D. P., Inoue A., 2019, ApJ, 878, 87
- Flury et al. (2022a) Flury S. R., et al., 2022a, ApJS, 260, 1
- Flury et al. (2022b) Flury S. R., et al., 2022b, ApJ, 930, 126
- Furlanetto et al. (2006) Furlanetto S. R., Oh S. P., Briggs F. H., 2006, Phys. Rep., 433, 181
- Furtak et al. (2024) Furtak L. J., et al., 2024, Nature, 628, 57
- Gazagnes et al. (2018) Gazagnes S., Chisholm J., Schaerer D., Verhamme A., Rigby J. R., Bayliss M., 2018, A&A, 616, A29
- Gazagnes et al. (2020) Gazagnes S., Chisholm J., Schaerer D., Verhamme A., Izotov Y., 2020, A&A, 639, A85
- Gazagnes et al. (2021) Gazagnes S., Koopmans L. V. E., Wilkinson M. H. F., 2021, MNRAS, 502, 1816
- Gazagnes et al. (2024) Gazagnes S., et al., 2024, ApJ, 969, 50
- Gordon et al. (2003) Gordon K. D., Clayton G. C., Misselt K. A., Landolt A. U., Wolff M. J., 2003, ApJ, 594, 279
- Greig & Mesinger (2015) Greig B., Mesinger A., 2015, MNRAS, 449, 4246
- Greig et al. (2019) Greig B., Mesinger A., Bañados E., 2019, MNRAS, 484, 5094
- Guseva et al. (2013) Guseva N. G., Izotov Y. I., Fricke K. J., Henkel C., 2013, A&A, 555, A90
- Guseva et al. (2019) Guseva N. G., Izotov Y. I., Fricke K. J., Henkel C., 2019, A&A, 624, A21
- Harikane et al. (2023) Harikane Y., et al., 2023, ApJS, 265, 5
- Henry et al. (2018) Henry A., Berg D. A., Scarlata C., Verhamme A., Erb D., 2018, ApJ, 855, 96
- Hsiao et al. (2024) Hsiao T. Y.-Y., et al., 2024, arXiv e-prints, p. arXiv:2404.16200
- Hutchison et al. (2019) Hutchison T. A., et al., 2019, ApJ, 879, 70
- Izotov et al. (2016a) Izotov Y. I., Schaerer D., Thuan T. X., Worseck G., Guseva N. G., Orlitová I., Verhamme A., 2016a, MNRAS, 461, 3683
- Izotov et al. (2016b) Izotov Y. I., Orlitová I., Schaerer D., Thuan T. X., Verhamme A., Guseva N. G., Worseck G., 2016b, Nature, 529, 178
- Izotov et al. (2018a) Izotov Y. I., Schaerer D., Worseck G., Guseva N. G., Thuan T. X., Verhamme A., Orlitová I., Fricke K. J., 2018a, MNRAS, 474, 4514
- Izotov et al. (2018b) Izotov Y. I., Worseck G., Schaerer D., Guseva N. G., Thuan T. X., Fricke A. V., Orlitová I., 2018b, MNRAS, 478, 4851
- Izotov et al. (2021) Izotov Y. I., Worseck G., Schaerer D., Guseva N. G., Chisholm J., Thuan T. X., Fricke K. J., Verhamme A., 2021, MNRAS, 503, 1734
- Jaskot et al. (2024a) Jaskot A. E., et al., 2024a, arXiv e-prints, p. arXiv:2406.10171
- Jaskot et al. (2024b) Jaskot A. E., et al., 2024b, arXiv e-prints, p. arXiv:2406.10179
- Jenkins (2009) Jenkins E. B., 2009, ApJ, 700, 1299
- Jung et al. (2020) Jung I., et al., 2020, ApJ, 904, 144
- Jung et al. (2024a) Jung I., et al., 2024a, arXiv e-prints, p. arXiv:2403.02388
- Jung et al. (2024b) Jung I., et al., 2024b, ApJ, 967, 73
- Kannan et al. (2022) Kannan R., Garaldi E., Smith A., Pakmor R., Springel V., Vogelsberger M., Hernquist L., 2022, MNRAS, 511, 4005
- Katz et al. (2022a) Katz H., et al., 2022a, arXiv e-prints, p. arXiv:2211.04626
- Katz et al. (2022b) Katz H., et al., 2022b, MNRAS, 515, 4265
- Kimm et al. (2017) Kimm T., Katz H., Haehnelt M., Rosdahl J., Devriendt J., Slyz A., 2017, MNRAS, 466, 4826
- Kocevski et al. (2023) Kocevski D. D., et al., 2023, ApJ, 954, L4
- Kocevski et al. (2024) Kocevski D. D., et al., 2024, arXiv e-prints, p. arXiv:2404.03576
- Kramida et al. (2022) Kramida A., Ralchenko Y., Reader J., Team N. A., 2022, NIST Atomic Spectra Database (version 5.10), Online, doi:10.18434/T4W30F, https://physics.nist.gov/asd
- Kroupa & Boily (2002) Kroupa P., Boily C. M., 2002, MNRAS, 336, 1188
- Larson et al. (2022) Larson R. L., et al., 2022, The Astrophysical Journal, 930, 104
- Larson et al. (2023) Larson R. L., et al., 2023, ApJ, 953, L29
- Lebigot (2023) Lebigot E. O., 2023, Uncertainties: a Python package for calculations with uncertainties, Online, http://pythonhosted.org/uncertainties/
- Leclercq et al. (2024) Leclercq F., et al., 2024, arXiv e-prints, p. arXiv:2401.14981
- Leitet et al. (2013) Leitet E., Bergvall N., Hayes M., Linné S., Zackrisson E., 2013, A&A, 553, A106
- Leitherer et al. (2016) Leitherer C., Hernandez S., Lee J. C., Oey M. S., 2016, ApJ, 823, 64
- Lützgendorf et al. (2022) Lützgendorf N., et al., 2022, in Coyle L. E., Matsuura S., Perrin M. D., eds, Society of Photo-Optical Instrumentation Engineers (SPIE) Conference Series Vol. 12180, Space Telescopes and Instrumentation 2022: Optical, Infrared, and Millimeter Wave. p. 121800Y (arXiv:2208.05355), doi:10.1117/12.2630069
- Madau & Haardt (2015) Madau P., Haardt F., 2015, ApJ, 813, L8
- Madau et al. (1999) Madau P., Haardt F., Rees M. J., 1999, ApJ, 514, 648
- Madau et al. (2024) Madau P., Giallongo E., Grazian A., Haardt F., 2024, arXiv e-prints, p. arXiv:2406.18697
- Maiolino et al. (2023) Maiolino R., et al., 2023, arXiv e-prints, p. arXiv:2308.01230
- Maiolino et al. (2024) Maiolino R., et al., 2024, Nature, 627, 59
- Marques-Chaves et al. (2022) Marques-Chaves R., et al., 2022, arXiv e-prints, p. arXiv:2210.02392
- Mascia et al. (2023) Mascia S., et al., 2023, A&A, 672, A155
- Mascia et al. (2024) Mascia S., et al., 2024, A&A, 685, A3
- Mason & Gronke (2020) Mason C. A., Gronke M., 2020, MNRAS, 499, 1395
- Matthee et al. (2022) Matthee J., et al., 2022, Monthly Notices of the Royal Astronomical Society, 512, 5960
- Matthee et al. (2024) Matthee J., et al., 2024, ApJ, 963, 129
- Mauerhofer et al. (2021) Mauerhofer V., Verhamme A., Blaizot J., Garel T., Kimm T., Michel-Dansac L., Rosdahl J., 2021, A&A, 646, A80
- McElwain et al. (2023) McElwain M. W., et al., 2023, PASP, 135, 058001
- McLure et al. (2018) McLure R. J., et al., 2018, MNRAS, 479, 25
- Miralda-Escudé et al. (2000) Miralda-Escudé J., Haehnelt M., Rees M. J., 2000, ApJ, 530, 1
- Muñoz et al. (2024) Muñoz J. B., Mirocha J., Chisholm J., Furlanetto S. R., Mason C., 2024, arXiv e-prints, p. arXiv:2404.07250
- Naidu et al. (2020) Naidu R. P., Tacchella S., Mason C. A., Bose S., Oesch P. A., Conroy C., 2020, ApJ, 892, 109
- Naidu et al. (2022) Naidu R. P., et al., 2022, MNRAS, 510, 4582
- Oesch et al. (2023) Oesch P. A., et al., 2023, MNRAS, 525, 2864
- Osterbrock & Ferland (2006) Osterbrock D. E., Ferland G. J., 2006, Astrophysics of gaseous nebulae and active galactic nuclei
- Ouchi et al. (2009) Ouchi M., et al., 2009, ApJ, 706, 1136
- Pahl et al. (2021) Pahl A. J., Shapley A., Steidel C. C., Chen Y., Reddy N. A., 2021, MNRAS, 505, 2447
- Pahl et al. (2024) Pahl A. J., et al., 2024, arXiv e-prints, p. arXiv:2407.03399
- Pentericci et al. (2018) Pentericci L., et al., 2018, A&A, 616, A174
- Planck Collaboration et al. (2016) Planck Collaboration et al., 2016, A&A, 596, A108
- Planck Collaboration et al. (2021) Planck Collaboration et al., 2021, A&A, 652, C4
- Prieto-Lyon et al. (2023) Prieto-Lyon G., et al., 2023, ApJ, 956, 136
- Reddy et al. (2016) Reddy N. A., Steidel C. C., Pettini M., Bogosavljević M., 2016, ApJ, 828, 107
- Rhoads et al. (2023) Rhoads J. E., et al., 2023, ApJ, 942, L14
- Rigby et al. (2023) Rigby J., et al., 2023, PASP, 135, 048001
- Rivera-Thorsen et al. (2019) Rivera-Thorsen T. E., et al., 2019, Science, 366, 738
- Robertson et al. (2013) Robertson B. E., et al., 2013, ApJ, 768, 71
- Robertson et al. (2015) Robertson B. E., Ellis R. S., Furlanetto S. R., Dunlop J. S., 2015, ApJ, 802, L19
- Rosdahl et al. (2018) Rosdahl J., et al., 2018, MNRAS, 479, 994
- Saldana-Lopez et al. (2022) Saldana-Lopez A., et al., 2022, A&A, 663, A59
- Saldana-Lopez et al. (2023) Saldana-Lopez A., et al., 2023, MNRAS, 522, 6295
- Sanders et al. (2024) Sanders R. L., Shapley A. E., Topping M. W., Reddy N. A., Brammer G. B., 2024, ApJ, 962, 24
- Scarlata et al. (2024) Scarlata C., Hayes M., Panagia N., Mehta V., Haardt F., Bagley M., 2024, On the universal validity of Case B recombination theory (arXiv:2404.09015)
- Schaerer et al. (2022) Schaerer D., Marques-Chaves R., Barrufet L., Oesch P., Izotov Y. I., Naidu R., Guseva N. G., Brammer G., 2022, A&A, 665, L4
- Shapley et al. (2016) Shapley A. E., Steidel C. C., Strom A. L., Bogosavljević M., Reddy N. A., Siana B., Mostardi R. E., Rudie G. C., 2016, ApJ, 826, L24
- Sharma et al. (2016) Sharma M., Theuns T., Frenk C., Bower R., Crain R., Schaller M., Schaye J., 2016, MNRAS, 458, L94
- Simmonds et al. (2024) Simmonds C., et al., 2024, MNRAS, 527, 6139
- Steidel et al. (2018) Steidel C. C., Bogosavljević M., Shapley A. E., Reddy N. A., Rudie G. C., Pettini M., Trainor R. F., Strom A. L., 2018, ApJ, 869, 123
- Tang et al. (2023) Tang M., et al., 2023, JWST/NIRSpec Spectroscopy of Star Forming Galaxies with CEERS: New Insight into Bright Ly Emitters in Ionized Bubbles (arXiv:2301.07072), https://arxiv.org/abs/2301.07072
- Topping et al. (2024) Topping M. W., et al., 2024, Metal-poor star formation at with JWST: new insight into hard radiation fields and nitrogen enrichment on 20 pc scales (arXiv:2401.08764)
- Torralba-Torregrosa et al. (2024) Torralba-Torregrosa A., et al., 2024, arXiv e-prints, p. arXiv:2404.10040
- Trump et al. (2023) Trump J. R., et al., 2023, ApJ, 945, 35
- Vanzella et al. (2015) Vanzella E., et al., 2015, A&A, 576, A116
- Verhamme et al. (2015) Verhamme A., Orlitová I., Schaerer D., Hayes M., 2015, A&A, 578, A7
- Verhamme et al. (2017) Verhamme A., Orlitová I., Schaerer D., Izotov Y., Worseck G., Thuan T. X., Guseva N., 2017, A&A, 597, A13
- Wang et al. (2021) Wang B., et al., 2021, ApJ, 916, 3
- Worseck et al. (2014) Worseck G., et al., 2014, MNRAS, 445, 1745
- Xu et al. (2022) Xu X., et al., 2022, ApJ, 933, 202
- Xu et al. (2023) Xu X., et al., 2023, ApJ, 943, 94
- Yanagisawa et al. (2024) Yanagisawa H., et al., 2024, Balmer Decrement Anomalies in Galaxies at z 6 Found by JWST Observations: Density-Bounded Nebulae or Excited H I Clouds? (arXiv:2403.20118)
- de Barros et al. (2016) de Barros S., et al., 2016, A&A, 585, A51