The formation histories of massive and quiescent galaxies in the Universe.
Abstract
We present the formation histories of 19 massive (M⊙) quiescent galaxy candidates at observed using JWST/NIRSpec. This completes the spectroscopic confirmation of the 24 -selected quiescent galaxy sample from the ZFOURGE and 3DHST surveys (Schreiber et al., 2018a). Utilizing Prism m spectroscopy, we confirm that all 12 sources that eluded confirmation by ground-based spectroscopy lie at , resulting in a spectroscopically confirmed number density of between . Rest-frame vs color selections show high effectiveness in identifying quiescent galaxies, with a purity of . Our analysis shows that parametric star-formation histories (SFHs) from FAST++ and binned SFHs from Prospector on average yield consistent results, revealing diverse formation and quenching times. The oldest galaxy formed M⊙ by and has been quiescent for over 1 Gyr at . We detect two galaxies with ongoing star formation and six with active galactic nuclei (AGN). We demonstrate that the choice of stellar population models, stellar libraries, wavelength range, and nebular or AGN contributions does not significantly affect the derived average SFHs of the galaxies. The assumed SFH prior, however, influences the star formation rate at early times, where spectral diagnostic power is limited. Simulated quiescent galaxies from IllustrisTNG, SHARK, and Magneticum broadly match the average SFHs of the observed sample but struggle to capture the full diversity, particularly at early stages. Our results emphasize the need for mechanisms that rapidly build stellar mass and quench star formation within the first billion years of the Universe.
1 Introduction
In the last 10 years, from wide and deep near infra-red (NIR) surveys on telescopes, we have made significant advancements in identifying the first generation of massive (M∗M⊙) quiescent galaxies in the Universe (e.g. Gobat et al., 2012; Straatman et al., 2014; Schreiber et al., 2018a). Ground based band imaging accompanied by deep HST and Spitzer imaging led the way through surveys such as ZFOURGE (Straatman et al., 2016) and UltraVISTA (McCracken et al., 2012) to detect possible massive quiescent candidates.
Ground based spectroscopic confirmations required long exposure deep and band spectroscopy from 8-10m class telescopes (e.g. Glazebrook et al., 2017; Schreiber et al., 2018a; Valentino et al., 2020; Forrest et al., 2022; Carnall et al., 2020). Due to atmospheric cutoffs in the NIR and high thermal backgrounds, detailed stellar population analysis exploring rest-frame optical spectral features was challenging (e.g. Nanayakkara et al., 2021). Furthermore, due to limitations in achieving sensitive continuum magnitudes, the majority of confirmed galaxies were bright ( AB, Antwi-Danso et al., 2023). This adds a bias towards recently quenched galaxies because the A type stars of a passively evolving galaxy will transition out of the main sequence making the galaxy faint (increasing the mass/K band luminosity ratio) at . Thus, there is a potential bias for spectroscopically confirmed quiescent galaxies’ quenching time scales to be within the last Myrs of the observation (e.g. Forrest et al., 2020a)
However, there were at least two known galaxies that hinted an older underlying population of quiescent galaxies with ages Myr at . The SFH reconstruction of ZF-COS-20115 (Glazebrook et al., 2017; Schreiber et al., 2018a, also presented in this analysis) utilizing ZFOURGE multiband imaging and Keck/MOSFIRE spectroscopy pointed it to have quenched Myr before the observed redshift of . Similarly, grism spectroscopic sample presented by D’Eugenio et al. (2021) also hinted at the presence of an underlying older population for at least one galaxy. The M⊙ of these galaxies and the old ages meant that these galaxies had to rapidly buildup their stellar masses within the first billion years of the Universe and have mechanisms within them to abruptly cease the star-formation. Thus, at the peak of their star-formation histories, these galaxies likely required SFRs M⊙/yr with star-forming episodes likely limited to Myr (Glazebrook et al., 2017). Additionally, SFHs from multi-band photometric analysis of photometrically selected quiescent galaxies further hinted at the existence of Gyr old stellar populations, however, these galaxies were unable to be spectroscopically confirmed from ground, even with h of Keck/MOSFIRE spectroscopy (e.g. ZF-UDS-7329 Schreiber et al., 2018a).
With the launch of JWST, the possibilities to obtain deeper understandings of the first massive quiescent galaxies in the Universe has expanded. Imaging data from NIRCam has discovered newer massive quiescent candidates (Carnall et al., 2023a, 2024) and evidence for temporarily quiescent low mass galaxies have been discovered up to (Looser et al., 2023).
The m spectroscopy afforded by JWST NIRSpec provides detailed rest-frame optical spectral features that are instrumental to explore the stellar population properties of massive quiescent galaxies. When galaxies enter quiescence their continuum gets dominated by late-B type and main sequence A stars. This gives rise to a Balmer break which transitions to a D4000Å feature with the passive evolution of stars after Myr (e.g. see Section 4.1 in Bruzual & Charlot, 2003). Additionally, the rest-optical spectrum of these galaxies are dominated by absorption from hydrogen and other stellar nucleosynthesis elements such as Mg, Na, Ca, and Fe which provides information about the underlying stellar populations. Given these elements are produced through various nucleosynthesis channels based on the stellar mass of the stars in the galaxies, forensic analysis of the star formation histories can be performed to determine how they built up stellar masses.
Ground based (Martínez-Marín et al., 2024) and JWST/NIRspec spectroscopy has discovered galaxies that are categorized as quiescent but with broad optical emission lines, indicative of an AGN (Carnall et al., 2023b; Nanayakkara et al., 2024). This suggests that AGN might be a mechanism that could quench star-formation in these galaxies. Recent results from JWST demonstrate the variety of quenching time scales of galaxies and provides essential information to hydrodynamical simulations to develop pathways for rapid quenching of massive galaxies in the early Universe (e.g. Carnall et al., 2023b, 2024; de Graaff et al., 2024; D’Eugenio et al., 2024; Glazebrook et al., 2024; Lagos et al., 2024; Nanayakkara et al., 2024; Pérez-González et al., 2024; Setton et al., 2024; Weibel et al., 2024). The low mass post-starburst like systems discovered at (e.g. Looser et al., 2023; Strait et al., 2023) point towards temporary quiescence due to the stochastic nature of star-formation in the early Universe. However, simulations suggest that for higher mass galaxies quiescence is expected to be a longer term phenomena driven by AGN activity (Xie et al., 2024). Given their higher masses, space for further substantial mass increases is limited, thus, these galaxies are expected to grow passively via dry minor mergers to (Oser et al., 2012).
Most analysis conducted in pre-JWST area were targeted towards interesting sources identified in deep imaging surveys over HST legacy fields. In Schreiber et al. (2018a) a -selected sample of galaxies at was used to obtain ground based spectroscopic confirmations of their quiescence. -band covers the rest-frame optical at these redshifts, thus, this translates approximately to a mass selected sample. Out of the 24 galaxies selected for spectroscopic followup, Schreiber et al. (2018a) was successful in obtaining redshifts for 12 sources. 10 of these were confirmed to be at the correct redshifts (), and a mass selected number density for massive quiescent galaxies was obtained based on the ZFOURGE survey. Both spectroscopically confirmed and unconfirmed sources spanned . JWST observations showed that the limitation for ground based spectroscopic confirmations for Schreiber et al. (2018a) sources was also driven by missing key spectral features in ground based spectra due to atmospheric cutoff (Nanayakkara et al., 2024).
In this analysis we present a JWST NIRSpec spectroscopic followup and uniform SFH analysis of the remaining 12 galaxies that were beyond the reach of ground based spectroscopy. Given the multiplexing nature of NIRSpec, we also present improved spectroscopy of 7 galaxies that were previously spectroscopically confirmed by Schreiber et al. (2018a). As outlined in Table 1, out of the 19 galaxies used in our analysis 12 galaxies were presented in Nanayakkara et al. (2024). This includes ZF-UDS-7329, whose formation history was looked into in detail by Glazebrook et al. (2024) to find that it has formed M⊙ by and quenched for Gyr by the time it was observed at . In this paper, we build upon Nanayakkara et al. (2024) by presenting a detailed analysis of the star-formation histories of the full massive quiescent galaxy candidate sample observed by our program. In Section 2 we present our observation and data reduction strategy. In Section 3 we present an analysis of the stellar populations and star formation histories of our galaxies using FAST++ and Prospector SED fitting codes, considering parametric and non-parametric (binned) SFHs and various stellar libraries and stellar population models. In Section 4, we explore our results in the broader context of galaxy evolution and cosmological models, and in Section 5 we present the conclusions and present ideas for future directions of work. Unless otherwise stated, we assume a Chabrier (2003) IMF and a cosmology with H km/s/Mpc, and . All magnitudes are expressed using the AB system (Oke & Gunn, 1983).
2 Observed Sample
| Name | Observation ID | Comments |
|---|---|---|
| S18 only | ||
| ZF-COS-10559 | 301 | Observation 1 rescheduled by |
| WOPR 88655 due to NIRSpec short. | ||
| ZF-COS-14907 | 2 | |
| 3D-EGS-27584 | 6 | Partial spectral coverage |
| 3D-EGS-34322∗ | 6 | Presented in Nanayakkara et al. (2024). |
| ZF-UDS-3651 | 100 | Presented in Nanayakkara et al. (2024). |
| ZF-UDS-4347 | 100 | Presented in Nanayakkara et al. (2024). |
| ZF-UDS-6496 | 100 | Presented in Nanayakkara et al. (2024)∗∗. |
| ZF-UDS-7329 | 200 | Presented in Glazebrook et al. (2024) & |
| Nanayakkara et al. (2024)∗∗ | ||
| ZF-UDS-7542 | 200 | Presented in Nanayakkara et al. (2024). |
| 3D-UDS-35168 | 300 | Presented in Nanayakkara et al. (2024). |
| 3D-UDS-39102∗ | 300 | Presented in Nanayakkara et al. (2024). |
| 3D-UDS-41232 | 300 | Presented in Nanayakkara et al. (2024). |
| S18 low confident spec- | ||
| ZF-COS-18842 | 7 | |
| ZF-COS-19589 | 7 | |
| 3D-EGS-31322 | 6 | Presented in Nanayakkara et al. (2024). |
| S18 robust spec- | ||
| ZF-COS-20115 | 7 | |
| ZF-COS-20133 | 2 | Partial spectral coverage |
| 3D-EGS-18996 | 6 | Presented in Nanayakkara et al. (2024). |
| ZF-UDS-8197 | 200 | Presented in Nanayakkara et al. (2024). |
In Schreiber et al. (2018a), we presented ground based spectroscopy for a sample of massive quiescent galaxy candidates from the ZFOURGE (Straatman et al., 2016) and 3DHST (Skelton et al., 2014) surveys. These galaxies were selected by applying a magnitude cut , a mass cut of M⊙, a photometric redshift cut of , and a color selection (Williams et al., 2009) to select galaxies that are classified as quiescent. We cross matched the photometrically selected galaxies with Keck archival data to find galaxies that were observed with MOSFIRE (McLean et al., 2012) and/or bands. There were 24 galaxies that were selected based on the above selection criteria, however, we could only obtain spectroscopic redshift measurements for 12 of the galaxies.
In JWST Cycle 1 observations, we were awarded 14.4 hours of NIRSpec prime time (GO-2565 “How Many Quiescent Galaxies Are There at Really?” ) to spectroscopically followup the remaining 12 galaxies. This analysis presents the full massive quiescent galaxy sample observed by our program.
Our galaxies are spread over three HST legacy fields, All-Wavelength Extended Growth Strip International Survey (Skelton et al., 2014, EGS/AEGIS), The Cosmological Evolution Survey (COSMOS Straatman et al., 2016), and UKIDSS Ultra-Deep Survey (UDS Skelton et al., 2014; Straatman et al., 2016) fields. Due to the spatial distribution, 7 NIRSpec pointings were required to obtain prism spectroscopy of the 12 galaxies. Due to close clustering, we were also able to target 7 galaxies that were spectroscopically confirmed to be at by (Schreiber et al., 2018a).
Observations were carried out between August 2022 to May 2023. More details about the observations are provided in Table 1. Each observation utilized 5 slitlet shutters with 3 dither positions. Each dither position was observed for , resulting in min of exposure time per target. There was one object that was affected by a failed closed shutter in the MSA.
All data was reduced using the publicly available STScI JWST pipeline jwst v1.12.5 using the latest calibration reference files available at the time. For galaxies that had NIRcam coverage from PRIMER (GO-1837, PI Dunlop) or CEERS (DD-ERS-1345, PI Finkelstein Finkelstein et al., 2023) surveys, NIRCam imaging data was used to calibrate the spectra to match with the total fluxes111galaxies were cross matched with the DAWN JWST Archive v7 data release https://dawn-cph.github.io/dja (Valentino et al., 2023). There were three galaxies with no NIRCam imaging coverage (3D-EGS-19589, 3D-UDS-39102, and 3D-UDS-41232), for which we used multiband photometric data from 3DHST survey (Skelton et al., 2014) to calibrate the spectra. We did extensive tests to make sure that there are no calibration effects applied to the spectral shape of the spectrum based on artificial slit mask images overlaid on the NIRcam images as outlined in Nanayakkara et al. (2024) and that the errors reported by the STScI JWST pipeline are reasonable as outlined in Glazebrook et al. (2024).
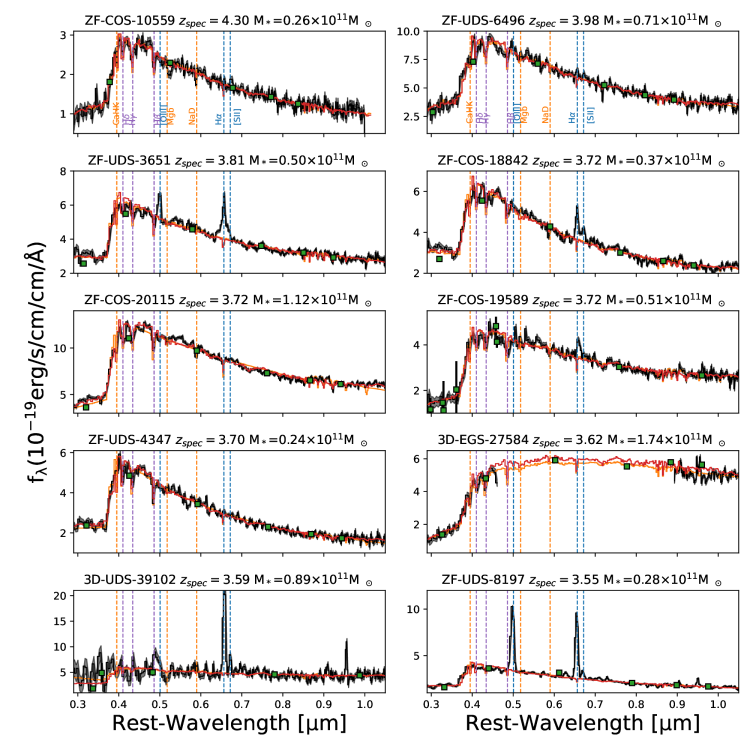
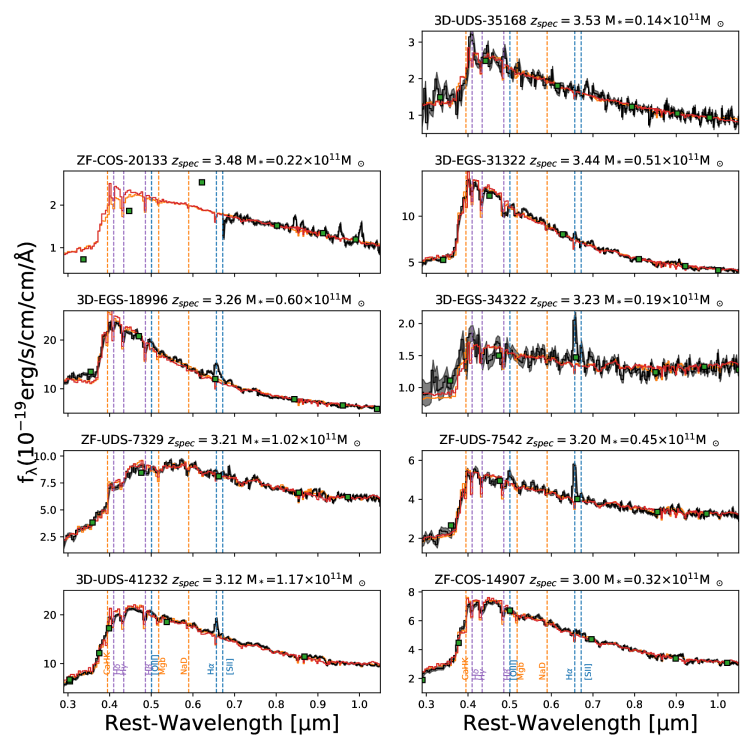
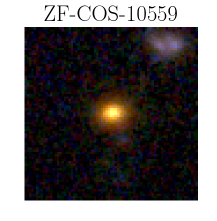
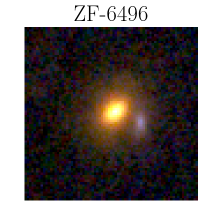
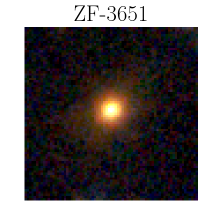
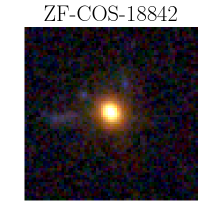
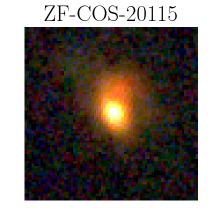
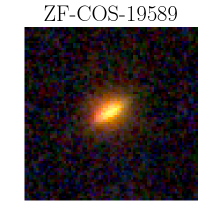
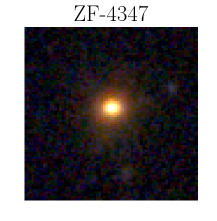
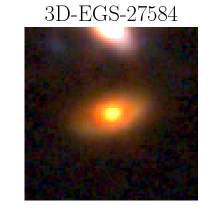
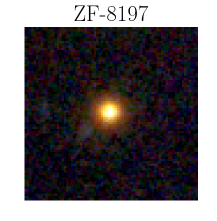
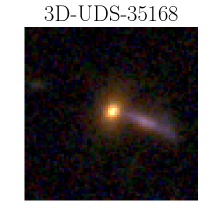
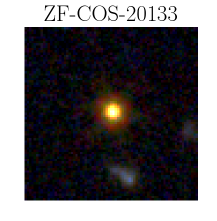
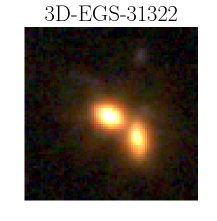
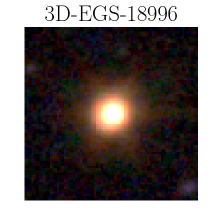
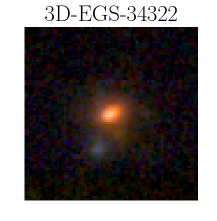
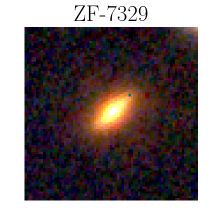
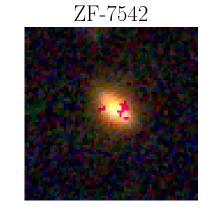
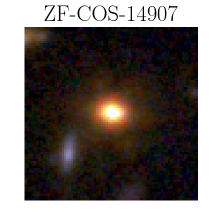
In Figures 1 and 2 we show the Schreiber et al. (2018a) massive quiescent galaxies observed by our program. The continuum of all galaxies with the exception of 3D-EGS-39102 is observed with a median S/N. With the exception of ZF-COS-20133, all galaxies have coverage of the Balmer break. The m observed wavelength range of 3D-EGS-27584 falls in the detector gap. We use slinefit222https://%****␣qu_pop_2565.tex␣Line␣350␣****github.com/cschreib/slinefit to measure redshifts using custom line spread functions as outlined in Nanayakkara et al. (2024). Redshift errors are determined using 200 Monte-Carlo simulations obtained by perturbing the observed spectrum within its error levels. All sources have secure spectroscopic redshifts based on the Balmer break and/or emission line detections. All galaxies that were unable to be spectroscopically confirmed by Schreiber et al. (2018a) are now confirmed to be at . Thus, there are no new low redshift outliers. The best-fit redshifts for our sample is presented in Figures 1 and 2 (and can also be found in Table 4). Color images of our galaxies with JWST/NIRCam coverage are shown by Figure 3.
of the galaxies show clear NaD absorption profiles upon visual inspection. However, given the low resolution of NIRSpec PRISM mode observations, we are unable to provide tight constraints to the NaD EWs or velocity offsets to distinguish between ISM/stellar atmosphere absorption vs galactic outflow driven absorption. Similarly, we also find that Mgb absorption of some of our galaxies () to be strong enough to be visually identified at the prism resolution. We further discuss the enhanced NaD profiles and the Mgb detections of our sources in Section 4.3.
3 Reconstructing Star Formation Histories
In this Section we detail the methodology used to analyze the star-formation histories of our galaxies. The modelling of SFHs require prior assumptions of the stellar population models, how various ISM and AGN related quantities are handled, and how the SFHs are parametrized (e.g. Leja et al., 2019; Carnall et al., 2019). For this analysis, we utilize two different SED fitting codes. Firstly we utilize FAST++ using the same SFH assumptions as outlined in Schreiber et al. (2018a), so there is a direct comparison of the SFHs of our sample to that reported in Schreiber et al. (2018a), Nanayakkara et al. (2024), and Glazebrook et al. (2024). Next, we use Prospector SED fitting code (Johnson et al., 2021) to investigate the difference in the recovered SFHs when using different assumptions for SFHs priors, stellar population models, AGN, and emission line contributions. We use a base set of assumptions following Nanayakkara et al. (2024); Glazebrook et al. (2024) to compare between FAST++ and Prospector results. Finally, we also explore how well the SFHs can be recovered using Prospector for a sample of massive quiescent galaxies simulated by the Illustris TNG simulation (Pillepich et al., 2018a) and compare the mass buildup of our observed galaxies with massive quiescent galaxies from Illustris TNG, Magneticum (Lustig et al., 2023), and SHARKv2.0 (Lagos et al., 2023) simulations.
For both spectral fitting codes, when JWST NIRCam imaging is available, we utilize photometry from all NIRCam bands that cover the galaxy, as presented in Table 2. As aforementioned, three sources have no current public JWST/NIRcam coverage. For these galaxies we use multi band photometric data from the 3DHST survey as presented in Skelton et al. (2014) catalogues. In both cases, the spectra are calibrated to the observed photometry, so there are no additional scaling factors introduced in SED fitting to match the observed photometry to fitting.
All spectral fitting also utilize the observed NIRspec spectra, thus, spectra are jointly fit with the photometry. Given the large wavelength coverage of prism mode, the spectral resolution and dispersion is heavily non-linear. Thus, the model spectra are convolved with the line spread function and then is resampled to the non-linear dispersion of the prism based on the NIRCam source profile on slit as outlined in Nanayakkara et al. (2024). Dispersion for a uniformly illuminated slit as provided by STScI is used for the three sources with no NIRCam coverage.
Spectral fitting is performed twice for galaxies that have uniform m NIRspec coverage (no part of the spectral trace falls in the NIRSepc detector gaps333see https://jwst-docs.stsci.edu/jwst-near-infrared-spectrograph/nirspec-operations/nirspec-mos-operations/nirspec-mos-wavelength-ranges-and-gaps). We first consider a base spectral fitting model, where the observed spectra are trimmed at m in rest-frame wavelength. This allows a direct comparison with results presented in Glazebrook et al. (2024); Nanayakkara et al. (2024) and is also similar to the spectral fitting reported by Carnall et al. (2024). Next, in Section 3.4, we briefly investigate systemic differences on the recovered average SFHs when the rest-frame NIR spectral range is folded into spectral fitting. As shown by Figures 1 and 2, there are two galaxies (3D-EGS-27584 and ZF-COS-20133) with limited wavelength coverage, and for these two sources spectral fitting is limited to this available wavelength window. Photometric data are not trimmed for any of the spectral fitting scenarios.
| ID | F115W | F150W | F200W | F277W | F356W | F410M | F444W | |||||||
|---|---|---|---|---|---|---|---|---|---|---|---|---|---|---|
| ZF-COS-10559 | 0.147 | 0.029 | 0.337 | 0.025 | 1.258 | 0.021 | 3.086 | 0.021 | 3.715 | 0.021 | 4.139 | 0.033 | 4.279 | 0.029 |
| ZF-UDS-6496 | 0.474 | 0.040 | 1.211 | 0.033 | 5.415 | 0.030 | 10.226 | 0.030 | 12.519 | 0.033 | 13.483 | 0.047 | 14.455 | 0.043 |
| ZF-UDS-3651 | 0.627 | 0.026 | 1.121 | 0.021 | 4.208 | 0.021 | 6.789 | 0.021 | 8.904 | 0.024 | 10.255 | 0.035 | 11.011 | 0.032 |
| ZF-COS-18842 | 0.704 | 0.032 | 1.199 | 0.027 | 4.332 | 0.025 | 6.468 | 0.023 | 7.563 | 0.024 | 8.463 | 0.036 | 9.143 | 0.032 |
| ZF-COS-20115 | 0.607 | 0.053 | 1.608 | 0.046 | 8.625 | 0.040 | 14.678 | 0.040 | 18.338 | 0.043 | 21.221 | 0.062 | 23.467 | 0.059 |
| ZF-UDS-4347 | 0.522 | 0.026 | 1.056 | 0.022 | 3.801 | 0.021 | 5.203 | 0.019 | 5.809 | 0.020 | 6.326 | 0.028 | 6.664 | 0.026 |
| 3D-EGS-27584 | 0.208 | 0.013 | 0.622 | 0.014 | 3.828 | 0.015 | 9.114 | 0.020 | 14.206 | 0.026 | 19.240 | 0.038 | 22.081 | 0.037 |
| ZF-UDS-8197 | 0.382 | 0.028 | 0.737 | 0.024 | 2.936 | 0.022 | 4.952 | 0.022 | 5.349 | 0.022 | 6.152 | 0.035 | 6.688 | 0.031 |
| 3D-UDS-35168 | 0.323 | 0.023 | 0.689 | 0.019 | 2.024 | 0.018 | 2.841 | 0.017 | 3.222 | 0.018 | 3.547 | 0.026 | 3.733 | 0.023 |
| ZF-COS-20133 | 0.295 | 0.016 | 0.340 | 0.015 | 1.533 | 0.014 | 4.030 | 0.014 | 4.020 | 0.013 | 4.599 | 0.019 | 4.820 | 0.017 |
| 3D-EGS-31322 | 1.007 | 0.011 | 2.485 | 0.013 | 10.153 | 0.018 | 12.898 | 0.021 | 14.251 | 0.022 | 15.844 | 0.028 | 16.852 | 0.025 |
| 3D-EGS-18996 | 2.752 | 0.014 | 6.637 | 0.018 | 17.990 | 0.026 | 20.083 | 0.027 | 21.881 | 0.028 | 23.716 | 0.033 | 24.941 | 0.033 |
| 3D-EGS-34322 | 0.182 | 0.017 | 0.550 | 0.021 | 1.308 | 0.018 | 2.481 | 0.015 | 3.476 | 0.018 | 4.811 | 0.027 | 5.478 | 0.027 |
| ZF-UDS-7329 | 0.593 | 0.046 | 1.907 | 0.039 | 7.403 | 0.036 | 13.750 | 0.037 | 18.593 | 0.043 | 22.583 | 0.066 | 24.075 | 0.060 |
| ZF-UDS-7542 | 0.370 | 0.044 | 1.327 | 0.036 | 4.341 | 0.033 | 6.811 | 0.057 | 9.462 | 0.036 | 11.924 | 0.060 | 13.005 | 0.054 |
| ZF-COS-14907 | 0.586 | 0.018 | 2.340 | 0.016 | 6.182 | 0.017 | 8.404 | 0.018 | 10.022 | 0.020 | 11.815 | 0.026 | 12.202 | 0.024 |
3.1 Parametric SFHs with fast++
FAST++ is a spectral fitting code written in C++, with similar functionality to IDL FAST code Kriek et al. (2009). The SED fitting procedure utilized by us here largely mirrors that of Schreiber et al. (2018a) with a few exceptions and upgrades. FAST++ v1.5.0 implements a LSF functionality, where the model spectra can be convolved to a user defined wavelength dependent of the Gaussian LSF. This can be provided using the SPEC_LSF_FILE option. In terms of the stellar population properties, similar to Schreiber et al. (2018a) we use Bruzual & Charlot (2003) high resolution stellar population models with Padova 1994 stellar tracks (Bertelli et al., 1994) with STELIB (Le Borgne et al., 2003) and BaSeL v3.1 (Westera et al., 2002) spectral libraries. We use a Chabrier (2003) IMF and a Calzetti et al. (2000) dust law. In Schreiber et al. (2018a) the stellar metallicity of the models was kept at Z⊙. In this analysis we are performing spectral fitting utilizing the full rest-frame optical wavelengths. Thus, to take optimal use of available data, we allow the stellar metallicity of the models top vary between the full available grid, which is (20-250% ).
The SFH parameters used in the fitting is also kept same as Schreiber et al. (2018a), which is specifically suited to model quiescent galaxies at . The model use two epochs to describe the SFHs. The main component include an exponentially increasing and decreasing SFH, where the two exponents (-folding times; and ) are kept as free parameters. Additionally, the lookback time that defines the boundary between exponentially increasing and decreasing () is also allowed to vary freely. This allows the flexibility in the SFH to capture the slow/fast rising SFHs, constant SFHs, and slow/fast quenching SFHs. Thus, the primary mode of the SFH can be defined as follows:
| (1) |
where is the base SFR at lookback time t. However, this base SFR is unable to capture the most recent star-formation episode of a galaxy to where IR and sub-mm observations are sensitive to. Specially, stacked Herschel and ALMA measurements are unable to be recovered by this base SFR parameters. In order to alleviate this, a SFR multiplicative factor, was introduced to the model to be activated close to the time of observation of the galaxy. The time window for which this multiplicative factor was applied () to was allowed to vary freely between the last Myr of the galaxies SFH. Thus, the final SFR of the galaxy at lookback time () can be mathematically expressed as:
| (2) |
We refer the readers to Schreiber et al. (2018a, b) for further detailed justification of this SFR within the context of massive and quiescent galaxies at .
| Free Parameter | Lower Bound | Upper Bound | Step Size |
|---|---|---|---|
| (Gyr) | 0.01 | tH(z) | |
| (Gyr) | 0.01 | 3 | |
| (Gyr) | 0.01 | 3 | |
| (Myr) | 10 | 300 | |
| 0 | 6 | 0.1 | |
| Free Parameter | Values | ||
| Z | 0.004, 0.008, 0.02, 0.05 | ||
| Fixed Parameter | Value | ||
| SSP Model | Bruzual & Charlot (2003) | ||
| IMF | Chabrier (2003) | ||
| Attenuation Curve | Calzetti et al. (2000) | ||
| from JWST/NIRSpec | |||
Table 3 details a summary of the stellar population and SFH parameters used in this analysis. All SFR related priors are varied in logarithmic steps as outlined in the table. Observed photometry is fit simultaneously with the observed spectra. BC03 models included with FAST++ does not include emission line contributions. Thus, for galaxies with strong emission lines (such as H, [Oiii], H, [Sii]), we remove regions where the strong emission lines fall and broad band photometry contaminated by the strong emissions lines are also removed. The best-fit spectrum is considered as the model with the lowest reduced value and its values are considered as the best-fit model parameters. 1000 Monte Carlo simulations are performed to obtain the 68%, 95%, and 99% confidence intervals of all the parameters obtained through FAST++ fitting. Both the observed photometry and spectral fluxes are permutated within their respective 1- errors in each of the Monte Carlo iterations.
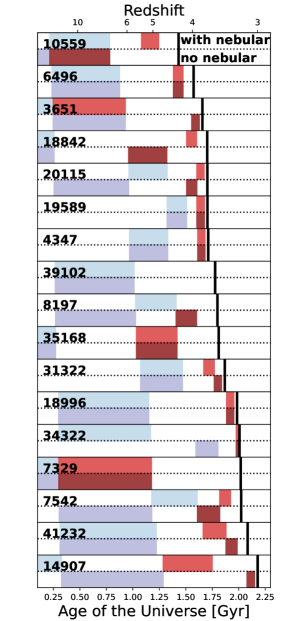
The best fit FAST++ models are shown in Figure 1 and 2. Here, when available, the full range between m of the NIRSpec spectrum is used for the fitting. As evident, all galaxies are fit to a very high degree of accuracy with a median reduced of 4.3. 3D-EGS-18996 has the highest reduced of 8.2 which can be party attributed to the increased flux of the best-fit model m. FAST++ is able to model the Balmer/D4000Å breaks accurately. At these redshifts, these features fall m, where the NIRSpec/PRISM resolution is at the minimum and the highest degree of variation. Thus, we found that having an accurate model of the LSF input to FAST++ in the fitting process was crucial to obtain reasonable fits around this wavelength with good overall values.
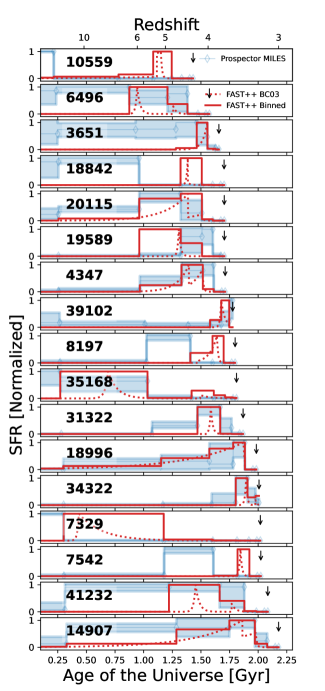
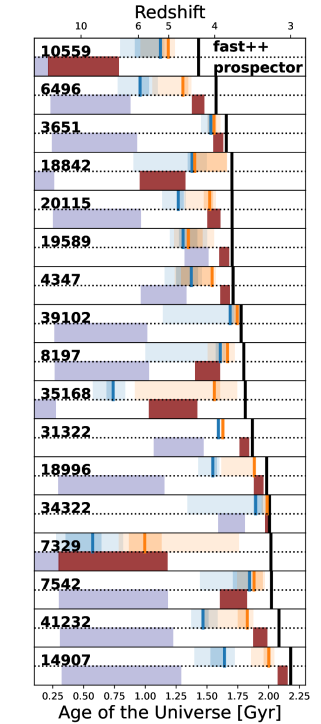
The SFHs with FAST++ shows considerable variety between our galaxies and are shown by Figures 4 and 5. 3D-UDS-7329 at is the first galaxy to have reached 50% of its observed stellar mass after the Big Bang reaching M⊙ within the first Myr of the Universe ( Gyr in lookback time). It is also the first galaxy in our sample to have quenched its star-formation by Gyr of the Universe ( Gyr in lookback time). 3D-UDS-35168 has also a similar 50% of observed stellar mass formation time ( Myr from the Big Bang), however, it has dex smaller stellar mass and an extended SFH resulting it only being quenched Myr before the time of observation. All of our other sources have only formed Gyr after the Big Bang ().
ZF-COS-10559 is the highest redshift source in our sample with . It also has the 2nd fastest quenching time at Gyr after the Big Bang. However, given its high redshift, in look back time it has only quenched within the Myr before it was observed. In fact, with the exception of 3D-UDS-7329 all our sources have only quenched within Myr of the time of observation. The formation, quenching, and observed times of our sample is further visualized by Figure 6.
The best-fit values obtained by FAST++ fitting are provided in Table 4.
| Galaxy ID | Z | Av | |||||||
|---|---|---|---|---|---|---|---|---|---|
| mag | |||||||||
| ZF-COS-10559 | |||||||||
| ZF-UDS-6496 | |||||||||
| ZF-UDS-3651 | |||||||||
| ZF-COS-18842 | |||||||||
| ZF-COS-20115 | |||||||||
| ZF-COS-19589 | |||||||||
| ZF-UDS-4347 | |||||||||
| 3D-EGS-27584 | |||||||||
| 3D-UDS-39102 | |||||||||
| ZF-UDS-8197 | |||||||||
| 3D-UDS-35168 | |||||||||
| ZF-COS-20133 | |||||||||
| 3D-EGS-31322 | |||||||||
| 3D-EGS-18996 | |||||||||
| 3D-EGS-34322 | |||||||||
| ZF-UDS-7329 | |||||||||
| ZF-UDS-7542 | |||||||||
| 3D-UDS-41232 | |||||||||
| ZF-COS-14907 |
-
1
The SFR of the galaxy computed over a lookback time of 100 Myrs.
-
2
The redshift at which the galaxy is considered quenched.
-
3
The redshift at which the galaxy formed 50% of its total stellar mass at the time of observation.
-
4
The length of time where 68% of the total integrated SFR of the galaxy took place.
-
5
The average SFR in the time window defined by .
3.2 Binned/Non-parametric SFHs with Prospector
Next we use Prospector SED fitting code (Johnson et al., 2021) to infer the SFHs of our galaxies utilizing a flexible approach to parametrize the SFHs. We use a continuity_sfh to parametrize the SFHs of our galaxies. While this is commonly known as a non-parametric SFH, in reality the inference of the SFH is made on fixed time bins in look back time for each galaxy. The amount of star-formation that can happen in each time bin is not constrained, thus this allows greater freedom in defining the formation history of galaxies. The SFH for our galaxies are constrained over 7 SFR bins similar to Leja et al. (2019). In lookback time, for each galaxy the first two bins are fixed between 0-30 Myr and 30-100 Myr and the final time bin is fixed to be between 85%-100% of the time of the Universe. The remaining 4 bins are distributed evenly between the 100 Myr to 85% of the time of the Universe in equally spaced logarithmic time bins. We note that the time bins are slightly different to what was utilized for 3D-UDS-7329 in Glazebrook et al. (2024), which was driven by the rapid formation of that source within the first few hundred million years of the Universe.
We allow the stellar metallicity, dust optical depth, and the stellar mass to vary freely. The stellar metallicity is allowed to vary between , the dust optical depth following Calzetti (2000) dust law is allowed to vary between , and the stellar mass is allowed to vary between . The SFR is allowed to vary freely between 7 time bins () and is parametrized using 6 ratios defined as . We use a Chabrier (2003) IMF, MILES stellar library (Falcón-Barroso et al., 2011), and MIST stellar isochrones (Paxton et al., 2015; Choi et al., 2016; Dotter, 2016).
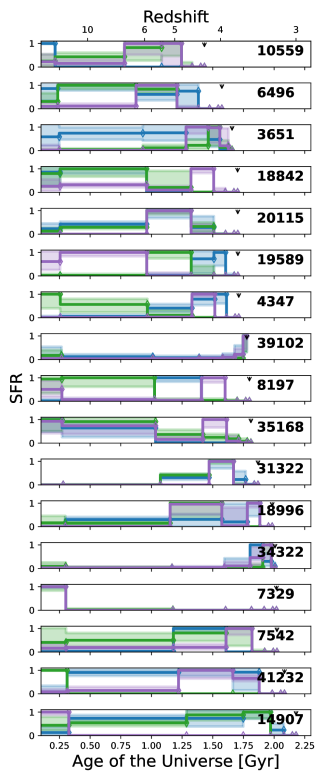
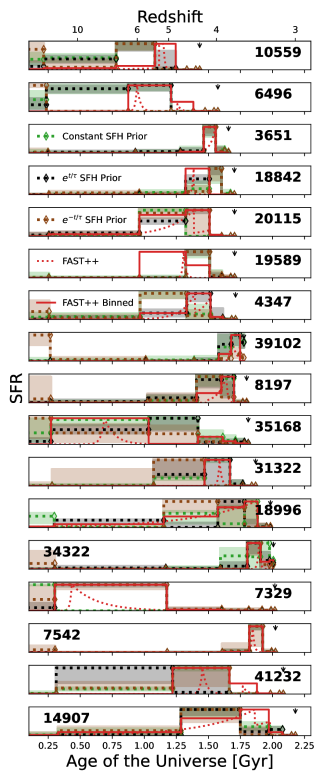
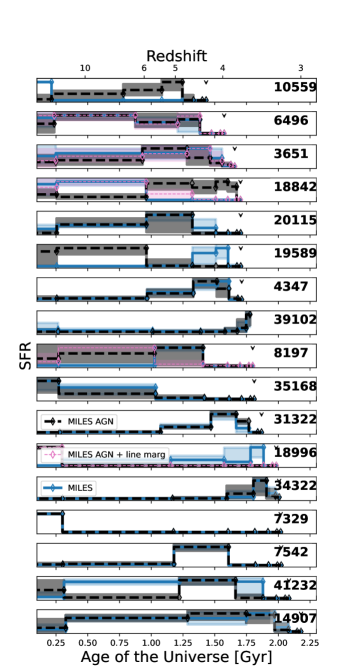
Similar to FAST++, we run Prospector using all available photometry (either from JWST/NIRcam or 3DHST) and perform the fitting masking out emission lines and trimming the observed spectrum at m rest-frame. The reconstructed SFHs of the galaxies are shown in Figure 4. Driven by the parametric nature of the FAST++ SFHs, the buildup of stellar mass is gradual over time. In comparison Prospector has more variability in the SFH driven by the more freedom in its SFH parameterization. Most galaxies show good overall agreement for SFH shapes between Prospector and FAST++. Visually, ZF-COS-10559 and ZF-UDS-3651 could be a notable exceptions. ZF-COS-10559 according to Prospector has an early intense star-burst phase that make of the total formed mass.
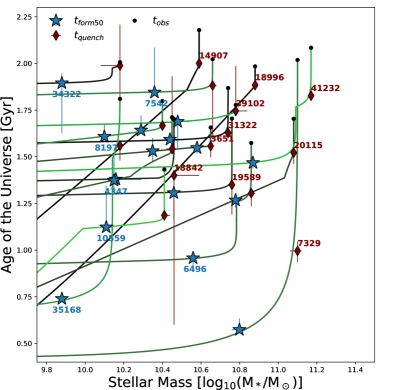
To determine formation time and quenching times as parametrized by the two SED fitting codes, we integrate the cumulative mass of the galaxies in the SFH bins and find the time bin where 50% of the total formed mass at time of the observation is made. We define this as the formation time window of the galaxy (). We then find the peak SFR of the galaxy and investigate whether the SFR dips below the necessary 10% threshold of the maximum SFR between the time of the peak SFR to the observed time. If such time exists, we explore whether the galaxies meet this conditions continuously between the peak SFR and the time of observation. If so, we consider the galaxy to be quenched.
In Figure 5 we compare the formation and quenching time of our sample for FAST++ and Prospector SED fitting codes. Given the parametric nature of the SFH, FAST++ report a best-fit formation and quenching times along with their Monte-Carlo uncertainties. Prospector utilize fixed time bins to infer the variation between the SFR ratios in adjoining time bins, thus, the formation and quenching time is defined in terms of the time bins. While the formation and quenching time windows agree well between the two codes for most of our sources, there is a general tendency for Prospector to have older times (50% of the mass formed at a higher-) compared to FAST++. Non-parametric SFHs from Prospector have shown to point towards older SFHs compared to parametric SFHs in the Universe (e.g. Leja et al., 2020).
For galaxies that satisfy the quenching criteria in Prospector, the agreement between FAST++ and Prospector quenching time is better than the formation time. One source, 3D-UDS-39102, is not classified as quiescent based on Prospector results. 3D-UDS-39102 has the lowest signal-to-noise ratio (S/N) in our sample and shows only marginal evidence for a Balmer break based on NIRCam photometry. FAST++ results also suggest very recent quenching for this source ( Myr from the time of observation). Schreiber et al. (2018a) also found 3D-UDS-39102 to have a lower bound for quenching time to be consistent with 0 Myr with FAST++, however, our joint spectra + photometry fit from FAST++ suggest a 1- lower bound of Myr for quenching time. 3D-EGS-34322 satisfies the quenching criteria only in the most recent star formation history (SFH) bin in Prospector, which is defined between 0 and 30 Myr, and this aligns well with the FAST++ quenching time of approximately 20 Myr.
Our results point that the parametric form of the SFH optimized for massive galaxies presented by Schreiber et al. (2018a) largely provides consistent results to the SFHs parametrized using Prospector with a more flexible approach. However, there are other notable assumptions routinely made in SED fitting such as the choice of input stellar population models, how emission lines are considered, and how effects of AGN are considered in SED fitting. For example, the MIST stellar library used with Prospector include effects of stellar rotation while BC03 stellar population models we used for FAST++ do not consider these effects. Thus, it is imperative to understand the role different SED fitting assumptions such as the input stellar libraries, emission line contributions, and AGN contributions play in determining the formation histories of our massive quiescent galaxies. Given Prospector by design affords flexibility to vary these parameters, we opt to using Prospector for the next steps of our analysis and only include galaxies that have full rest-frame optical coverage in our observed spectra. A brief summary of the Prospector assumptions utilized by us is presented in Table 5.
| Free Parameter | Range |
|---|---|
| SFH bins (look back time in Gyr) | 0-30, 30-100, bin3-6, 0.85- |
| Dust optical depth (Calzetti, 2000) | |
| Stellar Mass | |
| Ionization parameter1 | |
| AGN bolometric luminosity fraction1 | |
| AGN optical depth for individual clouds1 (Nenkova et al., 2008) | |
| Marginalize emission lines 1,2 (Johnson et al., 2021) | km/s |
| MILES stellar library (Falcón-Barroso et al., 2011) & MIST stellar isochrones (Paxton et al., 2015; Choi et al., 2016; Dotter, 2016) | |
| Stellar Metallicity | , Z⊙=0.0142 |
| C3K stellar library (Conroy et al., 2009) & MIST stellar isochrones | |
| Stellar Metallicity | , Z⊙=0.0142 |
| BPASSv2.0 stellar population models (Eldridge et al., 2017) | |
| Stellar Metallicity | , Z⊙=0.0200 |
| Fixed Parameter | Value |
| IMF | Chabrier (2003) |
| SFH Prior | continuity_sfh with a flat prior3 |
| Spectral smoothing (smooth_type) | LSF |
| emcee sampling (Foreman-Mackey et al., 2013) | nwalkers=1024, nburn=[16, 32, 64], niter=2056 |
-
1
Runs are also computed completely turning off this parameter.
-
2
Only the following lines are marginalized over: H, [Oiii], [Nii], H, [Sii]
-
3
Results are also compared with prior with , where is time in age of the Universe and is the age of the Universe corresponding to the spectroscopic redshift of the galaxy (Leja et al., 2019).
3.3 The Role of input synthetic stellar populations
We investigate three different stellar populations models that is inbuilt with FSPS (Conroy et al., 2009). Firstly, we use the default MILES stellar library (Falcón-Barroso et al., 2011) with MIST stellar isochrones (Paxton et al., 2015; Choi et al., 2016; Dotter, 2016) to generate the model spectra used by Prospector to make inferences on the observed spectra and photometry of our sources. MILES library has a higher resolution of in the optical and a lower resolution at Å. Secondly, we use the C3K stellar library used in FSPS (Conroy et al., 2009). Here the spectral templates are sampled at a between . At , this cutoff translates to m in the observed frame. Finally, we also consider BPASSv2 stellar population models (Eldridge et al., 2017). BPASS spectral resolution is comparable to C3K, but has effects of binary stellar evolution incorporated in stellar evolution. BPASS spectra are sampled at 1Å uniform sampling but underlying stellar atmosphere models will have a lower resolution, possibly limited by the resolution of the BaSeLv.31 stellar library.
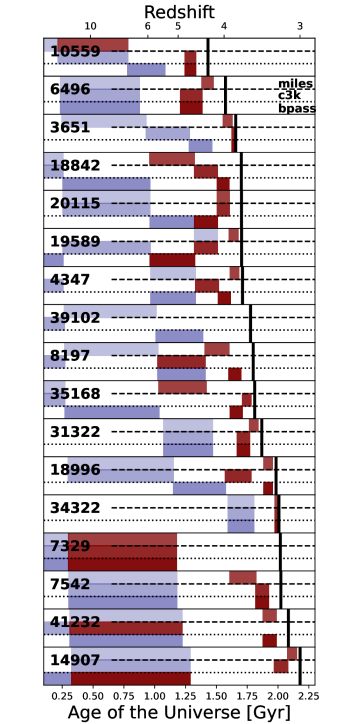
Fitting is performed with similar parameters as explained in Section 3.2 using the three spectral libraries/stellar population models. The residuals of the best-fits are shown in Appendix Figure 21. Observed spectra are trimmed at rest-frame m. Prospector recovered maximum a posteriori SFHs are shown by Figure 7. The reduced of spectral fits between the three models agree well within of each other. All of our sources show largely consistent formation histories between the 3 models. ZF-UDS-4347 is a notable exception where the C3K models prefer a very early formation while the other models prefer a later growth.
We further explore the variation in results between these three models using the definitions for galaxy formation and quenching time scales as discussed in Section 3.2. We show the reconstructed formation and quenching time scales for our galaxies in Figure 8. The formation and quenching times between the three models largely agrees with each other. The notable exception is ZF-UDS-4347, where the C3K models prefer an earlier formation time compared to the other models. 3D-UDS-39102 is considered not quenched by all three models. Similarly, the quenching time bin for 3D-EGS-34322 is also in the latest time bin for all three models. There are no instances where the choice of model determines whether a galaxy is classified as quenched or not.
Galaxy evolution is a statistical study. Galaxy evolution models by design are tuned to reproduce a diverse range of galaxy scaling relations that describe the average properties of the observable Universe (Crain & van de Voort, 2023). Therefore, it is plausible that the models find it challenging to reproduce the properties of individual sources that are outliers from the general galaxy population. In Figure 7 we have shown that the input stellar population models used in the fitting can have some effect on SFH recovery in an individual galaxy basis. In the context of our analysis, we argue that the average formation histories of massive galaxies are more important than individual reconstructions of their formation histories.
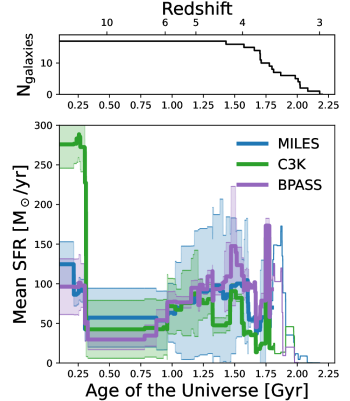
To investigate this further, we explore if the 3 different stellar libraries/stellar population models used in our analysis provide consistent results to the average formation history of our sources. We resample the SFR of each galaxy in 1 Myr increments up to 2200 Myr and compute the average SFR at each time step for our sample, weighting by the number of galaxies in each time step. In Figure 9 we show the evolution of the average SFH for our galaxies as a function of cosmic time. The average evolution of the SFRs between the three models shows good agreement with each other. All models show a consistent increase in the SFR at Gyr, which peaks Gyrs. All models show an enhancement of SFR in the first Myr, with the C3K model exhibiting the largest increase.
From Figure 9 it is clear that regardless of the spectral library/stellar population model used with Prospector, the average SFHs are statistically consistent with each other. The major deviation is only observed in the first Myr of the Universe. NIRSpec prism largely cover the rest-frame optical regime. With continued star-formation features from younger stellar populations are likely to dominate the observed spectrum. This, combined with the lower spectral resolution means spectral fitting will have less sensitivity to F and G star features that would indicate the nature of the oldest stellar populations in a galaxy. Therefore, a larger uncertainty is expected in this first Myr window which may translate to deviations between the different models.
3.4 The role of the spectral range used in full spectral fitting
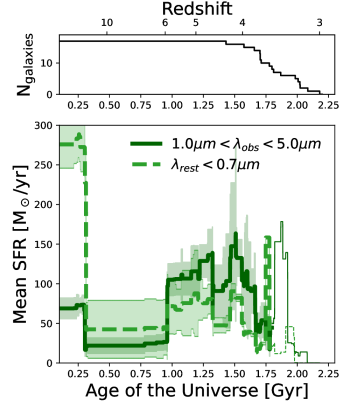
To investigate the effect of utilizing the rest-frame NIR in spectral fitting, we use the Prospector C3K stellar library to fit the spectra of the galaxies, covering the full 1–5 m spectral range. We utilize C3K for the comparison here because its spectral resolution is higher at longer wavelengths compared to the other models. Specifically, at wavelengths greater than , the critically sampled spectral resolution of the C3K models remains at 444See README here, which is comparable to the resolution of the observed data (Nanayakkara et al., 2024).
The reconstructed average SFHs of the galaxies are shown in Figure 10. The overall shape of the reconstructed SFHs shows good agreement between the fits and the full – fits. The largest deviation is observed in the earliest time bin, which parametrizes the first Myr of the Universe. When the full spectral range is utilized in the fitting, the enhancement of the SFR at the earliest times decreases, bringing the average SFR of C3K into close agreement with the SFRs observed for the MILES and BPASS models as shown by Figure 9.
3.5 The role of the SFH prior
The non-parametric SFH spectral fitting of our analysis performed with Prospector, uses a continuity_sfh model with a flat prior. We utilize seven fixed time bins, as detailed in Table 5. The variability of the SFRs between the bins is parameterized using the logarithmic ratio of the SFR in adjacent bins, defined as:
| (3) |
where represents the closest time bin in lookback time. A constant prior with a mean of 0, a standard deviation of , and 2 degrees of freedom, following a Student’s T-distribution, is used to sample the posteriors in the MCMC. This resembles a constant SFH prior.
In this section, we test the role of the assumed SFH prior used in SED fitting. Firstly, motivated by the average accretion rate of halo mass over cosmic time (Dekel et al., 2013, also see Turner et al. (in prep)), we apply an exponentially increasing SFH prior for the to explore how it affects the average SFHs of our observed sample. Thus, we modify the constant mean of 0 prior in each of the 6 bins following , with , where is the mean time in age of the Universe and is the age of the Universe corresponding to the spectroscopic redshift of the galaxy (Leja et al., 2019). All other parameters are unaltered. We use the Prospector C3K stellar library to fit the spectra of the galaxies utilizing the updated prior covering the full 1–5 m spectral range.
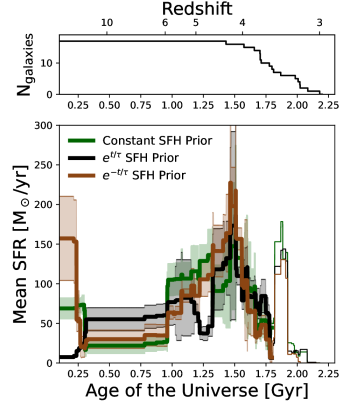
The reconstructed average and individual SFHs of the galaxies with flat and exponentially increasing priors are shown by Figures 10 and 11. The overall shapes of the reconstructed SFHs show good agreement between the two priors. Both SFHs exhibit a slight dip in the mean SFR around – Gyr, with the dip occurring at slightly earlier times in the fits using the exponentially increasing prior. The most significant shift between the two SFHs are in the first Myr. The constant SFH prior show a slight increase in the mean SFR at Myr while the exponentially increasing SFR shows a slight decrease in the SFR at a similar amplitude. This shift can be attributed to galaxies such as 3D-EGS-18996 and ZF-UDS-7329, where the mass formed in the oldest time bin (the highest- bin) is reduced by the introduction of the exponentially increasing prior.
Similarly, we also investigate the effect an exponentially decreasing prior, , has on the average SFHs of the observed galaxies. As shown by Figure 10, the average evolution of the SFR Myr is largely consistent with the flat and exponentially increasing prior. The peak SFR in all three models are similar, where a gradual incline of the SFRs can be observed from Gyr onwards. The major discrepancy is at the first Myr of the Universe, where the exponentially decreasing SFR show the highest increase in SFRs at the earliest times. From Figure 11, it is evident that an increasing fraction of galaxies tend to prefer more mass formation in the earliest time bin when the exponentially decreasing prior is introduced in Prospector.
Overall, the three assumed SFH priors in Prospector agree well with the FAST++ parametric form at later times. Visually, the exponentially increasing SFH prior shows the closest results to FAST++, which is expected given that FAST++ also utilizes an exponentially increasing parametric form for the SFH. Based on our tests, it is evident that the prior assumed for the posteriori sampling has an effect at older times where the diagnostic power of the age sensitive features may be limited. This can have an effect on how the earliest stages of the SFH of galaxies are probed with full spectral fitting techniques. At later ages where the observed spectral features show diagnostic sensitivity, consistent results to the SFHs can be obtained independent of the assumed prior.
3.6 The role of nebular contribution
In both FAST++ and Prospector spectral fitting so far, we have masked out emission lines in the observed galaxies and used models that do not account for contributions from nebular continuum and nebular emission lines. In this section, we investigate whether allowing nebular contributions as a free parameter in the spectral fitting would significantly affect the reconstruction of the SFHs.
The Flexible Stellar Population Synthesis code (FSPS, Conroy et al., 2009), utilized by Prospector, computes emission lines using the cloudy photoionization code (Ferland et al., 2017), which are stored in a pre-computed grid (Byler et al., 2017). The age and gas-phase metallicity of the input spectra are matched to generate nebular continuum and emission lines for the FSPS stellar population model. This combined spectrum is then used for inference with the observed data. The emission lines are powered solely by the ionizing photons from the stellar population models, with no AGN contribution included in the ionizing spectrum.
To account for possible contributions from nebular emission lines, especially given the high-EW limits observed in the NIRSpec prism mode, we marginalize over the cloudy input grid with variable ionization parameters. We remove the emission line masks applied to the observed spectra and allow for emission line contributions in Prospector by letting the gas ionization parameter vary freely between . The gas-phase metallicity is fixed to match the stellar metallicity.
Figure 12 shows the comparison of the formation and quenching time for the galaxies when Prospector is run with and without nebular contribution as a free parameter. We note that when nebular contributions are not considered, the emission lines in the observed spectra are masked. For the majority of galaxies, both runs produce similar formation and quenching times. The largest deviation in formation time is observed for 3D-EGS-34322, where the formation time window is approximately 500 Myr earlier when nebular contributions are considered. A similar offset in quenching time is seen for ZF-UDS-3651. In both runs, 3D-UDS-39102 is not considered quenched. When emission line contributions are included, 3D-UDS-8197 is also classified as not quenched by Prospector. The Prospector SFH reconstruction of 3D-UDS-8197 indicates that the galaxy was classified as quiescent during a period before the observation but has since experienced an increase in SFH, classifying it as star-forming at the time of observation. The rest-frame colors, however, classify this galaxy as quiescent, which is discussed further in Section 4.2. Additionally, this galaxy exhibits strong and broad emission lines likely driven by AGN activity. Given that the cloudy photoionization models used in Prospector are solely driven by star formation, they tend to elevate the SFR to match the observed spectrum, thereby failing to account for possible AGN contributions to the emission lines. The limitations of this approach are further discussed and addressed in Section 3.7.
3.7 The Role of how AGN is handled
In this section, we explore the role of adding AGN contribution as a free parameter to SED fitting for SFH recovery. There are two free parameters which are introduced to the Prospector fitting to account for AGN contributions. As summarized in Table 5, the first is the AGN bolometric luminosity fraction which is defined as a fraction of the stellar bolometric luminosity. This is allowed to vary between . The second parameter related to AGN is the optical depth for individual clouds as parametrized by Nenkova et al. (2008). This is computed in the -band and is allowed to vary between . The contribution of AGN to the emission lines is not accounted for in the Prospector fitting. This will be addressed further in a forthcoming paper by Martínez-Marín et al (in prep).
Based on Figure 13, for most galaxies, we find no statistically significant deviations in the reconstructed SFHs when AGN contributions are included. However, considering the overall shape of the SFH, both ZF-COS-10559 and ZF-COS-19589 show notable deviations between the two runs. In ZF-COS-10559, once AGN contributions are considered, the SFH shows a gradual incline, reducing the contribution of an early burst to the final stellar mass. Conversely, in ZF-COS-19589, the AGN contributions suggest that more mass was formed at earlier times.
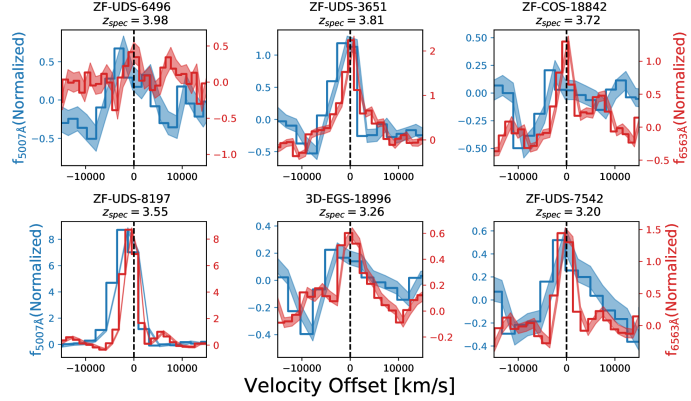
There are 6 galaxies in our sample with either significant detections of H or [Oiii] emission lines. We define significant detection as a line with S/N and an observed line equivalent width (EW) of Å, and we show these galaxies in Figure 14. Visual selection of the spectra also confirm the lines of these sources to be clearly visible over the local continuum level. In ZF-UDS-3651 and ZF-UDS-8197, both H and [Oiii] satisfy the significant detection criteria, in others only one of the 2 lines satisfy this selection. Visual inspection of ZF-UDS-7542 might suggest H to also be significantly detected, however, it is observed at a EWÅ, thus lower than our EW cut. With a nominal in PRISM mode observations, our velocity resolution is km/s in the band. Therefore, we are unable to provide tight constraints to the observed line widths of these sources, except for 3D-EGS-18996. Both [Oiii] and H are broad for this galaxy with slinefit providing a best-fit line width of km/s.
The ionizing spectrum of the Prospector cloudy grids are limited to stars, hence, emission lines lack contribution from AGN sources. While there is only minimal changes to the recovered SFHs when AGN effects are added, it is possible that this limitation of the input cloudy photoionization grids to have an effect on the Prospector results. Given the prominence of the emission lines of the 6 galaxies highlighted in Figure 14, it is possible for them to have a contribution from an AGN. While we cannot completely rule in favour of strong AGN contribution for these sources, it is necessary to determine the limitations of using cloudy grids that only have contributions from stars to our recovered SFHs.
We explore this by removing the emission line masks in the observed spectra and allowing freedom in Prospector to fit emission lines independently of the input ionization conditions. In this setting, emission lines are considered purely Gaussian in nature and are marginalized over line width prior to obtain the maximum a posteriori solution. We utilize the nebular_marginalization template in Prospector and select the following strong optical emissions to marginalize over: H, [Oiii], [Nii], H, [Sii]. Given the prism resolution H and [Nii] are not resolved.
As shown in Figure 13, the recovered SFHs reconstructions are largely statistically consistent between the two Prospector runs that consider AGN effects. We also find that the and parameters to be statistically consistent between the two runs. When lines are marginalized vary between 0.25 to 0.93 with ZF-UDS-8197 showing highest value. Similarly, vary between 5.9 and 7.9 with 3D-EGS-18996 showing the largest value. However, we note that constraining both the ionizing spectrum and the overall SED shape together with star forming and AGN contributions is necessary and would provide tighter constraints to the nature of the AGN in galaxies such as ours. We revisit this in our forthcoming paper Martínez-Marín et al (in prep) and envision that novel advancements in machine learning assisted spectral fitting techniques would be able to address this in future (e.g. Li et al., 2024).
3.8 Recovery of mock star-formation histories from IllustrisTNG
So far we have investigated the role of the form and prior of the assumed SFH parameterization, the input stellar library/stellar population model, the wavelength window of the observed spectrum used for spectral fitting, nebular emission, and AGN in reconstructing the SFHs of our massive quiescent galaxy sample. The results indicate that the final best fit or maximum a posteriori SFH solution in general has good agreement between these variations. The average SFH of the sample also show to be statistically consistent. However, the main limitation here is that we have no ground truth to establish the accuracy of the recovered SFHs.
To assess this limitation, we utilize mock observations to investigate whether the input SFHs can be recovered accurately by Prospector. In order to use realistic SFHs to perform mock observations, we utilize the IllustrisTNG simulations (Pillepich et al., 2018a; Springel et al., 2018) to select 283 massive galaxies () at from the TNG300 suite that are expected to be quiescent based on the definition of /yr from Schreiber et al. (2018a). We note that TNG300 simulations show good agreement for the number density of massive quiescent galaxies at (Valentino et al., 2023).
Once the galaxies are selected from TNG300, the SFHs are computed from the mass-weighted distribution of stellar formation times of all star particles bound to the subhalo, as was done in Chittenden & Tojeiro (2023). This gives the star formation histories a greater time resolution than the snapshot data: 1.4 Myr per age bin, compared with a median snapshot time difference of 74 Myr, up to . Furthermore, unlike the stellar mass obtained from the merger tree, this field is derived from the stellar ages of all particles of the subhalo. Therefore, we can compute an intrinsic SED from a fine-grained composite stellar population. Additionally, it effectively captures the star formation from all progenitors, not solely the main progenitor branch, therefore tracing the stellar mass contribution of all merger events throughout the galaxy’s history. Finally, this result in realistic SFHs for 283 sources.
Mock spectra for the 283 TNG300 selected sources are computed using the FSPS code. MILES stellar library with MIST stellar isochrones and Kroupa (2001) IMF is used for this purpose. Metallicity is fixed at 50% Z⊙, and a is applied to the spectra following a Calzetti (2000) dust law. The evolution of the SFR with cosmic time for each galaxy is input into the stellar population code using the set_tabular_sfh option. Spectra are generated at the rest-frame and are redshifted to their observed redshift. A physical velocity of 300 km/s is applied to the spectra following results from Esdaile et al. (2021a). We convert the NIRSpec PRISM instrument LSF to velocity and assert that the intrinsic resolution of the SSPs are lower than that. We then apply the LSF velocity smoothing to the spectra after subtracting the SSP spectral library resolution. Noise is added to the spectra following a random normal distribution such that there is a median S/N of 50, which is similar to our observations. The photometry for the mock spectrum is computed in the following JWST NIRCam bands using the sedpy555https://github.com/bd-j/sedpy package: F115W, F150W, F200W, F277W, F356W, F410M, F444W. For simplicity, we don’t add emission lines to the mock spectra nor use it as a free parameter in Prospector fitting.
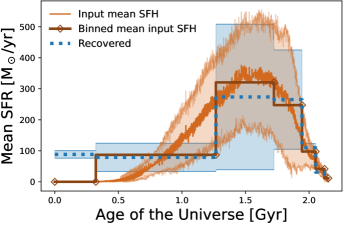
The mock spectrophotometry is fit using Prospector with similar parameters as outlined in Section 3.2. The recovered average SFHs are shown in Figure 15. The Prospector recoveries show good agreement with the average SFH of the input galaxies, with the growth the peak of the SFRs Gyr and the subsequent quenching phase matched well. The mock tests demonstrate that the earliest time bin defined around the first 300 Myrs in the Universe is not well constrained by the SFH recovery. As discussed in Section 3.5 we attribute this offset at the earliest bin to the use of a flat constant SFH prior with Prospector. However, our tests with realistic SFHs from TNG300 massive quiescent sources demonstrates that on average, current SED fitting models are able to recover the SFHs in the Universe with good sensitivity to stellar ages, even with low resolution NIRSpec PRISM data.
3.9 SFH comparison with cosmological simulations
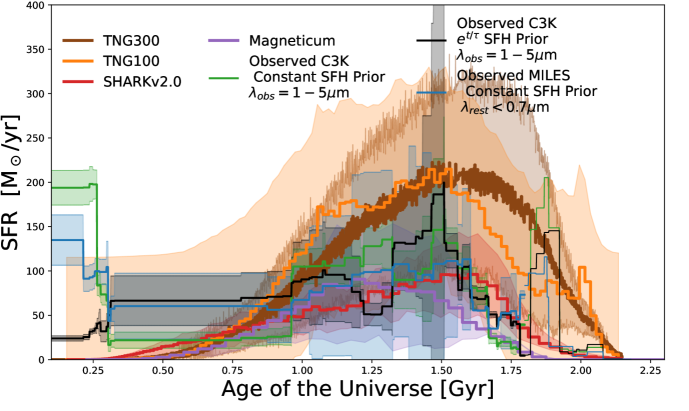
In order to compare the average formation histories of massive quiescent galaxies in our observed sample with the predictions from cosmological simulations, we utilize four cosmological suites as outlined below. To assist in comparison between the simulations, we use a constant definition of (mean mass of the observed sample) and /yr as the selection for massive quiescent galaxies.
First we select galaxies from the TNG300 cosmological suite (Pillepich et al., 2018b). TNG300 has a size of Mpc3 and we find 556 sources that classify as massive quiescent based on our definition at . The SFHs of these galaxies are computed as detailed in Section 3.8. In Figure 16, we show the comparison between the average SFHs of our massive quiescent sample (see Section 4.2) with the average SFHs of the TNG300 massive quiescent sample. Regardless of the stellar population models or the utilized SFH prior, the buildup of the average SFH of the observed sample largely follows what is predicted by TNG300. The significant deviation is during the first Myr of the Universe. As we noted in Section 3.3, this initial time window also shows the largest dependency for the input stellar library/stellar population models. As discussed in Section 3.5, utilizing an exponentially increasing SFH prior over a constant SFH prior, the average SFHs at the earliest time bins can be reduced. However, even with the exponentially increasing SFH prior, the offset between the SFHs of the models and the data are not statistically consistent with each other.
Utilizing the same IllustrisTNG cosmological suite, we use the SFHs of massive quiescent galaxies from the TNG100 simulations (Pillepich et al., 2018b) to compare with the observations. Compared to TNG300, TNG100 has a smaller size of Mpc3 but has dex higher particle resolution size. Given the limited volume of the TNG 100 simulations we only find 43 galaxies that satisfy our massive quiescent definition at . We show the average SFHs of these galaxies in Figure 16. While both TNG100 and TNG300 exhibit largely similar mass growth, the SFRs in TNG100 show a slightly earlier rise and fall. Additionally, TNG100 shows a rapid increase in SFR at Gyr before its rapid decline to .
The lower particle size of TNG100 compared to TNG300 allows for finer resolution in feedback processes and halo mass growth mechanisms (Nelson et al., 2018; Springel et al., 2018; Chittenden & Tojeiro, 2023). The higher particle resolution in TNG100 enables more detailed mapping of the gravitational potential of individual stellar and dark matter particles. As a result, TNG100 produces deeper (higher amplitude) potential wells compared to TNG300. Since star formation is coupled with the simultaneous cooling of gas and an increase in pressure, TNG100 achieves more efficient star formation, leading to the slightly earlier bias in mass growth relative to TNG300. Additionally, the finer resolution of feedback mechanisms in TNG100 allows for more effective regulation of star formation.
Next, we use SHARKv2.0 (Lagos et al., 2023) semi-analytical models to compare the formation histories of massive quiescent galaxies at . SHARK has a volume of 4643 cMpc3 and we find 502 galaxies that satisfy our massive quiescent galaxy criteria at . For each galaxy we investigate the SFR as a function of cosmic time and compute the mean SFH of the sample. We show this in Figure 16. While SHARK galaxies show a marginal increase in the average SFHs at earlier times, similar to the TNG suite, at Myr the shape of mass buildup of SHARK galaxies largely resembles our observed population.
In Figure 16 we further show the average formation histories of massive quiescent galaxies from the Magneticum Pathfinder hydrodynamical cosmological simulations (Remus & Kimmig, 2023). These sources are selected from the snapshot 6 (corresponding to ) of Magneticum Box 3 with a boxsize of 128cMpc/h. 184 central galaxies satisfy our massive quiescent galaxy criteria. The average mass buildup of the Magneticum sample is similar to the other simulations. However, the Magneticum sample reaches the peak SFRs at earlier times compared to the other simulations. Thus, it is evident that Magneticum has quenching mechanisms that is in general switched on at earlier times compared to the other simulations. This results in providing a higher number density of massive quiescent sources at (Kimmig et al., 2023). We attribute the early decline in the SFR in the Magneticum simulations to the more flexible implementation of feedback mechanisms.
In Magneticum, quenching is attributed to both AGN and star-formation feedback, allowing galaxies in underdense regions to expel gas more efficiently and quench star formation (Kimmig et al., 2023; Remus & Kimmig, 2023). Since quenching in Magneticum only requires a rapid isotropic gas inflow to trigger a star-burst, a rapid mass buildup may immediately precede quenching. As Magneticum differentiates cold and hot accretion onto the black hole (Steinborn et al., 2015), this allows for continuous accretion as long as cold dense gas falls in isotropically, even while a hot outflow is starting to be driven by the AGN. This leads to earlier black hole growth and stronger feedback (see Steinborn et al., 2015). Thus, while AGN feedback plays a significant role in quenching, there is less of a requirement for the black hole to reach a characteristic stellar mass to drive kinetic mode quenching.
The quenching of star formation in TNG300 galaxies at is attributed to the kinetic mode of the AGN being triggered when the central black hole reaches a critical stellar mass (Hartley et al., 2023). Once the kinetic mode energy exceeds 1% of the thermal mode energy in the AGN, the kinetic mode AGN expels the remaining star-forming gas in the galaxies, leading to quenching (Weinberger et al., 2018). Therefore, in TNG300, black holes must exceed a certain mass threshold before triggering quenching mechanisms, which results in a delayed onset of quenching compared to Magneticum.
Most of the quenching in SHARK happens through the AGN jet-mode feedback, which can start acting as long as jets are produced and there is a hot halo against which to produce work. The latter condition makes it hard for SHARK to start quenching a significant amount of massive galaxies at earlier times, producing the later quenching of galaxies compared to Magneticum.
The normalization difference between the peak SFRs of different simulations is due to the stellar mass distribution of the different galaxies. The mean mass of the TNG suite is higher compared to SHARK and Magneticum. The observed mean mass of our quiescent galaxies agree well with SHARK and Magneticum. Thus, the absolute normalization in SFR for our observations are similar to that of SHARK and Magneticum, while TNG100 and TNG300 have a marginally higher normalization as evident from Figure 16. This is further shown by Figure 22.
Further analysis of the formation and quenching mechanisms across a range of hydrodynamical and semi-analytical models is presented in (Lagos et al., 2024).
4 Discussion
4.1 The formation histories of the massive quiescent galaxies
Our analysis utilized novel JWST NIRSpec m spectroscopy of ground based selected massive quiescent galaxy candidates to explore their formation mechanisms. We showed consistent SFHs between different SED fitting codes, SFH parameterizations, input stellar population models, and other ISM and AGN related properties. Our sample showed a variety of formation and quenching timescales, ranging from the first billion years of the Universe to few Myrs before the time of observation. In this section, we first briefly discuss the advancements made in the Universe from previous NIR facilities and then explore the advancements we are now able to make with JWST.
In the pre-JWST era, deep observations from ground NIR facilities provided a first look into the properties of massive quiescent galaxies. In Glazebrook et al. (2017) we presented the first deep Keck/MOSFIRE band spectroscopy of a massive quiescent galaxy which was photometrically identified by NIR medium band imaging data from the ZFOURGE survey (Straatman et al., 2016). Spectral fitting inferred the galaxy to be Myr old and to have have assembled M⊙within a Myr window. This implied a very high star-formation efficiency for galaxies at , which was not observed in direct UV observations of sources at these early times (e.g. Smit et al., 2012; Salmon et al., 2016). A similar view of the early formation timescales was also established by the study of massive strong emission line dominated galaxies at (e.g. Marsan et al., 2017).
In Schreiber et al. (2018a) we preformed a mass complete analysis of the massive quiescent candidates utilizing photometric selections from ZFOURGE (Straatman et al., 2016) and 3DHST (Skelton et al., 2014) surveys. Keck/MOSFIRE and band spectroscopy of 24 candidates were presented by Schreiber et al. (2018a). 12 sources were spectroscopically confirmed, out of which 2 were found to be interlopers. The remaining sources, which primarily constituted of the fainter end of the -band selection eluded confirmation (also see Section 5.6.2 and Appendix E of Forrest et al. (2020b)), even with deep h of Keck/MOSFIRE observations. The reconstruction of the SFHs of the 22 candidates showed a variety of formation and quenching time scales, but stringent limits were not possible due to limited S/N and the limited spectral coverage of the ground based data.
Utilizing deep KECK/MOSFIRE and VLT/XSHOOTER observations, many surveys of massive quiescent galaxies were conducted by several teams. This result transformed our view of rapid formation of massive sources in the early Universe. The MAGAZ3NE survey presented spectroscopic confirmation for 16 photometrically selected M⊙ galaxies at selected from the UltraVISTA survey (Forrest et al., 2020b), out of which were expected to be quiescent. The ages of the massive quiescent candidates were constrained using the D4000Å and H- spectral features which suggested that most of the stellar mass of these galaxies formed Gy from time of observations. Tighter constraints were obtained with multi-band SED fitting, which constrained the formation window for MAGAZ3NE quiescent sources to be between with intense star-formation up to M⊙/yr followed by rapid quenching. Valentino et al. (2020) presented spectroscopy of three M⊙ quiescent galaxies at . They found the galaxies to have likely formed most of their stellar masses by and subsequently quenched at after experiencing peak SFRs of M⊙/yr.
Carnall et al. (2020) presented a sample of 10 robust photometrically selected massive quiescent candidates selected from the CANDELS UDS and GOODS-S fields (Grogin et al., 2011; Koekemoer et al., 2011). Spectroscopy for the sources were limited to the rest-UV, where Ly- emission was confirmed for 2 candidates, while another showed evidence for a clear Lyman break (the latter source was spectroscopically confirmed to be a massive quiescent galaxy (Carnall et al., 2023b)). The reconstructed SFHs for the robust sources suggested that the galaxies assembled most of their stellar masses within the first billion years of the Universe.
Antwi-Danso et al. (2023) presented spectroscopy of three M⊙ quiescent galaxy candidates at , selected using split-K band imaging from the FENIKS survey (Esdaile et al., 2021b). Two of the sources are expected to have formed at and undergone subsequent rapid quenching. One of the other galaxies (albeit with very poor spectral quality) suggest a formation time window at . This is similar to what was observed for ZF-UDS-7329 (also see Glazebrook et al., 2024; Nanayakkara et al., 2024; Carnall et al., 2024). However, the star formation window spans Gyr with the source only quenching within Myr of the observation time. This can be compared to Gyr old stellar population observed for ZF-UDS-7329, through the direct detection of the D4000Å spectral feature.
Open questions remain on pathway to quiescence. Our observations have shown that, even with ground band selections assisted with m Spitzer imaging we are able to photometrically select the oldest massive quiescent sources in the Universe (Glazebrook et al., 2024; Nanayakkara et al., 2024). One of the common theme between most of the reconstructed SFHs of massive quiescent galaxies across various surveys is the intense SFR at early time. This is tied to the rapid buildup of stellar masses and suggest that most of these sources could have had extensive star-formation in . Thus, a natural evolution of highly star-forming and obscured sub-mm galaxies at to massive quiescent galaxies can be expected (Valentino et al., 2020; Long et al., 2023). The open question is whether all massive quiescent galaxies undergo a sub-mm galaxy phase at or whether all sub-mm galaxies end up becoming massive quiescent galaxies by . Further studies linking the two populations with a robust number density constraints are required to conclusively determine the evolutionary pathways of these two galaxy populations.
4.2 What does it mean to be quiescent?
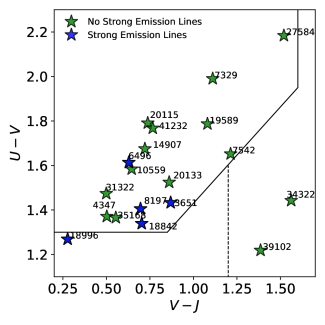
Color selection techniques, specially the rest-frame vs color distribution of galaxies have been commonly utilized to select quiescent galaxies in the extragalactic Universe (e.g. Williams et al., 2009; Spitler et al., 2014; Straatman et al., 2014; Schreiber et al., 2018a; Carnall et al., 2020). Quiescent galaxies with strong Balmer/D4000Å breaks show redder colors and bluer colors. Dusty galaxies show redder colors, hence in this space quiescent galaxies occupy a region which helps break the degeneracy of the red colors that are also observed in dusty star-forming galaxies. The quiescent quadrant can also hold dusty post-starburst galaxies which can smooth the Balmer break of post-starburst galaxies to look like D4000Å break mimicking an older quiescent galaxy. JWST now opens up a new redshift and magnitude (e.g. spectroscopy of faint sources) frontier which eluded ground based observations. Thus we need to address whether our traditional definitions for quiescence still holds in this era and whether the traditional color selection techniques used in identifying quiescent systems in the Universe are able to effectively select quiescent sources with high purity.
In Figure 17 we show the rest-frame vs color distribution of our galaxies. We use the C3K models fitted to the full spectrum with Prospector including emission line contributions for this purpose. The demarcations for quiescent, red (dusty) star-formation, and non-dusty (blue) star-formation follows Spitler et al. (2014) criteria. Within mag, except two galaxies, all of our sources fall in the quiescent region. This corresponds to an accuracy of approximately 90% for our sample and confirms that photometric selections are highly efficient in identifying quiescent galaxy candidates at .
The dustiest source in our sample is 3D-EGS-34322, with . 3D-UDS-39102 also exhibits a higher dust content, with . Both of these sources lie in the dusty star-forming region. Our oldest quiescent galaxy, ZF-UDS-7329, shows a low level of dust, while ZF-COS-20115 has the highest dust content among the quiescent sources, with .
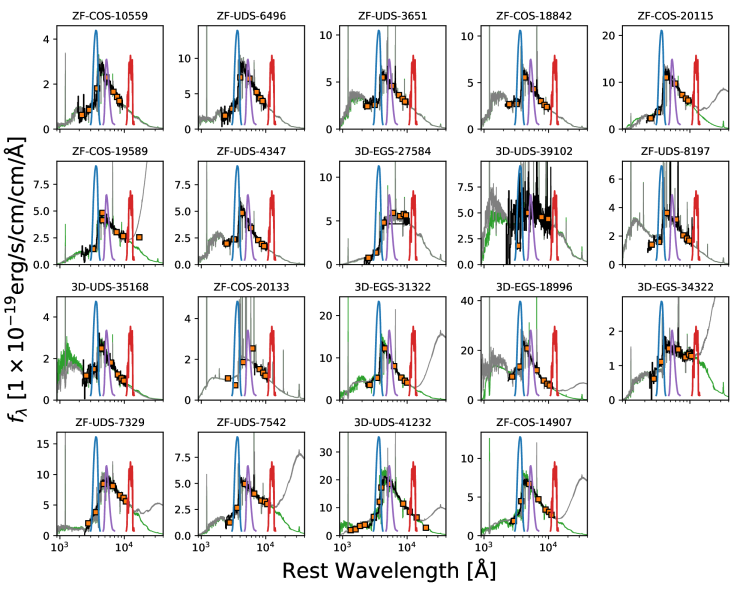
Galaxies with strong emission lines as identified as possible AGN in Section 3.7 primarily fall in the quiescent region. To investigate the effects of strong lines in the classification, we show the Prospector best-fit rest-frame SEDs of our galaxies in Figure 18. ZF-UDS-8197 has the strongest emission lines in our sample, and it is clearly visible that the strong H and [Oiii] emission lines fall outside the band. If these lines fell within the band, the galaxy’s position in the vs. color space would likely shift diagonally left toward the blue, star-forming region. Since these colors are defined in the rest frame, the fact that strong optical emission lines fall outside the band helps in more efficiently identifying quiescent galaxies photometrically, as there is less optical emission line contamination and a greater focus on the Balmer break.
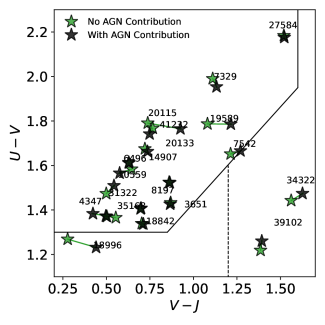
Adding effects of AGN to Prospector fitting only has a small role for the rest-frame colors. There are four galaxies that show a absolute shift of dex in the color-color space. There is a mean offset in rest-frame vs colours for the galaxies. The maximum shift observed is 0.19 dex. None of the galaxies move away from quiescent and/or star-forming regions when AGN effects are considered in the fitting.
To investigate the effect AGN contributions may have on rest-frame colors, we present the Prospector best-fit rest-frame SEDs used for the rest-UVJ color analysis in Figure 18. For 3D-UDS-35168, 3D-UDS-41232, and 3D-UDS-39102, the rest-UV shows a visual deviation between the two best-fit models. However, these variations are not captured by the band. The larger deviations in spectral shape are in the rest NIR regime of the SEDs and of our sample show significant variations in the NIR spectral shape. For majority of these galaxies the shift is beyond the region covered by observed photometry. The larger observed color shifts in galaxies such as ZF-COS-20115 and 3D-EGS-18996 are driven by the increase in the rest-frame band due to the contributions in the AGN in the SEDs. However, only the very early stages of this shift is captured by the band. Galaxies such as 3D-EGS-34322 also show significant variation in the NIR part of the best-fit SED when AGN effects are included in Prospector. However, this variation is not captured by the rest-frame band, thus the absolute shift in colors are mag.
For most of our sources, the reddest NIRCam band does not cover the rest-frame J band; thus, direct observational constraints are limited in constraining this turnover. We have three sources with no JWST/NIRcam imaging. For these sources as mentioned in Section 2, we use photometric data from the ZFOURGE and 3DHST surveys. Spitzer imaging in these surveys go beyond the rest-frame band. Therefore, for galaxies such as ZF-COS-19589, Spitzer IRAC Channel 4 imaging provide additional constrains to the shape of the SED, albeit with relatively lower S/N which reduces its constraining power. Based on photometric coverage, it is evident that imaging in the mid infra-red bands with instruments such as JWST/MIRI is required in galaxies to provide tighter constraints to the contribution of AGN to the observed SEDs of the galaxies.
To confirm whether our galaxies are truly quiescent, we use the Prospector best-fit parameters to examine the specific star formation rates (sSFR) of our sample and the distribution of the quiescent candidates within the star-forming stellar mass relation (Noeske et al., 2007). In Figure 19, we show the distribution of our sample in this space. The main locus for star-forming galaxies is defined based on the average SFR of the massive () galaxies in the ZFOURGE survey as defined by Schreiber et al. (2018a). The definition of quiescence is explored using three different methods. Firstly, the cut at the highest sSFR is obtained with , where is the age of the Universe at . Secondly, the cut is utilized, which is lower than the main star-forming locus as defined above. Finally, we also use a definition which is generally defined as the absolute cut in sSFR to obtain red and dead galaxies (e.g De Lucia et al., 2024).
All bar the two galaxies that fell within the (red) star-forming region in the color selection fall within at least one of the quenching definitions. As noted by Schreiber et al. (2018a) this highlights that the color selection is effectively able to identify fully quenched galaxies and galaxies with very low residual star-formation. We expect the massive galaxies in the latter selection are on route to be fully quenched. It is also important to highlight the distinction between our massive quiescent galaxies and the napping galaxies identified by JWST at higher redshifts (e.g. Looser et al., 2023; Strait et al., 2023). Given these sources have young stellar populations ( Myr), they have considerable UV flux and therefore cannot be photometrically selected by color selection techniques. Thus spectroscopy is crucial to discover such sources. Furthermore, these galaxies are considerably smaller (M⊙), thus rejuvenation at later times is expected to further build the stellar masses. Recent analysis of star-forming galaxies show evidence for such stochastic SFH at early times (Ciesla et al., 2023; Endsley et al., 2023; Pallottini & Ferrara, 2023). Further complications arise due to spatial color variations observed within some massive galaxies (Setton et al., 2024), which hints that central regions of massive quiescent galaxies maybe formed at earlier times with residual star-formation observed in the outskirts. High resolution observations of massive and quiescent galaxies with spatially resolved spectroscopy is required distinguish between different quenching pathways for galaxies in the early Universe by exploring age gradients and outflow signatures (Park et al., 2024).
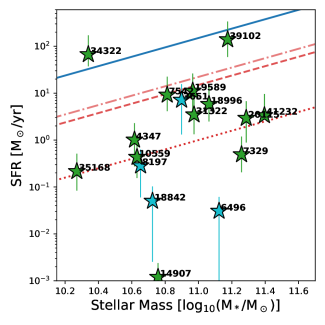
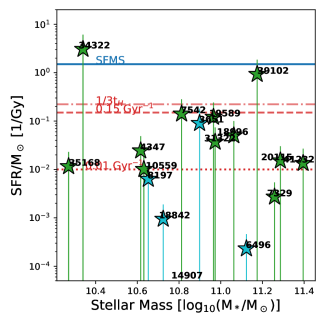
4.3 Prominence of NaD absorption and AGN in massive quiescent galaxies
Even within the lower resolution of the Prism observations, a sub-sample of our galaxies show clear NaD absorption features. In Figure 20 we show the spectra zoomed in around the region of NaD. There is no coverage for ZF-COS-20133 and 3D-EGS-27584 due to the detector gaps in NIRSpec.
Strong NaD absorption has been observed in quiescent galaxies at (Belli et al., 2023; Park et al., 2024) and in old massive quiescent galaxies at (Carnall et al., 2024). The high EW of NaD compared to the best fit stellar models and the blue shifted nature of the NaD feature (Belli et al., 2023) has been argued as evidence for AGN driven outflows which may have resulted in abruptly quenching the star-formation. Two of our sources, ZF-UDS-7329 and ZF-UDS-6496 are observed with the NIRSpec medium resolution gratings by Carnall et al. (2024) and shows a clear enhancement of NaD compared to their best-fit model. Carnall et al. (2024) also finds that ZF-UDS-7329 has enhanced abundance of [Mg/Fe] compared to solar values with best-fit results from alf (Conroy & van Dokkum, 2012; Conroy et al., 2018) suggesting a [Mg/Fe] of . While Na is not an element, the dominant production mechanisms of both Na and Mg are core collapse supernovae and asymptotic giant branch stars (Kobayashi et al., 2020). Thus, enhancement of Na in the inter stellar medium in galaxies can generally mirror an enhancement of process elements in galaxies. We also note that linking enhancements to the formation timescales of galaxies can be complicated due to the possibility of strong outflows expelling elements such as Mg, leading to a deficiency in the measured elements (e.g. Beverage et al., 2024).
Recent cosmological hydrodynamical simulations show that AGN feedback play a dominant role regulating star-formation leading to quenching at . Therefore, observational signatures of current and/or past effects of AGN should be visible in observed spectroscopy. As discussed in Section 3.7, there are 6 galaxies in our sample with prominent broad emission lines which indicate possible AGN activity. As shown by Figure 20, a subset of our sample also show prominent NaD absorption, including 4 of the 6 galaxies identified as possible AGN. These two observational signatures tied together could hint current or past AGN driven activity in most of the galaxies in our sample. Qualitative analysis of broad AGN and NaD outflow signatures require higher resolution spectra than what we currently have in the Prism mode.
Ground based spectroscopy of massive star-forming galaxies also show evidence for AGN, suggesting an enhanced fraction of AGN in higher stellar mass galaxies in the early Universe (e.g. Martínez-Marín et al., 2024). Therefore, a picture of AGN feedback driven rapid quenching is emerging to explain the formation mechanisms of massive quiescent galaxies. Future mass complete spectroscopic analysis of massive galaxies would provide tight constraints to AGN fractions and their outflow signatures in the early Universe. However, a possible complication do arise with the recent discovery of extremely compact and red objects in the early Universe (e.g. Labbe et al., 2023; Greene et al., 2024), which are attributed to previously unseen population of galaxies with AGN and possibly progenitor bulges of lower redshift massive quiescent galaxies. The X-ray and spectral properties of these sources are different to nominal AGN (e.g. Ananna et al., 2024; Wang et al., 2024), thus deeper constraints from x-ray and rest-frame optical and near-infrared spectroscopy is crucial to further constrain the properties of these galaxies and investigate their role in regulating galaxy growth in the early Universe.
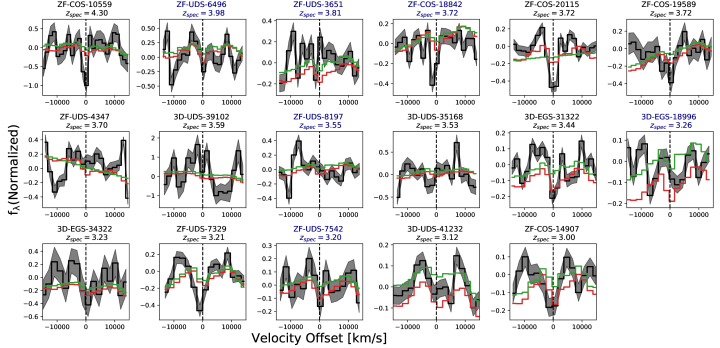
4.4 The number densities of massive quiescent galaxies
In the pre-JWST era, the number densities were largely constrained using photometric selection techniques. Candidates were selected with rest- color selection techniques. Deep ground based spectroscopy was used for spectroscopic confirmations and photometric number densities were statistically adjusted based on the contamination rate obtained by the spectroscopic observations (e.g Schreiber et al., 2018a).
The parent sample of our analysis presented by Schreiber et al. (2018a) found a number density of for massive quiescent galaxies with a band magnitude cut at . Carnall et al. (2020) found a similarly consistent number density of when similar selection criteria was applied to their photometric sample. However, when robust constrains were added to the redshift and sSFR posteriors, the number density of the Carnall et al. (2020) sample was reduced to .
Building upon the number densities presented by Schreiber et al. (2018a), we find that 2 further sources are classified as star-forming based on our analysis presented in Section 17. Both 3D-EGS-34322 and 3D-UDS-39102 did not have ground based spectroscopic confirmations. In the initial 24 massive quiescent galaxy candidates presented by Schreiber et al. (2018a), five galaxies are considered to be contaminants. ZF-COS-20032 and 3D-UDS-27939 were found to be dusty interlopers. Based on the MOSFIRE spectroscopic observations Schreiber et al. (2018a) found that ZF-COS-20133 and ZF-UDS-8197 had rest-frame vs colors that moved them out of the quiescent region due to high-EW [Oiii] emission lines. 3D-EGS-18996 was found also to have moved to the star-forming region due to significant underestimation of the photometric redshift.
In Section 17 we recomputed rest-frame colors for the JWST/NIRspec sample. This includes all three galaxies that were ruled out to be star-forming galaxies by Schreiber et al. (2018a). The rest-frame colors and the sSFRs of all three of these sources classify as quiescent. We note that we consider 3D-EGS-18996 rest quiescent due to it falling within mag from the quiescent region in the rest-frame vs color space. 3D-EGS-34322 and 3D-UDS-39102 are star-forming sources and can be removed as contaminants. While ZF-COS-10559 is quiescent, it is at , which is beyond the region probed by Schreiber et al. (2018a). Thus, once we also remove this source, we end up with the same 80% purity for quiescent sources and a number density of as Schreiber et al. (2018a). Thus our analysis highlights that pre-JWST number densities of massive quiescent galaxies are largely still consistent with post JWST results. Current cosmological and semi-analytical models are able to reproduce these number densities at (Lagos et al., 2023; Valentino et al., 2023) but challenges lie at (Weller et al., 2024).
5 Summary and Conclusions
In this work we presented JWST/NIRSpec spectroscopy of 19 massive quiescent galaxy candidates. This completes the spectroscopic followup of the 24 -selected massive quiescent galaxy candidates in the HST legacy fields presented by Schreiber et al. (2018a). We find that the 12 galaxies previously unconfirmed by ground-based spectroscopy are at , highlighting an accuracy of over 80% in the photometric redshifts for selecting Balmer break galaxies in the epoch.
We use FAST++ and Prospector SED fitting codes to analyze the formation history of our galaxies and compare with predictions from cosmological simulations. Our main conclusions are as follows:
-
•
17 of the 19 galaxies are classified to be quiescent based on the rest-frame and color selection techniques and various quenching definitions utilizing sSFR rates at .
-
•
The quenched sample show a variety of formation and quenching time scales. The oldest galaxy in our sample formed M⊙by and quenched for billion years by the time of the observation at .
-
•
The formation histories reconstructed using parametric SFH prior assumptions from FAST++ and binned/non-parametric SFH assumptions from Prospector are largely similar.
-
•
The choice of stellar libraries/stellar population models, the wavelength range used in spectral fitting, and how the effects of nebular emission and AGN are handled have minimal impact on the reconstructed shape of the SFHs for most our sources. While some galaxies show significant deviations, the average SFHs of the observed galaxies also remain largely consistent. However, we find that the assumed SFH prior plays a role in determining the SFR at the earliest times, particularly in galaxies where the diagnostic power of the observed spectra may be limited.
-
•
of our galaxies show high-EW broad H and/or [Oiii] emission lines signifying possible AGN activity in these quiescent galaxies.
-
•
of our galaxies show NaD absorption features signifying a Na enhancement in our sources and possible outflows. While these could be attributed to AGN and/or star-formation driven outflows that may have contributed to the rapid cessation in star-formation for our galaxies, we cannot conclusively investigate this due to the low resolution Prism mode observations.
-
•
With mock JWST/NIRspec Prism mode observations of TNG300 massive quiescent galaxies, we show that the average SFHs are recovered accurately by Prospector.
-
•
The average SFHs of massive quiescent galaxies from the Illustris TNG100, TNG300, SHARKv2, and Magneticum samples are consistent with the average SFR of our quiescent galaxies. This indicate that current hydrodynamical simulations can, on average, reproduce the observed formation histories of massive quiescent galaxies. However, there are variations in the different feedback modes across simulations, leading to overall differences in the quenching timescales of the simulated galaxies.
Our results highlight that JWST has now opened up a new window in to exploring the properties of stellar populations and formation histories of massive quiescent galaxies in the universe. The spectroscopic advancements compared to ground-based observations tighten the formation and quenching timescales of these populations and suggest that AGN may play a significant role in quenching the first massive galaxies in the early universe. While methods used for SFH analysis may influence the formation histories of individual galaxies, the population-wide statistics show good agreement. The main uncertainty arises at older times (at the highest redshifts), where the diagnostic power of stellar features in the galaxy spectra may be limited. Future higher resolution, spatially resolved spectroscopy from JWST NIRSpec and MIRI integral field spectrographs, as well as ground-based adaptive optics-enabled integral field spectroscopy from 10m-30m class telescopes, will provide tighter constraints on the relationship between stars and gas in these first massive quiescent galaxies, advancing our understanding of efficient star-formation quenching mechanisms in the early universe.
JWST: (NIRSpec)
Appendix A Appendix Figures
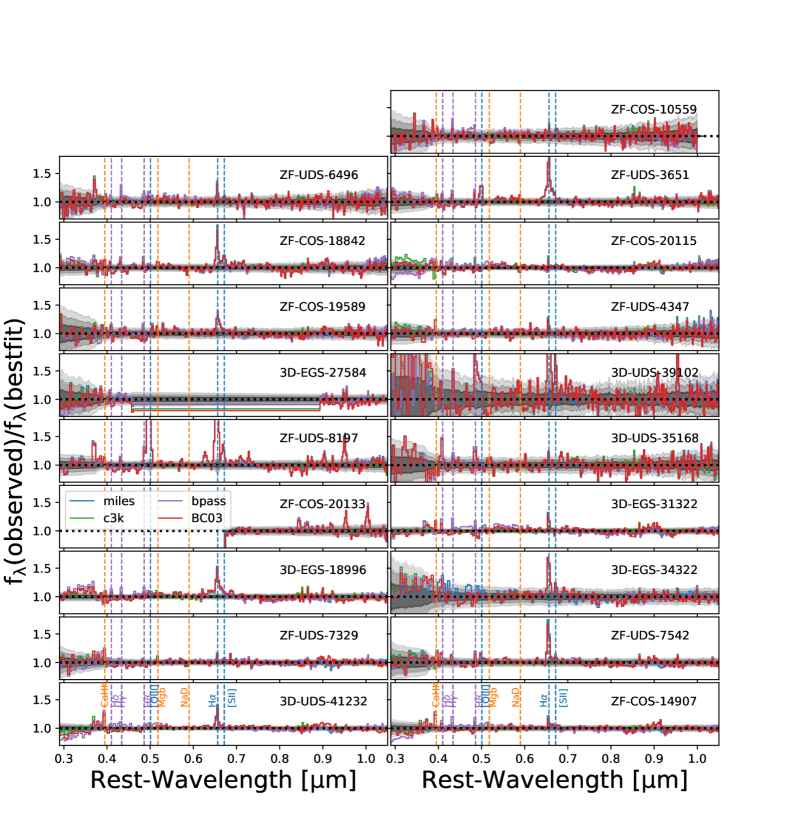
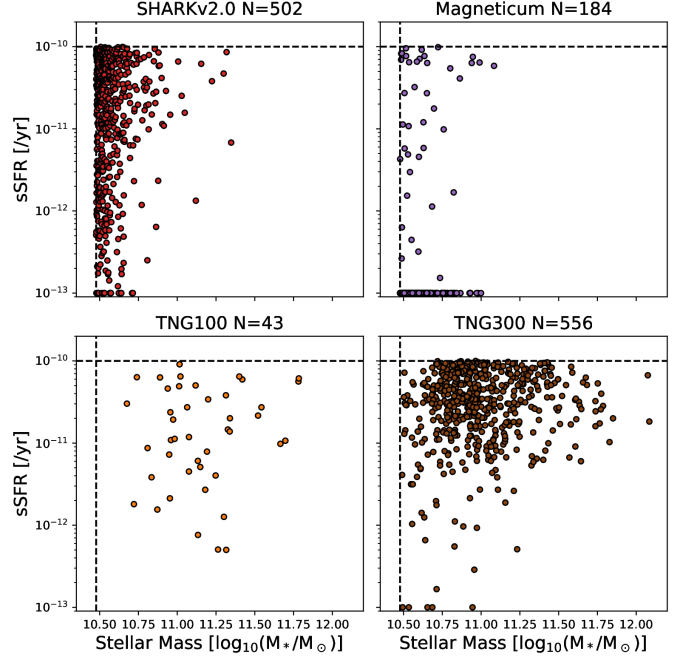
References
- Ananna et al. (2024) Ananna, T. T., Bogdán, Á., Kovács, O. E., Natarajan, P., & Hickox, R. C. 2024, arXiv e-prints, arXiv:2404.19010, doi: 10.48550/arXiv.2404.19010
- Antwi-Danso et al. (2023) Antwi-Danso, J., Papovich, C., Esdaile, J., et al. 2023, arXiv e-prints, arXiv:2307.09590, doi: 10.48550/arXiv.2307.09590
- Astropy Collaboration et al. (2018) Astropy Collaboration, Price-Whelan, A. M., Sipőcz, B. M., et al. 2018, AJ, 156, 123, doi: 10.3847/1538-3881/aabc4f
- Belli et al. (2023) Belli, S., Park, M., Davies, R. L., et al. 2023, arXiv e-prints, arXiv:2308.05795, doi: 10.48550/arXiv.2308.05795
- Bertelli et al. (1994) Bertelli, G., Bressan, A., Chiosi, C., Fagotto, F., & Nasi, E. 1994, A&AS, 106, 275
- Beverage et al. (2024) Beverage, A. G., Slob, M., Kriek, M., et al. 2024, arXiv e-prints, arXiv:2407.02556, doi: 10.48550/arXiv.2407.02556
- Bruzual & Charlot (2003) Bruzual, G., & Charlot, S. 2003, MNRAS, 344, 1000, doi: 10.1046/j.1365-8711.2003.06897.x
- Byler et al. (2017) Byler, N., Dalcanton, J. J., Conroy, C., & Johnson, B. D. 2017, ApJ, 840, 44, doi: 10.3847/1538-4357/aa6c66
- Calzetti (2000) Calzetti, D. 2000, in Building Galaxies; from the Primordial Universe to the Present, ed. F. Hammer, T. X. Thuan, V. Cayatte, B. Guiderdoni, & J. T. Thanh Van, 233
- Calzetti et al. (2000) Calzetti, D., Armus, L., Bohlin, R. C., et al. 2000, ApJ, 533, 682, doi: 10.1086/308692
- Carnall et al. (2019) Carnall, A. C., Leja, J., Johnson, B. D., et al. 2019, ApJ, 873, 44, doi: 10.3847/1538-4357/ab04a2
- Carnall et al. (2020) Carnall, A. C., Walker, S., McLure, R. J., et al. 2020, MNRAS, 496, 695, doi: 10.1093/mnras/staa1535
- Carnall et al. (2023a) Carnall, A. C., McLeod, D. J., McLure, R. J., et al. 2023a, MNRAS, 520, 3974, doi: 10.1093/mnras/stad369
- Carnall et al. (2023b) Carnall, A. C., McLure, R. J., Dunlop, J. S., et al. 2023b, Nature, 619, 716, doi: 10.1038/s41586-023-06158-6
- Carnall et al. (2024) Carnall, A. C., Cullen, F., McLure, R. J., et al. 2024, arXiv e-prints, arXiv:2405.02242, doi: 10.48550/arXiv.2405.02242
- Chabrier (2003) Chabrier, G. 2003, Publications of the Astronomical Society of the Pacific, 115, pp. 763. http://www.jstor.org/stable/10.1086/376392
- Chittenden & Tojeiro (2023) Chittenden, H. G., & Tojeiro, R. 2023, MNRAS, 518, 5670, doi: 10.1093/mnras/stac3498
- Choi et al. (2016) Choi, J., Dotter, A., Conroy, C., et al. 2016, ApJ, 823, 102, doi: 10.3847/0004-637X/823/2/102
- Ciesla et al. (2023) Ciesla, L., Elbaz, D., Ilbert, O., et al. 2023, arXiv e-prints, arXiv:2309.15720, doi: 10.48550/arXiv.2309.15720
- Conroy et al. (2009) Conroy, C., Gunn, J. E., & White, M. 2009, ApJ, 699, 486, doi: 10.1088/0004-637X/699/1/486
- Conroy & van Dokkum (2012) Conroy, C., & van Dokkum, P. G. 2012, ApJ, 760, 71, doi: 10.1088/0004-637X/760/1/71
- Conroy et al. (2018) Conroy, C., Villaume, A., van Dokkum, P. G., & Lind, K. 2018, ApJ, 854, 139, doi: 10.3847/1538-4357/aaab49
- Crain & van de Voort (2023) Crain, R. A., & van de Voort, F. 2023, ARA&A, 61, 473, doi: 10.1146/annurev-astro-041923-043618
- de Graaff et al. (2024) de Graaff, A., Setton, D. J., Brammer, G., et al. 2024, arXiv e-prints, arXiv:2404.05683, doi: 10.48550/arXiv.2404.05683
- De Lucia et al. (2024) De Lucia, G., Fontanot, F., Xie, L., & Hirschmann, M. 2024, arXiv e-prints, arXiv:2401.06211, doi: 10.48550/arXiv.2401.06211
- Dekel et al. (2013) Dekel, A., Zolotov, A., Tweed, D., et al. 2013, MNRAS, 435, 999, doi: 10.1093/mnras/stt1338
- D’Eugenio et al. (2021) D’Eugenio, C., Daddi, E., Gobat, R., et al. 2021, A&A, 653, A32, doi: 10.1051/0004-6361/202040067
- D’Eugenio et al. (2024) D’Eugenio, F., Cameron, A. J., Scholtz, J., et al. 2024, arXiv e-prints, arXiv:2404.06531, doi: 10.48550/arXiv.2404.06531
- Dotter (2016) Dotter, A. 2016, ApJS, 222, 8, doi: 10.3847/0067-0049/222/1/8
- Eldridge et al. (2017) Eldridge, J. J., Stanway, E. R., Xiao, L., et al. 2017, PASA, 34, e058, doi: 10.1017/pasa.2017.51
- Endsley et al. (2023) Endsley, R., Stark, D. P., Whitler, L., et al. 2023, arXiv e-prints, arXiv:2306.05295, doi: 10.48550/arXiv.2306.05295
- Esdaile et al. (2021a) Esdaile, J., Glazebrook, K., Labbé, I., et al. 2021a, ApJ, 908, L35, doi: 10.3847/2041-8213/abe11e
- Esdaile et al. (2021b) Esdaile, J., Labbé, I., Glazebrook, K., et al. 2021b, AJ, 162, 225, doi: 10.3847/1538-3881/ac2148
- Falcón-Barroso et al. (2011) Falcón-Barroso, J., Sánchez-Blázquez, P., Vazdekis, A., et al. 2011, A&A, 532, A95, doi: 10.1051/0004-6361/201116842
- Ferland et al. (2017) Ferland, G. J., Chatzikos, M., Guzmán, F., et al. 2017, Rev. Mexicana Astron. Astrofis., 53, 385. https://arxiv.org/abs/1705.10877
- Finkelstein et al. (2023) Finkelstein, S. L., Bagley, M. B., Ferguson, H. C., et al. 2023, ApJ, 946, L13, doi: 10.3847/2041-8213/acade4
- Foreman-Mackey et al. (2013) Foreman-Mackey, D., Hogg, D. W., Lang, D., & Goodman, J. 2013, PASP, 125, 306, doi: 10.1086/670067
- Forrest et al. (2020a) Forrest, B., Marsan, Z. C., Annunziatella, M., et al. 2020a, ApJ, 903, 47, doi: 10.3847/1538-4357/abb819
- Forrest et al. (2020b) Forrest, B., Annunziatella, M., Wilson, G., et al. 2020b, ApJ, 890, L1, doi: 10.3847/2041-8213/ab5b9f
- Forrest et al. (2022) Forrest, B., Wilson, G., Muzzin, A., et al. 2022, ApJ, 938, 109, doi: 10.3847/1538-4357/ac8747
- Glazebrook et al. (2017) Glazebrook, K., Schreiber, C., Labbé, I., et al. 2017, Nature, 544, 71, doi: 10.1038/nature21680
- Glazebrook et al. (2024) Glazebrook, K., Nanayakkara, T., Schreiber, C., et al. 2024, Nature, 628, 277, doi: 10.1038/s41586-024-07191-9
- Gobat et al. (2012) Gobat, R., Strazzullo, V., Daddi, E., et al. 2012, ApJ, 759, L44, doi: 10.1088/2041-8205/759/2/L44
- Greene et al. (2024) Greene, J. E., Labbe, I., Goulding, A. D., et al. 2024, ApJ, 964, 39, doi: 10.3847/1538-4357/ad1e5f
- Grogin et al. (2011) Grogin, N. A., Kocevski, D. D., Faber, S. M., et al. 2011, ApJS, 197, 35, doi: 10.1088/0067-0049/197/2/35
- Hartley et al. (2023) Hartley, A. I., Nelson, E. J., Suess, K. A., et al. 2023, MNRAS, 522, 3138, doi: 10.1093/mnras/stad1162
- Hunter (2007) Hunter, J. D. 2007, Computing In Science & Engineering, 9, 90
- Johnson et al. (2021) Johnson, B. D., Leja, J., Conroy, C., & Speagle, J. S. 2021, ApJS, 254, 22, doi: 10.3847/1538-4365/abef67
- Kimmig et al. (2023) Kimmig, L. C., Remus, R.-S., Seidel, B., et al. 2023, arXiv e-prints, arXiv:2310.16085, doi: 10.48550/arXiv.2310.16085
- Kobayashi et al. (2020) Kobayashi, C., Karakas, A. I., & Lugaro, M. 2020, ApJ, 900, 179, doi: 10.3847/1538-4357/abae65
- Koekemoer et al. (2011) Koekemoer, A. M., Faber, S. M., Ferguson, H. C., et al. 2011, ApJS, 197, 36, doi: 10.1088/0067-0049/197/2/36
- Kriek et al. (2009) Kriek, M., van Dokkum, P. G., Labbé, I., et al. 2009, ApJ, 700, 221, doi: 10.1088/0004-637X/700/1/221
- Kroupa (2001) Kroupa, P. 2001, in Astronomical Society of the Pacific Conference Series, Vol. 228, Dynamics of Star Clusters and the Milky Way, ed. S. Deiters, B. Fuchs, A. Just, R. Spurzem, & R. Wielen, 187
- Labbe et al. (2023) Labbe, I., Greene, J. E., Bezanson, R., et al. 2023, arXiv e-prints, arXiv:2306.07320, doi: 10.48550/arXiv.2306.07320
- Lagos et al. (2023) Lagos, C. D. P., Bravo, M., Tobar, R., et al. 2023, arXiv e-prints, arXiv:2309.02310, doi: 10.48550/arXiv.2309.02310
- Lagos et al. (2024) Lagos, C. d. P., Valentino, F., Wright, R. J., et al. 2024, arXiv e-prints, arXiv:2409.16916, doi: 10.48550/arXiv.2409.16916
- Le Borgne et al. (2003) Le Borgne, J.-F., Bruzual, G., Pelló, R., et al. 2003, A&A, 402, 433, doi: 10.1051/0004-6361:20030243
- Leja et al. (2019) Leja, J., Carnall, A. C., Johnson, B. D., Conroy, C., & Speagle, J. S. 2019, ApJ, 876, 3, doi: 10.3847/1538-4357/ab133c
- Leja et al. (2020) Leja, J., Speagle, J. S., Johnson, B. D., et al. 2020, ApJ, 893, 111, doi: 10.3847/1538-4357/ab7e27
- Li et al. (2024) Li, Y., Leja, J., Johnson, B. D., et al. 2024, arXiv e-prints, arXiv:2405.04598, doi: 10.48550/arXiv.2405.04598
- Long et al. (2023) Long, A. S., Casey, C. M., del P. Lagos, C., et al. 2023, ApJ, 953, 11, doi: 10.3847/1538-4357/acddde
- Looser et al. (2023) Looser, T. J., D’Eugenio, F., Maiolino, R., et al. 2023, arXiv e-prints, arXiv:2302.14155, doi: 10.48550/arXiv.2302.14155
- Lustig et al. (2023) Lustig, P., Strazzullo, V., Remus, R.-S., et al. 2023, MNRAS, 518, 5953, doi: 10.1093/mnras/stac3450
- Marsan et al. (2017) Marsan, Z. C., Marchesini, D., Brammer, G. B., et al. 2017, ApJ, 842, 21, doi: 10.3847/1538-4357/aa7206
- Martínez-Marín et al. (2024) Martínez-Marín, M., Glazebrook, K., Nanayakkara, T., et al. 2024, MNRAS, 531, 3187, doi: 10.1093/mnras/stae1335
- McCracken et al. (2012) McCracken, H. J., Milvang-Jensen, B., Dunlop, J., et al. 2012, A&A, 544, A156, doi: 10.1051/0004-6361/201219507
- McLean et al. (2012) McLean, I. S., Steidel, C. C., Epps, H. W., et al. 2012, in Ground-based and Airborne Instrumentation for Astronomy IV, ed. I. S. McLean, S. K. Ramsay, & H. Takami, Vol. 8446 (SPIE-Intl Soc Optical Eng), 84460J–84460J–15, doi: 10.1117/12.924794
- Nanayakkara et al. (2021) Nanayakkara, T., Esdaile, J., Glazebrook, K., et al. 2021, arXiv e-prints, arXiv:2103.01459. https://arxiv.org/abs/2103.01459
- Nanayakkara et al. (2024) Nanayakkara, T., Glazebrook, K., Jacobs, C., et al. 2024, Scientific Reports, 14, 3724, doi: 10.1038/s41598-024-52585-4
- Nelson et al. (2018) Nelson, D., Pillepich, A., Springel, V., et al. 2018, MNRAS, 475, 624, doi: 10.1093/mnras/stx3040
- Nenkova et al. (2008) Nenkova, M., Sirocky, M. M., Ivezić, Ž., & Elitzur, M. 2008, ApJ, 685, 147, doi: 10.1086/590482
- Noeske et al. (2007) Noeske, K. G., Weiner, B. J., Faber, S. M., et al. 2007, ApJ, 660, L43, doi: 10.1086/517926
- Oke & Gunn (1983) Oke, J. B., & Gunn, J. E. 1983, ApJ, 266, 713, doi: 10.1086/160817
- Oser et al. (2012) Oser, L., Naab, T., Ostriker, J. P., & Johansson, P. H. 2012, ApJ, 744, 63, doi: 10.1088/0004-637X/744/1/63
- Pallottini & Ferrara (2023) Pallottini, A., & Ferrara, A. 2023, A&A, 677, L4, doi: 10.1051/0004-6361/202347384
- pandas development team (2020) pandas development team, T. 2020, pandas-dev/pandas: Pandas, latest, Zenodo, doi: 10.5281/zenodo.3509134
- Park et al. (2024) Park, M., Belli, S., Conroy, C., et al. 2024, arXiv e-prints, arXiv:2404.17945, doi: 10.48550/arXiv.2404.17945
- Paxton et al. (2015) Paxton, B., Marchant, P., Schwab, J., et al. 2015, ApJS, 220, 15, doi: 10.1088/0067-0049/220/1/15
- Pérez-González et al. (2024) Pérez-González, P. G., D‘Eugenio, F., Rodríguez del Pino, B., et al. 2024, arXiv e-prints, arXiv:2405.03744, doi: 10.48550/arXiv.2405.03744
- Pillepich et al. (2018a) Pillepich, A., Springel, V., Nelson, D., et al. 2018a, MNRAS, 473, 4077, doi: 10.1093/mnras/stx2656
- Pillepich et al. (2018b) Pillepich, A., Nelson, D., Hernquist, L., et al. 2018b, MNRAS, 475, 648, doi: 10.1093/mnras/stx3112
- Remus & Kimmig (2023) Remus, R.-S., & Kimmig, L. C. 2023, arXiv e-prints, arXiv:2310.16089, doi: 10.48550/arXiv.2310.16089
- Salmon et al. (2016) Salmon, B., Papovich, C., Long, J., et al. 2016, ApJ, 827, 20, doi: 10.3847/0004-637X/827/1/20
- Schreiber et al. (2018a) Schreiber, C., Glazebrook, K., Nanayakkara, T., et al. 2018a, A&A, 618, A85, doi: 10.1051/0004-6361/201833070
- Schreiber et al. (2018b) Schreiber, C., Labbé, I., Glazebrook, K., et al. 2018b, A&A, 611, A22, doi: 10.1051/0004-6361/201731917
- Setton et al. (2024) Setton, D. J., Khullar, G., Miller, T. B., et al. 2024, arXiv e-prints, arXiv:2402.05664, doi: 10.48550/arXiv.2402.05664
- Skelton et al. (2014) Skelton, R. E., Whitaker, K. E., Momcheva, I. G., et al. 2014, ApJS, 214, 24, doi: 10.1088/0067-0049/214/2/24
- Smit et al. (2012) Smit, R., Bouwens, R. J., Franx, M., et al. 2012, ApJ, 756, 14, doi: 10.1088/0004-637X/756/1/14
- Spitler et al. (2014) Spitler, L. R., Straatman, C. M. S., Labbé, I., et al. 2014, ApJ, 787, L36, doi: 10.1088/2041-8205/787/2/L36
- Springel et al. (2018) Springel, V., Pakmor, R., Pillepich, A., et al. 2018, MNRAS, 475, 676, doi: 10.1093/mnras/stx3304
- Steinborn et al. (2015) Steinborn, L. K., Dolag, K., Hirschmann, M., Prieto, M. A., & Remus, R.-S. 2015, MNRAS, 448, 1504, doi: 10.1093/mnras/stv072
- Straatman et al. (2014) Straatman, C. M. S., Labbé, I., Spitler, L. R., et al. 2014, ApJ, 783, L14, doi: 10.1088/2041-8205/783/1/L14
- Straatman et al. (2016) Straatman, C. M. S., Spitler, L. R., Quadri, R. F., et al. 2016, ApJ, 830, 51, doi: 10.3847/0004-637X/830/1/51
- Strait et al. (2023) Strait, V., Brammer, G., Muzzin, A., et al. 2023, arXiv e-prints, arXiv:2303.11349, doi: 10.48550/arXiv.2303.11349
- Valentino et al. (2020) Valentino, F., Tanaka, M., Davidzon, I., et al. 2020, ApJ, 889, 93, doi: 10.3847/1538-4357/ab64dc
- Valentino et al. (2023) Valentino, F., Brammer, G., Gould, K. M. L., et al. 2023, arXiv e-prints, arXiv:2302.10936, doi: 10.48550/arXiv.2302.10936
- Wang et al. (2024) Wang, B., Leja, J., de Graaff, A., et al. 2024, arXiv e-prints, arXiv:2405.01473, doi: 10.48550/arXiv.2405.01473
- Weibel et al. (2024) Weibel, A., de Graaff, A., Setton, D. J., et al. 2024, arXiv e-prints, arXiv:2409.03829, doi: 10.48550/arXiv.2409.03829
- Weinberger et al. (2018) Weinberger, R., Springel, V., Pakmor, R., et al. 2018, MNRAS, 479, 4056, doi: 10.1093/mnras/sty1733
- Weller et al. (2024) Weller, E. J., Pacucci, F., Ni, Y., Hernquist, L., & Park, M. 2024, arXiv e-prints, arXiv:2406.02664, doi: 10.48550/arXiv.2406.02664
- Westera et al. (2002) Westera, P., Lejeune, T., Buser, R., Cuisinier, F., & Bruzual, G. 2002, A&A, 381, 524, doi: 10.1051/0004-6361:20011493
- Williams et al. (2009) Williams, R. J., Quadri, R. F., Franx, M., van Dokkum, P., & Labbé, I. 2009, ApJ, 691, 1879, doi: 10.1088/0004-637X/691/2/1879
- Xie et al. (2024) Xie, L., De Lucia, G., Fontanot, F., et al. 2024, arXiv e-prints, arXiv:2402.01314, doi: 10.48550/arXiv.2402.01314