Feature Extractor or Decision Maker: Rethinking the Role of Visual Encoders in Visuomotor Policies
Abstract
An end-to-end (E2E) visuomotor policy is typically treated as a unified whole, but recent approaches using out-of-domain (OOD) data to pretrain the visual encoder have cleanly separated the visual encoder from the network, with the remainder referred to as the policy. We propose Visual Alignment Testing, an experimental framework designed to evaluate the validity of this functional separation. Our results indicate that in E2E-trained models, visual encoders actively contribute to decision-making resulting from motor data supervision, contradicting the assumed functional separation. In contrast, OOD-pretrained models, where encoders lack this capability, experience an average performance drop of 42% in our benchmark results, compared to the state-of-the-art performance achieved by E2E policies. We believe this initial exploration of visual encoders’ role can provide a first step towards guiding future pretraining methods to address their decision-making ability, such as developing task-conditioned or context-aware encoders.
I Introduction
In vision-based robotic manipulation, end-to-end (E2E) visuomotor policies which map pixel inputs directly to control signals are gaining popularity due to their ability to model complex robot behaviors and motion modalities [1, 2, 3, 4]. However, training policies from scratch is restricted to simulation environments or requires large human demonstration datasets which are difficult to collect and scale [5, 6].
In computer vision, this low data issue is tackled by pretraining a universal visual encoder on large image datasets and adopting it for diverse downstream tasks [7, 8]. Recent advancements in robotic manipulation have mirrored this trend [9, 10, 11, 12, 13]. Specifically, they pretrain a visual encoder using out-of-domain (OOD) natural image and video datasets, such as ImageNet [14] and Ego4D [15], capturing semantic information [11] or temporal dynamics [9] in images or videos. The trained encoders are subsequently used frozen (without weights update) to extract visual features when training policies across various manipulation tasks. Significant performance improvements over E2E training are reported across diverse policy and task domains, particularly in low-data regimes (5 to 100 demonstrations).
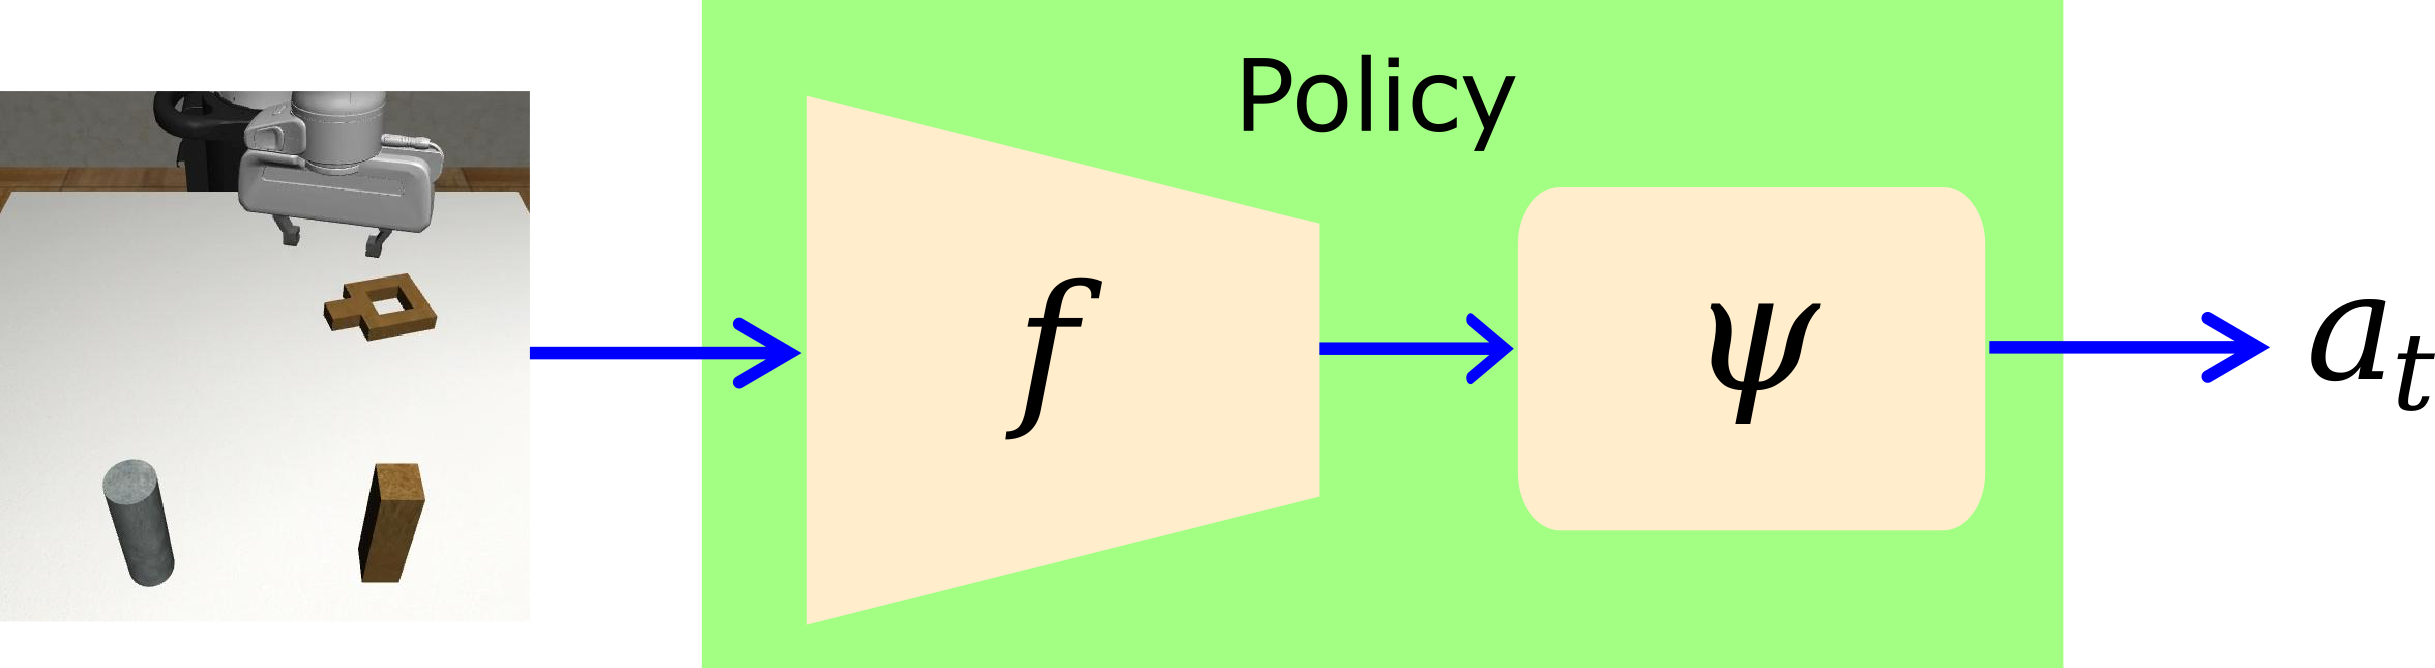
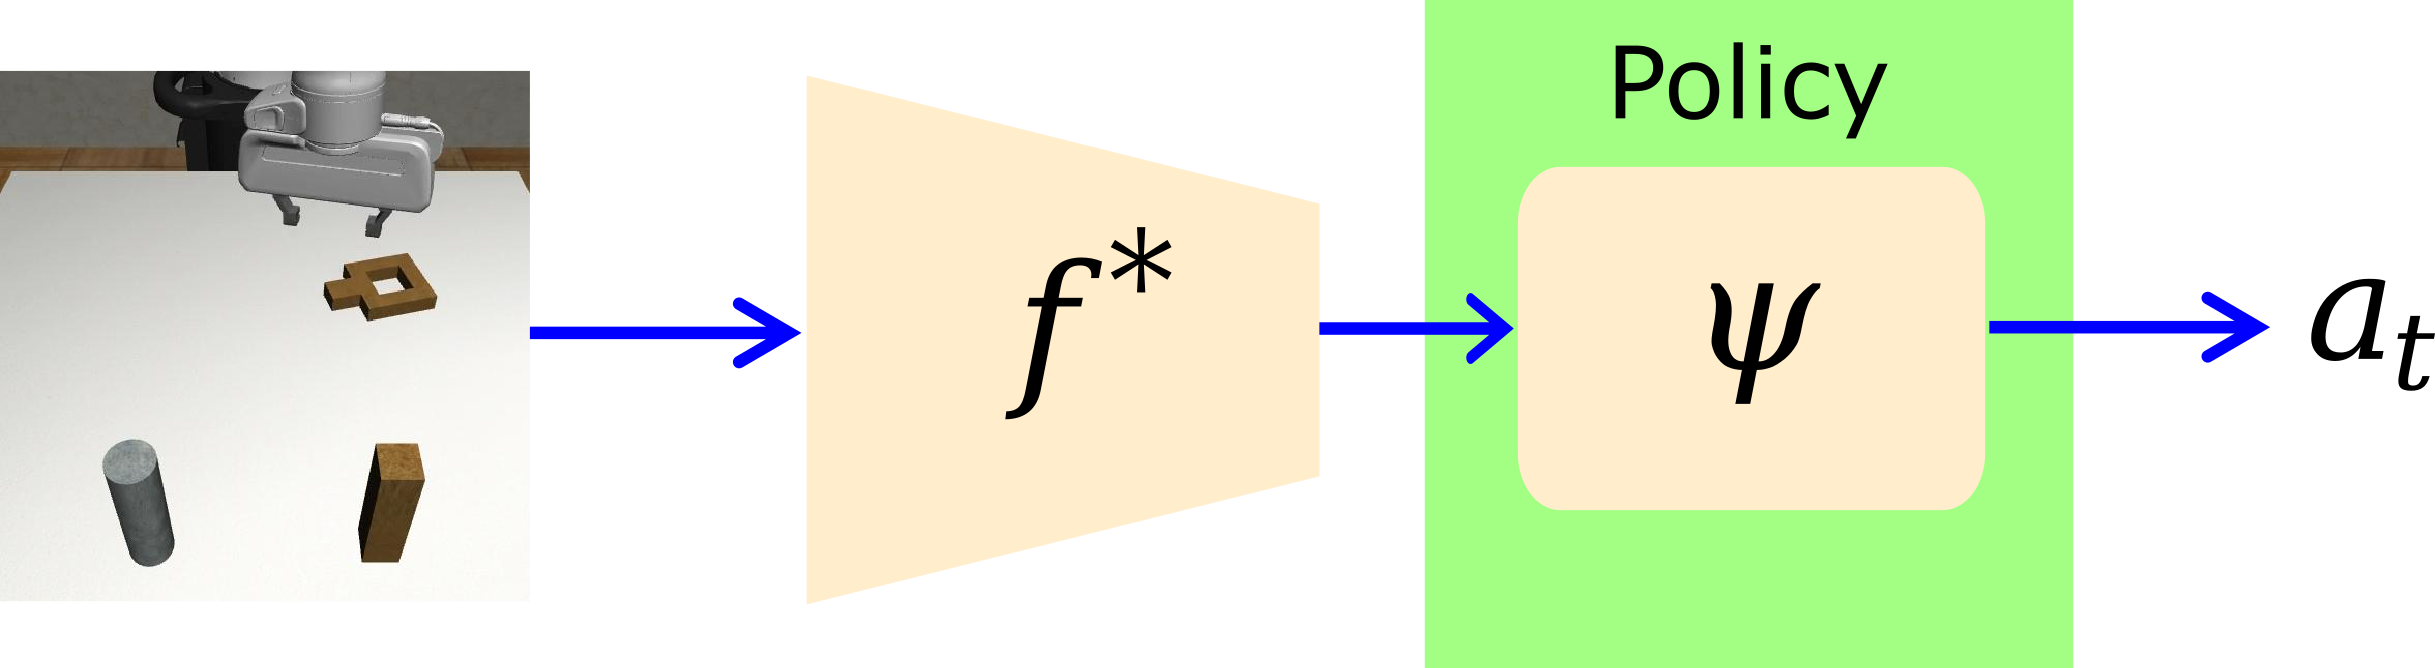
Despite the growing interest and significant advancements in pretraining methods, a crucial yet persistently overlooked difference between E2E and pretraining is that OOD pretraining shifts the formulation of visuomotor policies from a unified network to a modular design, comprising a frozen universal visual encoder and a trainable regression head, as shown in Fig. 1. This functional separation implicitly assumes that visual encoders act only as general feature extractors, without contributing to the decision-making process, given their lack of task data supervision.
However, the validity of this functional separation and the potential benefits of pretraining is compromised if its performance margin cannot be maintained under certain circumstances. In this paper, we establish a performance benchmark comparing OOD-pretrained encoders with the state-of-the-art performance achieved by E2E policies [16, 5, 17]. Our benchmarking results (see Tab. III) reveal that policies utilizing frozen pretrained encoders lose their performance advantage and result in an average success rate gap of 42% in simulation.
To further investigate the causes of the performance gap, given the difference in policy formulation between the two training paradigms, we hypothesize that the performance gap arises because E2E-trained visual encoders play an active role in decision-making, a capability OOD-pretrained encoders do not develop. To test this hypothesis, we introduce Visual Alignment Testing (VAT), an experimental framework designed to quantitatively assess the impact of visual encoders on decision-making (detailed in Section III.C). Additionally, we employ Fullgrad saliency maps [18] to qualitatively demonstrate how visual encoders contribute to decision-making through their pixel-wise activations. Experiments were conducted in both simulations and the real world.
Although the hypothesis may seem straightforward within the E2E paradigm, it has not yet been explicitly identified and verified. Additionally, its validity is becoming increasingly important for the community as OOD pretraining is built upon the assumption of the functional separation. This work provides initial quantitative and qualitative evidence explaining the underperformance of OOD pretraining for robotic manipulation, underscoring the overlooked role of visual encoders in visuomotor policies. The main contributions are:
-
•
We present a performance benchmark between OOD pretrained visual encoders and the state-of-the-art performance achieved by E2E policies, showcasing a performance gap.
-
•
We identify the performance gap stemming from E2E visual encoders actively contributing to the decision-making process and provide both quantitative and qualitative evidence via the proposed Visual Alignment Testing and Fullgrad saliency map.
-
•
Our results prompt a reflection on the role of visual encoders in visuomotor policies and the validity of their functional separation in pretraining, offering valuable insights for future research.
II Related Work
Initial attempts in applying OOD pretrained vision models to robotics directly integrate models from computer vision into the control pipeline. Lin et al. [19] adopt ImageNet [14] and COCO [20] pretrained models to predict the affordance maps for pre-defined motion primitives. Khandelwal et al. [21] study embodied navigation-heavy tasks using frozen visual encoders from CLIP [22]. Zhu et al. [23] obtain general object proposals from a pretrained visual model. These works incorporate pretrained visual encoders into their modular-designed frameworks, using them as low-level visual features enriched with semantic priors.
Recent works have explored developing a universal encoder for manipulation which is trained on OOD datasets and leveraging the encoder frozen for policy regression [24, 25, 26, 27]. PVR [12] finds that encoders pretrained on computer vision tasks can be transferred to behavior cloning. MVP [10], R3M [9] and VIP [11] investigate into self-supervised representation learning for control. Specifically, MVP trains a masked autoencoder (MAE) [28] on natural images as the visual encoder. Radosavovic et al. [13] extend this idea from simulation to real robot imitation learning. R3M uses a combination of time-contrastive learning and video-language alignment to capture environmental dynamics and semantics. VIP generates representations and dense visual rewards by reforming it into a value function optimization problem.
Several endeavours were made to benchmark the advances in OOD-pretrained encoders for manipulation. Jing et al. [29] explore three components in pretraining: datasets, models and training objectives. A more detailed dataset-centric analysis for pre-training is proposed by [30]. Hu et al. [31] conduct empirical evaluations for diverse pretrained vision models across different policies. However, these benchmarking studies primarily focus on comparing the performance of different pretrained encoders, without providing a direct comparison with E2E baselines. Hansen et al. [32] show a simple Learning-from-Scratch baseline is competitive with state-of-the-art pretrained models. However, they simply attribute the performance gap between pretrained and E2E models to domain gaps, without offering an in-depth understanding of the underlying reasons. Additionally, the role of visual encoders in visuomotor policies remains underexplored. This paper takes steps towards addressing these gaps by establishing a performance benchmark between pretrained encoders and their E2E-trained counterparts and facilitating a deeper understanding on the role of visual encoders with both quantitative and qualitative evidence.
III Methodology
| Method | Objective | Model | N-o-P (M) | Dataset | Supervision |
|---|---|---|---|---|---|
| ImageNet | Cross Entropy | ResNet18 | 11 | ImageNet | Class |
| R3M | Temporal Contrastive | ResNet18 | 11 | Ego4D | SSL |
| MVP | MAE | ViT-S | 22 | Multi | SSL |
| VIP | Value Optimization | ResNet50 | 23 | Ego4D | SSL |
III-A Preliminary
Learning-based robotic manipulation commonly develops visuomotor policies using reinforcement learning (RL) [33] or imitation learning (IL) [34]. In this paper, we primarily focus on IL. An IL policy learns action distribution from expert demonstration data , including image observation , proprioceptive state and robot action . Under the E2E-training scenario, given an observation state and a proprioceptive state , a policy directly maps the states to robot actions . The policy network can be viewed as two parts: a visual encoder which extracts visual features from and a regression head which predicts the actions, . The weights and are updated simultaneously to minimize the objective . For OOD pretraining, an OOD-pretrained visual encoder is applied frozen to image inputs and only is updated during training. We organize the rest of this section by introducing benchmark setting, design of Visual Alignment Testing (VAT) and the Fullgrad saliency map.
| Task | ActD | ObsD | Data | Step | RichC | LongH |
| Simulation Benchmark | ||||||
| Stack | 7 | 84 | 200 | 400 | No | No |
| Can | 7 | 84 | 200 | 400 | No | No |
| 7 | 84 | 200 | 400 | No | No | |
| Pick Place | 7 | 84 | 200 | 400 | No | Yes |
| Square | 7 | 84 | 200 | 400 | Yes | No |
| 7 | 84 | 200 | 400 | Yes | No | |
| Nut Assembly | 7 | 84 | 200 | 400 | Yes | Yes |
| PushT | 2 | 96 | 200 | 300 | Yes | Yes |
| Mug | 6 | 224 | 1000 | – | No | No |
| Spam | 6 | 224 | 1000 | – | No | No |
| Real-world Benchmark | ||||||
| Real Reach | 7 | 84 | 160 | – | No | No |
| Real PnP | 7 | 84 | 160 | – | No | No |
III-B Benchmark Setting
The performance of visuomotor policies is highly sensitive to task complexity and policy capacity [5, 6]. To better anchor the performance of pretrained encoders, we establish a benchmark where end-to-end policies achieve state-of-the-art performance [17]. Below, we outline the three components of our primary focus: pretrained encoders, end-to-end baselines and testing environments.
III-B1 Pretrained Encoders
We compare the performance of three state-of-the-art pretrained encoders specifically designed for control: R3M [9], MVP [13] and VIP [11]. An ImageNet pretrained ResNet18 [35] model is also considered due to its widespread use in computer vision. Tab. I shows an overview of the pretrained encoders. During the policy training phase, all encoders are frozen, adhering to the original evaluation protocols without modifications. For those with multiple variants, we adopt the smallest version of publicly available models to ensure a fair comparison. The pretrained encoders are evaluated in combination with various regression heads, as detailed in Section III.B.2.
III-B2 End-to-end Baselines
All E2E baselines utilize a visual encoder with the same structure, followed by different regression heads. Existing works on pretraining predominantly evaluate the pretrained encoders in combination with a simple behavior cloning (BC) algorithm. However, prior studies indicate a significant performance gap between BC and other history-dependent models [5, 6], and BC often fails to model multi-modality compared to implicit policies [36]. To underscore the impact of model capacity, we include the following algorithms as the regression head in our evaluation:
-
•
BC: An explicit model consisting of a two-layer fully connected MLP.
-
•
BC-RNN [5]: An adaptation of BC incorporates RNN that anticipates outcomes over a horizon of 10 steps.
-
•
DP-C [17]: A convolutional-based Diffusion Policy, an implicit model that learns the gradient of the action score function.
-
•
DP-T [17]: A transformer-based Diffusion Policy.
The encoder design follows that of Diffusion Policy [17]. Specifically, a standard ResNet18 model is randomly initialized and modified by replacing average pooling with spatial softmax [5] and substituting batch normalization with group normalization [37]. In tasks involving multiple camera views, each view is processed by a separate learnable visual encoder.
III-B3 Testing Environments
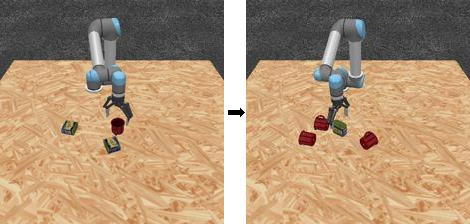
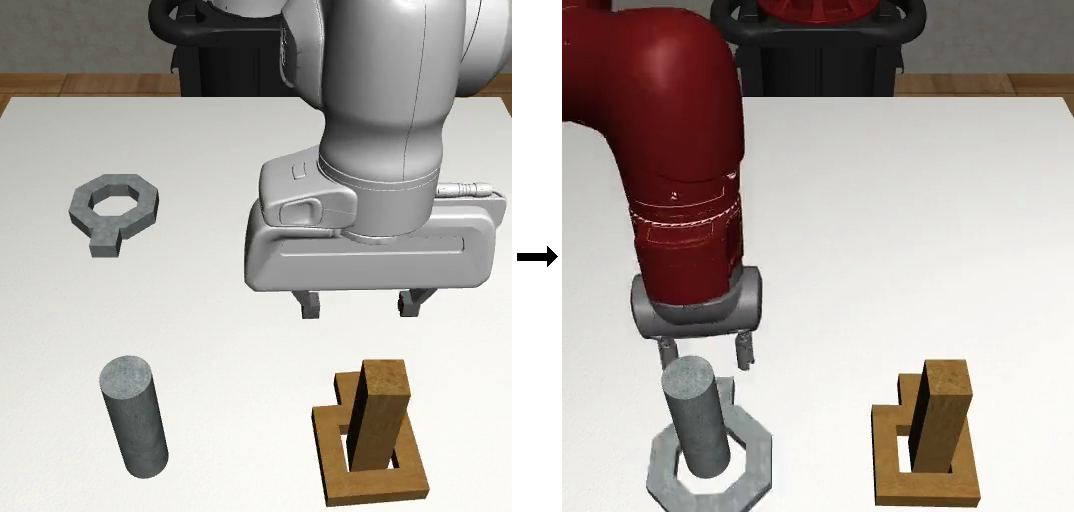
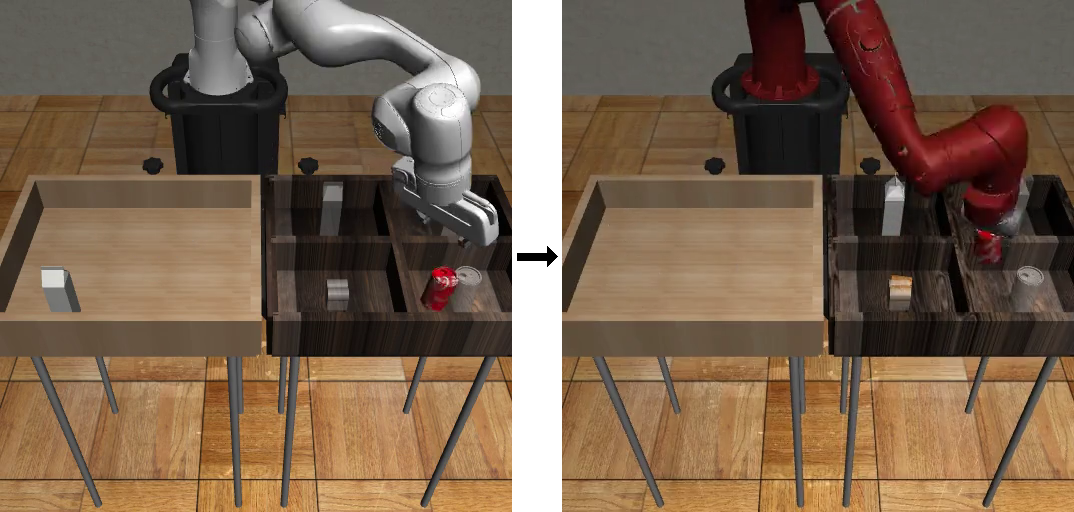
Tab. II provides an overview of the tasks used for benchmarking (highlighted in blue) and VAT (in black). These tasks are derived from three simulation environments and one real-world setting. An illustration of tasks used in VAT is shown in Fig. 3.
-
•
Robomimic [5] and MimicGen [6]: Two prominent demonstration datasets and benchmarks for robotic manipulation. We adopt Can and Square from Robomimic and Stack, Pick Place and Nut Assembly from MimicGen. and refer to two customized datasets that are collected by replaying the proficient-human dataset of Square and Can in Robomimic while adding a round nut or one random object appears in Pick Place in each demonstration.
-
•
PushT: A task introduced by IBC [36] featuring long-horizon and contact-rich dynamics.
-
•
UR5 Reach: Our customized simulation environment where a UR5 robot reaches for the closest Mug or a box of Spam on a table. The dataset consists of 1000 machine-generated trajectories for each task.
-
•
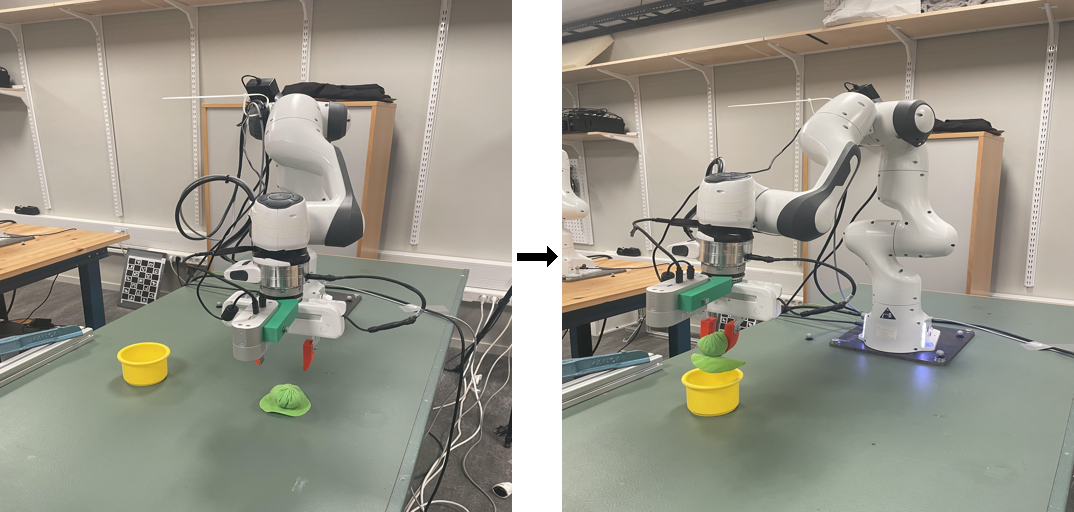
Franka Pick: Real-world experiments on a Franka Emika Panda robot. In Real Reach, the robot reaches for a deformable ball, and in Real PnP, it picks and places the ball into a bucket. The data for these tasks were collected by a proficient human operator teleoperating the robot via a VR controller [38].
III-C Visual Alignment Testing
We hypothesise that E2E-trained visual encoders are playing an active role in decision-making. This hypothesis, if shown to hold, may explain the underperformance of pretrained encoders which lack task data supervision due to the functional separation in OOD pretraining. However, the implicit nature of neural networks presents a challenge in directly validating the hypothesis. Therefore, we propose Visual Alignment Testing, a proof-by-contradiction approach as outlined below.
In imitation learning, the definition of tasks is embedded in their demonstration data . In most cases, two different tasks and , such as picking up a cup and cutting an apple, have both distinct visual inputs and motor signals. One special case is when two tasks share the same visual distribution111The same visual distribution refers to the distribution of visual contents. but have different motor signals. For example in Fig.3, both tasks—reaching for a mug and a box of spam—include the same visual contents in the scene, but the control signals direct them to interact with different objects.
Consider two tasks and that share the same visual distribution but differ in motor signals. Two visuomotor policies and are trained end-to-end for each task respectively with successful convergence. Assuming that visual encoders do not play an active role in decision-making, then the encoders and should yield similar features given the same inputs, as they are trained on visual data with the same distribution.
| (1) |
where is a image observation of or at time .
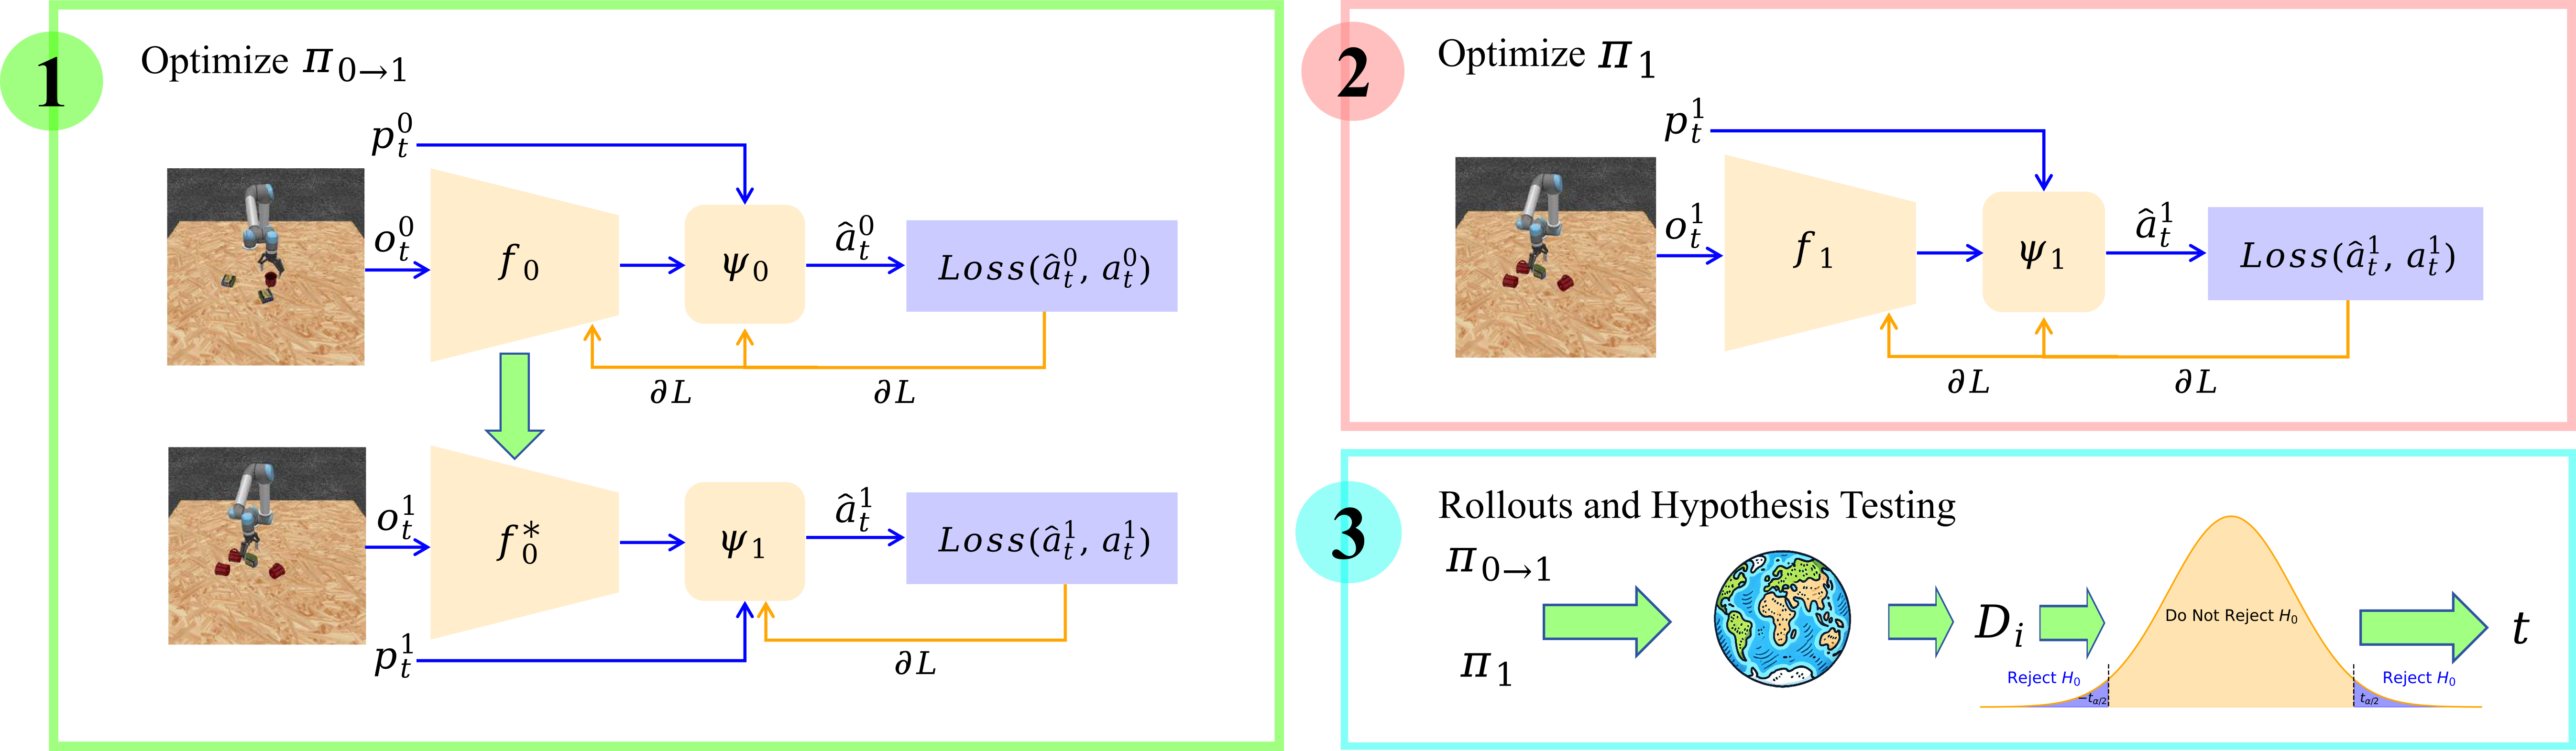
In other words, and should be interchangeable between the two policies. Consequently, if we extract trained on and apply it frozen to train another policy for , resulting in , no significant performance discrepancy between and should be observed in expectation.
| (2) |
where is the metric for policy performance, and stands for the expectation of testing rollouts.
Therefore, for a given performance discrepancy threshold , if there exists , such that
| (3) |
A contradiction occurs. This would imply that the assumption of visual encoders not playing an active role in decision-making is proven to be incorrect. A threshold is introduced to capture training randomness.
This chain of logic can be empirically verified through hypothesis testing applied to the collected experimental data. We refer to this experimental framework as Visual Alignment Testing (VAT). Let and be the success rate of and in the testing environment and define .
The null hypothesis is established as: there is no significant performance discrepancy between and . and the alternative hypothesis then write:
| (4) |
where is the mean value of .
The unbiased standard deviation is calculated as:
| (5) |
where is the number of testing environments, is the estimated mean value of .
According to dependent -test, the -statistic is given by:
| (6) |
We reject if is greater than the critical value given a preset significance level .
| (7) |
Therefore, if the value derived through experiments is larger than the critical value, the null hypothesis can be rejected, providing quantitative evidence that visual encoders play an active role in decision-making. The framework of VAT is demonstrated in Fig. 2.
III-D Full-Gradient Saliency Map
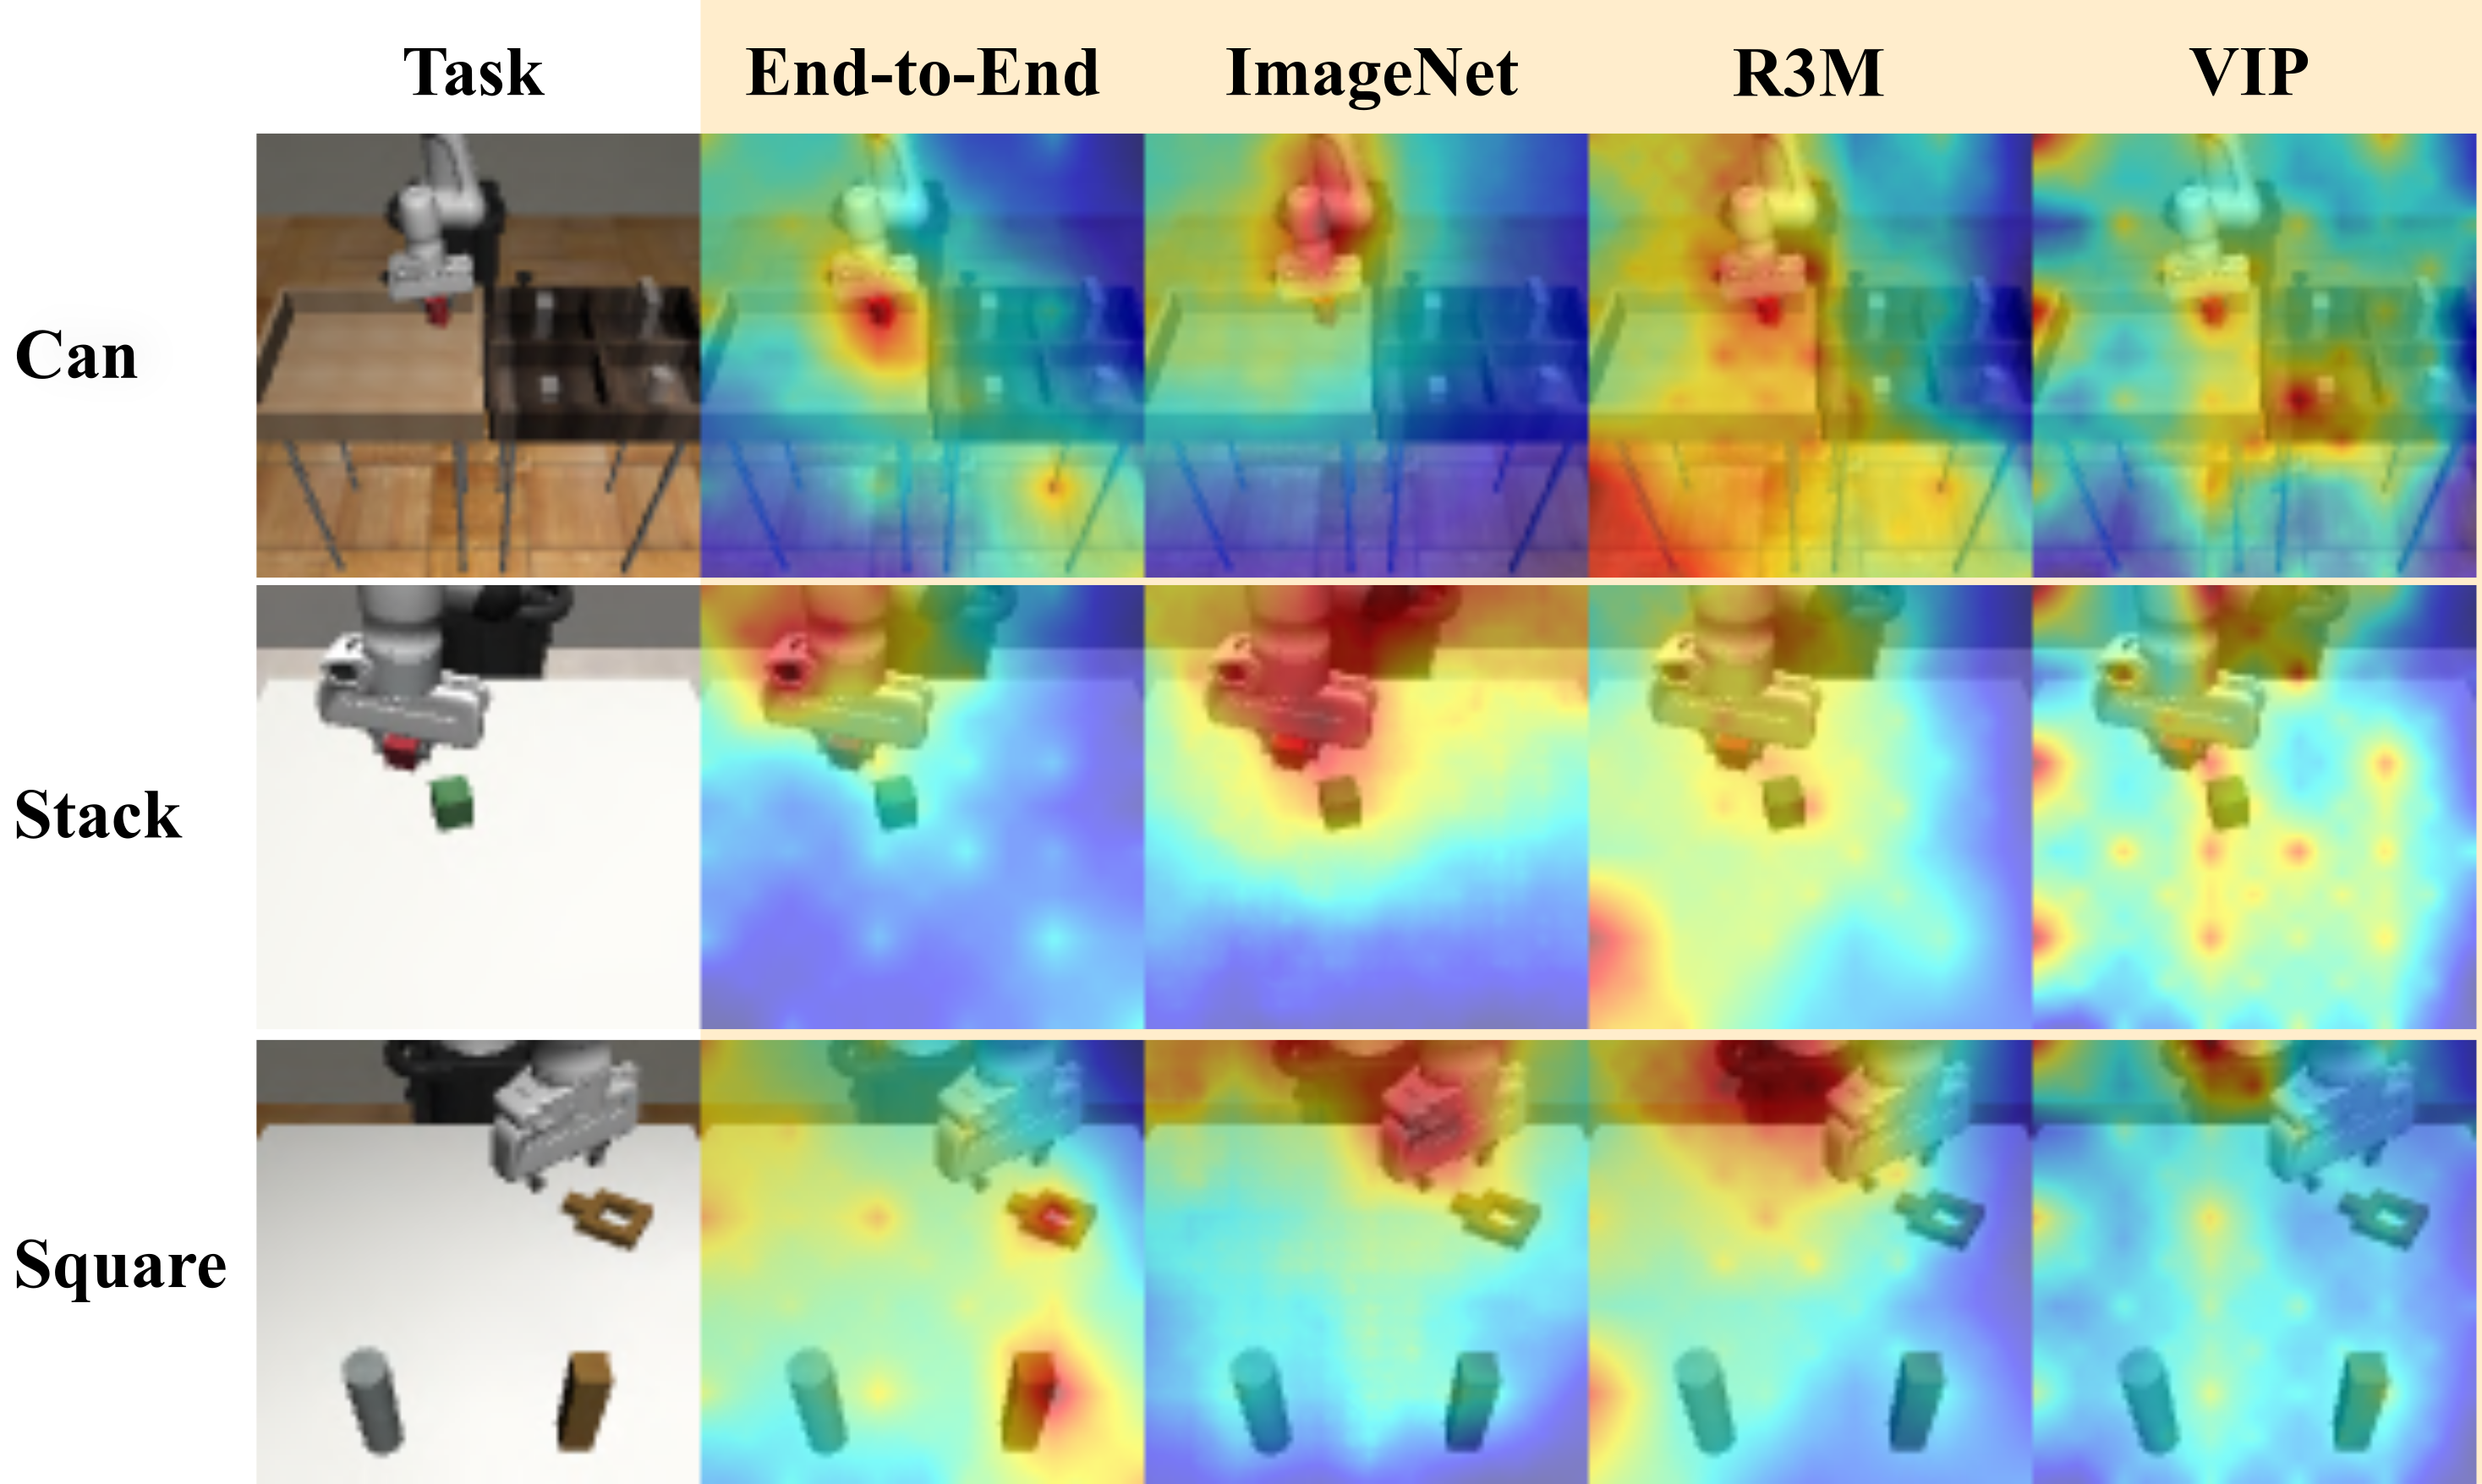
In addition to the quantitative results of VAT, we adopt FullGrad [18] to qualitatively demonstrate how visual encoders capture specific task information and contribute to the decision-making process. FullGrad aggregates full-gradient components to generate saliency maps that highlight the most influential regions in the input pixels affecting the network’s output, making it a widely used tool in model explainability within computer vision. Examples can be seen in Fig. 5.
IV Experiment
| Task | Avg. Policy | Avg. Encoder | |||||||
|---|---|---|---|---|---|---|---|---|---|
| ImageNet | R3M | MVP | VIP | E2E | BC | BC-RNN | DP-C | DP-T | |
| PushT | |||||||||
| Can | |||||||||
| Stack | |||||||||
| Square | |||||||||
IV-A Experimental Setup
IV-A1 Evaluation Protocol
The evaluation metrics include success rate for all Robomimic and MimicGen tasks and the real-world experiments, target area coverage [36] for PushT and validation loss for UR5 Reach tasks. In simulations, the results are reported as the average of the top 3 best-performing checkpoints saved every 30 epochs. Each checkpoint is tested in 50 environment rollouts with different initializations (unseen in the training data), resulting in 150 trials in total. For real-world experiments, we evaluate the success rate based on 20 robot executions.
IV-A2 Implementation Detail
In all experiments, images are normalized to . Random cropping is uniformly applied with a cropping size of 7676 pixels, except for the UR5 Reach tasks. Following the original setups of the OOD-pretrained encoders, we resize images to 224224 pixels after cropping for all encoders and multiply the images by 255.0 for R3M and VIP. Policies are optimized by the Adam optimizer [39] with a learning rate of for 600 epochs and a batch size of 128. The frozen encoders used in VAT are selected based on the best-performing checkpoint in simulation and the last checkpoint in the real world.
IV-B Experimental Result
[Result 1] OOD pretraining formulation does not lead to consistent performance gain.
We establish a performance benchmark that evaluates four frozen encoders (Imagenet, R3M, MVP and VIP) in combination with four regression heads (BC, BC-RNN, DP-C and DP-T) on four challenging manipulation tasks (Stack, Can, Square and PushT). We compare these combinations with their corresponding policies that utilize a ResNet-18 as the visual encoder trained end-to-end. The results are summarized in Tab. III. As shown in the left part of Tab. III, the OOD-pretrained encoders fail to maintain the reported performance margin over E2E-trained models, resulting in an average performance gap of 42% across all settings. This gap exaggerates with increasing task complexity, from simple pick-and-place tasks like Can to long-horizon contact-rich tasks, such as PushT and Square. Additionally, the right part of Tab. III shows that downstream policies with greater capacity significantly enhance model performance for both E2E and pretrained settings.
| Task | Policy | Rej. | |||
|---|---|---|---|---|---|
| BC | 7.61 | Yes | |||
| Nut Ass. | DP-C | 10.51 | Yes | ||
| BC | 3.17 | Yes | |||
| Pick Place | DP-C | 7.20 | Yes | ||
| BC | 8.17 | Yes | |||
| Real PnP | DP-C | Yes |
[Result 2] The performance gap arises because E2E-trained visual encoders play an active role in decision-making.
OOD pretraining differs from E2E training due to its modular formulation of visuomotor policies and the functional separation of visual encoders. The validity of this separation assumes that visual encoders function solely as general feature extractors, without contributing to the decision-making process. However, the benchmarking results suggest that this assumption may not fully hold in practice.
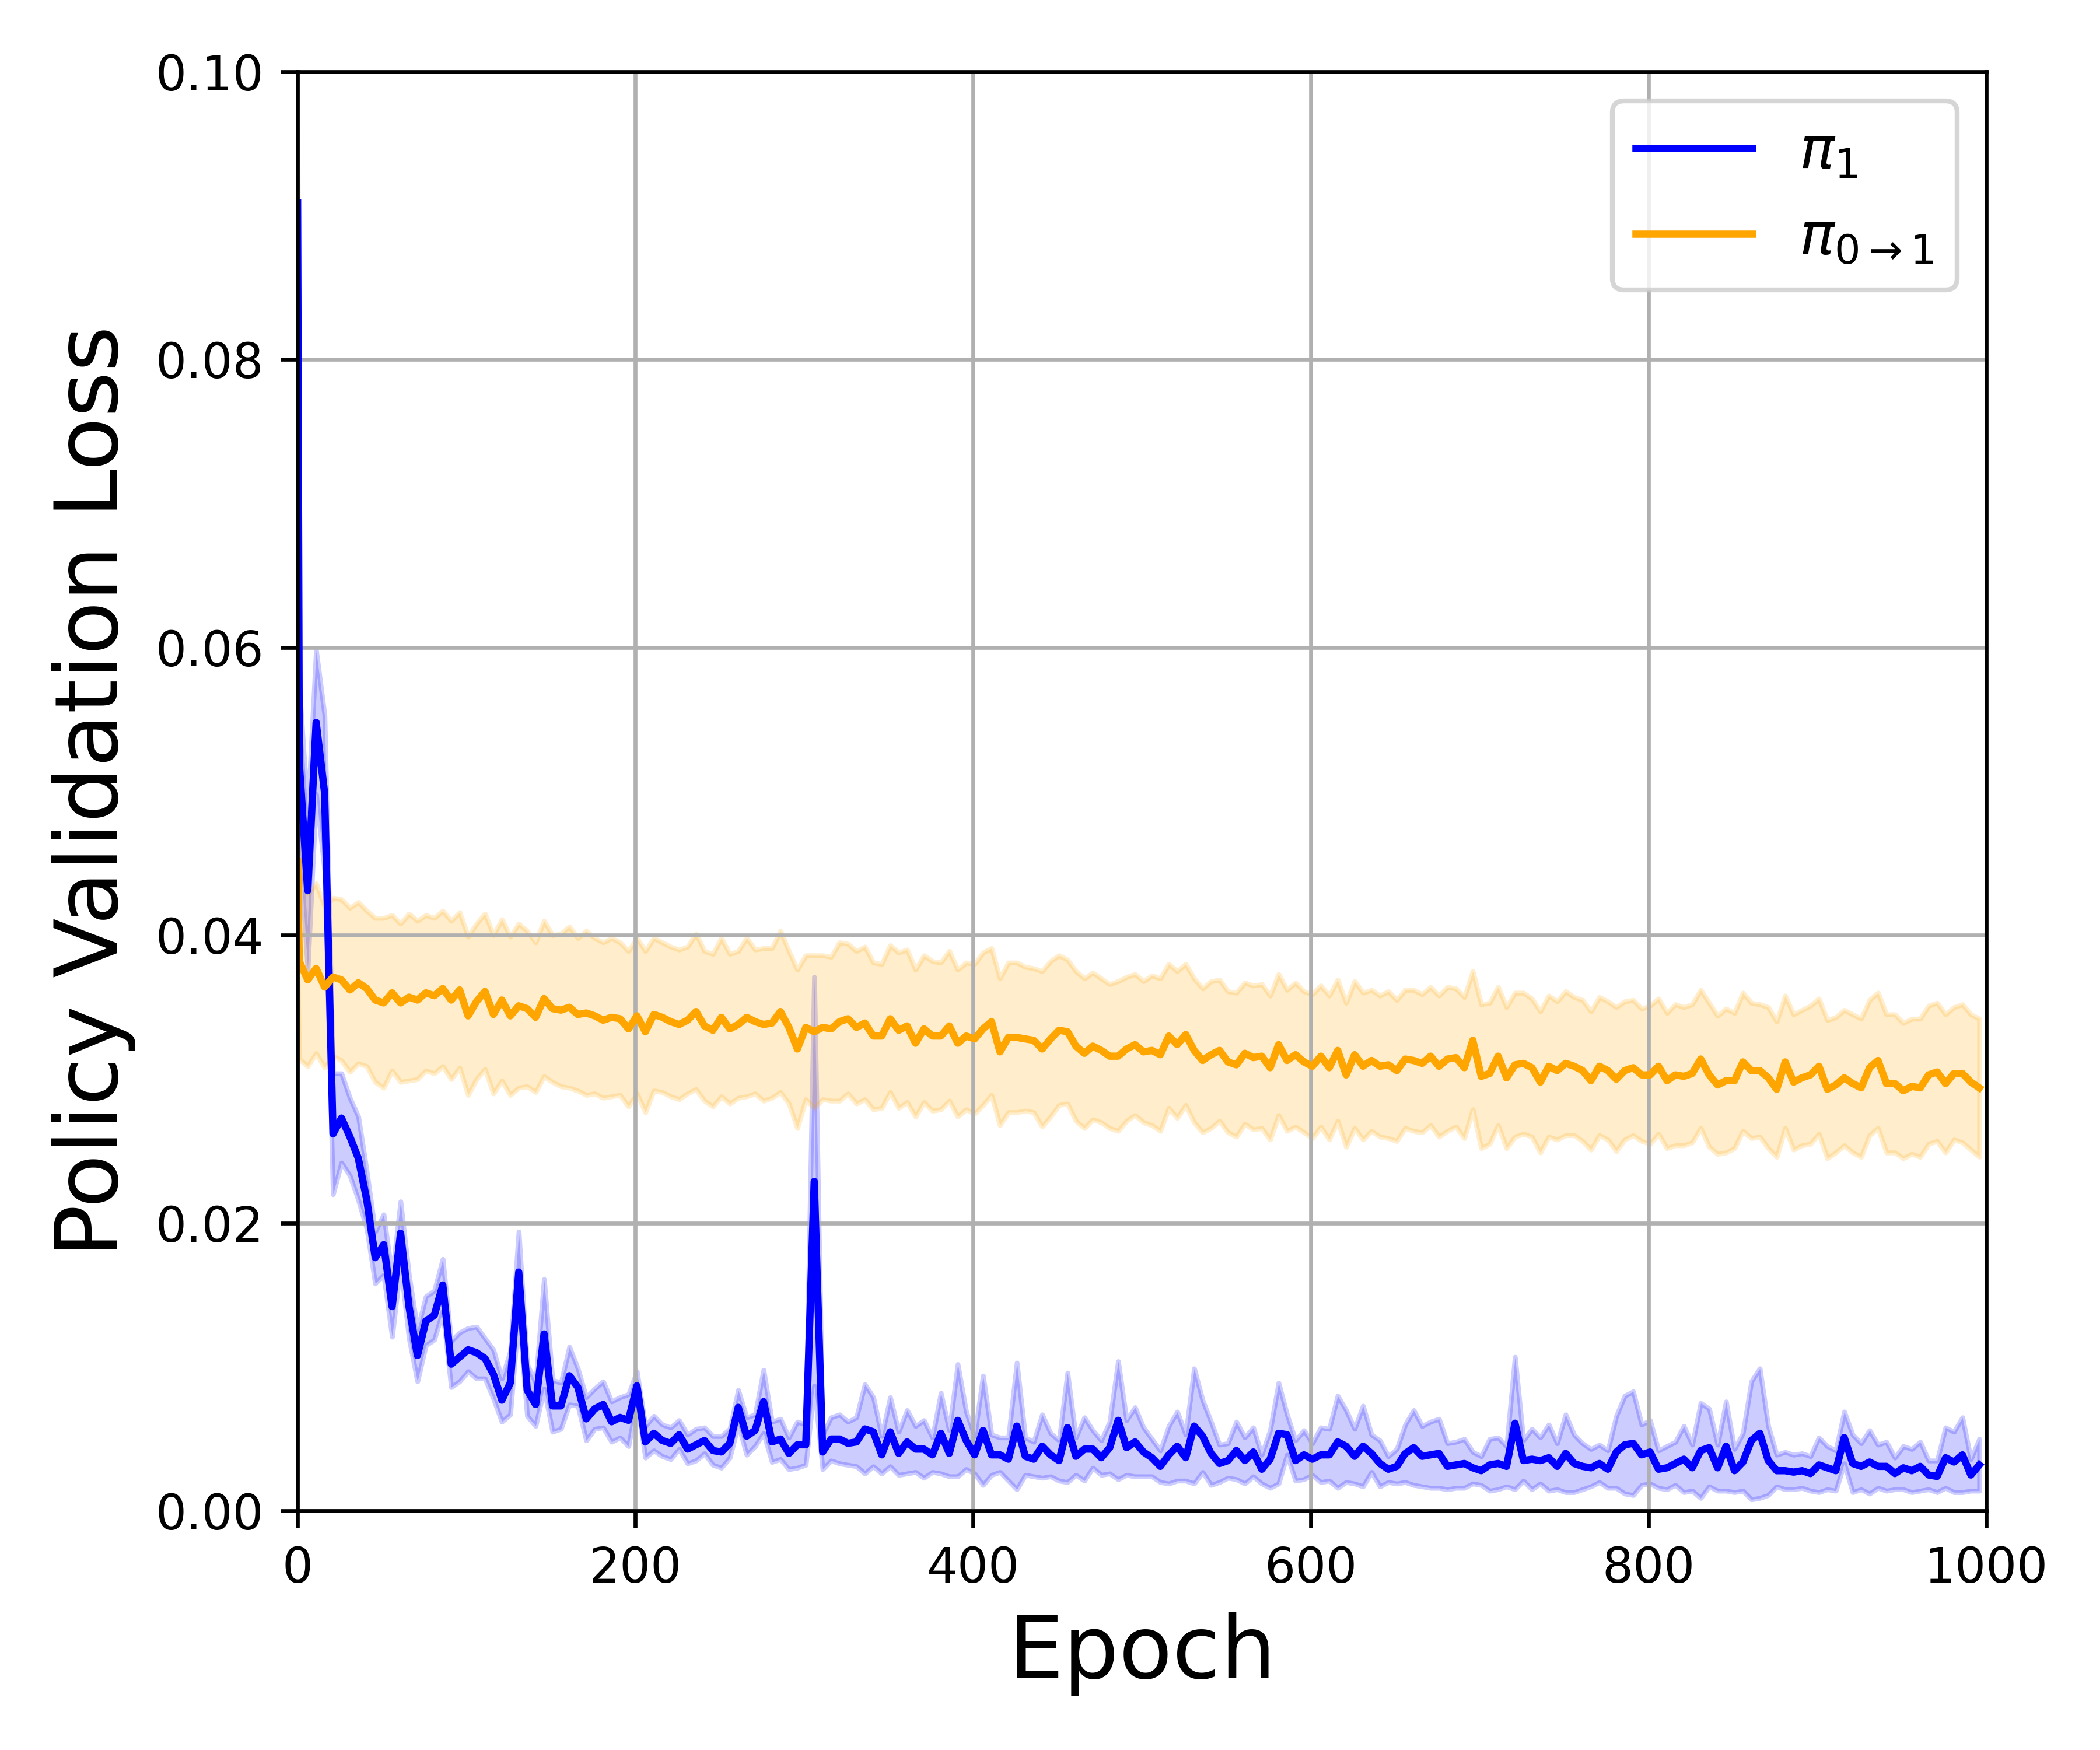
Quantitative Result. To further explore the role of visual encoders, we perform Visual Alignment Testing on four groups of tasks, as illustrated in Fig. 3. With a significance level at , the null hypothesis is consistently rejected in Nut Assembly, Pick Place and Real PnP when using both BC and DP-C as regression heads, as is summarized in Tab. IV. For the UR5 Reach task, the significant difference in validation loss between and in Fig. 4, demonstrates that the encoders are not interchangeable. Following the arguments in section III.C, these results provide quantitative evidence that, E2E-trained visual encoders play an active role in decision-making in the overall policy. Additionally, the performance gap between and as well as between E2E and OOD-pretrained models in the benchmark, indicates that this decision-making ability of visual encoders, acquired naturally in E2E training through specific task motor data supervision, positively impacts overall policy performance.
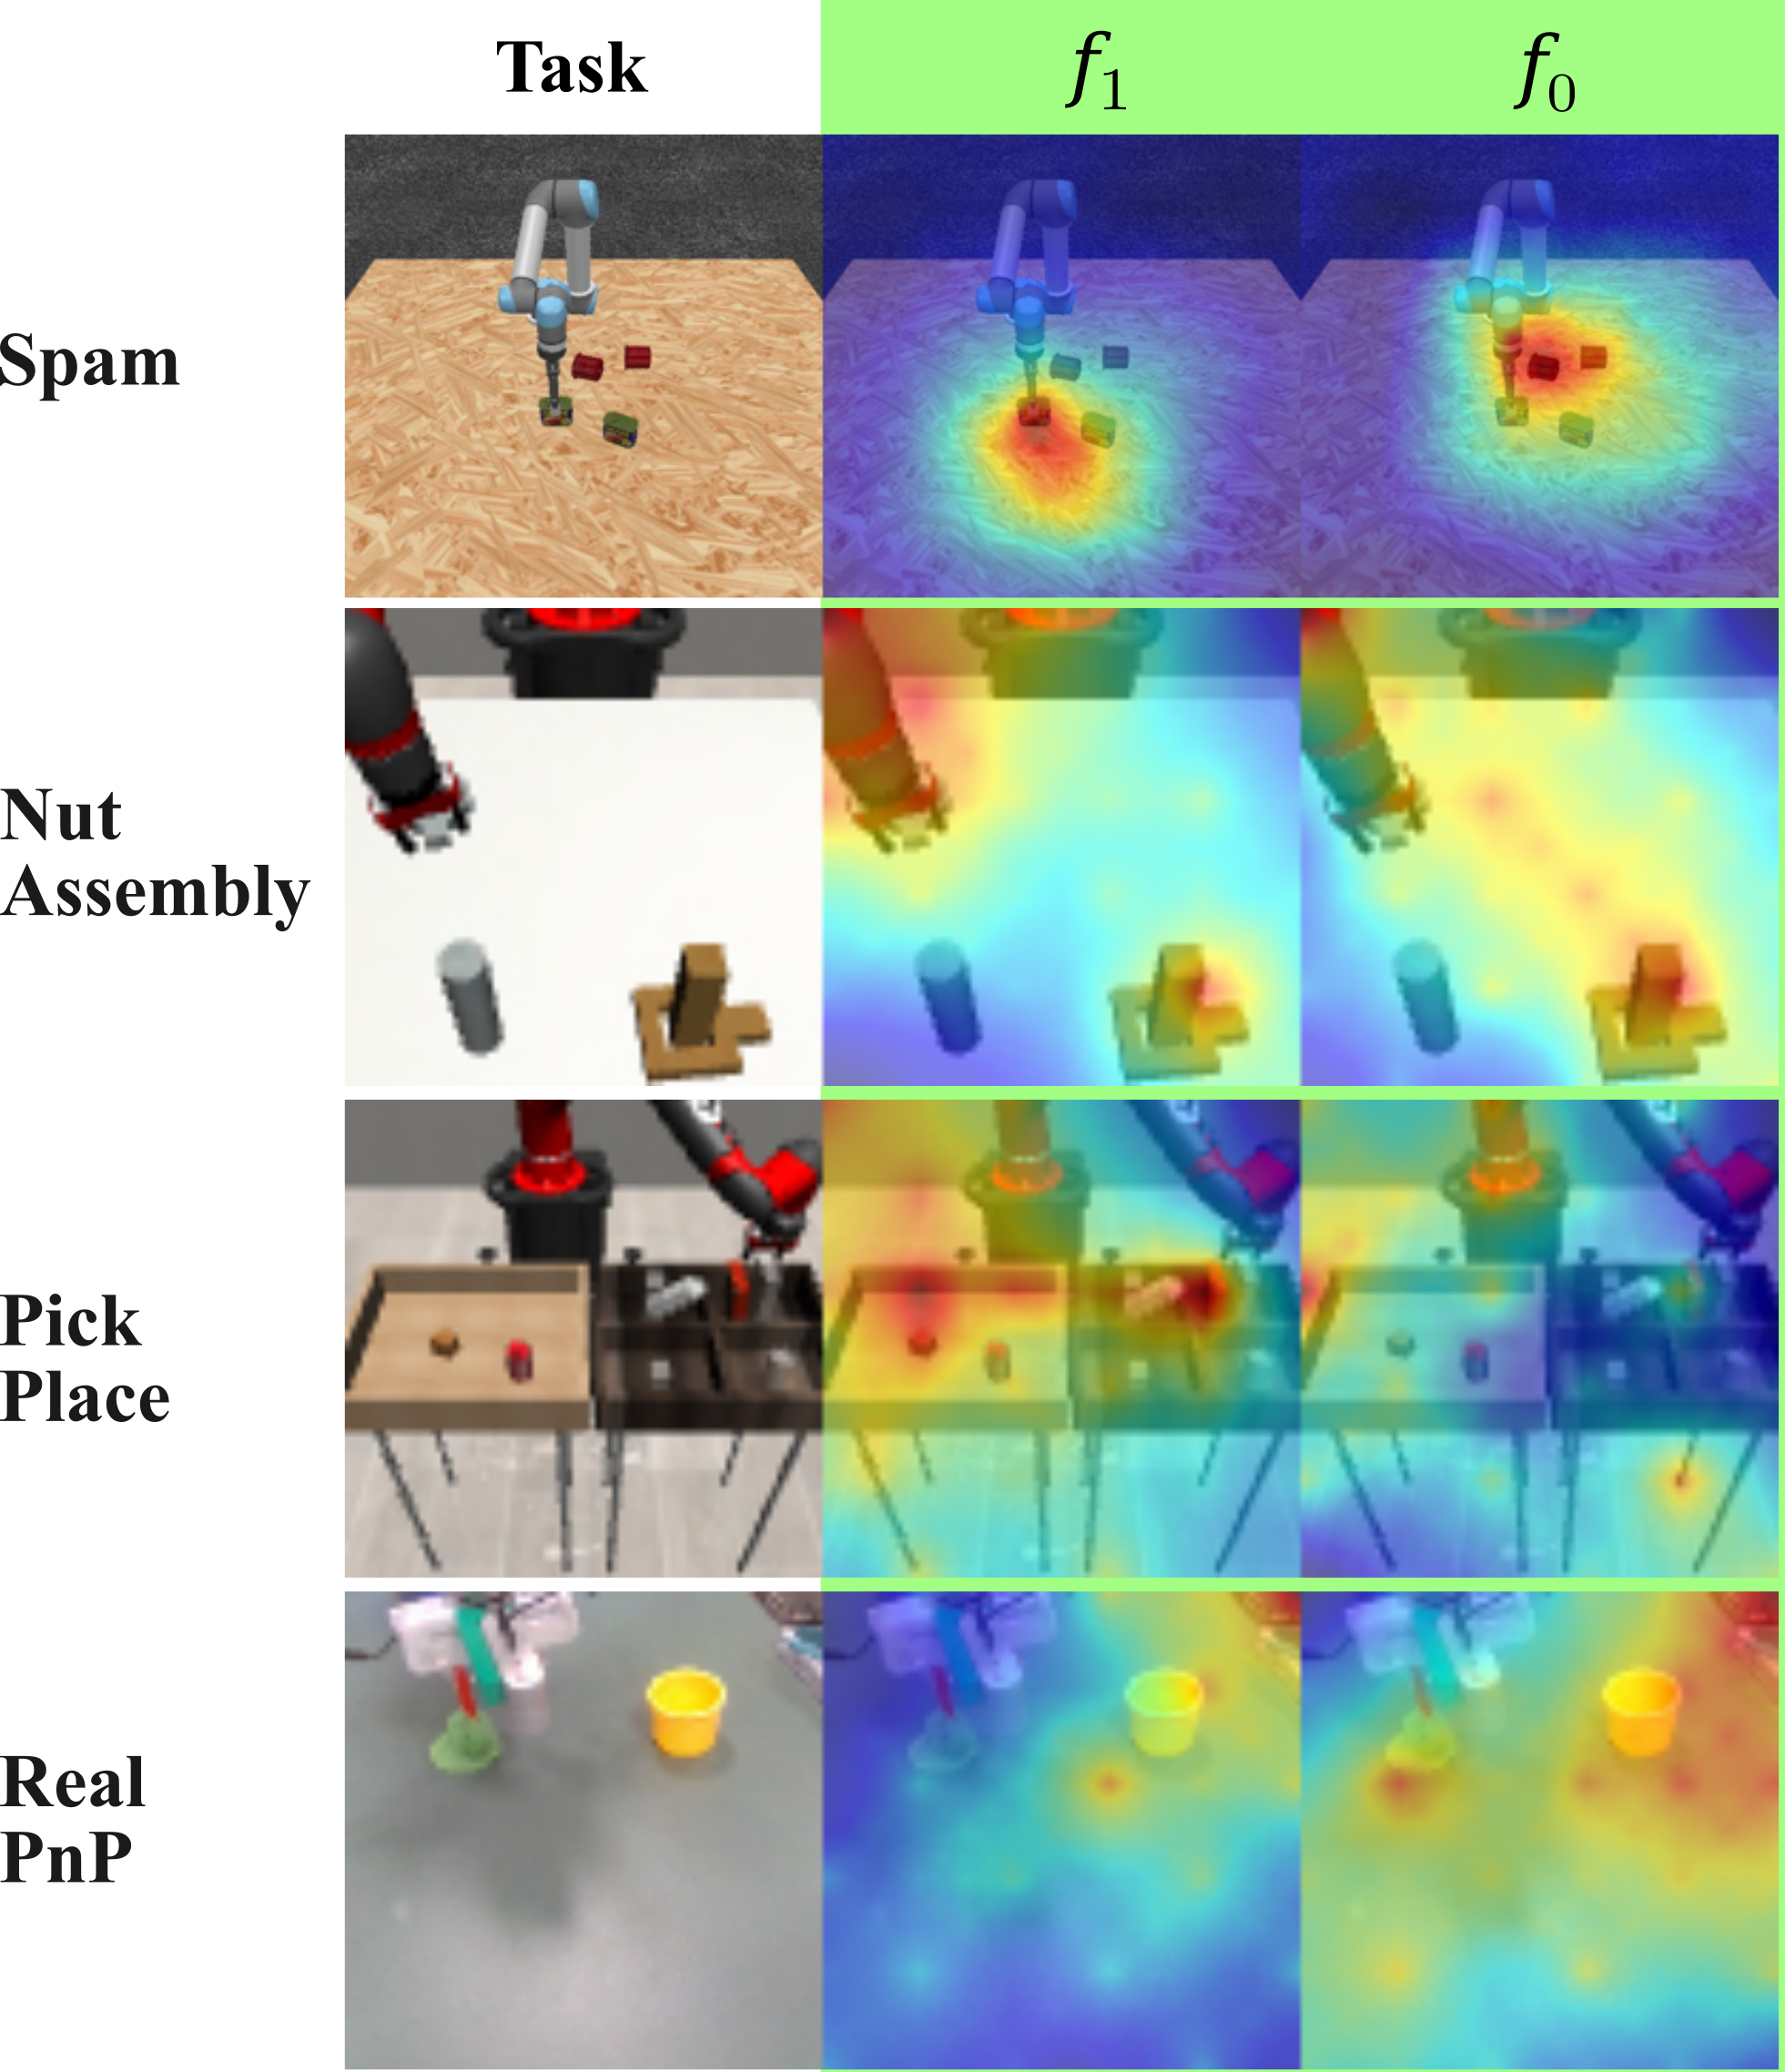
Qualitative Result. To understand how visual encoders contribute to decision-making, we present the saliency maps of encoders and trained on VAT tasks in Fig. 5. Notably, E2E-trained encoders are primarily activated by specific task-relevant areas. For example, given the same input image of Spam, E2E-trained mainly focuses on the box of spam the robot is reaching, while (trained on Mug) focuses on the mugs. Despite the identical visual content in the two task inputs, the encoders, updated by different motor data, develop preferences that reflect the task intent. Comparing the saliency maps of E2E and OOD-pretrained encoders in Fig. 5, the underperforming of pretrained encoders might come from their failure to effectively focus on task-related areas. For instance, in Square, the E2E model activates on the center of the square nut and the rod, whereas Imagenet, R3M and VIP do not give sufficient attention to the task-relevant objects.
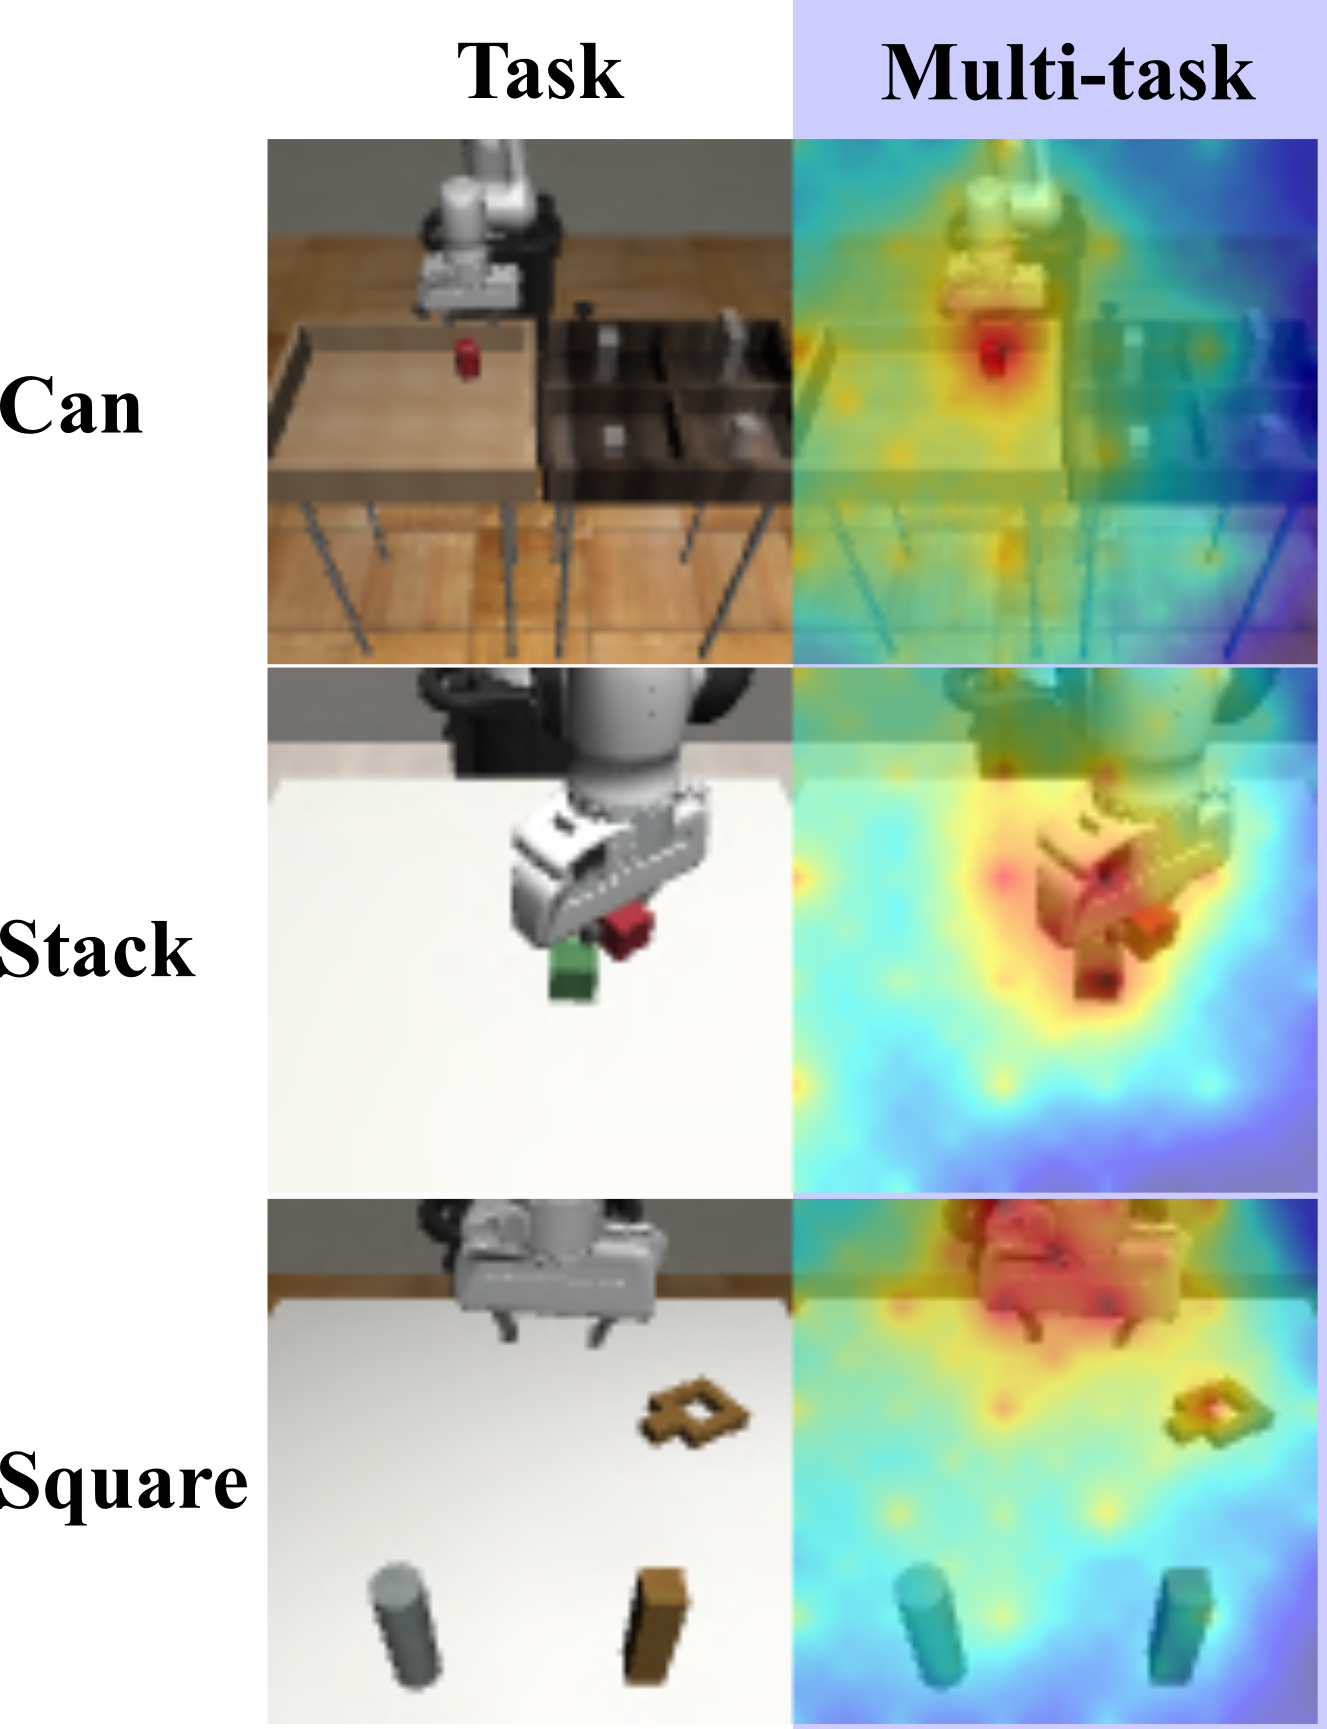
In Fig. 5, we also demonstrate that the decision-making ability of visual encoders may extend to multi-task settings, where encoders differentiate between tasks and focus on task-relevant features accordingly. Additionally, as shown in Fig. 5, ImageNet features recognize large objects in a scene, capturing most key information. This property of non-specific yet information-complete explains why ImageNet performs relatively better than other pretrained encoders.
V Conclusion and Limitation
In this paper, we identify and analyze an underexplored question arising from the introduction of OOD pretraining to visuomotor policy learning: E2E-trained visual encoders actively contribute to the decision-making process by focusing on specific task-relevant areas in the visual inputs. Both quantitative evidence derived from the proposed Visual Alignment Testing, applied in simulations and the real world, and qualitative results provided by FullGrad saliency maps support this claim. This finding provides an initial explanation for the underperformance of OOD pretrained encoders compared to E2E training, as demonstrated in our benchmarking. Our results indicate that future works may benefit from training visual encoders on manipulation datasets that span diverse task domains and incorporating task conditions and context information into the encoders.
One of the limitations of this work is that we did not consider very low data regimes addressed in some pretraining works, e.g. working with 5 demonstrations. Decreasing the training data size dramatically is likely to negatively affect the decision-making ability of E2E visual encoders. An investigation of smaller dataset sizes and the exact threshold where this impact becomes significant is however an interesting direction for future work.
References
- [1] Sergey Levine, Chelsea Finn, Trevor Darrell and Pieter Abbeel “End-to-end training of deep visuomotor policies” In Journal of Machine Learning Research (JMLR), 2016
- [2] Dmitry Kalashnikov et al. “Scalable Deep Reinforcement Learning for Vision-Based Robotic Manipulation” In Conference on Robot Learning (CoRL), 2018
- [3] Andy Zeng et al. “Transporter Networks: Rearranging the Visual World for Robotic Manipulation” In Conference on Robot Learning (CoRL), 2021
- [4] Mohit Shridhar, Lucas Manuelli and Dieter Fox “Perceiver-Actor: A Multi-Task Transformer for Robotic Manipulation” In Conference on Robot Learning (CoRL), 2023
- [5] Ajay Mandlekar et al. “What Matters in Learning from Offline Human Demonstrations for Robot Manipulation” In Conference on Robot Learning (CoRL), 2021
- [6] Ajay Mandlekar et al. “MimicGen: A Data Generation System for Scalable Robot Learning using Human Demonstrations” In Conference on Robot Learning (CoRL), 2023
- [7] Dhruv Mahajan et al. “Exploring the Limits of Weakly Supervised Pretraining” In European Conference on Computer Vision (ECCV), 2018
- [8] Ross Girshick, Jeff Donahue, Trevor Darrell and Jitendra Malik “Rich Feature Hierarchies for Accurate Object Detection and Semantic Segmentation” In Conference on Computer Vision and Pattern Recognition (CVPR), 2014
- [9] Suraj Nair et al. “R3M: A Universal Visual Representation for Robot Manipulation” In Conference on Robot Learning (CoRL), 2022
- [10] Tete Xiao, Ilija Radosavovic, Trevor Darrell and Jitendra Malik “Masked Visual Pre-training for Motor Control” In arXiv:2203.06173, 2022
- [11] Yecheng Jason Ma et al. “VIP: Towards Universal Visual Reward and Representation via Value-Implicit Pre-Training” In International Conference on Learning Representations (ICLR), 2023
- [12] Simone Parisi, Aravind Rajeswaran, Senthil Purushwalkam and Abhinav Gupta “The (Un)Surprising Effectiveness of Pre-Trained Vision Models for Control” In International Conference on Machine Learning (ICML), 2022
- [13] Ilija Radosavovic et al. “Real-World Robot Learning with Masked Visual Pre-training” In Conference on Robot Learning (CoRL), 2022
- [14] J. Deng et al. “ImageNet: A Large-Scale Hierarchical Image Database” In Conference on Computer Vision and Pattern Recognition (CVPR), 2009
- [15] Kristen Grauman et al. “Ego4D: Around the World in 3,000 Hours of Egocentric Video” In arXiv: 2110.07058, 2022
- [16] Dean A. Pomerleau “ALVINN: An Autonomous Land Vehicle in a Neural Network” In Conference on Advances in Neural Information Processing Systems (NeurIPS), 1988
- [17] Cheng Chi et al. “Diffusion Policy: Visuomotor Policy Learning via Action Diffusion” In Robotics: Science and Systems (RSS), 2023
- [18] Suraj Srinivas and François Fleuret “Full-Gradient Representation for Neural Network Visualization” In Conference on Advances in Neural Information Processing Systems (NeurIPS), 2019
- [19] Yen-Chen Lin et al. “Learning to See before Learning to Act: Visual Pre-training for Manipulation” In International Conference on Robotics and Automation (ICRA), 2020
- [20] Tsung-Yi Lin et al. “Microsoft COCO: Common Objects in Context” In European Conference on Computer Vision (ECCV), 2014
- [21] Apoorv Khandelwal, Luca Weihs, Roozbeh Mottaghi and Aniruddha Kembhavi “Simple but Effective: CLIP Embeddings for Embodied AI” In Conference on Computer Vision and Pattern Recognition (CVPR), 2022
- [22] Alec Radford et al. “Learning Transferable Visual Models From Natural Language Supervision” In International Conference on Machine Learning (ICML), 2021
- [23] Yifeng Zhu, Abhishek Joshi, Peter Stone and Yuke Zhu “VIOLA: Object-Centric Imitation Learning for Vision-Based Robot Manipulation” In Conference on Robot Learning (CoRL), 2022
- [24] Ilija Radosavovic et al. “Robot Learning with Sensorimotor Pre-training” In Conference on Robot Learning (CoRL), 2023
- [25] Yuan Yao, Nandakishor Desai and Marimuthu Swami Palaniswami “Masked Contrastive Representation Learning” In Transactions on Pattern Analysis and Machine Intelligence (TPAMI), 2022
- [26] Elliot Chane-Sane, Cordelia Schmid and Ivan Laptev “Learning Video-Conditioned Policies for Unseen Manipulation Tasks” In International Conference on Robotics and Automation (ICRA), 2023
- [27] Peng Wu et al. “Policy Pre-training for Autonomous Driving via Self-supervised Geometric Modeling” In International Conference on Learning Representations (ICLR), 2023
- [28] Kaiming He et al. “Masked Autoencoders Are Scalable Vision Learners” In Conference on Computer Vision and Pattern Recognition (CVPR), 2021
- [29] Ya Jing et al. “Exploring Visual Pre-training for Robot Manipulation: Datasets, Models and Methods” In International Conference on Intelligent Robots and Systems (IROS), 2023
- [30] Sudeep Dasari, Mohan Kumar Srirama, Unnat Jain and Abhinav Gupta “An Unbiased Look at Datasets for Visuo-Motor Pre-Training” In Conference on Robot Learning (CoRL), 2023
- [31] Li Erran Li Yingdong Hu and Yang Gao “For Pre-Trained Vision Models in Motor Control, Not All Policy Learning Methods are Created Equal” In International Conference on Machine Learning (ICML), 2023
- [32] Nicklas Hansen et al. “On Pre-Training for Visuo-Motor Control: Revisiting a Learning-from-Scratch Baseline” In International Conference on Machine Learning (ICML), 2023
- [33] Jens Kober, J Andrew Bagnell and Jan Peters “Reinforcement learning in robotics: A survey” In The International booktitle of Robotics Research (IJRR), 2013
- [34] Ahmed Hussein, Mohamed Medhat Gaber, Eyad Elyan and Chrisina Jayne “Imitation learning: A survey of learning methods” In ACM Computing Surveys (CSUR), 2017
- [35] Kaiming He, Xiangyu Zhang, Shaoqing Ren and Jian Sun “Deep Residual Learning for Image Recognition” In Conference on Computer Vision and Pattern Recognition (CVPR), 2016
- [36] Pete Florence et al. “Implicit Behavioral Cloning” In Conference on Robot Learning (CoRL), 2021
- [37] Yuxin Wu and Kaiming He “Group Normalization” In European Conference on Computer Vision (ECCV), 2018
- [38] Michael C Welle et al. “Quest2ROS: An App to Facilitate Teleoperating Robots” In International Workshop on Virtual, Augmented, and Mixed-Reality for Human-Robot Interactions, 2024
- [39] Diederik P. Kingma and Jimmy Ba “Adam: A Method for Stochastic Optimization” In International Conference on Learning Representations (ICLR), 2015