Investigating Creation Perspectives and Icon Placement Preferences for On-Body Menus in Virtual Reality
Abstract.
On-body menus present a novel interaction paradigm within Virtual Reality (VR) environments by embedding virtual interfaces directly onto the user’s body. Unlike traditional screen-based interfaces, on-body menus enable users to interact with virtual options or icons visually attached to their physical form. In this paper, We investigated the impact of the creation process on the effectiveness of on-body menus, comparing first-person, third-person, and mirror perspectives. Our first study ( = 12) revealed that the mirror perspective led to faster creation times and more accurate recall compared to the other two perspectives. To further explore user preferences, we conducted a second study ( = 18) utilizing a VR system with integrated body tracking. By combining distributions of icons from both studies ( = 30), we confirmed significant preferences in on-body menu placement based on icon category (e.g., Social Media icons were consistently placed on forearms). We also discovered associations between categories, such as Leisure and Social Media icons frequently co-occurring. Our findings highlight the importance of the creation process, uncover user preferences for on-body menu organization, and provide insights to guide the development of intuitive and effective on-body interactions within virtual environments.
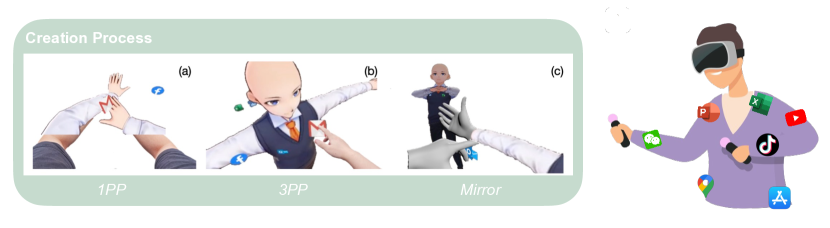
This teaser figure shows participants customizing their on-body menu creation process in virtual reality (VR) using three different perspectives: (a) first-person perspective (1PP), where the user views their virtual arms directly in front of them; (b) third-person perspective (3PP) displaying an over-the-shoulder view of the user interacting with the menu on a virtual avatar; and (c) mirror perspective presenting the user’s avatar and menu in a mirror-like reflection. The right side of the image depicts a person using VR controllers and wearing a VR headset, surrounded by various app icons.
1. Introduction
Within the human-computer interaction (HCI) community, there is a strong interest in exploring how the human body drives the development of interactive technologies (Harrison et al., 2012; Harrison and Faste, 2014; Harrison et al., 2010; Patibanda et al., 2023a, b; Darbar et al., 2024). The user’s body can provide a unified interface for users to directly access the information flow during interaction or entertainment, from interacting with digital media to “experiencing our bodies as digital play” (Mueller et al., 2018, 2021). For example, Microsoft Xbox’s Kinect111https://en.wikipedia.org/wiki/Kinect as a body motion monitoring accessory makes body-based gaming possible, while wearable trackers support on-body gaming competitions.
These advantages of on-body interaction techniques present an alternative approach to designing interaction mechanisms in virtual reality (VR) and augmented reality (AR) (Bergström and Hornbæk, 2019; Darbar et al., 2024), which involves using the user’s body as a location (referred to as a bodily landmark (Weigel et al., 2017)) for placing menu items (referred to as on-body or body-referenced menus (Lediaeva and LaViola, 2020)). Users can leverage their embodied awareness to perceive and obtain information by intuitively interacting with their bodies in virtual environments. For instance, when wearing a VR headset, a user can extend their hand to select a menu item positioned on their forearm. This interaction is enabled by the user’s innate awareness of their body’s location in space and their ability to engage with the virtual environment using their body. Azai et al. (Azai et al., 2018b), for example, leveraged this to build a menu system appearing on various body parts, such as hands, arms, legs, and abdomen. Devising effective on-body menus, however, is a complex task, as it entails addressing numerous design challenges (Lediaeva and LaViola, 2020), including the potential impact of different perspectives on user experience when creating on-body menus.
In this paper, we investigated the impact of the creation process on the practical application of on-body menus in VR. Prior studies have demonstrated that the perspective employed during information encoding influences recall accuracy (Olszewska and Ulatowska, 2013). There are still significant gaps in understanding how the design of on-body menus influences user performance and memory in VR environments. The impact of these design considerations on user experience and memory retention remains unclear. Additionally, the perception of avatars in VR plays a crucial role in shaping how individuals experience and remember virtual environments. Specifically, the avatar’s perspective can influence the sense of presence and spatial awareness, which may, in turn, affect memory accuracy and recall. Therefore, it is essential to explore both the creation of on-body menus and the effects of avatar perspective on representation and memory in VR to better inform the design of effective interfaces.
In this paper, we first provided three different approaches to users to build the on-body menus in VR: i.e., (1) the First Person Perspective (1PP), (2) the Third Person Perspective (3PP), and (3) the Mirror Perspective (see Figure 1). Then, we conducted a within-subjects user study ( = 12) comparing these three creation processes in terms of user experience (e.g., presence, enjoyment, and mental and physical load) and performance (e.g., precision and memorability). We compared these processes in VR in Creation and Recall tasks, where users were asked to first create a connection between 15 virtual icons and their bodies, and then recall the icons and their locations on the body after a short interval in the Recall task.
Our first study aimed to contribute to the understanding of the impact of the creation process on the practical application of on-body menus in VR and to provide guidance for designers and developers of VR applications. We found that the Mirror perspective had a faster creation time compared to 3PP, suggesting that a mixed perspective combining both viewpoints facilitated faster and more comprehensive menu creation, particularly when using a third-person perspective avatar. Both 3PP and Mirror perspectives exhibited faster recall times compared to 1PP, indicating that seeing the avatar or mirror reflection boosted users’ confidence in recalling menu placement. 1PP resulted in a greater sense of involvement in the VR environment, as dragging icons directly onto the user’s body enhanced the feeling of engagement and embodiment.
We also discovered that users tended to organize the placement of icons in on-body menus based on their category. To assess the generalizability of these initial findings, we conducted our second study ( = 18) utilizing the latest VR equipment, Meta Quest 3, which offers an integrated body movement detection system without external sensors and higher accuracy with lighter weight. Following the same protocol as our first user study for the Creation Task, we required participants to place 15 icons from five categories using the three creation methods. We combined the collected distributions from both studies ( = 30), which confirmed significant preferences in on-body menu distribution based on icon category. Specifically, social media icons were consistently placed on forearms, while productivity icons favored upper-body placement. We also found a significant association relationship between the Leisure and Social Media icon categories, as well as between Productivity and Social Media icons.
Finally, we conducted comprehensive discussions on the bodily preferences associated with creating on-body menus in VR and synthesized design strategies. We believe these strategies can serve as valuable guidance for the development of effective on-body menus in VR environments, drawing from our research findings and insights. In summary, our contributions encompass:
-
•
Development of an integrated on-body menu creation system devoid of external detection sensors or cameras, which can be easily replicated across the latest VR devices.
-
•
Investigation into the performance of various perspective-based creation processes for on-body menus in VR with two studies ( = 12 and = 18).
-
•
Exploration of user preferences ( = 30) regarding bodily landmarks within different application categories and analysis of the significance of their distribution.
2. Related Work
In this section, we examine research on on-body interactions in virtual environments. Additionally, we review the previous literature on graphical menu designs in virtual environments, including techniques for menu design and placement, as well as menu shape and format. Finally, we summarize the impact of perspective on memory and performance during interactions.
2.1. Body-centric Interactions in VR
On-body interaction techniques, which utilize the human body as an input/output platform, have been explored in various studies to enhance the immersion and naturalness of interactions in VR environments (Harrison et al., 2012; Bergström and Hornbæk, 2019; Coyle et al., 2012) and provide more accurate eyes-free targeting (Weigel et al., 2017; Gustafson et al., 2010). Several studies have examined using different body parts, such as the arms, palms, and skin, as input surfaces for VR interactions (Chatain et al., 2020; Dezfuli et al., 2014; Mistry et al., 2009). Skinput (Harrison et al., 2010) and Touché (Sato et al., 2012), for instance, explore using the body as an input surface by sensing acoustic and capacitive signals to recognize gestures on the skin. Meanwhile, Armstrong (Li et al., 2021a) examines the effectiveness of using non-dominant arm-anchored user interfaces (UIs) for pointing tasks in VR.
Other studies have investigated the use of body-centric mid-air input surfaces (Wagner et al., 2013), such as Hand Range Interface (Xu et al., 2018), Swarm Manipulation (Li et al., 2023), BodyLoci (Fruchard et al., 2018) and BodyOn (Yu et al., 2022), to leverage bodily interfaces to achieve more effective mid-air interactions. Additionally, there have been works on exploring the use of on-body menus, such as Tap-tap (Azai et al., 2018b) menu and PalmGesture (Wang et al., 2015), and the role of visual and tactile cues in browsing them. These studies show the potential of on-body interaction in creating more intuitive and immersive VR experiences.
There is a gap, however, in understanding how these on-body interaction techniques influence the users’ memory performance in VR. Therefore, one of our main motivations is to investigate how the design and implementation of on-body menus impact user memory performance and retention in VR environments.
2.2. Graphical Menus in VR
Graphical menus are a common user interface element in digital environments, including VR. In VR, graphical menus can be presented in various forms (Bowman and Wingrave, 2001), such as floating menus (Azai et al., 2018b), hand-held menus (Azai et al., 2018a), or on-body menus (Gerber and Bechmann, 2005). The design of graphical menus in VR needs to consider several factors, such as user comfort, ease of use, and visibility (Santos et al., 2017). Therefore, one common design strategy for graphical menus in VR is to place them in the user’s field of view, usually at a distance and angle that minimizes visual strain and maximizes accessibility (Bowman et al., 2001). For example, Gebhardt et al. place graphical menus at a fixed position relative to the user’s headset, while others use dynamic menus that adapt to the user’s gaze direction or hand movements (Gebhardt et al., 2013). Another design consideration for graphical menus is the layout and organization of menu items (Lindlbauer et al., 2019). Studies have shown that grouping menu items based on their functional category or relevance can improve user efficiency and satisfaction (Dachselt and Hübner, 2007). Moreover, providing visual feedback when selecting menu items can help users perceive the selection process and reduce errors (Xu et al., 2020).
However, the correlation between the specific design considerations of graphical menus and user performance remains underexplored. Our research is therefore motivated by the need to investigate how the design of graphical menus in VR impacts user performance and whether certain designs facilitate better performance.
2.3. Perspectives and Memory
The way in which an avatar is perceived within a virtual environment can have a significant impact on how people experience and remember that environment. Firstly, the avatar perspective can influence the sense of presence, or the feeling of “being there,” within the virtual environment (Sanchez-Vives and Slater, 2005) and levels of immersion (Monteiro et al., 2018b) and engagement (Monteiro et al., 2018a). Research has found that first-person perspectives generally lead to a higher sense of presence than third-person perspectives (Denisova and Cairns, 2015; Kallinen et al., 2007). However, this can depend on whether participants are allowed to choose their avatars. In a study by Lim and Reeves (Lim and Reeves, 2009), participants who were allowed to choose their avatars reported a higher sense of presence in third-person perspectives than in first-person perspectives. This could be due to the increased sense of ownership that is experienced when the avatar becomes a proxy for the participant in the virtual environment. A stronger sense of presence during encoding can lead to greater memory accuracy (Krokos et al., 2019; Makowski et al., 2017). Secondly, the avatar perspective can affect spatial awareness in virtual environments (Gorisse et al., 2017; Medeiros et al., 2018). Third-person perspectives have been found to lead to faster response times and improved spatial awareness of information in the periphery of the scene (Gorisse et al., 2017). This could influence the types of details that people later recall, by increasing memory for peripheral information and/or the spatial layout of the overall scene (Bonnail et al., 2023).
Despite these insights, more research is needed to understand how the perspective of the avatar affects users’ memory in VR. This gap in the literature motivates our research to explore the impact of the avatar perspective on memory performance and how it shapes users’ recall of the virtual environment.
3. On-body Menus in VR
3.1. Design On-body Menus in VR
Similar to the Dock222https://en.wikipedia.org/wiki/Dock_(macOS) provided by MacOS, we first envision an interaction scenario where a graphic functional interface is used in VR to quickly launch applications and to switch between running applications. Our on-body menu creation system comprises three components: a VR headset, a sensor for whole-body motion detection, such as cameras (Li et al., 2021b) or IMUs (Mollyn et al., 2023), and a VR interface, and the system should exchange signals between the devices to facilitate user interaction (see Figure 2).
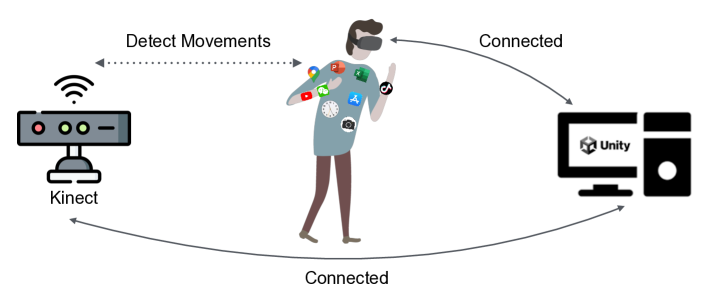
Diagram of a system showing the interaction between a Kinect device, a VR headset, and a computer running Unity. A person wearing a VR headset is depicted in the center, surrounded by icons representing various applications. The Kinect device is shown on the left with a dotted arrow labeled “Detect Movement” pointing towards the person. Two curved arrows labeled “Connected” indicate the bidirectional connections between the person and the computer running Unity on the right. The diagram illustrates how the Kinect detects the user’s movements, which are then processed by the computer to facilitate interaction in the VR environment.
3.2. Creation Processes
As we mentioned in Section 2, the creation of differing perspectives in VR could have a profound impact on cognitive understanding. This involves constructing mental representations of information to facilitate later recall (Peeters and Segundo-Ortin, 2019; Lim and Reeves, 2009). Particularly, this process of information linkage is crucial when creating on-body menus in VR. Users need to establish meaningful associations between virtual icons and their corresponding locations on the body. Therefore, when designing on-body menus in VR, it is vital to consider these factors in order to optimize the creation process and enhance the recall of memory. Hence, our motivation extends to exploring how the design and implementation of on-body menus, combined with different perspectives, can impact the users’ cognitive understanding and memory recall in a VR environment. Thus, we provide three different creation processes to establish the on-body menus in VR: (1) 1PP, (2) 3PP, and (3) the Mirror.
3.2.1. First-Person Perspective (1PP)
The first-person perspective technique allows the user to see a first-person avatar in the VR environment and interact with virtual icons placed directly in front of them. Users can manipulate these icons directly, for example, by dragging an icon to a specific body landmark to establish a connection (see Figure 1 (a)). This technique takes advantage of the user’s proprioceptive sense, which is the ability to perceive the position and movement of one’s body parts without relying mainly on visual feedback. This technique could also provide a more immersive experience as the user can directly see and manipulate the virtual icons with their hands, similar to real-world interactions. However, the disadvantage of this technique is that the user’s arms and hands may obstruct their view of the virtual environment, which can decrease spatial awareness and increase mental workload. Additionally, the user may experience discomfort or fatigue due to prolonged arm movements during the creation process.
3.2.2. Third-Person Perspective (3PP)
The third-person perspective technique allows users to see their T-pose avatars in the VR environment with virtual icons attached to their bodies. Users can use their controllers or hands to establish connections between the virtual icons and landmarks on the 3PP avatar, similar to the 1PP technique (see Figure 1 (b)). The advantage of this technique is that users can have a better overall view of the virtual environment and spatial awareness since their arms and hands do not obstruct their view. However, this technique may require more mental workload and lead to split attention effects (Sweller et al., 2011), as users must establish connections between the virtual icons and the landmarks on the avatar while relying on the visual feedback of the avatar and the spatial relationship of the virtual icons. Moreover, users may not feel as immersed in the virtual environment as in the 1PP technique due to the lack of direct hands-on interaction with virtual icons.
3.2.3. Mirror Perspective
In the Mirror perspective technique, users see a first-person avatar in the VR environment and can manipulate virtual icons directly in front of them, as in the 1PP technique. However, a virtual mirror is also present in the environment, which allows users to see their entire body and the location of the virtual icons on it from a third-person perspective (see Figure 1 (c)). This technique takes advantage of both the proprioceptive sense and the visual feedback provided by the mirror to improve spatial awareness and understanding of the on-body menu layout (Li et al., 2021c). The mirror can also help to reduce the user’s cognitive load by providing an external representation of their body and the virtual icons attached to it. However, the use of the mirror may also increase the user’s mental workload, as they have to constantly switch between first-person and third-person perspectives to establish connections between virtual icons and body landmarks. Additionally, the presence of the mirror perspective may cause visual distractions, reducing the sense of immersion in VR.
4. User Study 1: Evaluate Three Creation Processes of Creating On-body Menus in VR
First, we carried out a user study to explore the three on-body creation processes in VR in terms of performance (i.e., precision, and memorability) and user experience. The study employed a within-subjects experimental design with one independent variable, the Creation Process, consisting of three techniques: 1PP, 3PP, and Mirror. To mitigate any learning effects, the Creation Process order for participants was counterbalanced using a Latin square approach. The experiment spanned 3 days per condition, with each participant dedicating 20 to 30 minutes daily to both Creation and Recall Tasks, consistent with Bergstrom et al. (Bergstrom-Lehtovirta et al., 2017). The objective of User Study 1 is to address RQ1: How do different perspective-based creation processes impact user experience and usability?
4.1. Procedure
Before the experiment, participants were asked to complete the demographic form. After each test, participants completed a questionnaire to collect feedback about their experience and other subjective data. Besides, we added the final comparison and asked participants to rate their preference on a 7-point Likert scale and summarize their strategies and suggestions via a semi-structured interview.
In the Creation Task, participants first received a tutorial and demo video to familiarize themselves with the on-body mapping techniques assigned to them. Afterwards, they wore the VR headset and underwent a 15-minute tutorial and training session for the creation process. Once participants confirmed their familiarity with the techniques, they proceeded to the formal Creation Task. During this process, participants were instructed to create an on-body menu using the assigned creation process. They were asked to connect 15 virtual icons to their body landmarks, and the order of icon presentation was random. To better understand the post-creation distribution, we categorized the icons into five groups, and all participants were familiar with those applications’ icons (see Table 1). After creating their on-body menus, they were given 1 minute to preview the distribution of icons on their bodies, i.e., the post-creation on-body menu. Participants then filled out questionnaires and took a 5-minute break before moving on to the Recall Task.
| Category | Icons |
| Social Media | Weibo, WeChat, QQ |
| Productivity | Excel, Word, PowerPoint |
| Leisure | BiliBili, YouTube, TikTok |
| Utilities | Camera, AppStore, Clock |
| Other | Google Maps, Ele.me, Uber |
| \DescriptionTable titled “Categories of Icons” and the table contains two columns: Category and Icons. The categories are Social Media, Productivity, Leisure, Utilities, and Other. Under Social Media, the icons listed are Weibo, WeChat, and QQ. Under Productivity, the icons listed are Excel, Word, and PowerPoint. Under Leisure, the icons listed are BiliBili, YouTube, and TikTok. Under Utilities, the icons listed are Camera, AppStore, and Clock. Under Other, the icons listed are Google Maps, Ele.me, and Uber. |
In the Recall Task, participants were also given a tutorial and demo video to read and watch before starting the recall test. A panel appeared in front of them and provided icons randomly, and participants were asked to recall the corresponding position they had created earlier and tap the corresponding body landmark as accurately as possible and within a reasonable time.
4.2. Participants and Apparatus
A total of 12 participants (8 females and 4 males) were recruited from a local university. The age range of the participants was between 19 and 30 years (). Ten participants are students, and two are research scientists or faculty members of this university. All participants reported previous experience with VR, with familiarity ratings ranging from 2 to 7 on a 7-point Likert scale, where 1 means no experience in VR and 7 means an expert ().
This system was built with Unity 2019.3.18f, and we used the Kinect to detect users’ bodily movements. The Oculus Rift S VR headset was chosen for the study due to its capability to provide real-time detection from the Kinect and its compatibility with our system. Data collection was done using a PC with Windows 10 operating system, which was also connected to the Rift S.
4.3. Measures
We used several measures to evaluate the effectiveness and usability of the three creation processes in the Creation Task. Our dependent variables included Presence, which was measured with the Igroup Presence Questionnaire (IPQ) (Schubert et al., 2001); Enjoyment, which was measured with a single 7-point Likert scale; Perceived Mental load and Physical Demands, which were measured with the unranked NASA-TLX (Hart, 2006); and Confidence in Memorability, which was measured with a single 7-point Likert scale. We also collected their Time Cost as the time taken to create the on-body menu and Post-creation Distribution, which was automatically saved after the users confirmed at the end of the creation process.
We also used several measures to evaluate users’ memorability of the on-body menus created in the Recall Task. Dependent variables included Error Distance (or Error Magnitude (Zhai et al., 1994)), measured as Euclidean summation, where we calculate the distance from the centre of the circle where the user placed the icon in the Creation Task to the position where the user tried to tap in the Recall Task, and Recall Time. Participants were also asked to complete the unranked NASA-TLX (Hart, 2006) questionnaire to measure Mental and Physical Demands and Performance.
4.4. Results: Creation Task
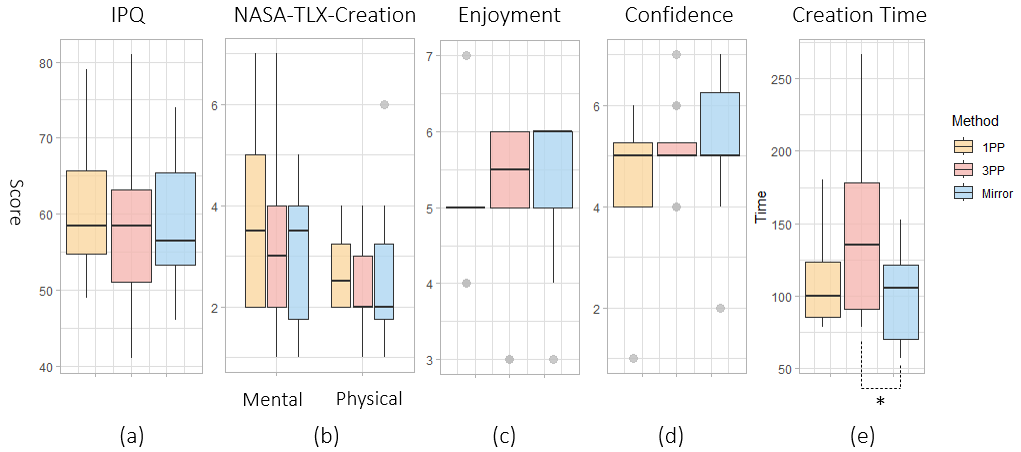
Five boxplots comparing the results of three techniques (1PP, 3PP, and Mirror) for various measures during the Creation Task. The measures are IPQ, NASA-TLX (Mental and Physical Demands), Enjoyment, Confidence in Memorability, and Creation Time. Each measure is represented by a separate boxplot labeled (a) through (e).
4.4.1. Presence
A one-way repeated measures ANOVA was utilized to assess the impact of Techniques (1PP, 3PP, and Mirror) on presence scores, as determined by the IPQ. The analysis did not yield a significant effect of the techniques on presence scores (, ).
Beyond the overall Presence scores, the INV (Involvement) subscale of the IPQ was analyzed to assess cognitive and emotional engagement among participants. The analysis showed a significant effect within this subscale, with the INV score for 1PP (, ) being significantly higher compared to 3PP (, , ). No significant difference was found between the INV scores for 1PP and Mirror (, , ).
4.4.2. Mental and Physical Demands
The ANOVA indicated no statistically significant differences in self-reported mental demands across the techniques (, , generalized ). Similarly, no significant differences were found in the Physical Demands subscale (, , generalized ).
4.4.3. Enjoyment
A statistical analysis was performed to evaluate the participants’ reported levels of enjoyment following the completion of the sessions involving all three techniques. The results from a one-way ANOVA revealed no statistically significant differences in enjoyment across the techniques (, , generalized ).
4.4.4. Confidence in Memorability
The analysis did not reveal a statistically significant difference in participants’ confidence regarding the memorability associated with the three techniques (, , generalized ).
4.4.5. Time Cost
The analysis of variance revealed a statistically significant difference in time cost among the techniques (, , generalized ). Subsequent pairwise comparisons, adjusted by Bonferroni correction, indicated that the time cost for 3PP (, ) was significantly higher than for Mirror (, , ). No significant difference in time cost was observed between 1PP and Mirror techniques () or between 1PP and 3PP ().
4.5. Results: Recall Task
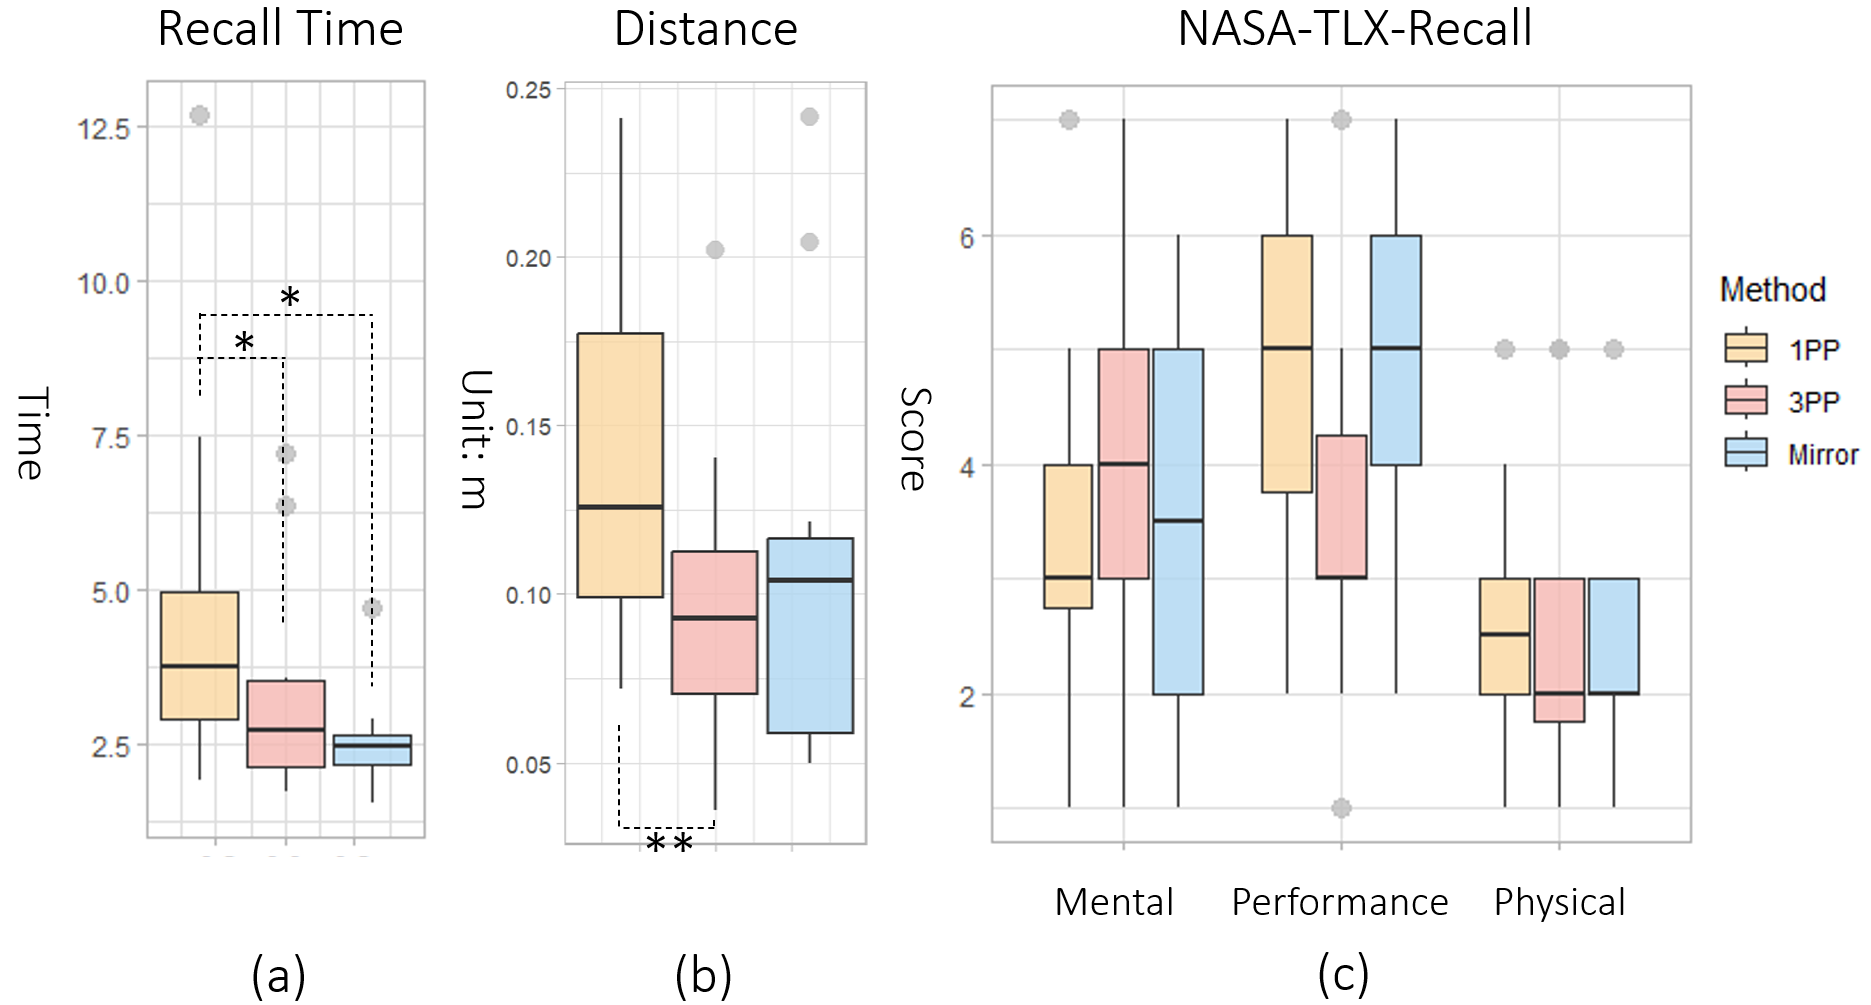
Three boxplots comparing the results of three techniques (1PP, 3PP, and Mirror) for various measures during the Recall task. The measures are Recall Time, Error Distance, and NASA-TLX (Mental and Physical Demands and Performance). Each measure is represented by a separate boxplot labeled (a) through (c).
4.5.1. Recall Time
A one-way repeated measures ANOVA was conducted to assess the impact of three distinct Techniques on participants’ Recall Time. Mauchly’s test confirmed the assumption of sphericity (, ), so no corrections were necessary. The results indicated a significant main effect of Techniques on recall time (, ). Post-hoc analyses with Bonferroni correction showed that recall times were significantly longer for 1PP (, ) compared to 3PP (, , ) and Mirror (, , ). No significant difference was found between 3PP and Mirror ().
4.5.2. Mental and Physical Demands & Performance
A one-way repeated measures ANOVA was employed for analysis. The Mental Demand subscale scores did not show significant differences across techniques (, ). In the Physical Demand subscale, no significant differences were detected across the techniques (, ) following the Greenhouse-Geisser correction. Regarding the Performance subscale, the ANOVA yielded non-significant results (, ).
4.5.3. Final Preference
In terms of final preference, most participants ( = 9) ranked Mirror as the best technique for memorizing icon distribution. They found that Mirror provided a direct and intuitive way to visualize the relative positions of icons on the body. This creation process allowed users to see the exact location of icons on their body and make adjustments in real-time, which facilitated memorization. P4 noted, “Mirror allows for a clearer view of the icons’ relative positions on the body. In 1PP, it is challenging to see the entire icon layout on the body due to the viewing angle, and 3PP lacks the simplicity and intuitiveness of looking directly in the mirror.”
Some participants ( = 4) found 3PP beneficial as it offered a better viewing angle and enabled the manipulation and rotation of the avatar model, aiding in memory formation. However, P10 noted that 3PP was more complicated and challenging to use compared to the other two techniques, as it was hard to map the positions of the icons on the avatar to their own body. “3PP allows users to see all placement positions directly, making it the best. However, it is difficult to find the correspondence between 3PP and one’s own body.”
Meanwhile, 1PP was often ranked as the worst technique by participants ( = 7). The main challenge with 1PP was the difficulty in accurately placing icons on the body due to the limited field of view. In VR, users could not directly see the placement of icons, leading to potential inaccuracies. While some participants mentioned that the physical feedback from the body could assist with memorization, the lack of visual references hindered the process. P1 suggested, “Consider taking into account the height and body shape of the test participants.” This highlights the importance of avatar diversity in embodiment research, as varying avatars’ body shapes and sizes could influence how effectively users interact with and remember icon placements (Spiel, 2021).
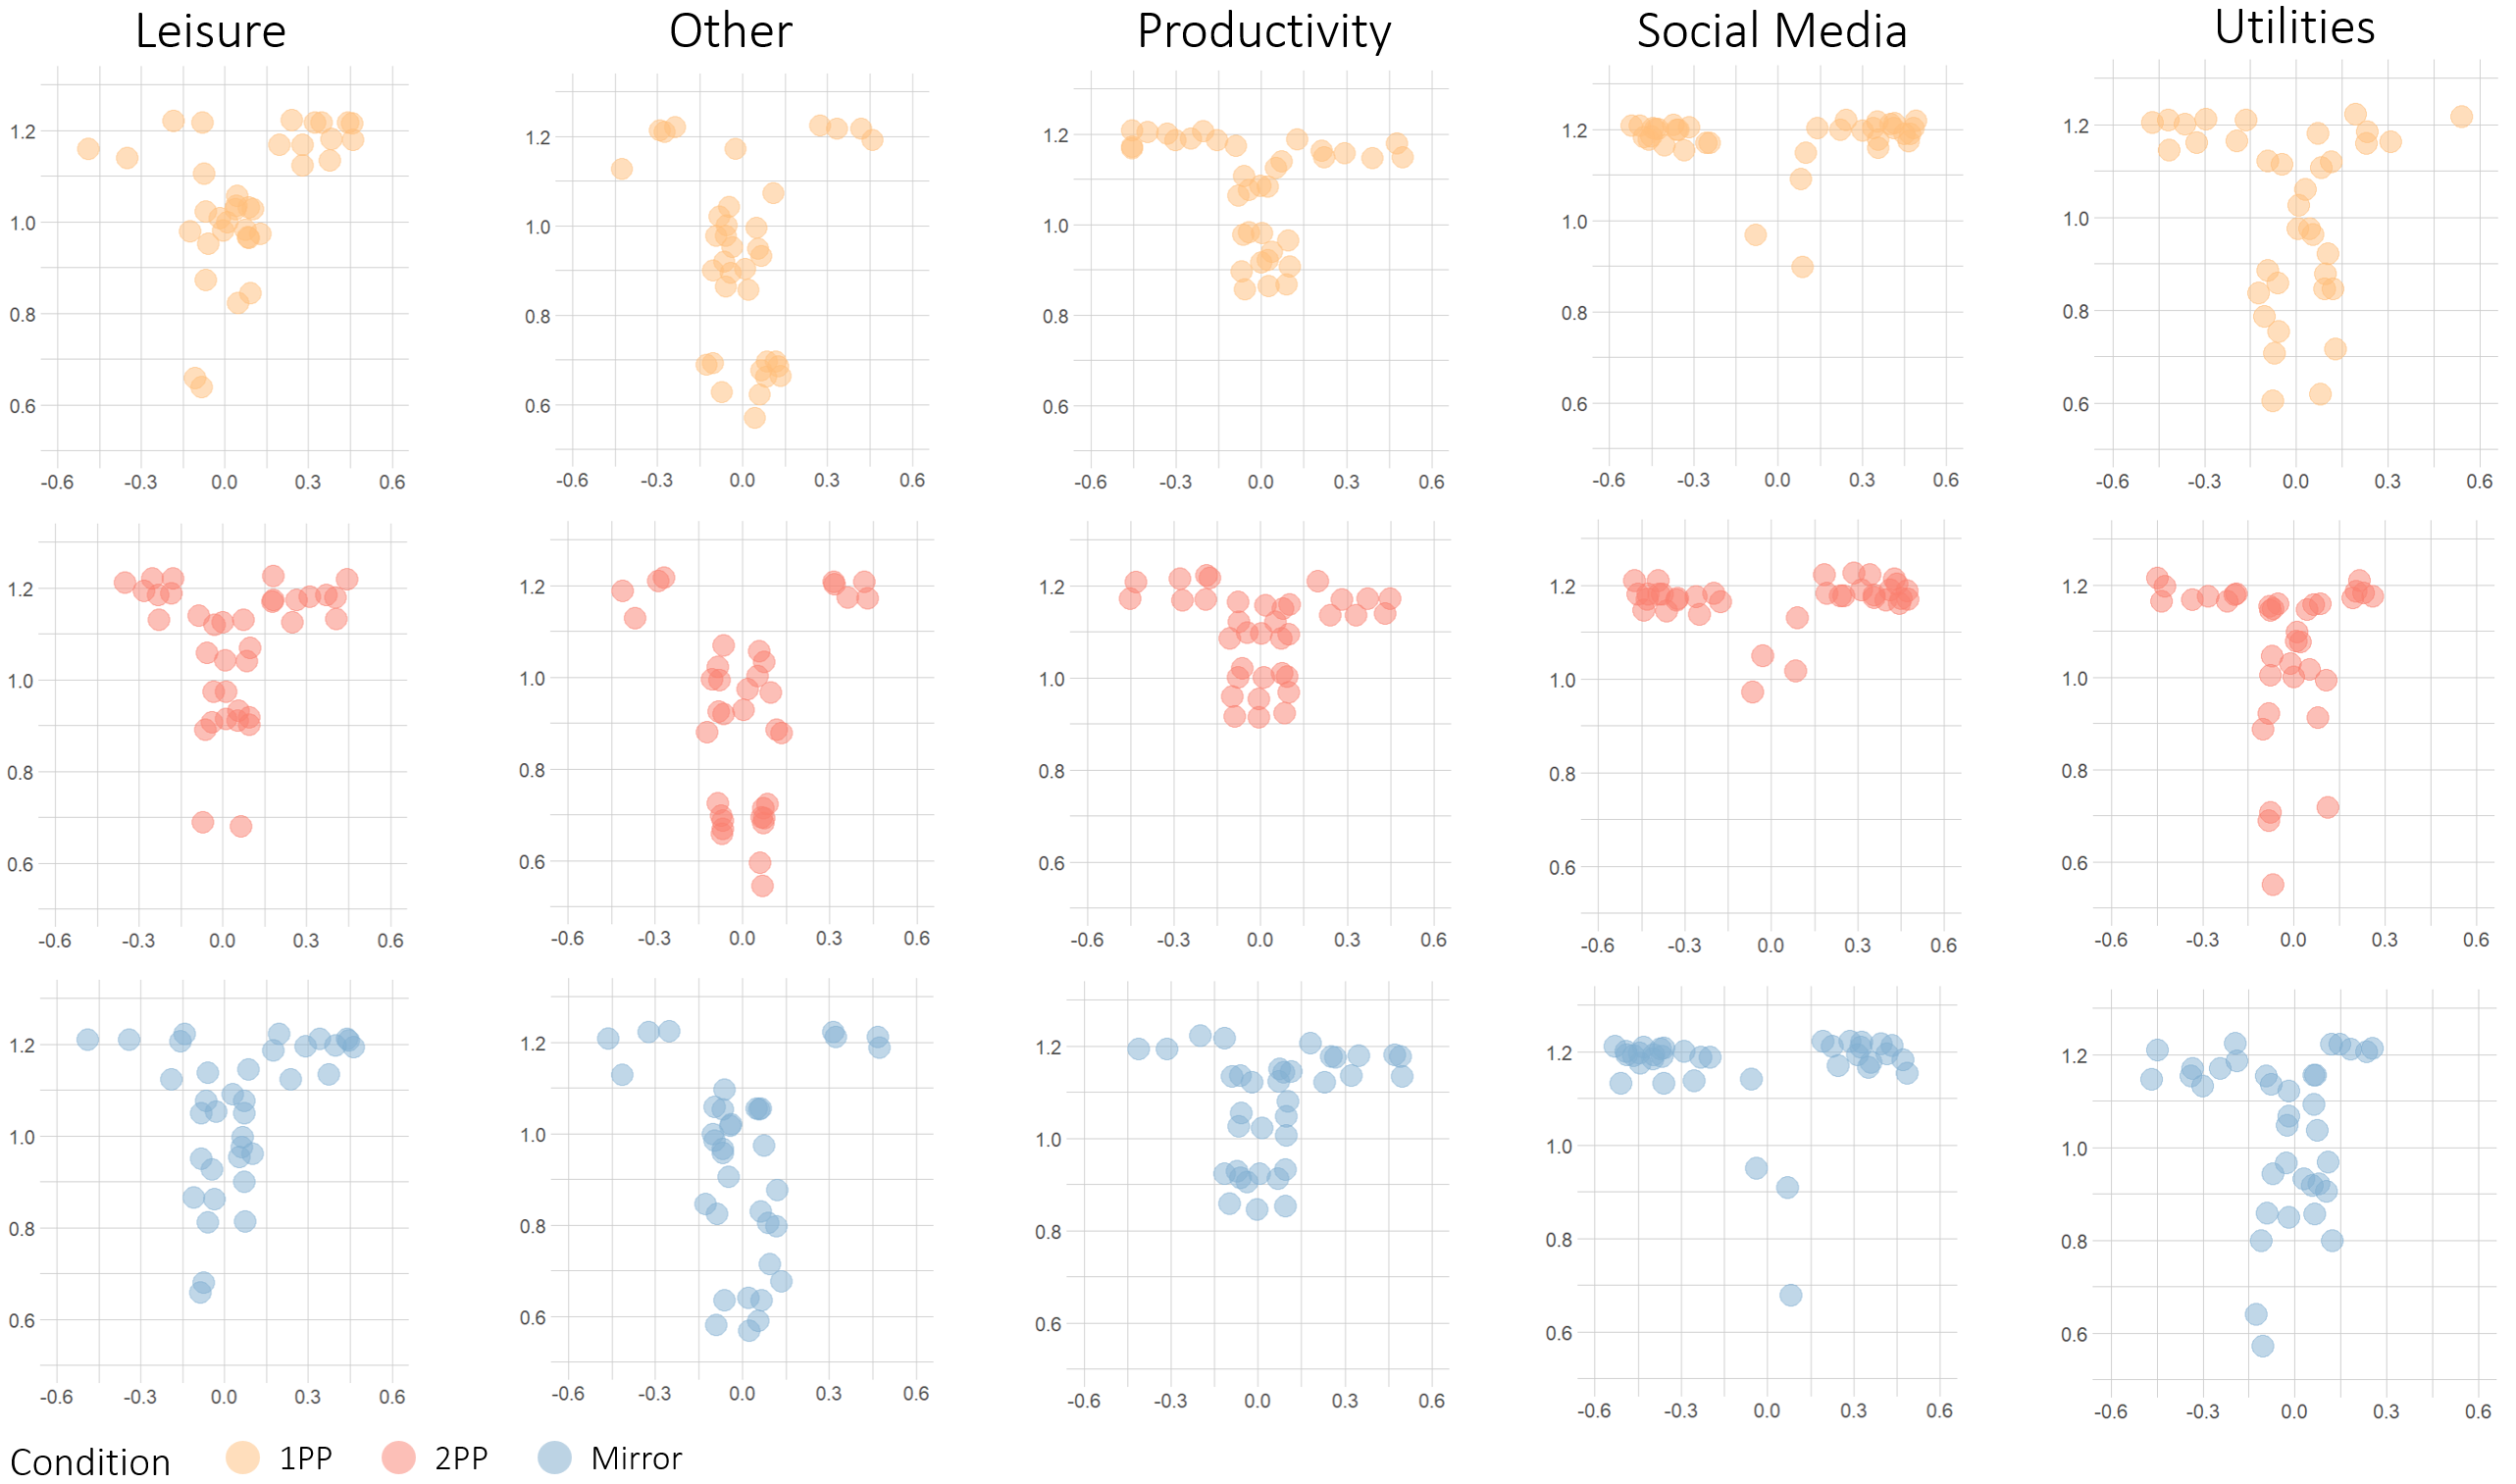
A series of scatter plots showing the distribution of different categories of icons (Leisure, Other, Productivity, Social Media, Utilities) under three conditions (1PP, 3PP, Mirror) in User Study 1. Each column represents a category of icons, and each row represents a condition. The first row contains scatter plots for 1PP (yellow), showing the distribution of icons in Leisure, Other, Productivity, Social Media, and Utilities. The second row contains scatter plots for 3PP (pink), showing the distribution of icons in the same categories. The third row contains scatter plots for Mirror (blue), also showing the distribution of icons in the same categories. Each scatter plot depicts data points indicating where the icons fall within the category for each condition, highlighting any clustering or spread in the distribution.
4.6. Icon Distribution
We visualized the distribution of icons across various categories under different conditions (see Figure 5). Interestingly, we observed a potential correlation between the location of icons on the body (referred to as landmarks) and their respective categories. For example, in Figure 5, Productivity icons consistently avoid placement on the lower body, while social media icons tend to be predominantly positioned on the hands, with only scattered instances on the torso. Similar patterns were noted for icons in other categories, suggesting potential user preferences and distribution rules.
5. User Study 2: Explore Bodily Preferences and Icon Distributions
Our initial observations on icon distribution led us to conduct a second user study to expand our dataset and investigate the relationship between icon categories and body placement more rigorously. We employed a one-way within-subjects design similar to our first study. The independent variable, Creation Process, remained at three levels: 1PP, 3PP, and Mirror. Counterbalancing of the techniques was used to mitigate order effects. Participants completed all three creation processes with our latest system in a single day, with a 5-minute break provided between each condition. The entire study took under 40 minutes. The purpose of User Study 2 is to address RQ2: Do users exhibit consistent patterns in the placement of icons across different body landmarks and categories?
5.1. Procedure
Before starting, participants provided demographic information and were given a tutorial and demonstration video, followed by a 10-minute training session. During the study, they created on-body menus using the same 15 virtual icons as in our initial study. Participants were asked to position the icons thoughtfully and could refine their placements until they were confident in their memorization. Once participants confirmed their placement, they would receive visual feedback and could then start placing the next icon or adjusting the previous ones. When using a different perspective-based creation process, users were told that they were free to adjust the distribution of the 15 icons on their body. After each task, they discussed their placement strategy and completed a Post-Creation Questionnaire.
5.2. Participants and Apparatus
We recruited 18 university students (12 males, 5 females, and 1 who preferred not to say) from a local institution. The participants’ ages ranged between 19 and 36 years (). All students indicated previous experience using VR, with familiarity ratings between 2 and 7 (). None of them participated in our first study.
In our first study, participants noted that the Rift S headset’s display and weight and the Kinect’s unreliable body movement detection were obstacles for users. To address these concerns, we developed a new creation system utilizing the Meta Quest 3 headset, which provides the capacity of integrated body movement detection and wireless connection. On the other hand, using the built-in cameras on the Quest 3 as the input for motion capture enhances the replicability of the research. However, as a trade-off, the current Quest 3’s detection range does not offer full-body tracking like a standalone Kinect placed in front of the user. Instead, it requires users to move their heads accordingly while wearing the headset to allow the cameras to capture hand and body movements effectively. The new system was built with Unity 2021.3.9f1.
5.3. Measures
Consistently, we measured similar user experience metrics as in the first study, which included Presence, Enjoyment, and Perceived Mental and Physical Demands. Additionally, we used the System Usability Scale (SUS) (Brooke et al., 1996) to evaluate the feasibility and usability of our latest integrated creation system for on-body menus in VR.
5.4. Results
5.4.1. Presence
A one-way repeated measures ANOVA was conducted to evaluate the effect of different creation Techniques on presence scores, as measured by the IPQ. The average presence scores were () for 1PP, () for 3PP, and () for Mirror. The analysis did not yield a significant effect of the techniques on overall presence scores ().
5.4.2. Mental and Physical Demands
The perceived mental demands were () for Mirror, () for 1PP, and () for 3PP. The physical demands were () for 1PP, () for Mirror, and () for 3PP. However, the ANOVA analysis indicated that there were no significant differences between techniques on both Mental Demands () and Physical Demands ().
5.4.3. Enjoyment
The mean enjoyment scores were () for 3PP, and () for Mirror and () for 1PP. However, the results from a one-way ANOVA indicated no statistically significant differences in enjoyment between the techniques ().
5.4.4. System Usability Scale
The 3PP condition had a perceived usability score of (), the Mirror condition had (), and the 1PP condition had (). The ANOVA analysis did not reveal a statistically significant difference in perceived usability among the conditions (). While both 3PP and Mirror conditions scored above the average threshold of 68, suggesting generally acceptable usability, it is noteworthy that the 1PP condition scored below this threshold, indicating potential usability challenges (Brooke et al., 1996).
5.5. Towards Understanding Icon Distributions
To better understand the preference for bodily landmarks, we categorized the body into specific regions: the forearm, upper arm, chest to abdomen, and waist to lower body, inspired by (Fruchard et al., 2018). We merged the icon distributions from our first and second studies. We used Z-tests to measure the proportions and the Apriori algorithm for association rule mining (Han et al., 2000; Agrawal and Srikant, 1994), alongside confidence and lift metrics, to examine the association relationships among these categories. Bar plots illustrating the distribution of icons across areas (see Figure 7) and heatmaps (see Figure 6) were generated for visual assessment of the distribution.
Our analysis revealed significant preferences in icon placement based on their functional categories. Social Media icons were overrepresented on the forearm with (). Conversely, these icons were less likely to be positioned on the chest to abdomen and waist to lower body, with both . Icons in the Other category showed a significant preference for the waist to lower body region, with (). Utility icons were more likely to be placed on the chest to the abdomen with () and less likely to be situated on the forearm with (). Similarly, Productivity icons were more likely to appear in the chest to abdomen region with () and less likely in the waist to lower body area with ().
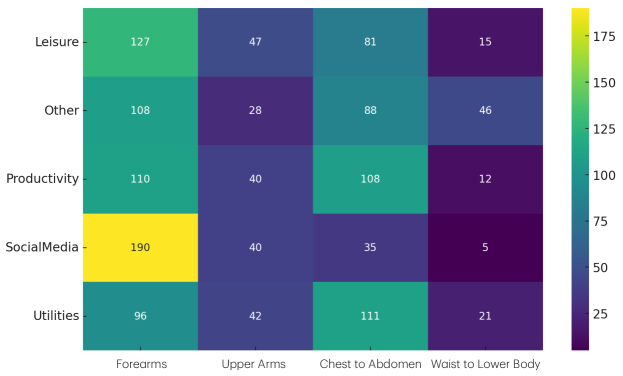
A heatmap showing the distribution of icon categories (Leisure, Other, Productivity, Social Media, Utilities) across different areas (1 to 4). Each cell’s intensity represents the count of icons, with higher counts shown in brighter colors and lower counts in darker colors. The categories are listed on the y-axis, and the areas are listed on the x-axis. The heatmap visually represents the relative frequency of each icon category across different areas, with a color scale bar indicating the range from lower to higher counts.
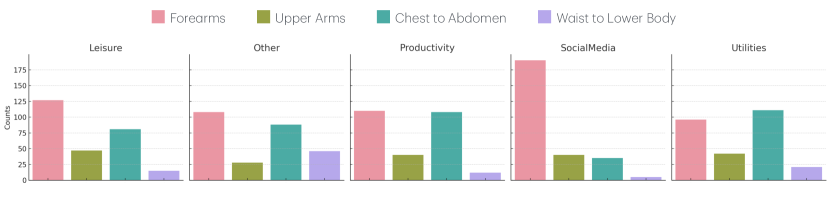
A series of bar charts showing the distribution of each icon category (Leisure, Other, Productivity, Social Media, Utilities) across different body areas in User Study 2. Each chart represents a category of icons, with the x-axis labeled “Area” (ranging from 1 to 4) and the y-axis labeled “Counts”. Each bar chart visually depicts the number of icons in each category placed in different body areas, highlighting any significant differences in distribution.
We discovered significant relationships in our analysis of the associations between different icon categories across various conditions. Specifically, we found an association between the Leisure and Social Media icon categories, as well as between Productivity and Social Media icons. The association rule between Leisure and Social Media exhibited low support () but high confidence in the direction of Leisure predicting Social Media (). The lift value () indicates that these two categories co-occur 23% more frequently than would be expected by chance alone. This suggests a strong connection in user behavior. Similarly, the rule linking Productivity and Social Media demonstrated lower support () with moderate confidence values in both directions: Productivity predicting Social Media () and Social Media predicting Productivity (). The lift value () further suggests that these categories co-occur more frequently than would be expected by chance.
6. Discussion, Limitations, and Future Work
Firstly, it must be acknowledged that our findings are not revolutionary but rather incremental. Our first user study addresses RQ1, revealing that the three creation processes have varying impacts on user experience and usability. While most participants preferred the Mirror condition due to its speed in creation and recall, their overall preferences among the three conditions were not consistent. Our second user study investigates RQ2, showing that participants tend to favor placing specific categories of icons in particular locations.
Therefore, our research on developing on-body menus in VR has unveiled two principal design strategies that can enhance user experience and performance in future implementations (Mueller et al., 2023). First, our analysis of on-body menu creation revealed insightful patterns in participants’ preferences for organizing application icons across different body regions. Specifically, we observed a trend where Social Media icons are predominantly placed on the forearm, likely due to their familiarity with and frequent use of these applications for quick access. Conversely, icons related to Utilities and Productivity are generally positioned from the chest to the abdomen, suggesting a preference for these icons to be in a more visible location during task-focused interactions. Given this, designers could provide suggestions to users when setting up on-body icons. Secondly, it is advantageous for designers to incorporate customizable options for on-body menu configurations. Although our study indicated that the three perspective-based creation processes did not always significantly differ in quantitative performance outcomes, individual preferences for these setups were evident. Offering customization options, such as perspective toggles, can cater more effectively to user-specific needs in VR on-body menu creation.
Our study primarily investigated the associations between icon categories and their placement on the body, acknowledging other crucial factors that influence the efficacy of VR graphical menus. These factors include the size and visual complexity of the menu items, which can affect readability and the ease of selection, as well as the various input modalities (e.g., hand-tracking, controllers, gaze-based controls). Each input type may require specific design modifications to optimize usability and comfort. Nevertheless, we contend that the observed correlations and associations regarding icon placement are valuable independently and should remain pertinent even as input methods or icon characteristics evolve.
Furthermore, our research was limited to a fixed icon size and quantity. Future studies should explore the optimal icon sizes and numbers that users find comfortable and practical for on-body VR menus. This could include examining how changes in icon scale or density within the menu affect user experience. Additionally, investigating individual differences in spatial reasoning and visual preference could enhance our understanding of effective on-body menu design. These future inquiries will provide essential insights that complement our current findings on icon category distribution. Finally, we acknowledge that the sample size in both studies is not significant, and the impact of frequency of use and familiarity with using these applications (icons) could have a potential effect on the results.
Future work could focus on designing more integrated systems for whole-body menus in VR, such as leveraging only controllers and headsets (Ahuja et al., 2022) or using other simple sparse inertial sensors (Yi et al., 2022; Winkler et al., 2022) within a reinforcement learning framework to predict full-body movements. This approach would enable a more accurate investigation of icon distribution across the entire body and allow testing with a broader range of icon categories.
7. Conclusion
Our exploration into the impact of different creation processes on on-body menus in virtual reality (VR) has yielded several significant contributions and insightful discoveries. In our first user study ( = 12), the use of the Mirror perspective was found to facilitate quicker creation times and improve recall accuracy compared to First Person Perspective (1PP) and Third Person Perspective (3PP). These findings support a mixed-perspective approach that combines the immediacy of a first-person view with the comprehensive visibility provided by a mirror or avatar. This strategy has the potential to significantly enhance both the efficiency and memorability of on-body menu design.
In our second study ( = 18), we enhanced our system with an integrated body movement detection system using Quest 3 and recruited additional participants to expand our dataset on icon distribution for on-body menus. Our research consistently demonstrated patterns in user preferences for icon placement across different body landmarks. For instance, Social Media icons were predominantly placed on the forearm, while Productivity icons were preferred in the upper body region. Furthermore, we identified significant associative relationships between icon categories: Leisure and Social Media icons, as well as Productivity and Social Media icons, frequently co-occurred. These patterns underscore the intuitive and potentially synergistic nature of these category pairings within on-body menus.
The insights derived from our studies offer valuable guidance for designers and developers looking to optimize the usability of on-body menus in VR. The evidence supports integrating first-person and mirror perspectives to significantly improve the speed and precision of the menu creation process. However, it is crucial to acknowledge users’ strong personal preferences in their choice of perspective during this process. Moreover, the natural propensity to associate specific application categories with certain body locations provides a foundation for intuitive menu design. By understanding and leveraging the associations between application categories, designers can devise more efficient and complementary menu configurations on the body.
Acknowledgements.
Xiang Li is supported by the China Scholarship Council (CSC) International Cambridge Scholarship (No. 202208320092). Per Ola Kristensson is supported by the EPSRC (grant EP/W02456X/1). We thank David Lindlbauer (Carnegie Mellon University), Yuzheng Chen (Xi’an Jiaotong-Liverpool University), Xiaohang Tang (Virginia Tech), and Xian Wang (The Hong Kong Polytechnic University) for their feedback and discussions at the early stages of this work. We also extend our gratitude to the anonymous reviewers for their insightful comments, and to our participants for their time.References
- (1)
- Agrawal and Srikant (1994) Rakesh Agrawal and Ramakrishnan Srikant. 1994. Fast Algorithms for Mining Association Rules in Large Databases. In Proceedings of the 20th International Conference on Very Large Data Bases (VLDB ’94). Morgan Kaufmann Publishers Inc., San Francisco, CA, USA, 487–499.
- Ahuja et al. (2022) Karan Ahuja, Vivian Shen, Cathy Mengying Fang, Nathan Riopelle, Andy Kong, and Chris Harrison. 2022. ControllerPose: Inside-Out Body Capture with VR Controller Cameras. In Proceedings of the 2022 CHI Conference on Human Factors in Computing Systems (New Orleans, LA, USA) (CHI ’22). Association for Computing Machinery, New York, NY, USA, 13 pages. https://doi.org/10.1145/3491102.3502105
- Azai et al. (2018a) Takumi Azai, Mai Otsuki, Fumihisa Shibata, and Asako Kimura. 2018a. Open Palm Menu: A Virtual Menu Placed in Front of the Palm. In Proceedings of the 9th Augmented Human International Conference (AH ’18). Association for Computing Machinery, New York, NY, USA, 1–5. https://doi.org/10.1145/3174910.3174929
- Azai et al. (2018b) Takumi Azai, Syunsuke Ushiro, Junlin Li, Mai Otsuki, Fumihisa Shibata, and Asako Kimura. 2018b. Tap-tap menu: body touching for virtual interactive menus. In Proceedings of the 24th ACM Symposium on Virtual Reality Software and Technology (VRST ’18). Association for Computing Machinery, New York, NY, USA, 1–2. https://doi.org/10.1145/3281505.3281561
- Bergstrom-Lehtovirta et al. (2017) Joanna Bergstrom-Lehtovirta, Sebastian Boring, and Kasper Hornbæk. 2017. Placing and Recalling Virtual Items on the Skin. (May 2017), 1497–1507. https://doi.org/10.1145/3025453.3026030
- Bergström and Hornbæk (2019) Joanna Bergström and Kasper Hornbæk. 2019. Human–Computer Interaction on the Skin. Comput. Surveys 52, 4 (Aug. 2019), 77. https://doi.org/10.1145/3332166
- Bonnail et al. (2023) Elise Bonnail, Wen-Jie Tseng, Mark Mcgill, Eric Lecolinet, Samuel Huron, and Jan Gugenheimer. 2023. Memory Manipulations in Extended Reality. In Proceedings of the 2023 CHI Conference on Human Factors in Computing Systems (CHI ’23). Association for Computing Machinery, New York, NY, USA, 1–20. https://doi.org/10.1145/3544548.3580988
- Bowman et al. (2001) Doug A. Bowman, Ernst Kruijff, Joseph J. LaViola, and Ivan Poupyrev. 2001. An Introduction to 3-D User Interface Design. Presence 10, 1 (Feb. 2001), 96–108. https://doi.org/10.1162/105474601750182342
- Bowman and Wingrave (2001) Doug A Bowman and Chadwick A Wingrave. 2001. Design and evaluation of menu systems for immersive virtual environments. In Proceedings IEEE Virtual Reality 2001. 149–156. https://doi.org/10.1109/VR.2001.913781
- Brooke et al. (1996) John Brooke et al. 1996. SUS-A quick and dirty usability scale. Usability evaluation in industry 189, 194 (1996), 4–7.
- Chatain et al. (2020) Julia Chatain, Danielle M. Sisserman, Lea Reichardt, Violaine Fayolle, Manu Kapur, Robert W. Sumner, Fabio Zünd, and Amit H. Bermano. 2020. DigiGlo: Exploring the Palm as an Input and Display Mechanism through Digital Gloves. In Proceedings of the Annual Symposium on Computer-Human Interaction in Play (CHI PLAY ’20). Association for Computing Machinery, New York, NY, USA, 374–385. https://doi.org/10.1145/3410404.3414260
- Coyle et al. (2012) David Coyle, James Moore, Per Ola Kristensson, Paul Fletcher, and Alan Blackwell. 2012. I did that! Measuring users’ experience of agency in their own actions. In Proceedings of the SIGCHI Conference on Human Factors in Computing Systems (CHI ’12). Association for Computing Machinery, New York, NY, USA, 2025–2034. https://doi.org/10.1145/2207676.2208350
- Dachselt and Hübner (2007) Raimund Dachselt and Anett Hübner. 2007. Three-dimensional menus: A survey and taxonomy. Computers & Graphics 31, 1 (Jan. 2007), 53–65. https://doi.org/10.1016/j.cag.2006.09.006
- Darbar et al. (2024) Rajkumar Darbar, Xuning Hu, Xinan Yan, Yushi Wei, Hai-Ning Liang, Wenge Xu, and Sayan Sarcar. 2024. OnArmQWERTY: An Empirical Evaluation of On-Arm Tap Typing for AR HMDs. In Proceedings of the 2024 ACM Symposium on Spatial User Interaction. 1–12. https://doi.org/10.1145/3677386.3682084
- Denisova and Cairns (2015) Alena Denisova and Paul Cairns. 2015. First Person vs. Third Person Perspective in Digital Games: Do Player Preferences Affect Immersion?. In Proceedings of the 33rd Annual ACM Conference on Human Factors in Computing Systems (CHI ’15). Association for Computing Machinery, New York, NY, USA, 145–148. https://doi.org/10.1145/2702123.2702256
- Dezfuli et al. (2014) Niloofar Dezfuli, Mohammadreza Khalilbeigi, Jochen Huber, Murat Özkorkmaz, and Max Mühlhäuser. 2014. PalmRC: leveraging the palm surface as an imaginary eyes-free television remote control. Behaviour & Information Technology 33, 8 (Aug. 2014), 829–843. https://doi.org/10.1080/0144929x.2013.810781
- Fruchard et al. (2018) Bruno Fruchard, Eric Lecolinet, and Olivier Chapuis. 2018. Impact of semantic aids on command memorization for on-body interaction and directional gestures. In Proceedings of the 2018 International Conference on Advanced Visual Interfaces (AVI ’18). Association for Computing Machinery, New York, NY, USA, 1–9. https://doi.org/10.1145/3206505.3206524
- Gebhardt et al. (2013) Sascha Gebhardt, Sebastian Pick, Franziska Leithold, Bernd Hentschel, and Torsten Kuhlen. 2013. Extended Pie Menus for Immersive Virtual Environments. IEEE Transactions on Visualization and Computer Graphics 19, 4 (April 2013), 644–651. https://doi.org/10.1109/TVCG.2013.31
- Gerber and Bechmann (2005) D. Gerber and D. Bechmann. 2005. The Spin Menu: A Menu System for Virtual Environments. In Proceedings of the 2005 IEEE Conference 2005 on Virtual Reality (VR ’05). IEEE Computer Society, USA, 271–272. https://doi.org/10.1109/VR.2005.81
- Gorisse et al. (2017) Geoffrey Gorisse, Olivier Christmann, Etienne Armand Amato, and Simon Richir. 2017. First- and Third-Person Perspectives in Immersive Virtual Environments: Presence and Performance Analysis of Embodied Users. Frontiers in Robotics and AI 4 (2017). https://www.frontiersin.org/articles/10.3389/frobt.2017.00033
- Gustafson et al. (2010) Sean Gustafson, Daniel Bierwirth, and Patrick Baudisch. 2010. Imaginary interfaces: spatial interaction with empty hands and without visual feedback. (Oct. 2010), 3–12. https://doi.org/10.1145/1866029.1866033
- Han et al. (2000) Jiawei Han, Jian Pei, and Yiwen Yin. 2000. Mining frequent patterns without candidate generation. In Proceedings of the 2000 ACM SIGMOD International Conference on Management of Data (Dallas, Texas, USA) (SIGMOD ’00). Association for Computing Machinery, New York, NY, USA, 1–12. https://doi.org/10.1145/342009.335372
- Harrison and Faste (2014) Chris Harrison and Haakon Faste. 2014. Implications of location and touch for on-body projected interfaces. In Proceedings of the 2014 conference on Designing interactive systems (DIS ’14). Association for Computing Machinery, New York, NY, USA, 543–552. https://doi.org/10.1145/2598510.2598587
- Harrison et al. (2012) Chris Harrison, Shilpa Ramamurthy, and Scott E. Hudson. 2012. On-body interaction: armed and dangerous. In Proceedings of the Sixth International Conference on Tangible, Embedded and Embodied Interaction (TEI ’12). Association for Computing Machinery, New York, NY, USA, 69–76. https://doi.org/10.1145/2148131.2148148
- Harrison et al. (2010) Chris Harrison, Desney Tan, and Dan Morris. 2010. Skinput: appropriating the body as an input surface. In Proceedings of the SIGCHI Conference on Human Factors in Computing Systems (CHI ’10). Association for Computing Machinery, New York, NY, USA, 453–462. https://doi.org/10.1145/1753326.1753394
- Hart (2006) Sandra G. Hart. 2006. Nasa-Task Load Index (NASA-TLX); 20 Years Later. Proceedings of the Human Factors and Ergonomics Society Annual Meeting 50, 9 (Oct. 2006), 904–908. https://doi.org/10.1177/154193120605000909
- Kallinen et al. (2007) Kari Kallinen, Mikko Salminen, Niklas Ravaja, Ryszard Kedzior, and Maria Saaksjarvi. 2007. Presence and emotion in computer game players during 1st person vs. 3rd person playing view: Evidence from self-report, eye-tracking, and facial muscle activity data. Proceedings of the 10th Annual International Workshop on Presence (Jan. 2007).
- Krokos et al. (2019) Eric Krokos, Catherine Plaisant, and Amitabh Varshney. 2019. Virtual memory palaces: immersion aids recall. Virtual Reality 23, 1 (March 2019), 1–15. https://doi.org/10.1007/s10055-018-0346-3
- Lediaeva and LaViola (2020) Irina Lediaeva and Joseph J. LaViola. 2020. Evaluation of Body-Referenced Graphical Menus in Virtual Environments. Graphics Interface (2020). https://doi.org/10.20380/gi2020.31
- Li et al. (2021c) Nianlong Li, Zhengquan Zhang, Can Liu, Zengyao Yang, Yinan Fu, Feng Tian, Teng Han, and Mingming Fan. 2021c. vMirror: Enhancing the Interaction with Occluded or Distant Objects in VR with Virtual Mirrors. In Proceedings of the 2021 CHI Conference on Human Factors in Computing Systems (CHI ’21). Association for Computing Machinery, New York, NY, USA, 1–11. https://doi.org/10.1145/3411764.3445537
- Li et al. (2021b) Xiang Li, Yuzheng Chen, Rakesh Patibanda, and Florian ’Floyd’ Mueller. 2021b. vrCAPTCHA: Exploring CAPTCHA Designs in Virtual Reality. In Extended Abstracts of the 2021 CHI Conference on Human Factors in Computing Systems (Yokohama, Japan) (CHI EA ’21). Association for Computing Machinery, New York, NY, USA, Article 167, 4 pages. https://doi.org/10.1145/3411763.3451985
- Li et al. (2023) Xiang Li, Jin-Du Wang, John J. Dudley, and Per Ola Kristensson. 2023. Swarm Manipulation in Virtual Reality. In Proceedings of the 2023 ACM Symposium on Spatial User Interaction (Sydney, NSW, Australia) (SUI ’23). Association for Computing Machinery, New York, NY, USA, Article 20, 11 pages. https://doi.org/10.1145/3607822.3614519
- Li et al. (2021a) Zhen Li, Joannes Chan, Joshua Walton, Hrvoje Benko, Daniel Wigdor, and Michael Glueck. 2021a. Armstrong: An Empirical Examination of Pointing at Non-Dominant Arm-Anchored UIs in Virtual Reality. In Proceedings of the 2021 CHI Conference on Human Factors in Computing Systems (CHI ’21). Association for Computing Machinery, New York, NY, USA, 1–14. https://doi.org/10.1145/3411764.3445064
- Lim and Reeves (2009) Sohye Lim and Byron Reeves. 2009. Being in the Game: Effects of Avatar Choice and Point of View on Psychophysiological Responses During Play. Media Psychology 12, 4 (Nov. 2009), 348–370. https://doi.org/10.1080/15213260903287242
- Lindlbauer et al. (2019) David Lindlbauer, Anna Maria Feit, and Otmar Hilliges. 2019. Context-Aware Online Adaptation of Mixed Reality Interfaces. In Proceedings of the 32nd Annual ACM Symposium on User Interface Software and Technology (UIST ’19). Association for Computing Machinery, New York, NY, USA, 147–160. https://doi.org/10.1145/3332165.3347945
- Makowski et al. (2017) Dominique Makowski, Marco Sperduti, Serge Nicolas, and Pascale Piolino. 2017. “Being there” and remembering it: Presence improves memory encoding. Consciousness and Cognition 53 (Aug. 2017), 194–202. https://doi.org/10.1016/j.concog.2017.06.015
- Medeiros et al. (2018) Daniel Medeiros, Rafael K. dos Anjos, Daniel Mendes, João Madeiras Pereira, Alberto Raposo, and Joaquim Jorge. 2018. Keep my head on my shoulders! why third-person is bad for navigation in VR. In Proceedings of the 24th ACM Symposium on Virtual Reality Software and Technology (VRST ’18). Association for Computing Machinery, New York, NY, USA, 1–10. https://doi.org/10.1145/3281505.3281511
- Mistry et al. (2009) Pranav Mistry, Pattie Maes, Pattie Maes, and Liyan Chang. 2009. WUW - wear Ur world: a wearable gestural interface. (April 2009), 4111–4116. https://doi.org/10.1145/1520340.1520626
- Mollyn et al. (2023) Vimal Mollyn, Riku Arakawa, Mayank Goel, Chris Harrison, and Karan Ahuja. 2023. IMUPoser: Full-Body Pose Estimation using IMUs in Phones, Watches, and Earbuds. In Proceedings of the 2023 CHI Conference on Human Factors in Computing Systems (Hamburg, Germany) (CHI ’23). Association for Computing Machinery, New York, NY, USA, Article 529, 12 pages. https://doi.org/10.1145/3544548.3581392
- Monteiro et al. (2018a) Diego Monteiro, Hai-Ning Liang, Andrew Abel, Nilufar Bahaei, and Rita de Cassia Monteiro. 2018a. Evaluating Engagement of Virtual Reality Games Based on First and Third Person Perspective Using EEG and Subjective Metrics. In 2018 IEEE International Conference on Artificial Intelligence and Virtual Reality (AIVR). 53–60. https://doi.org/10.1109/AIVR.2018.00015
- Monteiro et al. (2018b) Diego Monteiro, Hai-Ning Liang, Wenge Xu, Marvin Brucker, Vijayakumar Nanjappan, and Yong Yue. 2018b. Evaluating Enjoyment, Presence, and Emulator Sickness in VR Games Based on First- and Third-Person Viewing Perspectives. Computer Animation and Virtual Worlds 29, 3-4 (2018). https://doi.org/10.1002/cav.1830
- Mueller et al. (2018) Florian ’Floyd’ Mueller, Richard Byrne, Josh Andres, and Rakesh Patibanda. 2018. Experiencing the Body as Play. In Proceedings of the 2018 CHI Conference on Human Factors in Computing Systems (CHI ’18). Association for Computing Machinery, New York, NY, USA, 1–13. https://doi.org/10.1145/3173574.3173784
- Mueller et al. (2021) Florian ’Floyd’ Mueller, Rakesh Patibanda, Richard Byrne, Zhuying Li, Yan Wang, Josh Andres, Xiang Li, Jonathan Marquez, Stefan Greuter, Jonathan Duckworth, and Joe Marshall. 2021. Limited Control Over the Body as Intriguing Play Design Resource. In Proceedings of the 2021 CHI Conference on Human Factors in Computing Systems (CHI ’21). Association for Computing Machinery, New York, NY, USA, 1–16. https://doi.org/10.1145/3411764.3445744
- Mueller et al. (2023) Florian ’Floyd’ Mueller, Nathan Semertzidis, Josh Andres, Joe Marshall, Steve Benford, Xiang Li, Louise Matjeka, and Yash Mehta. 2023. Towards Understanding the Design of Intertwined Human-computer Integrations. ACM Trans. Comput.-Hum. Interact. 30, 5, Article 73 (sep 2023), 45 pages. https://doi.org/10.1145/3590766
- Olszewska and Ulatowska (2013) Justyna Olszewska and Joanna Ulatowska. 2013. Encoding strategy affects false recall and recognition: Evidence from categorical study material. Advances in Cognitive Psychology 9 (2013), 44–52. https://doi.org/10.5709/acp-0130-0
- Patibanda et al. (2023a) Rakesh Patibanda, Chris Hill, Aryan Saini, Xiang Li, Yuzheng Chen, Andrii Matviienko, Jarrod Knibbe, Elise van den Hoven, and Florian “Floyd” Mueller. 2023a. Auto-Paizo Games: Towards Understanding the Design of Games That Aim to Unify a Player’s Physical Body and the Virtual World. Proc. ACM Hum.-Comput. Interact. 7, CHI PLAY, Article 408 (oct 2023), 26 pages. https://doi.org/10.1145/3611054
- Patibanda et al. (2023b) Rakesh Patibanda, Aryan Saini, Nathalie Overdevest, Maria F. Montoya, Xiang Li, Yuzheng Chen, Shreyas Nisal, Josh Andres, Jarrod Knibbe, Elise van den Hoven, and Florian “Floyd” Mueller. 2023b. Fused Spectatorship: Designing Bodily Experiences Where Spectators Become Players. Proc. ACM Hum.-Comput. Interact. 7, CHI PLAY, Article 403 (oct 2023), 34 pages. https://doi.org/10.1145/3611049
- Peeters and Segundo-Ortin (2019) Anco Peeters and Miguel Segundo-Ortin. 2019. Misplacing Memories? An Enactive Approach to the Virtual Memory Palace. Consciousness and Cognition 76 (Nov. 2019), 102834. https://doi.org/10.1016/j.concog.2019.102834
- Sanchez-Vives and Slater (2005) Maria V. Sanchez-Vives and Mel Slater. 2005. From Presence to Consciousness through Virtual Reality. Nature Reviews Neuroscience 6, 4 (April 2005), 332–339. https://doi.org/10.1038/nrn1651
- Santos et al. (2017) A. Santos, T. Zarraonandia, P. Díaz, and I. Aedo. 2017. A Comparative Study of Menus in Virtual Reality Environments. In Proceedings of the 2017 ACM International Conference on Interactive Surfaces and Spaces (ISS ’17). Association for Computing Machinery, New York, NY, USA, 294–299. https://doi.org/10.1145/3132272.3132277
- Sato et al. (2012) Munehiko Sato, Ivan Poupyrev, and Chris Harrison. 2012. Touché: enhancing touch interaction on humans, screens, liquids, and everyday objects. In Proceedings of the SIGCHI Conference on Human Factors in Computing Systems (CHI ’12). Association for Computing Machinery, New York, NY, USA, 483–492. https://doi.org/10.1145/2207676.2207743
- Schubert et al. (2001) Thomas Schubert, Frank Friedmann, and Holger Regenbrecht. 2001. The Experience of Presence: Factor Analytic Insights. Presence: Teleoperators and Virtual Environments 10, 3 (June 2001), 266–281. https://doi.org/10.1162/105474601300343603
- Spiel (2021) Katta Spiel. 2021. The Bodies of TEI – Investigating Norms and Assumptions in the Design of Embodied Interaction. In Proceedings of the Fifteenth International Conference on Tangible, Embedded, and Embodied Interaction (Salzburg, Austria) (TEI ’21). Association for Computing Machinery, New York, NY, USA, Article 32, 19 pages. https://doi.org/10.1145/3430524.3440651
- Sweller et al. (2011) John Sweller, Paul Ayres, and Slava Kalyuga. 2011. The Split-Attention Effect. Springer New York, New York, NY, 111–128. https://doi.org/10.1007/978-1-4419-8126-4_9
- Wagner et al. (2013) Julie Wagner, Mathieu Nancel, Sean G. Gustafson, Stephane Huot, and Wendy E. Mackay. 2013. Body-centric design space for multi-surface interaction. In Proceedings of the SIGCHI Conference on Human Factors in Computing Systems (CHI ’13). Association for Computing Machinery, New York, NY, USA, 1299–1308. https://doi.org/10.1145/2470654.2466170
- Wang et al. (2015) Cheng-Yao Wang, Min-Chieh Hsiu, Po-Tsung Chiu, Chiao-Hui Chang, Liwei Chan, Bing-Yu Chen, and Mike Y. Chen. 2015. PalmGesture: Using Palms as Gesture Interfaces for Eyes-free Input. In Proceedings of the 17th International Conference on Human-Computer Interaction with Mobile Devices and Services (MobileHCI ’15). Association for Computing Machinery, New York, NY, USA, 217–226. https://doi.org/10.1145/2785830.2785885
- Weigel et al. (2017) Martin Weigel, Aditya Shekhar Nittala, Alex Olwal, and Jürgen Steimle. 2017. SkinMarks: Enabling Interactions on Body Landmarks Using Conformal Skin Electronics. In Proceedings of the 2017 CHI Conference on Human Factors in Computing Systems (CHI ’17). Association for Computing Machinery, New York, NY, USA, 3095–3105. https://doi.org/10.1145/3025453.3025704
- Winkler et al. (2022) Alexander Winkler, Jungdam Won, and Yuting Ye. 2022. QuestSim: Human Motion Tracking from Sparse Sensors with Simulated Avatars. In SIGGRAPH Asia 2022 Conference Papers (Daegu, Republic of Korea) (SA ’22). Association for Computing Machinery, New York, NY, USA, Article 2, 8 pages. https://doi.org/10.1145/3550469.3555411
- Xu et al. (2020) Wenge Xu, Hai-Ning Liang, Yuzheng Chen, Xiang Li, and Kangyou Yu. 2020. Exploring Visual Techniques for Boundary Awareness During Interaction in Augmented Reality Head-Mounted Displays. In 2020 IEEE Conference on Virtual Reality and 3D User Interfaces (VR). 204–211. https://doi.org/10.1109/VR46266.2020.00039 ISSN: 2642-5254.
- Xu et al. (2018) Xuhai Xu, Alexandru Dancu, Pattie Maes, and Suranga Nanayakkara. 2018. Hand range interface: information always at hand with a body-centric mid-air input surface. (Sept. 2018). https://doi.org/10.1145/3229434.3229449
- Yi et al. (2022) Xinyu Yi, Yuxiao Zhou, Marc Habermann, Soshi Shimada, Vladislav Golyanik, Christian Theobalt, and Feng Xu. 2022. Physical Inertial Poser (PIP): Physics-aware Real-time Human Motion Tracking from Sparse Inertial Sensors. In 2022 IEEE/CVF Conference on Computer Vision and Pattern Recognition (CVPR). 13157–13168. https://doi.org/10.1109/CVPR52688.2022.01282
- Yu et al. (2022) Difeng Yu, Qiushi Zhou, Tilman Dingler, Eduardo Velloso, and Jorge Goncalves. 2022. Blending On-Body and Mid-Air Interaction in Virtual Reality. In 2022 IEEE International Symposium on Mixed and Augmented Reality (ISMAR). 637–646. https://doi.org/10.1109/ISMAR55827.2022.00081 ISSN: 1554-7868.
- Zhai et al. (1994) Shumin Zhai, William Buxton, and Paul Milgram. 1994. The “Silk Cursor”: investigating transparency for 3D target acquisition. In Proceedings of the SIGCHI Conference on Human Factors in Computing Systems (CHI ’94). Association for Computing Machinery, New York, NY, USA, 459–464. https://doi.org/10.1145/191666.191822
Appendix A List of Icons
We categorized 15 icons into five groups: Social Media: Weibo, WeChat, and Tencent QQ; Productivity: Excel, Word, and PowerPoint; Leisure: BiliBili, YouTube, and TikTok; Utilities: Camera, AppStore, and Clock; Other: Google Maps, Ele.me, and Uber.
Screenshot of the on-body mapping for 15 virtual icons representing various applications, categorized as: Social Media (Weibo, WeChat, and Tencent QQ), Productivity (Excel, Word, and PowerPoint), Leisure (BiliBili, YouTube, and TikTok), Utilities (Camera, AppStore, and Clock), and Other (Google Maps, Ele.me, and Uber).