Measuring the atmospheric muon neutrino and anti-neutrino flux ratio with the ATLAS detector at LHC
Deep Ghosh111E-mail: matrideb1@gmail.com,
Satyanarayan Mukhopadhyay 222E-mail: tpsnm@iacs.res.in
and Biswarup Mukhopadhyaya333E-mail: biswarup@iiserkol.ac.in
1,3Department of Physical Sciences, Indian Institute of Science Education and Research (IISER) Kolkata, Campus Road, Mohanpur, West Bengal 741246.
2School of Physical Sciences, Indian Association for the Cultivation of Science (IACS), 2A and 2B Raja S.C. Mullick Road, Kolkata 700 032.
Abstract
There is a significant uncertainty in the prediction of atmospheric muon neutrino and anti-neutrino flux ratio using different flux models, especially at higher energies. We study the prospects of experimentally measuring this flux ratio as a function of energy with the ATLAS detector at the LHC. To this end, we compute the contained-vertex and external upward going charged current event rates induced by atmospheric muon (anti-)neutrinos through deep inelastic scattering at the 4 kiloton hadron calorimeter (HCAL) component of ATLAS. We illustrate the event selection criteria necessary to eliminate the cosmic ray muon background for the above event classes. While the contained vertex events have a striking topology with a muon being created inside the HCAL and then travelling to the muon chamber possibly through the tracker, for muons with energy larger than 3 GeV, a much higher statistics is obtained for the external upward going events created in the rock column below the detector. Our estimates show that the energy dependence of the ratio of negative and positively charged muons induced by atmospheric muon neutrino and anti-neutrino fluxes can be measured by ATLAS upto a muon energy of 100 GeV, with 1000-live days of neutrino physics exposure over a period of several years, considering only the period with the LHC beams not in circulation, but the detector and magnetic fields of ATLAS in operation. With this exposure, we obtain and contained vertex events, and and external upward-going events, after imposing the necessary selection criteria.
In interpreting the results of atmospheric neutrino experiments, and determining the neutrino mass and mixing angles using them, an important ingredient is the knowledge of the atmospheric neutrino fluxes. These fluxes are computed using advanced numerical flux models, which utilize the primary cosmic ray spectrum, the expected yield of neutrinos from cosmic ray interactions with the atmosphere, as well as data on cosmic ray muons at sea level to determine certain parameters of the models Gaisser_Book ; Volkova:1980sw .
Atmospheric neutrinos are produced in the interaction of primary cosmic rays (around 90% protons, 9% alpha particles and a small percentage of heavier nuclei) with the air molecules in the atmosphere, such as nitrogen and oxygen Gaisser_Book . Depending on the energy of the primary proton, different mesons can be produced in these interactions, such as, These mesons subsequently decay to generate a flux of atmospheric muons and neutrinos of different flavours. At low energies, the most copiously produced mesons are charged and neutral pions, where the charged pions decay before reaching the sea-level (a 10 GeV pion travels km before decaying), with and . If the muon energy is less than GeV, it also decays within the km length of the atmosphere by the standard decay chains: and .
Therefore, for energies of the order of a GeV or so, we expect both and decays to produce equal numbers of and , as long as the muons decay on their way to the sea-level, with the ratio:
| (1) |
For higher energies, the muons do not decay before reaching sea-level, and the ratio starts to increase, as more are produced compared to in proton interactions with air molecules, due to a larger value of the fragmentation function. At even higher energies, mesons are also produced in increasingly larger numbers, with more than , with the following dominant decay modes: , , , and . Combining these inputs, we see that the ratio starts from 1 at low energies, and then grows at higher energies. Its value, averaged over all zenith angles is around 1.2 at 10 GeV neutrino energy, 1.4 at 100 GeV, 1.5 at 1 TeV, etc, using the flux model of Honda et al Honda:2015fha ; Honda:2011nf .
However, as we can see from Refs. Honda:2015fha ; Honda:2011nf ; SK_Full , significant uncertainties in the muon (anti-)neutrino flux ratio exists, when we compare the predictions of different flux models, with differences of or higher at energies of order 100 GeV Battistoni:2003ju ; Honda:2004yz ; Barr:2004br . This significant difference between neutrino and anti-neutrino fluxes may not only impact atmospheric neutrino physics analyses, they are sensitive to the flux model parameters that may feed into the total neutrino flux as well. The goal of this paper is to discuss experimental measurements of this ratio, which, when included in the fits, may be helpful in reducing the uncertainties of the atmospheric flux models.
As is well-known, although neutrinos are the most abundant cosmic rays at the sea level, their detection is hard due to small neutrino-nucleon scattering cross-sections. For example, the cross-section for producing a charged lepton (averaged over neutrino and anti-neutrino) in a broad energy range of 1 GeV to 3000 GeV is approximately . On the other hand, the neutrino flux around 1 GeV energy, summed over all directions is around . Thus, for 1 GeV atmospheric neutrinos one expects around neutrino interactions in a detector of fiducial mass 1 kiloton with one-year of exposure. Hence, to study the charged current interactions of neutrinos, we need a detector of at least few kilotons fiducial mass, running for few hundred live days. In addition, to distinguish neutrinos from anti-neutrinos using charged current processes, we need a detector with an ability to distinguish a charged lepton from an anti-lepton, possibly with a magnetic field.
The MINOS experiment had all of the above features MINOS:2008hdf ; Gaisser:2002zv . Although the MINOS experiment was operated primarily using a neutrino beam, it carried out a study of atmospheric neutrinos when the beam was not in circulation. The MINOS far detector had a mass of 5.4 kton, but only around 4 kton fiducial mass was available for atmospheric neutrino studies. It had a magnetic field of 1.3 T in the far detector, making neutrino vs anti-neutrino studies feasible. Measurements of atmospheric neutrino and antineutrino interactions in the MINOS Far Detector were made, based on 2553 live-days of data MINOS_Atmospheric . A total of 2072 candidate events were observed. These were classified into 905 contained-vertex muons and 466 neutrino-induced rock-muons, both produced by charged-current interactions. For contained vertex events, they reported a ratio of muon neutrino to anti-neutrino of about 2.2 (with a 10% statistical error) and for neutrino-induced rock muons a ratio of 1.6 (with a 15% statistical error) MINOS_Atmospheric . Energy dependence of this ratio was not reported by MINOS.

In this Letter, we propose to experimentally measure the muon neutrino and anti-neutrino flux ratio using the ATLAS detector at the CERN Large Hadron Collider (LHC), which is the largest collider detector ever built. While the overall weight of ATLAS is around 7000 tons, the weight of the ATLAS hadron calorimeter (HCAL), which is mostly made of steel with plastic scintillators, is around 4000 tons ATLAS:2008xda . In this study, we shall be exploring the ATLAS hadron calorimeter as the primary fiducial mass for atmospheric neutrino induced contained vertex charged current events. The magnet system at ATLAS includes a 2 Tesla solenoid for the inner detector, a 0.5 Tesla toroid for the barrel and a 1 Tesla toroid for the muon end-caps. The width of ATLAS is around 22 meters, out of which the width of the tracker, electromagnetic calorimeter (ECAL), HCAL, and muon chambers being 1.15 m, 1.1 m, 2 m and 6.75 m, respectively, on both sides of the beam line ATLAS:2008xda . Since these length scales quantifying the dimensions of different detector components are relevant to our study, we present a schematic outline of the cross-sectional view of the ATLAS detector in Fig. 1.
Given the fact that the ATLAS HCAL has the necessary minimum fiducial mass to carry out atmospheric neutrino measurements, the next question is the exposure time available. It turns out that the LHC beams are not in circulation during the winter months, while the detector and magnetic fields are ON during most of this period (for cosmic ray studies and detector alignment and other checks). If around 100 days per year are available with the detector and the magnetic fields ON, but the LHC beams OFF, then in 10 years, 1000 live-days for neutrino physics should be feasible. If instead around 60 days per year are available, 15 years will be necessary for the same statistics. Therefore, a reasonable number of days of exposure for conducting neutrino physics studies should be feasible at ATLAS Kopp:2007ai ; S_Banerjee .
The idea of carrying out neutrino physics studies with a large and finely instrumented detector such as ATLAS was first proposed by F. Vannucci privately to different authors Kopp:2007ai ; Vannucci ; Petcov , and finds its first passing mention in a study of magnetized iron detectors by Petcov and Schwetz (2006) Petcov , although they did not perform any analysis. Kopp and Lindner (2007) Kopp:2007ai carried out the first analysis of using ATLAS for atmospheric neutrino oscillation studies with the aim of more precise neutrino mass and mixing estimations. Their study used a minimum reconstructed neutrino energy of 1.5 GeV, which does not seem to be feasible with the ATLAS detector. As we shall subsequently discuss, a muon of minimum energy 3 GeV is necessary to obtain a signature in the muon chamber, after it successfully crosses the HCAL without losing all of its energy. Recently, Wen et al (2024) Wen:2023ijf looked into the prospects of observing high-energy supernova neutrinos from a particular direction in the sky, with a limited statistics of through-going events at ATLAS.
In the subsequent analyses, we shall look into the details of the characteristic features of the neutrino induced charged current events, and impose event selection conditions to eliminate cosmic-ray muon events at ATLAS. Although the ATLAS detector sits only at a depth of about 100 m below the ground, in which a large flux of cosmic ray muons penetrate, it is possible to efficiently eliminate the cosmic muon backgrounds by using certain distinct topological features of the events as well as the timing information of the muon chambers. Subsequently, we shall compute the negative and positive muon charge ratio induced by neutrinos and anti-neutrinos as a function of the muon energy at ATLAS, for both contained vertex and external upward going rock muon events.
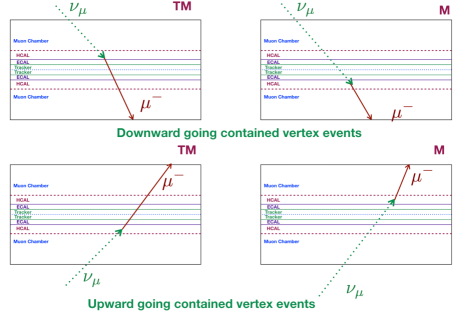
In Fig 2, we illustrate the four distinct categories of downward and upward going contained vertex charged current events induced by atmospheric neutrinos at the ATLAS detector. The TM category events will have a charged muon giving hits both in the tracker and muon chamber, while in the M category events the muons will only give hits in the muon chamber. For low-energy muons, we require both tracker and muon chamber hits. As they may not give hits in several layers of the muon chamber, the tracker hits are necessary to successfully reconstruct its trajectory, using the bending of which we can determine the muon’s momentum and electric charge. This requirement reduces the low-energy contained events, which is the dominant fraction of such events, by . The minimum muon energy considered in our study is 3 GeV, which is necessary to obtain a signature in the muon chamber, after the muon successfully crosses the HCAL without losing all of its energy ATLAS:2020ofx . For higher energy muons, hits only in the muon chamber are sufficient, as they will give hits on several layers in that part of the detector, and at the same time will have a sufficiently large lever arm for an accurate momentum and charge measurement (recall that the width of the muon chamber on both sides is 7 m each).
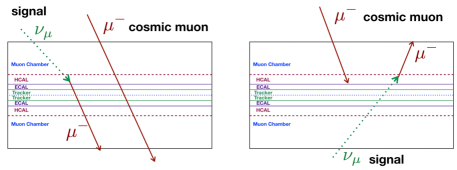
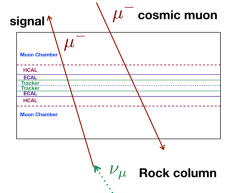
As illustrated in Fig. 3 (Top Panel), down-going cosmic ray muons cannot mimic down-going contained vertex atmospheric neutrino signal — cosmic muons first necessarily hit the upper muon chamber, while the signal muon is generated 7 m deeper in the detector at the HCAL. Furthermore, for the upward going contained-vertex signal with no hits at tracker first (i.e., produced at the upper HCAL), timing information is necessary from the resistive plate chamber (RPC) plates of the muon spectrometer. The cosmic muons hit the top-most layer earliest, and conversely for the signal muons. The timing resolution of RPC’s is around 1.5 ns, and a muon travels the 7 m muon chamber in about 23 ns, and the full ATLAS width of 22 m in about 73 ns. Therefore, given the timing resolution of the RPC’s, we can determine the upward or downward going nature of the muons by checking the time stamps of hits at different layers of the muon chamber. The upward going outside rock muon events can look more similar to cosmic ray muons, as illustrated in Fig. 3 (Down Panel), and in this case we need to solely rely on the timing information to eliminate the cosmic ray muon backgrounds. Given the sufficient time interval of at least 23 ns or more available to impose the timing requirement, in our study we shall assume a efficiency for this requirement in rejecting cosmic ray muons and in retaining the signal events. A detailed GEANT based analysis can pin down the exact efficiency factor, which is beyond the scope of our study.
Let us now recall the relevant neutrino-nucleon scattering rates, focussing in particular on the difference between neutrino and anti-neutrino cross-sections. There are three distinct types of neutrino-nucleon scattering processes that can take place Thomson:2013zua ; Formaggio:2012cpf . At low momentum transfers, there is a quasi-elastic process in which the nucleon changes type but does not break up, with . At slightly higher neutrino energies of the order a few GeV, resonant inelastic processes such as the following have a significant rate: . Finally, at still higher energies, with order GeV for neutrinos and GeV for anti-neutrinos, the neutrino interactions begin to be dominated by the neutrino deep inelastic scattering (DIS) processes: and Formaggio:2012cpf . In all these processes, the neutrino cross-sections are larger than anti-neutrino cross-sections.
The charged current neutrino-nucleon deep inelastic scattering rates, which are the most relevant processes for the neutrino energies of our interest in the ATLAS analysis, can be approximately given for neutrinos by:
| (2) |
with , and , and , , where and refer to protons and neutrons, respectively. Here, is the mass of proton and is the Fermi constant. If we average over the proton and neutron scattering rates, for an isoscalar target, we can write the following combined relations Thomson:2013zua :
| (3) |
and for anti-neutrinos by
| (4) |
As we can see from the above two expressions, the rate is dominated by the quark contribution of , while the anti-quark contribution is helicity suppressed due to the left-handed chirality of neutrinos participating in weak interactions. Conversely, for , the quark contribution is helicity suppressed, leading to a smaller rate. The helicity suppression is lifted as the charged muon energy approaches the incident neutrino energy, in which limit both the cross-sections become the same.
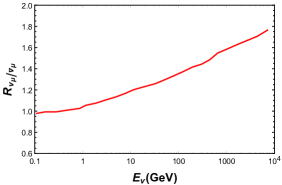
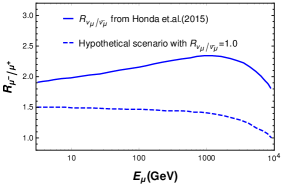
In Fig. 4 (left column), we show the flux ratio for atmospheric muon neutrinos as a function of , with the zenith angle averaged fluxes taken from Honda et al.(2015) Honda:2015fha , for the Kamioka site 444Since there is no atmospheric neutrino flux computation available for the CERN site, we have used the flux predictions for Kamioka, which is at a similar latitude as the CERN Geneva site Latitude .. In the right column of the same figure, we show the expected negative and positive charge muon ratio for contained vertex events at the ATLAS detector as a function of the muon energy , assuming efficiency, with the actual flux ratio (solid line), and for a hypothetical scenario in which (dashed line) for all energies. The line shows the impact of the difference between neutrino and anti-neutrino nucleon cross-sections that we discussed above. The solid line is a convolution of the actual flux ratio and the DIS cross-section differences, and the turnover at energies above a few TeV is expected since the DIS events in this region of muon energy are mostly coming from neutrinos of similar energy, where the DIS cross-sections for neutrinos and anti-neutrinos become similar.
We now discuss the event rates expected at the ATLAS detector — for the contained vertex type events, as well as for the upward-going outside muon events. For a given flux of muon (anti-)neutrinos with energy , producing (anti-)muons with energy at the detector, the contained vertex muon flux is computed as:
| (5) |
where, () are the number densities of nucleons present in the fiducial detector volume. In Table 1, we show the contained vertex events for and , along with their ratios at the ATLAS detector in the central rapidity region for different energy ranges, with ( kiloton days) kiloton-year exposure, satisfying the event selection criteria mentioned in the category column for different energy ranges. As we see from this table, first of all, the total number of events after all selection cuts is significant enough to carry out a contained-vertex event search with -live days of neutrino study. We obtain events, and events with GeV. The energy dependence in is also observed, with a higher ratio at higher energies. The value of averaged over all energies is obtained to be , where we have indicated the expected C.L. statistical error computed by adding the errors in and in quadrature, following Refs. James:1980my ; Helene:1983ph .
|
|
|
|
|
|||||
|---|---|---|---|---|---|---|---|---|---|
| GeV | Only TM | ||||||||
| GeV | Only TM | ||||||||
| GeV | TM M | ||||||||
| GeV | TM M | ||||||||
| Total: GeV |
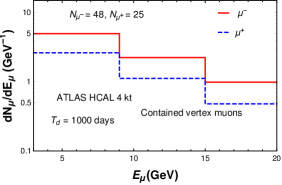
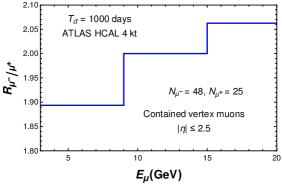
In Fig. 5, we show (left panel) the differential energy distribution of contained vertex events for (solid red line) and (dashed blue line), along with (right panel) their ratio at the ATLAS detector in the central rapidity region as a function of the muon energy , with kiloton-year exposure, satisfying the event selection criteria described earlier. and events with GeV are not shown in these figures, as they are distributed over several bins, making the bin-wise statistical errors larger for those bins. The energy dependence of can be measured with the contained vertex events, with reasonable statistical accuracy, as shown by the figure in the right panel. While we have given the error estimate of above considering all events with GeV, we did not show the error bars in the individual energy bins, as they become larger for the higher energy bins due to smaller number of contained-vertex events – this aspect will be improved upon below for the external rock muon events, with a much larger statistics at ATLAS.
We next discuss the flux of external upward-going muons coming from the charged current muon neutrino interactions in the rock surrounding the detector material. In this case, subsequent to their production, the muons lose energy on the way to the detector, as parametrized by the stopping potential of muons on rock Lohmann:1985qg ; Groom:2001kq . For a neutrino with energy , producing a muon with initial energy , and final energy as it reaches the detector, the flux can be expressed as Gaisser_Book ; Erkoca:2009by ; Covi:2009xn :
| (6) |
The initial energy of the muons is related to the energy as it reaches the detector by the following:
| (7) |
where, we have used the approximate energy independent coefficients for muon energy loss in matter: and Erkoca:2009by ; Covi:2009xn ; Lohmann:1985qg ; Groom:2001kq . Here, is the density of matter surrounding the detector, and assuming it to be rock, we take Lohmann:1985qg ; Groom:2001kq . The effective range of muons, , is defined as the distance from the detector volume to the primary interaction vertex of the neutrinos outside the detector. The maximum possible value of the effective range, , of a muon can be written as a function of measured at the detector and the original neutrino energy as follows Erkoca:2009by :
| (8) |
In addition to the energy loss in rock, muons may also decay while going through the medium before reaching the detector. This effect is taken into account via the survival probability given by Erkoca:2009by :
| (9) |
where, , being the decay length of muon at rest and is the muon mass.
|
|
|
|
||||
|---|---|---|---|---|---|---|---|
| GeV | |||||||
| GeV | |||||||
| GeV | |||||||
| GeV | |||||||
| Total: GeV | 2.05 |
In Table 2, we show the external upward-going charged muon events at the ATLAS detector in the central rapidity region with -live days of neutrino study, for different energy ranges, generated at the rock column below the detector from upward going neutrinos. As we see from this table, the total number of events after all selection cuts is much larger than the contained vertex events — this is because of the larger fiducial mass available in the rock column for neutrino nucleon DIS scattering. Since the muon effective range increases in rock with increasing energy, higher energy muons can come from a larger depth. Therefore, correspondingly, higher energy neutrinos have a larger effective rock volume available for interactions, in addition to having a larger DIS cross-section. Because of this fact, even though the flux of atmospheric neutrinos fall with energy as approximately , the number of produced muons falls with energy much slower. Thus, as far as the total event statistics is concerned, external upward-going charged muon events are more promising. We obtain events, and events with GeV. The energy dependence in is now milder, with a higher ratio at higher muon energies. This is because neutrinos of a range of energies contribute to this class of events with the same muon energy. The value of averaged over all energies is obtained to be , where we have indicated the expected C.L. statistical error James:1980my ; Helene:1983ph , which is smaller than in the contained vertex events scenario.
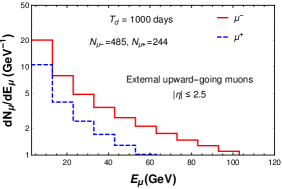
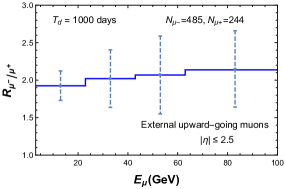
In Fig. 6, we show (left panel) the differential energy distribution of external upward-going events generated at the rock column below the detector from upward going neutrinos for (solid red line) and (dashed blue line), along with (right panel) their ratio at the ATLAS detector in the central rapidity region as a function of the muon energy , with -live days of neutrino study, satisfying the event selection criteria. As discussed in detail in the context of Table 2 above, the statistics is here is much larger, and we can study upto an energy of around 100 GeV, within reasonable errors, as indicated by the C.L. error bars, computed following Refs. James:1980my ; Helene:1983ph .
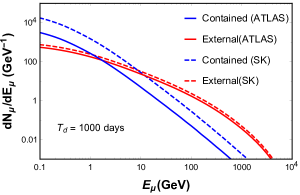
We note that the ratio of contained vertex events and the external upward-going events is different in our analysis, as compared to the one reported in the atmospheric neutrino literature, for example by the Super-Kamiokande collaboration. The primary reason for this is twofold. The number of contained-vertex events is proportional to the detector fiducial mass, which for SK is times larger than the ATLAS HCAL. On the other hand, the number of external upward-going events is proportional to the effective area of the detector exposed to the rock muons, which is similar for the two experiments, with SK having around and ATLAS around , making SK have an effective area bigger by a factor of 1.36. Thus we expect the number of external rock-muon events to be similar in both SK and ATLAS in the full energy range, while the number of contained vertex events should be much larger in SK compared to ATLAS. Both these features are seen in Fig. 7, where we have shown a comparison of the charged current event rates at the Super-Kamiokande and ATLAS detectors with a -live days of exposure, for both contained-vertex type and external upward-going events, without any selection cuts, in the muon energy range of 0.1 GeV to 10 TeV.
The second reason is the different event selection criteria employed in the two experiments. For ATLAS, we have only included events with muon energy GeV. As we can see from Fig. 7, for GeV, ATLAS has many more external rock muon events than contained vertex ones, as we also have found in our numerical analysis above. Since SK uses a much lower threshold of MeV for muon energy, for GeV, they have a much larger number of contained vertex events. These two reasons combined together clearly explain why the ratio of the two types of events at ATLAS found in our analysis is oppositely ordered than in SK analysis 555We thank D. Indumathi for asking us about this comparison between SK and ATLAS.. We have cross-checked our results on both categories of events with the existing literature for detectors such as Super-Kamiokande. Furthermore, the event selection criteria we have used to eliminate cosmic ray muon events leads to a further reduction of around contained vertex events, but no such reduction happens for the typically higher energy external upward-going events.
To summarize our study, as is well-known, the ratio of atmospheric muon neutrinos and anti-neutrinos is an important quantity, for which there is still a large uncertainty in the prediction of the different flux models. Therefore, it is important to be able to directly measure this quantity in neutrino physics experiments, as a function of neutrino energy. However, most neutrino detectors do not distinguish between muon neutrinos and anti-neutrinos. Magnetized detectors can discriminate on an event-by-event basis between (anti-)neutrino induced events by measuring the electric charge of the (anti-)muon: MINOS experiment had such a detector, which reported a measurement of this ratio combining all events, but did not report the energy dependence of it. The large collider detector ATLAS at CERN LHC can be used for this purpose during the periods when the LHC beams are not in circulation – it is sufficiently heavy for neutrino physics (the hadron calorimeter weighs 4 kilotons), and finely instrumented to reject cosmic ray muon backgrounds. We have discussed in detail the distinction between the cosmic ray muons and the signal muons for different category of events, suggesting suitable event selection criteria to eliminate the cosmic ray muon backgrounds. While contained-vertex events are the most striking, upward-going outside events have a better statistics at ATLAS for muon energies greater than 3 GeV, due to the larger fiducial mass available from the rock-column in the earth below the detector. For both these categories, we estimated the event rates expected, after employing suitable event selection criteria necessary to eliminate the cosmic ray muon background. We find that ATLAS, with a 1000-live days of neutrino physics, spanned over a period of 10–15 years especially during the winter months, can accumulate sufficient statistics to study the energy dependence of the charged muon ratio induced by atmospheric neutrinos and anti-neutrinos. With this exposure, we obtain and contained vertex events, and and external upward-going events, after imposing the necessary selection criteria. Therefore, given its possible impact in improving atmospheric neutrino flux models, and consequently in neutrino physics, the ATLAS detector should be utilized for studying atmospheric muon neutrinos and anti-neutrinos, and we hope that further detailed detector-level analyses will be carried out by the ATLAS and CMS collaborations in this regard.
Acknowledgements
We are grateful to Raj Gandhi for several valuable inputs on different neutrino experiments. We are very much thankful to Swagata Mukherjee and Sunanda Banerjee for discussions on trigger, event selection and muon identification at ATLAS/CMS, to Atri Bhattacharya for detailed discussions on the muon (anti-)neutrino fluxes in atmospheric neutrinos, and to Mehedi Masud for help with neutrino oscillations in matter. We also thank Suchandra Dutta, Subir Sarkar, Biplob Bhattacherjee, Rohan Pramanick, Shankha Banerjee, and D. Indumathi for many helpful discussions.
References
- (1) T.K. Gaisser, Cosmic Rays and Particle Physics, Cambridge University Press, 1990.
- (2) L. V. Volkova, “Energy Spectra and Angular Distributions of Atmospheric Neutrinos,” Sov. J. Nucl. Phys. 31, 784-790 (1980).
- (3) M. Honda, M. Sajjad Athar, T. Kajita, K. Kasahara and S. Midorikawa, “Atmospheric neutrino flux calculation using the NRLMSISE-00 atmospheric model,” Phys. Rev. D 92, no.2, 023004 (2015).
- (4) M. Honda, T. Kajita, K. Kasahara and S. Midorikawa, “Improvement of low energy atmospheric neutrino flux calculation using the JAM nuclear interaction model,” Phys. Rev. D 83, 123001 (2011).
- (5) Y. Ashieet al. [Super-Kamiokande], “Measurement of atmospheric neutrino oscillation parameters by Super-Kamiokande I”, Phys. Rev. D 71, 112005 (2005).
- (6) G. Battistoni, A. Ferrari, T. Montaruli and P. R. Sala, “High-energy extension of the FLUKA atmospheric neutrino flux,” [arXiv:hep-ph/0305208 [hep-ph]].
- (7) M. Honda, T. Kajita, K. Kasahara and S. Midorikawa, “A New calculation of the atmospheric neutrino flux in a 3-dimensional scheme,” Phys. Rev. D 70, 043008 (2004).
- (8) G. D. Barr, T. K. Gaisser, P. Lipari, S. Robbins and T. Stanev, “A Three - dimensional calculation of atmospheric neutrinos,” Phys. Rev. D 70, 023006 (2004).
- (9) D. G. Michael et al. [MINOS], “The Magnetized steel and scintillator calorimeters of the MINOS experiment,” Nucl. Instrum. Meth. A 596, 190-228 (2008).
- (10) T. K. Gaisser and T. Stanev, “Charge ratio of muons from atmospheric neutrinos,” Phys. Lett. B 561, 125-129 (2003).
- (11) P. Adamson et al. [MINOS], “Measurements of atmospheric neutrinos and antineutrinos in the MINOS Far Detector,” Phys. Rev. D 86, 052007 (2012)
- (12) G. Aad et al. [ATLAS], “The ATLAS Experiment at the CERN Large Hadron Collider,” JINST 3, S08003 (2008)
- (13) J. Kopp and M. Lindner, “Detecting atmospheric neutrino oscillations in the ATLAS detector at CERN,” Phys. Rev. D 76, 093003 (2007).
- (14) Sunanda Banerjee (CMS), private communication.
- (15) F. Vannucci (private communication), as cited in Petcov ; Kopp:2007ai
- (16) S. T. Petcov and T. Schwetz, Nucl. Phys. B740, 1 (2006).
- (17) A. Y. Wen, C. A. Argüelles, A. Kheirandish and K. Murase, “Detecting High-Energy Neutrinos from Galactic Supernovae with ATLAS,” Phys. Rev. Lett. 132, no.6, 061001 (2024).
- (18) ATLAS Collaboration, “Identification of very-low transverse momentum muons in the ATLAS experiment,” ATL-PHYS-PUB-2020-002.
- (19) J. A. Formaggio and G. P. Zeller, “From eV to EeV: Neutrino Cross Sections Across Energy Scales,” Rev. Mod. Phys. 84, 1307-1341 (2012).
- (20) M. Thomson, “Modern particle physics,” Cambridge University Press, 2013.
- (21) F. James and M. Roos, “Errors on Ratios of Small Numbers of Events,” Nucl. Phys. B 172, 475-480 (1980)
- (22) O. Helene, “Errors in Experiments With Small Number of Events,” Nucl. Instrum. Meth. A 228, 120 (1984)
- (23) We thank Ranjan Laha for raising this point, and M. V. N. Murthy for clarifying it during the talk by one of the authors, S. Mukhopadhyay, at the TAPP 2024 conference at IMSc., Chennai.
- (24) W. Lohmann, R. Kopp and R. Voss, “Energy Loss of Muons in the Energy Range 1-GeV to 10000-GeV,” doi:10.5170/CERN-1985-003
- (25) D. E. Groom, N. V. Mokhov and S. I. Striganov, “Muon stopping power and range tables 10-MeV to 100-TeV,” Atom. Data Nucl. Data Tabl. 78, 183-356 (2001); Tables for muon energy loss are also available at http://pdg.lbl.gov/2009/AtomicNuclearProperties/.
- (26) A. E. Erkoca, M. H. Reno and I. Sarcevic, “Muon Fluxes From Dark Matter Annihilation,” Phys. Rev. D 80, 043514 (2009).
- (27) L. Covi, M. Grefe, A. Ibarra and D. Tran, “Neutrino Signals from Dark Matter Decay,” JCAP 04, 017 (2010).