Point Data for Site-Specific Mid-band Radio Propagation Channel Statistics in the Indoor Hotspot (InH) Environment for 3GPP and Next Generation Alliance (NGA) Channel Modeling
Abstract
Extensive work has been carried out in the past year by various organizations in an effort to determine standardized statistical channel impulse response (CIR) parameters for the newly-released mid-band spectrum (7.25 GHz – 24.25 GHz) [1, 2, 3, 4, 5]. In this work, we show that the wireless community currently lacks a unified method for presenting key parameters required for transparency and utilization by several constituencies when presenting propagation data for use by standard bodies or third parties to create statistical CIR models. This paper aims to solve the existing problem by offering a standard method for providing key propagation parameters such as bandwidth, antenna beamwidth, noise-threshold level, and coarseness in point form, for use in creating standards or comparing parameters, rather than providing commonly-used cumulative distribution function (CDF) plots, which hide the observed key statistics on a location-by-location, point-by-point basis. The method for presenting propagation data, proposed here, may be used for statistical channel modeling of pooled datasets from many contributors, additionally also holding promise for exploring ray-tracing (e.g. site-specific) channel modeling. The indoor hotspot (InH) data collected in Spring2024 at 6.75 GHz and 16.95 GHZ by NYU WIRELESS [1, 2, 3] is provided for the first time in point form, to augment statistical models previously presented solely as CDFs, to demonstrate how a standardized approach to measurement data could allow others to utilize the site-specific locations and key channel parameters observed at each location, to better understand, vet, and build upon statistical or site-specific CIRs from the contributions of many different data sources.
Index Terms:
statistical channel models, ray-tracing, site-specific radio propagation, point dataI Introduction
The global standards bodies, including 3GPP and the Next Generation Alliance (NGA) in North America, have initiated channel modeling activities to harmonize the existing statistical radio propagation channel models for both Frequency Range 1 (FR1) at microwave frequencies (410 to 7125 MHz) [6] and Frequency Range 2 (FR2) bands at millimeter-wave frequencies (24.25 GHz to 52.6 GHz) [7].
Within the past year, regulatory agencies throughout the world have made the mid-band frequencies between 7.25 GHz and 24.25 GHz—denoted as frequency range 3 (FR3)—available for use by the global cellular industry [4, 5, 8, 9]. This new allocation and the promise of cellular service in these spectrum allocations have set off a flurry of radio propagation and channel measurement activities worldwide. Recent research efforts aimed at characterizing and modeling the new mid-band spectrum can be found in [1, 10, 3, 2, 11, 12, 13, 14, 15, 16].
Standards bodies such as 3GPP Radio Access Network (RAN) Technical Specification Group (TSG) and NGA have monthly meetings dedicated to experimental and theoretical findings of mid-band spectrum propagation characteristics. These findings usually provide a limited number of specific observations [17, 18] or statistical models of particular propagation parameters (e.g., path loss, time delay spread, etc.) over a wide range of measured locations [1, 2, 3]. However, only providing the statistical models generated from limited observations make it difficult for industry standard bodies to effectively use them for creating standards or comparing parameters. In this work, we provide offer a standard method for providing propagation parameters on a location-by-location, point-by-point basis. The concept of providing point data was first described in [19], however, it was never adopted to any large extent.
II Prior Work at Mid-band FR3
Several studies studies have reported empirical indoor path loss and delay spread measurements in the FR1(C) and FR3 frequency bands [3, 20, 11, 21, 12, 14, 22, 1, 13, 23, 24, 25]. Authors in [3] provide a summary of previous measurements in Table 2, while providing details about an extensive channel propagation measurement campaign conducted at the NYU WIRELESS Research Center using a 1 GHz bandwidth sliding correlation channel sounder at 6.75 GHz and 16.95 GHz. The campaign revealed an omnidirectional path loss exponent (PLE) of 1.34 in line-of-sight (LOS) and 2.72 in non-LOS (NLOS) at 6.75 GHz, and 1.32 in LOS and 3.05 in NLOS at 16.95 GHz, determined using the close-in (CI) path loss model using a 1 m free-space reference [20]. Zhou et al. [11] conducted propagation measurements in an office corridor at 11 and 14 GHz using a vector network analyzer (VNA)-based channel sounding system with biconical antennas. Their measurements found that the PLE values using the CI model with 1 m reference were 1.52 and 1.59 in LOS conditions, and 3.06 and 2.76 in NLOS conditions at 11 and 14 GHz, respectively. The RMS delay spreads (DS) were 19.5 ns and 17.9 ns in LOS at 11 GHz and 14 GHz, respectively, while they measured 23.43 ns and 22.03 ns at 11 GHz and 14 GHz in NLOS. Authors in [3] observed omnidirectional RMS DS of 37.7 ns and 48 ns at 6.75 GHz and 22.1 ns and 40.7 ns at 16.95 GHz revealing a decreasing DS with increasing frequency. In a separate study, Wei et al. [21] conducted measurements in university corridors at 6 GHz using a multiple-input multiple-output (MIMO) array with a 100 MHz bandwidth and a sliding correlation channel sounder. The RMS delay spreads observed were around 21 ns in LOS and approximately 39 ns in NLOS. Oyie et al. [12] used continuous wave measurements in a university hallway at 14 and 22 GHz with horn antennas (19.5 and 22 dBi gain, respectively) and recorded PLEs of 1.6 and 1.7 in LOS, based on a CI 1 m reference distance. Kim et al. [14], using a MIMO channel sounder transmitting unmodulated tones over a 400 MHz bandwidth at 11 GHz reported a PLE of 1.18 in LOS and 3.28 in NLOS from a CI model fit on the path loss with a 1 m reference distance. Swept narrowband measurements from 14-17 GHz using a VNA in [22] observed RMS DS of 2.7 ns and 12.5 ns in LOS and NLOS respectively. The same measurements revealed RMS Angluar Spread (AS) of 5.4∘ for the directional measurements with a 10∘ half-power beamwidth antenna. The campaign in [1] observed wide omnidirectional RX AS of 40.9∘ LOS and 58.2∘ NLOS at 6.75 GHz and 34.2∘ LOS and 43.5∘ NLOS at 16.95 GHz, suggesting a spatial richness of multipath.
VNA-based propagation measurements were reported in [13] in indoor office and laboratory environments at frequencies of 2.4, 4.75, and 11.5 GHz with bandwidths of 500 MHz and 1 GHz. They reported LOS PLEs of 1.86, 1.98, and 1.94, and NLOS PLEs of 3.33, 3.75, and 4.46 at a 1 m reference distance for the respective frequencies. In another study, authors in [23] observed a PLE of approximately 1.8 for indoor environments with a 1 m reference in LOS at 1.4 and 4 GHz, suggesting a waveguiding effect at these frequencies. Authors in [24] investigated diffraction loss around drywall, plastic, and wooden corners at 10, 20, and 26 GHz and found that results closely matched the Knife Edge Diffraction (KED) model. In another study, Miao et al. [25] analyzed RMS delay spreads in outdoor-to-indoor (O2I) environments at 3.3, 6.5, 15, and 28 GHz, noting larger delay spreads for O2I than outdoor scenarios, but with no clear frequency trend.
III A New-Data Approach to Propagation Measurement Reporting and Modeling for Pooled Datasets
While most of the works reported above have yielded valuable statistical models from the empirical data, none of the papers reported in the literature have offered a standardized approach that fosters understanding such that any party could read the paper, and be able to understand the site-specific nature of the reported measurement. The point data concept was first described in [19], but this concept was never adopted to any large extent. In other words, the works reported to date do not allow a standard body or large group constituencies to understand the particular measurement values of particular parameters at a specific point or location in an environment. Rather, only statistical distributions, such as CDFs or scatter plots, are offered, making it challenging to rapidly match particular measured values to particular locations or points on a map or in an environment.
At NYU WIRELESS, an intense measurement campaign using a 1 GHz wideband channel sounder at 6.75 GHz and 16.95 GHz was undertaken from February 20 to May 30, 2024, to determine the radio propagation characteristics for a typical indoor office environment at the NYU WIRELESS laboratory on the 9th floor of the 370 Jay Street building in Brooklyn – an environment denoted as Indoor Hotspot (InH) within 3GPP, as well as extensive Urban Microcell (UMi) measurements in downtown Brooklyn which included the Tandon School of Engineering Courtyard and many street blocks surrounding the campus. In addition, the NYU Tandon School of Engineering Makerspace factory setting was measured extensively to provide Indoor Factory (InF) propagation data at these two mid-band carrier frequencies. In total, over 230 GB of propagation data were measured in the indoor, urban microcell, and factory environments.
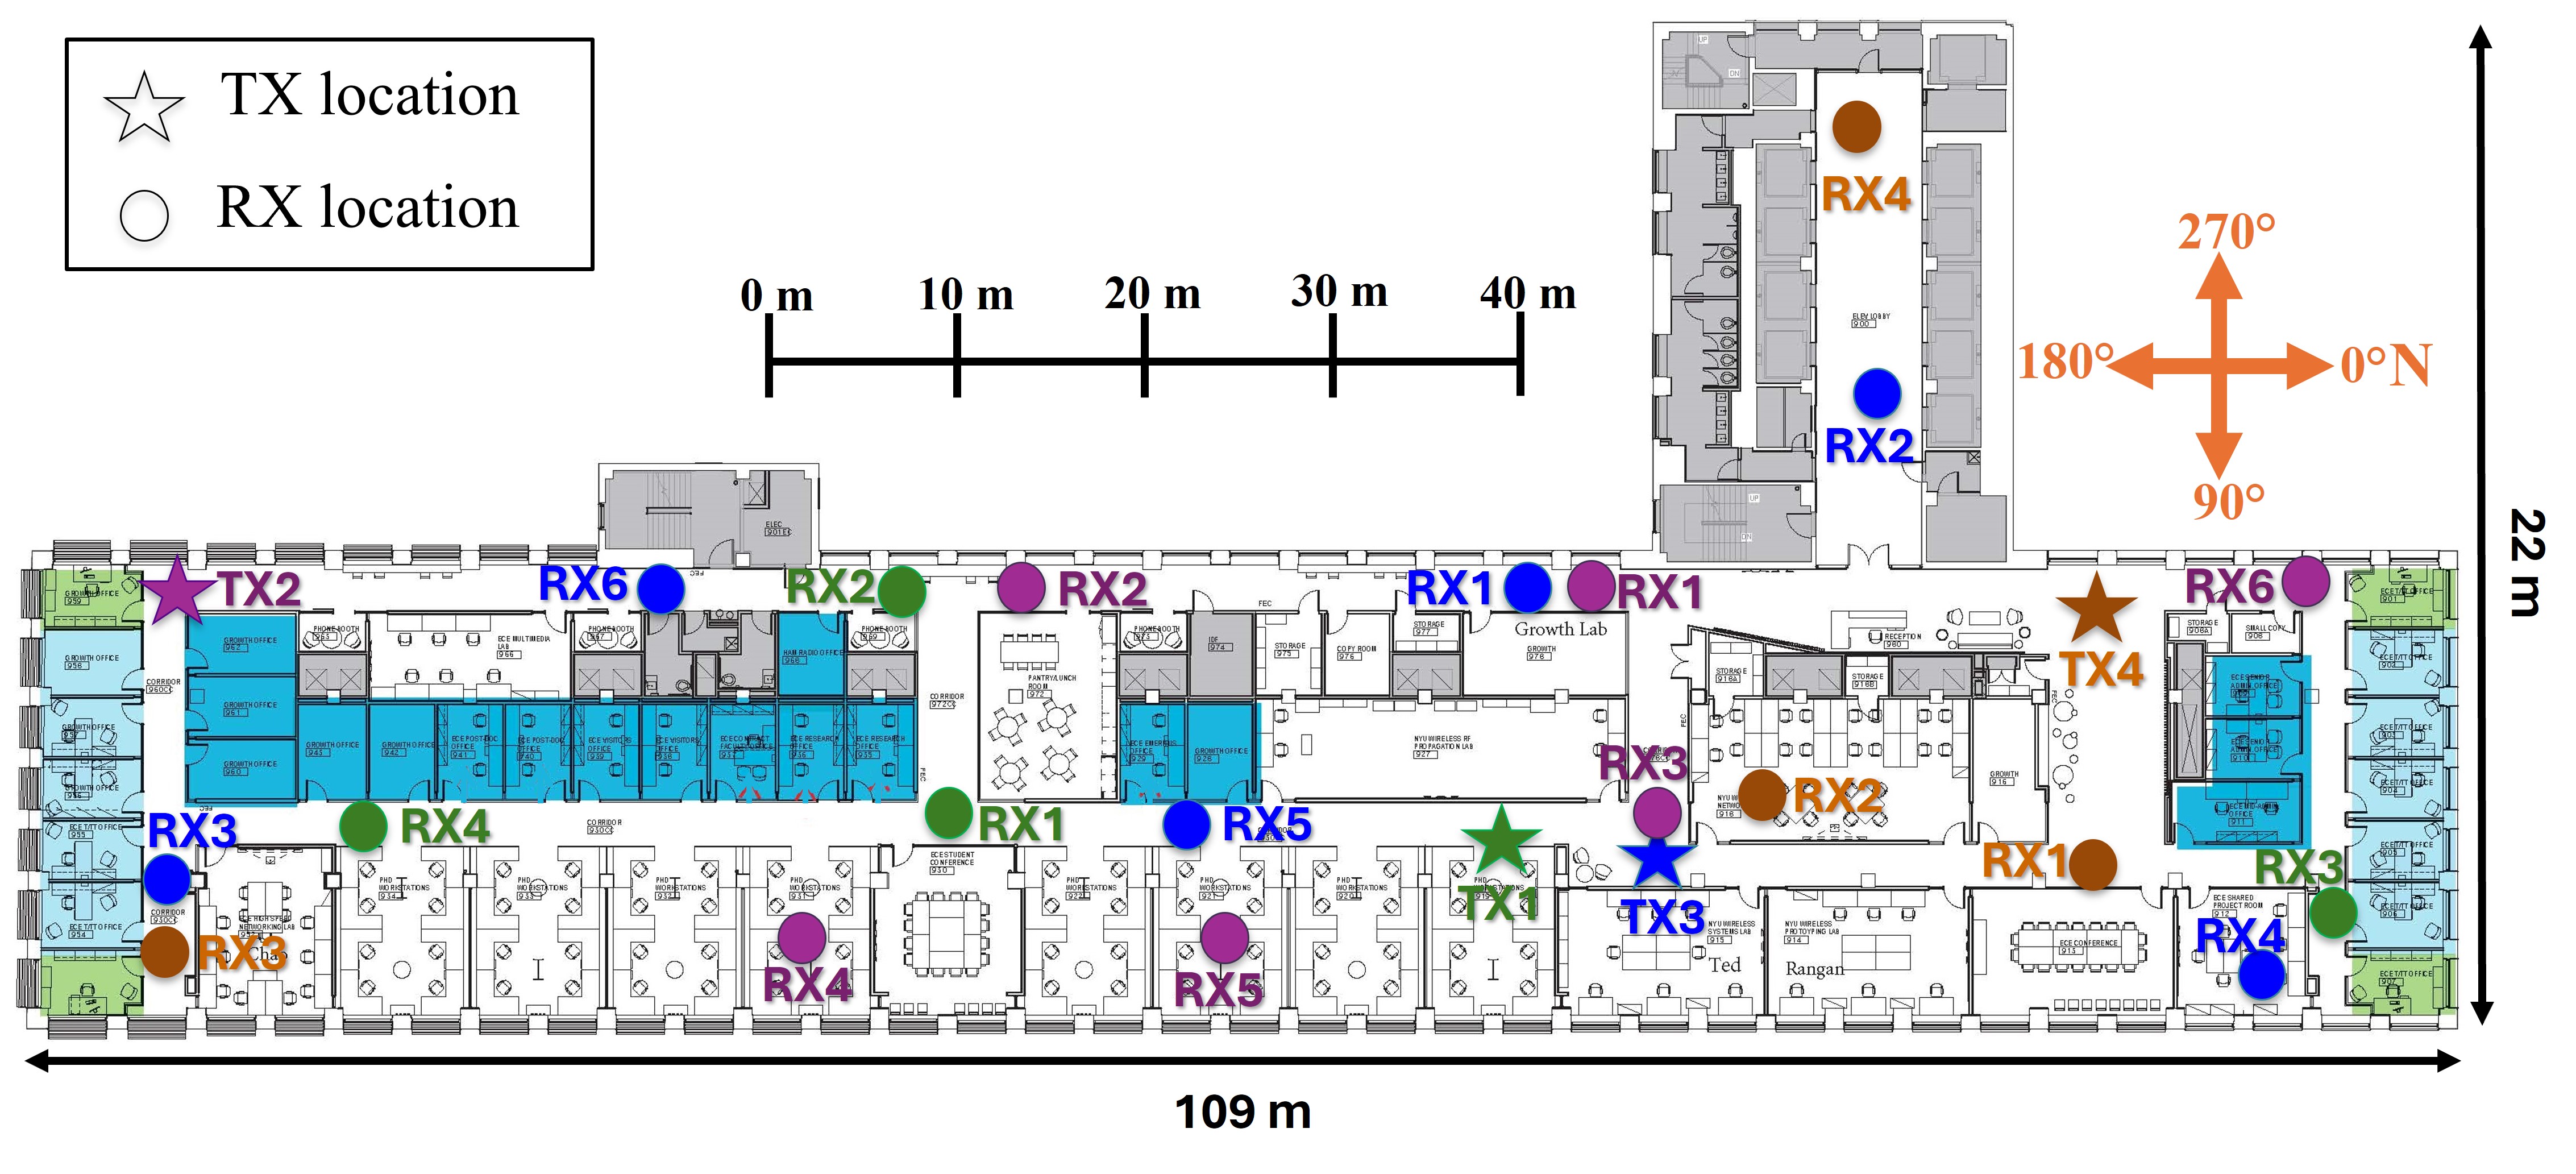
Indoor Hotspot (InH) environment in Fig. 1(a) shows the NYU WIRELESS Research Center, 370 Jay Street, Brooklyn, NY. It features a typical office layout with multiple office rooms and corridors, covering an area of 109 m by 22 m. A total of 20 TX-RX pairs were measured, as indicated as points on the map of Fig. 1 (a), with T-R separation distances ranging from 13 m to 97 m. The measurements included 7 LOS and 13 NLOS scenarios, demonstrating varied indoor conditions across different office rooms and hallways. No outages were observed in the InH campaign. 110 GB of propagation data were collected in this enviroment.
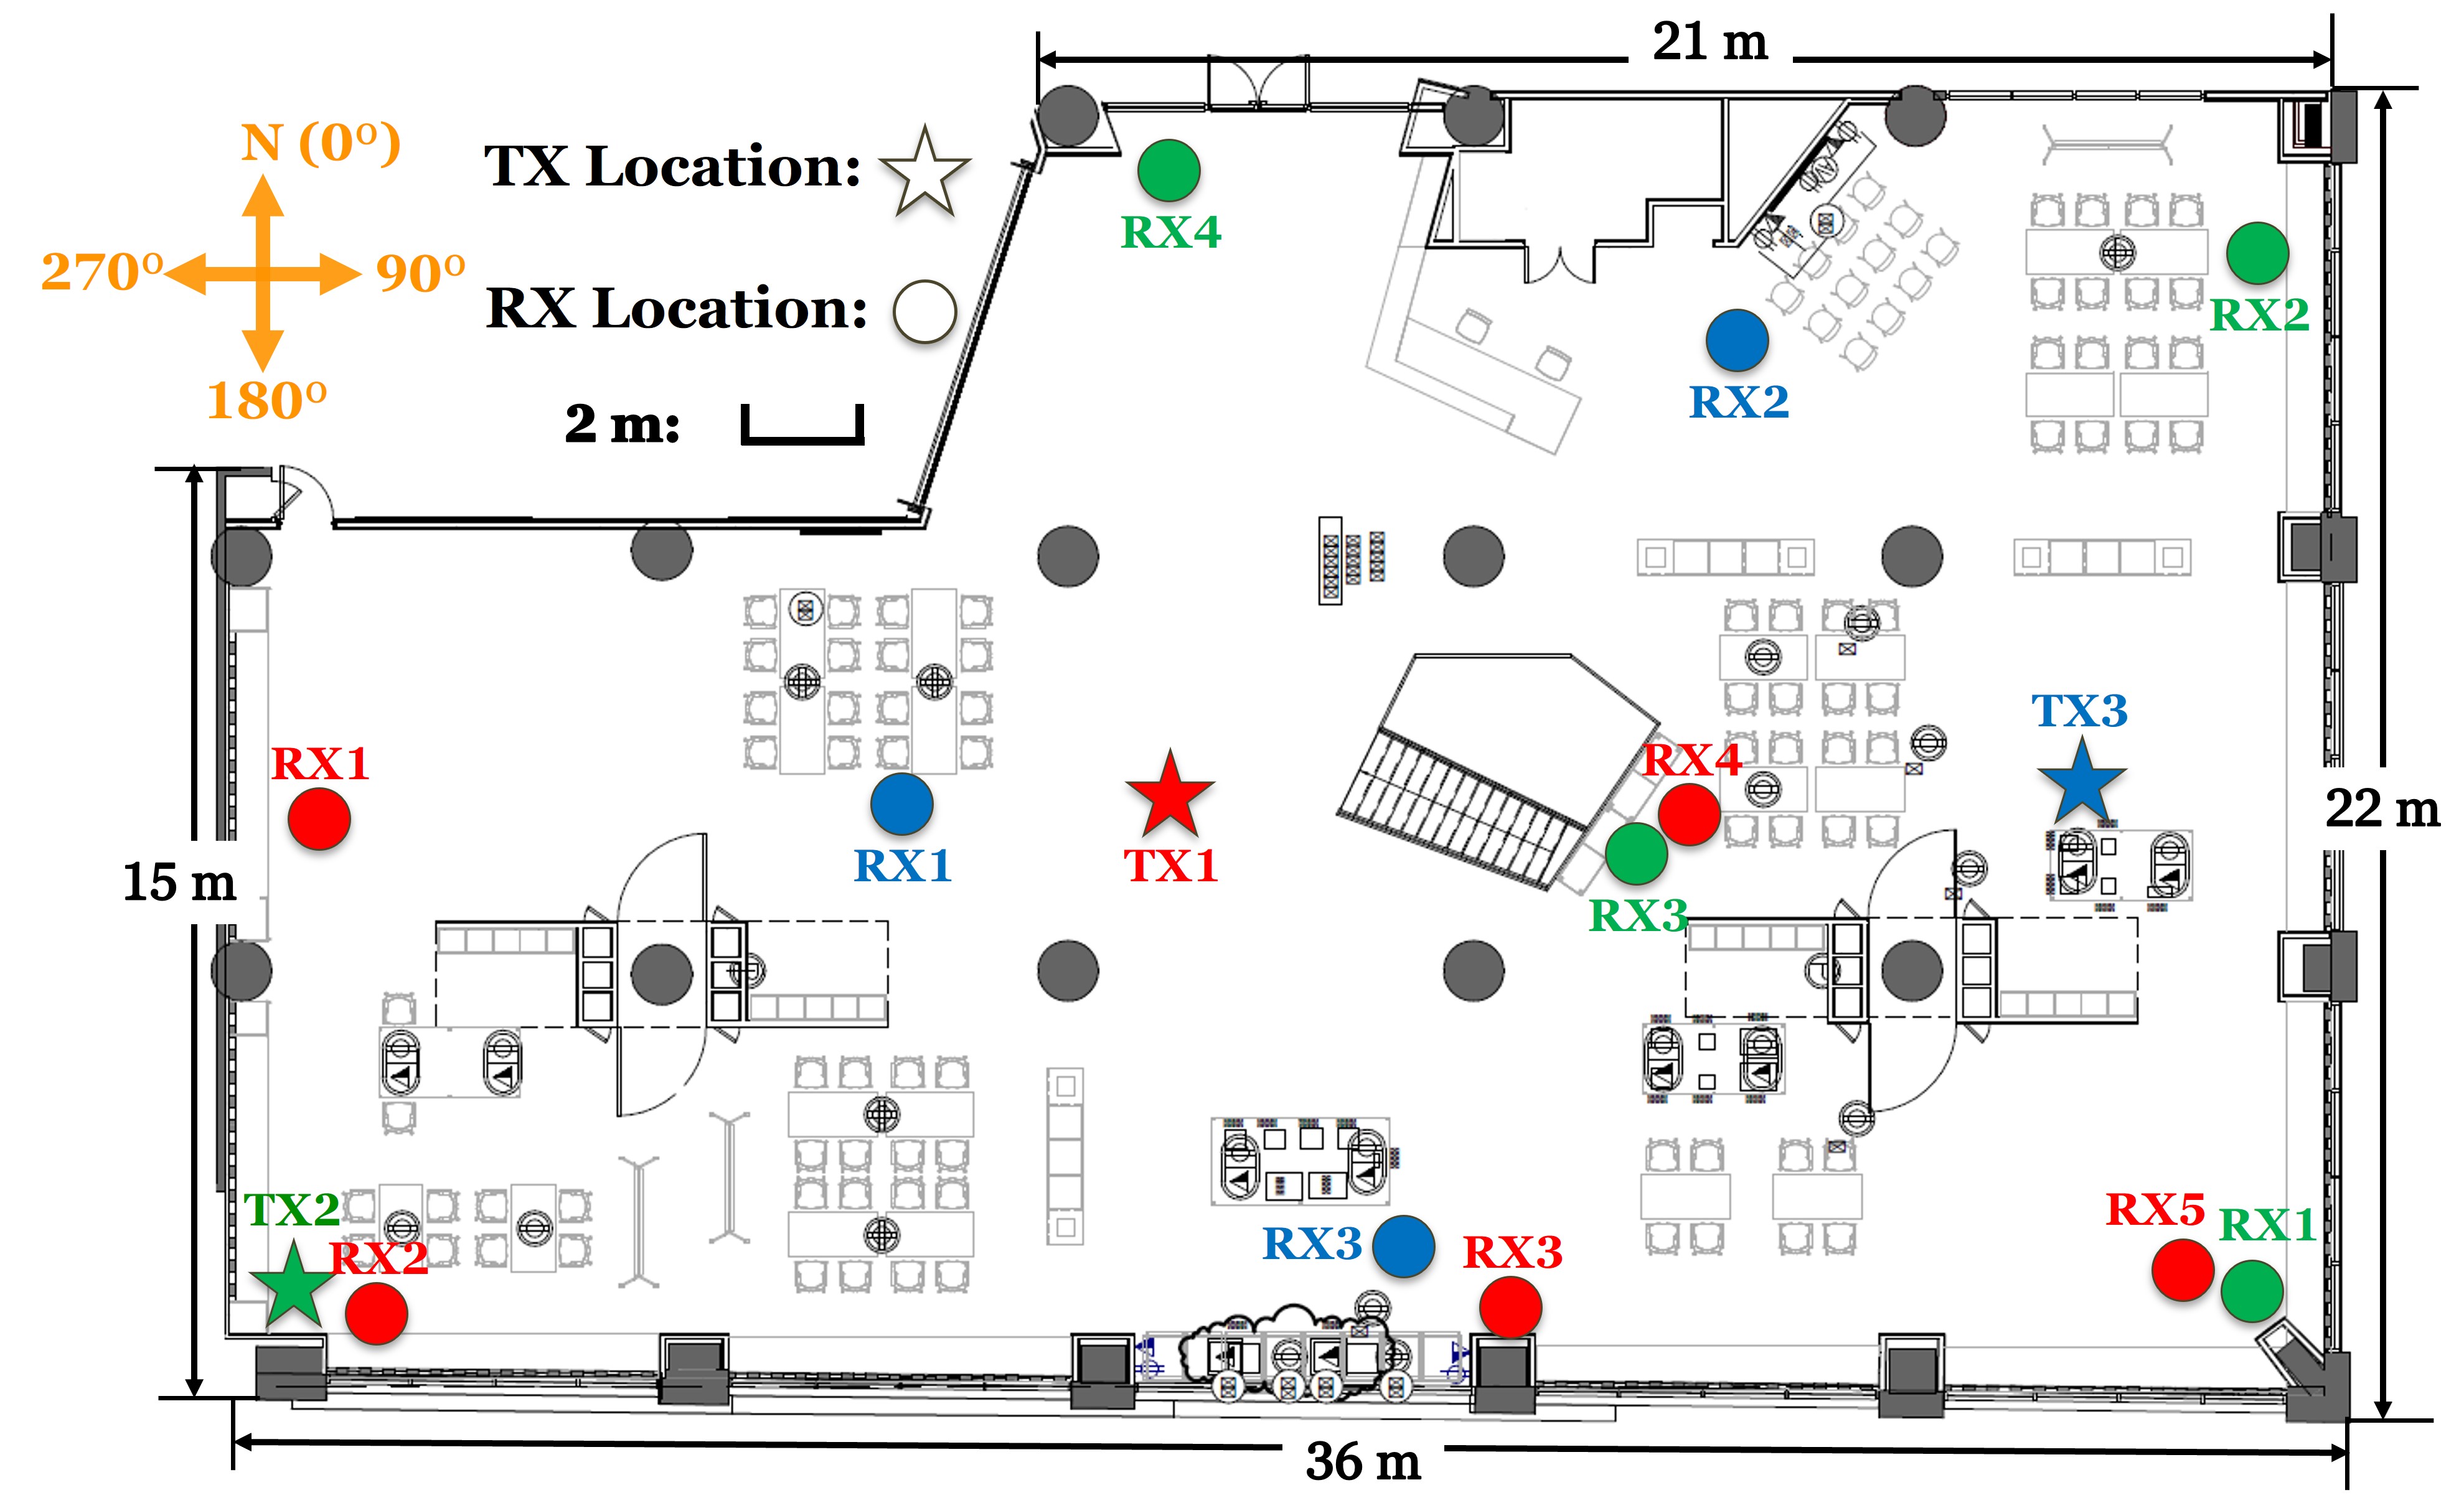
Indoor Factory (InF) environment shown in Fig. 1(b) illustrates the NYU MakerSpace located at 6 MetroTech, Brooklyn, NY. It has an open layout resembling a manufacturing floor equipped with 3D printers, laser cutters, CNC milling machines, imaging tools, PCB construction stations, heating tools, etc. The campaign included 12 TX-RX pairs, with distances ranging from 9 m to 38 m, capturing 5 LOS and 7 NLOS scenarios with no outages. 45 GB of propagation data were collected in this environment.
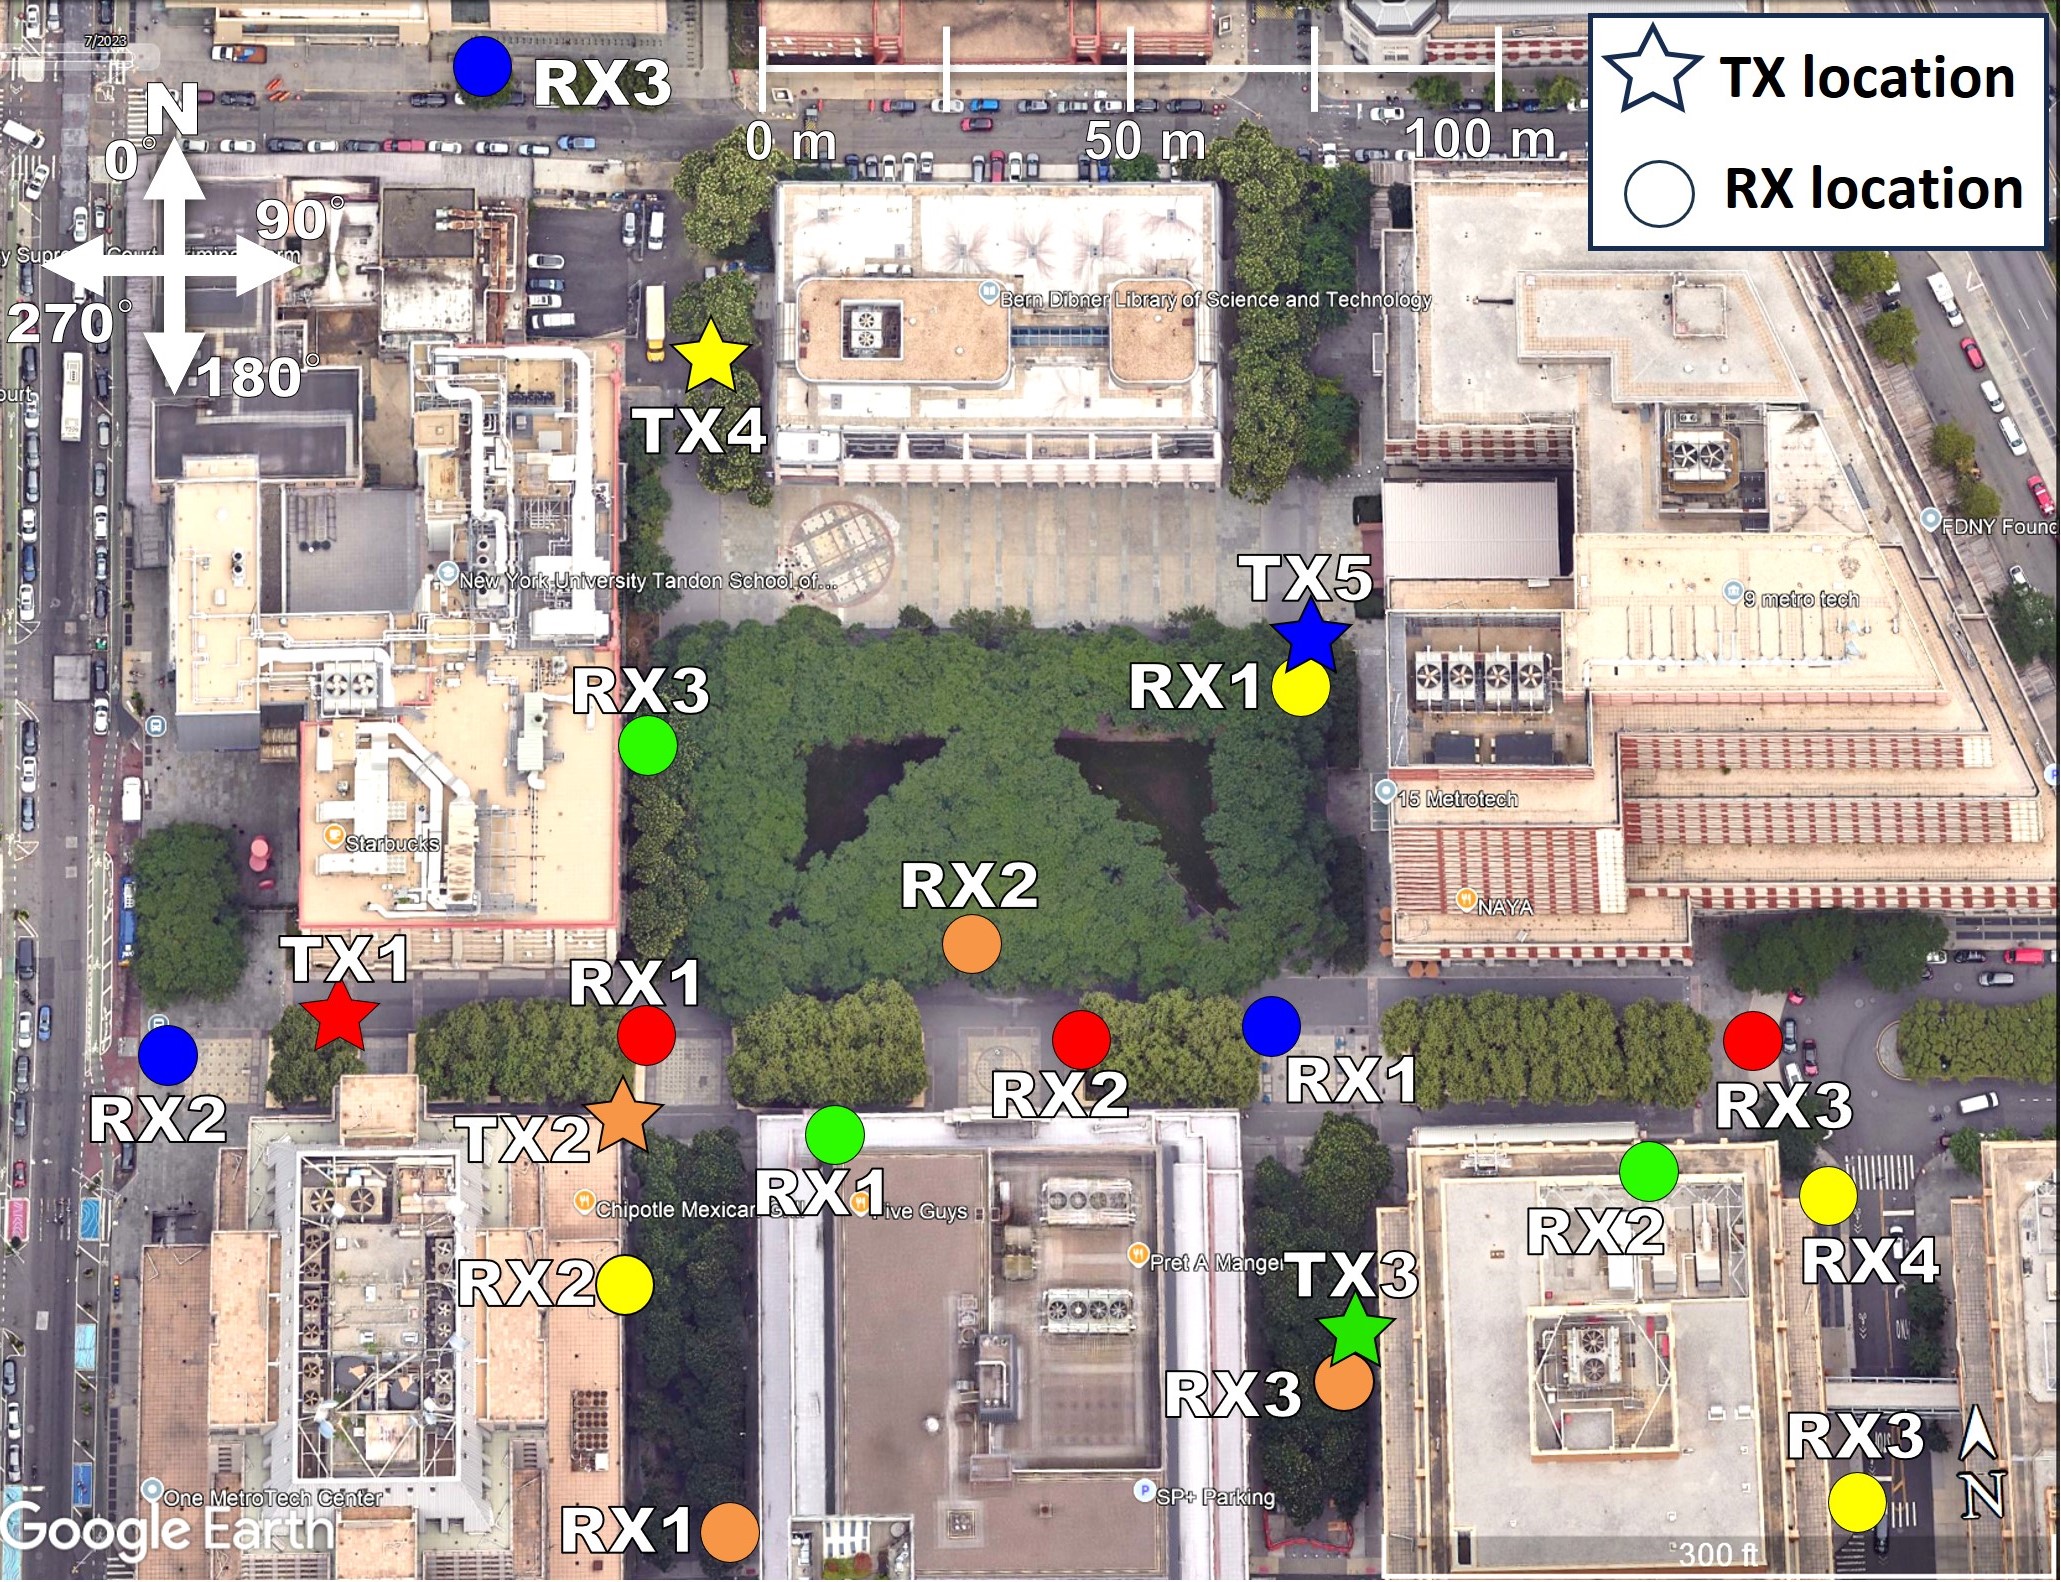
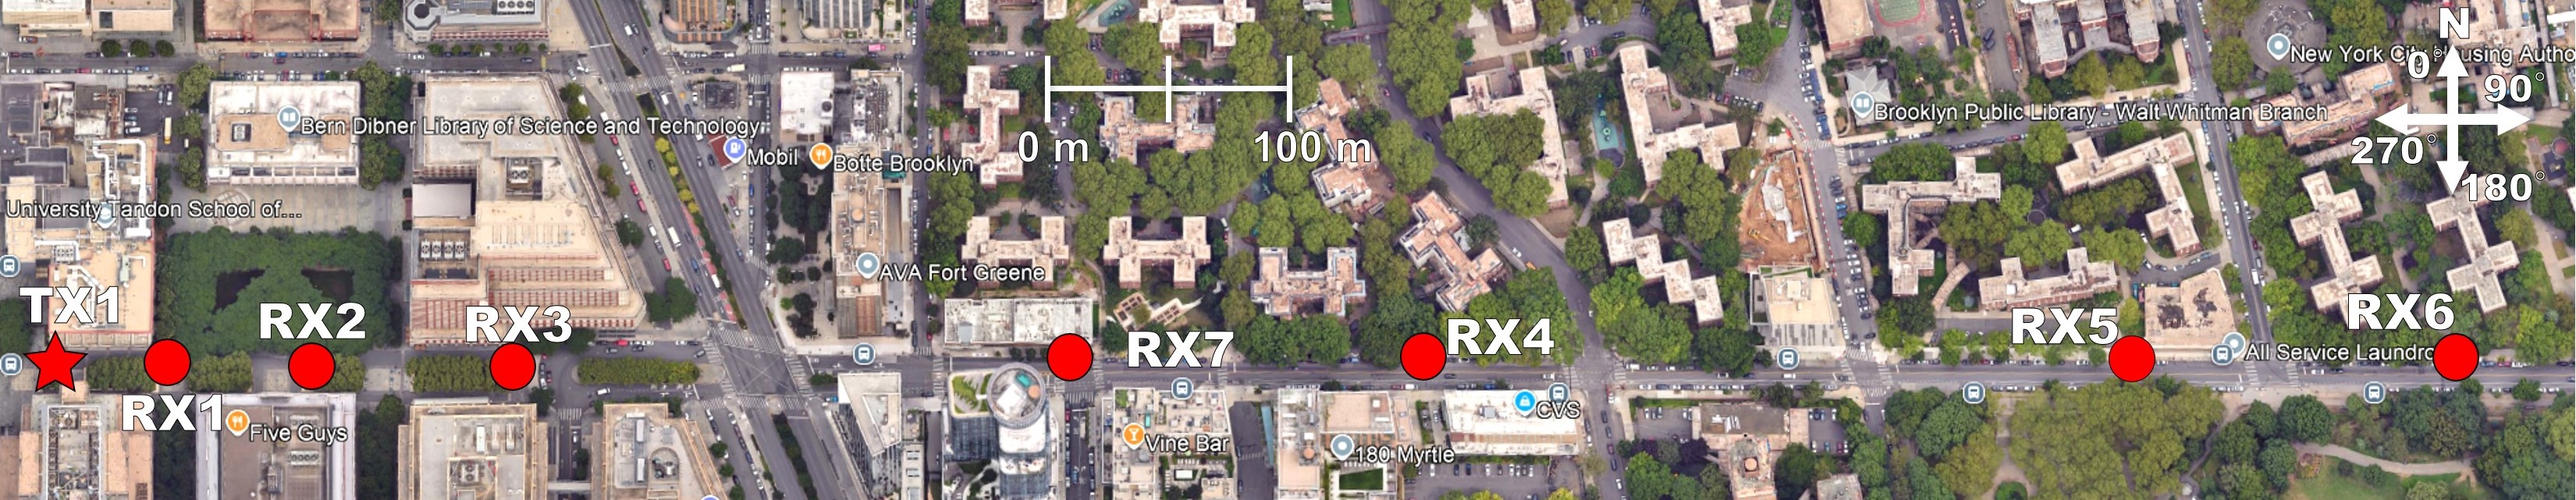
Urban Microcell (UMi) environment captured in Fig. 1(c) and Fig. 1(d) is an outdoor area around the MetroTech commons at NYU. It is representative of the dense urban environment of New York City. A total of 20 TX-RX pairs were measured, with separation distances ranging from 35 m up to 1 km, including 6 LOS and 14 NLOS scenarios, as indicated specifically by points on the map shown in Fig. 1 (c) and Fig. 1 (d). The two maps shown in Fig. 1 (c) and (d) depict all the TX-RX separations: Fig. 1 (c) shows TX-RX locations separated up to 216 m covering the Tandon School of Engineering courtyard, and Fig. 1 (d) with TX-RX distances extending up to 1 km. Two outages (TX1-RX6 and TX4-RX3) are observed during the UMi measurement campaign. 75 GB of propagation data were collected in this environment.
| Freq. | TX | RX | Loc. | TR Sep. | Omni Abs PL | Mean Dir. DS | Omni DS | Mean Lobe ASA | Omni ASA | Mean Lobe ASD | Omni ASD | Mean Lobe ZSA | Omni ZSA | Mean Lobe ZSD | Omni ZSD |
| [GHz] | [m] | [dB] | [ns] | [ns] | [∘] | [∘] | [∘] | [∘] | [∘] | [∘] | [∘] | [∘] | |||
| 6.75 | TX1 | RX1 | LOS | 24.6 | 68.2 | 24.6 | 21.4 | 0.0 | 0.0 | 0.0 | 48.2 | 0.0 | 0.0 | 0.0 | 0.0 |
| RX2 | NLOS | 27 | 88.6 | 23.7 | 77.4 | 39.4 | 74.8 | 7.9 | 57.3 | 3.8 | 4.0 | 0.0 | 0.0 | ||
| RX3 | NLOS | 37.6 | 89.9 | 80.0 | 62.6 | 28.7 | 55.9 | 8.8 | 32.9 | 11.1 | 13.1 | 0.0 | 0.5 | ||
| RX4 | LOS | 51 | 79.2 | 16.2 | 47.5 | 4.6 | 59.3 | 4.1 | 86.5 | 5.9 | 4.6 | 1.1 | 2.4 | ||
| TX2 | RX1 | LOS | 64 | 73 | 27.9 | 100.0 | 0.3 | 68.7 | 2.7 | 68.5 | 2.1 | 3.8 | 0.0 | 0.0 | |
| RX2 | LOS | 37.2 | 70.7 | 27.3 | 69.6 | 0.0 | 0.0 | 11.4 | 74.6 | 0.0 | 0.0 | 0.0 | 0.4 | ||
| RX3 | NLOS | 67.3 | 103 | 33.3 | 47.0 | 7.6 | 49.7 | 0.0 | 55.3 | 5.2 | 3.5 | 0.0 | 0.0 | ||
| RX4 | NLOS | 32.2 | 98.3 | 35.0 | 50.5 | 11.7 | 69.8 | 13.5 | 55.5 | 0.0 | 0.0 | 0.0 | 0.0 | ||
| RX5 | NLOS | 49 | 111.2 | 50.6 | 67.0 | 35.3 | 52.7 | 12.6 | 46.2 | 0.0 | 0.0 | 0.0 | 0.0 | ||
| RX6 | LOS | 97 | 72.2 | 42.5 | 58.0 | 0.0 | 76.8 | 0.0 | 72.2 | 0.0 | 0.0 | 0.0 | 0.0 | ||
| TX3 | RX1 | NLOS | 12.3 | 72.6 | 7.3 | 27.7 | 10.3 | 50.2 | 12.3 | 71.7 | 0.9 | 0.7 | 4.2 | 6.9 | |
| RX2 | NLOS | 22.3 | 94.9 | 24.5 | 62.2 | 3.9 | 62.1 | 6.2 | 21.7 | 0.0 | 0.0 | 3.8 | 8.0 | ||
| RX3 | NLOS | 65.6 | 88.8 | 18.9 | 32.9 | 38.2 | 68.0 | 1.0 | 61.0 | 6.9 | 4.2 | 2.0 | 1.5 | ||
| RX4 | NLOS | 30 | 90.1 | 26.2 | 37.4 | 50.7 | 50.7 | 4.0 | 23.9 | 0.0 | 0.0 | 3.2 | 6.3 | ||
| RX5 | LOS | 19.3 | 64.8 | 13.3 | 9.1 | 0.0 | 0.0 | 2.4 | 51.5 | 0.0 | 0.0 | 1.5 | 0.9 | ||
| RX6 | NLOS | 49.5 | 105 | 14.6 | 18.8 | 0.0 | 0.0 | 6.7 | 20.7 | 0.0 | 0.0 | 9.3 | 9.2 | ||
| TX4 | RX1 | LOS | 11.4 | 59 | 6.3 | 20.8 | 14.0 | 77.8 | 7.6 | 68.3 | 2.4 | 2.4 | 0.0 | 0.0 | |
| RX2 | NLOS | 17.1 | 68 | 20.6 | 41.9 | 37.1 | 57.9 | 20.9 | 68.8 | 0.0 | 0.0 | 3.1 | 4.7 | ||
| RX3 | NLOS | 87 | 94.2 | 6.3 | 23.4 | 14.8 | 73.0 | 0.0 | 53.3 | 0.0 | 0.0 | 0.0 | 0.0 | ||
| RX4 | NLOS | 23.5 | 73.2 | 28.5 | 88.3 | 14.5 | 84.5 | 14.5 | 41.8 | 0.0 | 0.0 | 0.0 | 0.0 | ||
| 16.95 | TX1 | RX1 | LOS | 24.6 | 73.8 | 14.0 | 15.6 | 0.9 | 6.7 | 1.2 | 65.3 | 0.3 | 0.3 | 0.0 | 0.0 |
| RX2 | NLOS | 27 | 98.9 | 8.7 | 40.4 | 10.6 | 64.7 | 4.9 | 30.1 | 5.8 | 4.4 | 0.0 | 0.0 | ||
| RX3 | NLOS | 37.6 | 100.9 | 18.4 | 51.3 | 3.9 | 45.3 | 4.3 | 22.9 | 0.1 | 0.2 | 2.2 | 2.2 | ||
| RX4 | LOS | 51 | 83.8 | 18.4 | 10.0 | 3.2 | 3.2 | 1.8 | 79.0 | 0.0 | 0.0 | 0.0 | 0.0 | ||
| TX2 | RX1 | LOS | 64 | 82.6 | 22.2 | 21.3 | 0.0 | 71.6 | 0.0 | 61.1 | 0.0 | 0.0 | 0.0 | 0.2 | |
| RX2 | LOS | 37.2 | 79.3 | 22.6 | 27.3 | 0.1 | 0.1 | 2.3 | 58.4 | 5.7 | 5.7 | 1.1 | 2.9 | ||
| RX3 | NLOS | 67.3 | 109.7 | 37.7 | 46.6 | 15.2 | 15.2 | 0.0 | 77.4 | 0.0 | 0.0 | 3.2 | 5.8 | ||
| RX4 | NLOS | 32.2 | 107.9 | 13.2 | 45.1 | 2.1 | 46.4 | 8.6 | 91.6 | 0.0 | 0.0 | 0.0 | 0.0 | ||
| RX5 | NLOS | 49 | 124.4 | 4.9 | 16.5 | 0.0 | 13.9 | 0.0 | 0.0 | 0.0 | 0.0 | 0.0 | 0.0 | ||
| RX6 | LOS | 97 | 80.3 | 41.9 | 60.2 | 0.1 | 0.1 | 0.0 | 62.1 | 0.0 | 0.0 | 0.0 | 0.0 | ||
| TX3 | RX1 | NLOS | 12.3 | 87.3 | 5.2 | 23.8 | 6.0 | 68.0 | 4.6 | 73.4 | 2.3 | 1.6 | 0.0 | 0.0 | |
| RX2 | NLOS | 22.3 | 111.3 | 25.6 | 65.7 | 6.2 | 6.2 | 5.7 | 48.8 | 0.0 | 0.0 | 0.0 | 0.0 | ||
| RX3 | NLOS | 65.6 | 100.5 | 19.3 | 31.3 | 32.2 | 72.3 | 0.8 | 48.5 | 4.4 | 7.0 | 0.1 | 0.3 | ||
| RX4 | NLOS | 30 | 96.8 | 14.4 | 51.6 | 15.6 | 54.6 | 7.0 | 11.6 | 4.9 | 4.8 | 0.0 | 0.0 | ||
| RX5 | LOS | 19.3 | 73.2 | 12.1 | 9.1 | 0.9 | 0.9 | 0.0 | 57.3 | 4.7 | 4.7 | 0.0 | 0.0 | ||
| RX6 | NLOS | 49.5 | 119.7 | 11.5 | 17.8 | 4.8 | 4.8 | 4.6 | 51.6 | 3.6 | 3.6 | 2.4 | 6.7 | ||
| TX4 | RX1 | LOS | 11.4 | 67.2 | 2.1 | 11.4 | 3.8 | 56.1 | 9.2 | 58.0 | 2.3 | 1.2 | 2.3 | 1.8 | |
| RX2 | NLOS | 17.1 | 93.3 | 15.1 | 52.1 | 14.3 | 83.8 | 14.7 | 66.8 | 1.7 | 3.1 | 0.0 | 0.0 | ||
| RX3 | NLOS | 87 | 110.7 | 9.7 | 9.4 | 6.7 | 6.7 | 5.5 | 5.5 | 1.6 | 1.6 | 0.0 | 0.0 | ||
| RX4 | NLOS | 23.5 | 91.9 | 17.8 | 76.9 | 9.1 | 81.7 | 19.7 | 46.4 | 0.0 | 0.0 | 0.0 | 0.0 |
The extensive InH statistical results (e.g. CDFs and scatter plots) of the propagation parameters observed within the shown in Fig. 1 (a) were recently published in [1, 10, 3, 2], but when offering these results to industrial participants of 3GPP, it became clear that companies find it difficult, if not impossible, to use the statistical results of the measured data given in [1, 10, 3] to compare with their own measurements in their own measured environments, or to build a pool of statistical parameters from many different contributors from which to derive a statistical model for the new upper mid-band FR3 spectrum. To solve the current problem with industry standards bodies, here we propose a method for demonstrating the site-specific dependency of measured parameters, so that traditional statistical results such as those given in [1, 10, 3] may be computed and reproduced by any third party readily, but also so that the reported measurements may be interpreted in a point-form along with a site-specific representation (e.g., a map or a computerized model of the environment), so that each point measurement is described both with a site-specific representation (e.g. a location within a map of the environment with site-specific locations of the TX, RX and key obstructions and reflecting items). To provide point-data, one merely needs to provide a detailed map of the environment along with a multidimensional table that specifies the exact statistics measured from the local power delay profile and angular profiles measured at each specified location, or point, within the environment. By representing data in this manner, it becomes possible to use point data (e.g., channel parameters measured at a point in space, with such location in space denoted on a map or computerized representation of space) in order to characterize extensive propagation measurement campaigns in a standardized, site-specific manner for easy pooling of data and interpretation of results. It should be clear to the reader that such a multidimensional table (See Section IV) readily permits the computation of traditional CDFs and scatter plots but also offers a powerful way to create accurate ray-tracing models, or to use pooled data sets for artificial intelligence and machine learning of both statistical and site-specific models from reported measurements. The following section now demonstrates the proposed method, using the extensive measurements produced in [1, 10, 3].
Before presenting the point data representation, however, it should be clear that channel sounding systems of different bandwidths or different antenna patterns will have different degrees of resolution when providing point measurements [26], so the bandwidth should be specified in pooled data sets such that the lowest common denominator (e.g., the coarsest resolution, or omnidirectional angular statistics with antenna patterns deembedded) is used as the baseline. Nevertheless, basic channel parameters, such as bandwidth, noise-threshold level, antenna beamwidth, and time resolutions, as defined and used by 3GPP as defined in Section IV, could be provided on a best-effort basis, all in point form, and CDFs and scatter plots could readily be created and updated from the growing pool of data whenever additional data is supplied by a company or contributor in standardized point form. Such an approach which we now propose could also be used to institute a required or preferred standard range of bandwidths, noise-thresholds, time resolutions, etc. for pooling of data in the standard setting process.
IV Point Data Representation of InH Results [1, 10, 2, 3]
The data points in Table I represent the point data set for the NYU WIRELESS InH measurement campaign [1, 3, 2], and summarize large-scale spatio-temporal statistics from the indoor office InH channel measurements at the NYU WIRELESS center, at the points in space shown in Fig. 1 (a). The measurement campaign spanned 20 TX-RX locations with 7 in LOS and 13 in NLOS, as noted in the first five columns of Table I. No outages were recorded for any of the locations covering the 11 to 97 m TX-RX separation distances. Each column presents specific calculated statistics for large-scale parameters at the particular points in space denoted by columns 2 and 3 that describe the wireless propagation behavior and may be used for understanding particular site-specific channel parameters at specified TX, and RX points in space, and also, when considered over the entire measured points of the campaign (e.g. across the entire Table I), for generating CDFs and curve fitting for model parameterization. The key parameters shown in Table I, that are vital for use in 3GPP and NGA and other standard body proceedings, are described as follows:
-
•
Freq. shows the frequency band in GHz.
-
•
TX indicates the TX location in the InH environment, shown in Fig. 1(a).
-
•
RX indicates the RX location in the InH environment corresponding to each TX location, shown in Fig. 1(a).
-
•
Loc. denotes the location type as being ‘LOS’ or ‘NLOS’.
-
•
TR Sep. indicates the TX-RX separation in meters.
-
•
Omni Abs PL represents absolute omnidirectional path loss measured at a TX-RX location with antenna gains removed from consideration, expressed in dB [3].
-
•
Mean Dir. DS denotes the mean of the directional delay spreads from the directional PDPs captured at each TX-RX location pair, expressed in nanoseconds [3].
-
•
Omni DS denotes the omnidirectional delay spread at each TX-RX location pair, expressed in nanoseconds [3].
-
•
Mean Lobe ASA denotes the mean of the lobe azimuth spreads in the multiple spatial lobes in the RX AOA PAS at each TX-RX location pair, expressed in degrees [2].
-
•
Omni ASA denotes the azimuth spread of arrival for the RX AOA PAS at each TX-RX location pair, expressed in degrees [2].
-
•
Mean Lobe ASD denotes the mean of the lobe azimuth spreads in the multiple spatial lobes in the TX AOD PAS at each TX-RX location pair, expressed in degrees [2].
-
•
Omni ASD denotes the azimuth spread of departure for the TX AOD PAS at each TX-RX location pair, expressed in degrees [2].
-
•
Mean Lobe ZSA denotes the mean of the lobe zenith spreads in the multiple spatial lobes in the RX AOA PAS at each TX-RX location pair, expressed in degrees [2].
-
•
Omni ZSA denotes the zenith spread of arrival for the RX AOA PAS at each TX-RX location pair, expressed in degrees [2].
-
•
Mean Lobe ZSD denotes the mean of the lobe zenith spreads in the multiple spatial lobes in the TX AOD PAS at each TX-RX location pair, expressed in degrees [2].
-
•
Omni ZSD denotes the zenith spread of departure for the TX AOD PAS at each TX-RX location pair, expressed in degrees [2].
The above channel parameters and the point-specific values given in Table I, when combined with the presentation of the InH Map environment given in Fig. 1 (a), offer a new way for researchers to supply propagation measurement data in a way that enables point-level understanding. Such data given in Table I and the map in Figure 1 may be used as a standard from which further research and standard-setting activities can be derived. It is important to note that the conventional method of creating CDFs or scatter plots may easily be performed using Table 1, without the use of any other site-specific information other than denoted in the columns of Table I.
V Conclusion
Extensive work is ongoing to determine statistical channel models for the FR2 mid-band spectrum. In this paper, we highlighted the activity to measure and model the FR3 bands and presented a novel approach to allow the presentation of propagation data in a point form with site-specific information. If industry and academia followed such a convention, it would become extremely easy for standard bodies or other organizations to pool data sets from many sources for comparison, combination, and assessment. Further, such a standard approach for data presentation could drive other standard-setting behaviors, such as bounding the time and frequency and angular/spatial resolution of particular measurement campaigns for inclusion in such data sharing, data pooling, and data aggregation.
Acknowledgment
The authors thank Hitesh Poddar and others at Sharp Laboratories of America for pointing out the need for point data in site-specific form in 3GPP and other standard bodies.
References
- [1] D.Shakya et al., “Propagation measurements and channel models in Indoor Environment at 6.75 GHz FR1(C) and 16.95 GHz FR3 Upper mid-band Spectrum for 5G and 6G,” in (Accepted) IEEE GLOBECOM 2024, 2024, pp. 1–6.
- [2] D. Shakya, M. Ying, and T. S. Rappaport, “Angular Spread Statistics for 6.75 GHz FR1(C) and 16.95 GHz FR3 Mid-Band Frequencies in an Indoor Hotspot Environment,” in (Submitted) IEEE Wireless Communications and Networking Conference (WCNC) 2025, 2025, pp. 1–6.
- [3] D. Shakya, M. Ying, T. S. Rappaport, H. Poddar, P. Ma, Y. Wang, and I. Al-Wazani, “Comprehensive FR1(C) and FR3 Lower and Upper Mid-Band Propagation and Material Penetration Loss Measurements and Channel Models in Indoor Environment for 5G and 6G,” IEEE Open Journal of the Communications Society, vol. 5, pp. 1–28, 2024.
- [4] S. Kang, M. Mezzavilla, S. Rangan, A. Madanayake, S. B. Venkatakrishnan, G. Hellbourg, M. Ghosh, H. Rahmani, and A. Dhananjay, “Cellular wireless networks in the upper mid-band,” IEEE Open Journal of the Communications Society, pp. 1–18, 2024.
- [5] W. Tong and P. Zhu, New Spectrum. Cambridge University Press, 2021, p. 146–157.
- [6] 3GPP, “Study on channel model for frequencies from 0.5 to 100 GHz (Release 16),” 3GPP TR 38.901 V16.1.0 (2019-12), pp. 1–101, Dec 2019.
- [7] 3GPP, “Study on channel model for frequency spectrum above 6 GHz (Release 14),” 3GPP TR 38.900 V14.3.1 (2017-07), pp. 1–85, July 2017.
- [8] A. Davidson, “National spectrum strategy implementation plan,” National Telecommunications and Information Administration, Tech. Rep., Mar. 2024.
- [9] 3GPP, “Study on the 7 to 24 GHz frequency range for NR,” 3rd Generation Partnership Project (3GPP), Technical Specification (TS) 38.820, 2021, https://www.3gpp.org/DynaReport/38820.htm.
- [10] D. Shakya et al., “Wideband Penetration Loss through Building Materials and Partitions at 6.75 GHz in FR1(C) and 16.95 GHz in the FR3 Upper Mid-band spectrum,” in (Accepted) IEEE GLOBECOM 2024, 2024, pp. 1–6.
- [11] X. Zhou, Z. Zhong, X. Bian, R. He, R. Sun, K. Guan, and K. Liu, “Indoor wideband channel measurements and analysis at 11 and 14 GHz,” IET Microwaves, Antennas & Propagation, vol. 11, no. 10, pp. 1393–1400, 2017.
- [12] N. O. Oyie and T. J. O. Afullo, “Measurements and Analysis of Large-Scale Path Loss Model at 14 and 22 GHz in Indoor Corridor,” IEEE Access, vol. 6, pp. 17 205–17 214, 2018.
- [13] G. J. Janssen, P. A. Stigter, and R. Prasad, “Wideband indoor channel measurements and BER analysis of frequency selective multipath channels at 2.4, 4.75, and 11.5 GHz,” IEEE Transactions on Communications, vol. 44, no. 10, pp. 1272–1288, 1996.
- [14] M. Kim, Y. Konishi, Y. Chang, and J.-i. Takada, “Large scale parameters and double-directional characterization of indoor wideband radio multipath channels at 11 GHz,” IEEE Transactions on Antennas and Propagation, vol. 62, no. 1, pp. 430–441, 2014.
- [15] A. M. Al-Samman, T. Abd Rahman, M. H. Azmi et al., “Indoor corridor wideband radio propagation measurements and channel models for 5g millimeter wave wireless communications at 19 GHz, 28 GHz, and 38 GHz bands,” Wireless Communications and Mobile Computing, vol. 2018, no. 1, 2018, Art. no. 6369517.
- [16] C. A. L. Diakhate, J.-M. Conrat, J.-C. Cousin, and A. Sibille, “Millimeter-wave outdoor-to-indoor channel measurements at 3, 10, 17 and 60 GHz,” in 2017 11th European Conference on Antennas and Propagation (EUCAP), 2017, pp. 1798–1802.
- [17] BUPT, Spark NZ Ltd, “R1-2403280: Discussion on channel model validation of TR38.901 for 7-24GHz,” 3GPP Contribution, Tech. Rep., April 2024.
- [18] SHARP, NYU WIRELESS, “R1-2402407: Channel Model Validation of TR 38.901 for 7-24 GHz,” 3GPP Contribution, Tech. Rep., April 2024.
- [19] T. S. Rappaport, J. Murdock, D. G. Michelson, and R. Shapiro, “An open-source archiving system,” IEEE Vehicular Technology Magazine, vol. 6, no. 2, pp. 24–32, 2011.
- [20] S. Sun, T. S. Rappaport, T. A. Thomas, A. Ghosh, H. C. Nguyen, I. Z. Kovács, I. Rodriguez, O. Koymen, and A. Partyka, “Investigation of prediction accuracy, sensitivity, and parameter stability of large-scale propagation path loss models for 5g wireless communications,” IEEE Transactions on Vehicular Technology, vol. 65, no. 5, pp. 2843–2860, 2016.
- [21] Q. Wei et al., “Measurement-based Analysis of XL-MIMO Channel Characteristics in a Corridor Scenario,” in (Accepted) IEEE VTC Spring 2024, 2024, pp. 1–6.
- [22] X. Yin, Y. Ji, and H. Yan, “Measurement-based characterization of 15 ghz propagation channels in a laboratory environment,” IEEE Access, vol. 5, pp. 1428–1438, 2017.
- [23] T. Rappaport and D. Hawbaker, “Wide-band microwave propagation parameters using circular and linear polarized antennas for indoor wireless channels,” IEEE Transactions on Communications, vol. 40, no. 2, pp. 240–245, 1992.
- [24] S. Deng, G. R. MacCartney, and T. S. Rappaport, “Indoor and Outdoor 5G Diffraction Measurements and Models at 10, 20, and 26 GHz,” in 2016 IEEE Global Communications Conference (GLOBECOM), 2016, pp. 1–7.
- [25] H. Miao, J. Zhang, P. Tang, L. Tian, X. Zhao, B. Guo, and G. Liu, “Sub-6 GHz to mmWave for 5G-Advanced and Beyond: Channel Measurements, Characteristics and Impact on System Performance,” IEEE Journal on Selected Areas in Communications, vol. 41, no. 6, pp. 1945–1960, 2023.
- [26] E. Ben-Dor, T. S. Rappaport, Y. Qiao, and S. J. Lauffenburger, “Millimeter-wave 60 GHz outdoor and vehicle aoa propagation measurements using a broadband channel sounder,” in 2011 IEEE Global Telecommunications Conference-GLOBECOM 2011. IEEE, 2011, pp. 1–6.