GrokLST: Towards High-Resolution Benchmark and Toolkit for Land Surface Temperature Downscaling
Abstract
Land Surface Temperature (LST) is a critical parameter for environmental studies, but obtaining high-resolution LST data remains challenging due to the spatio-temporal trade-off in satellite remote sensing. Guided LST downscaling has emerged as a solution, but current methods often neglect spatial non-stationarity and lack a open-source ecosystem for deep learning methods. To address these limitations, we propose the Modality-Conditional Large Selective Kernel (MoCoLSK) Networks, a novel architecture that dynamically fuses multi-modal data through modality-conditioned projections. MoCoLSK re-engineers our previous LSKNet to achieve a confluence of dynamic receptive field adjustment and multi-modal feature integration, leading to enhanced LST prediction accuracy. Furthermore, we establish the GrokLST project, a comprehensive open-source ecosystem featuring the GrokLST dataset, a high-resolution benchmark, and the GrokLST toolkit, an open-source PyTorch-based toolkit encapsulating MoCoLSK alongside 40+ state-of-the-art approaches. Extensive experimental results validate MoCoLSK’s effectiveness in capturing complex dependencies and subtle variations within multispectral data, outperforming existing methods in LST downscaling. Our code, dataset, and toolkit are available at https://github.com/GrokCV/GrokLST.
Index Terms:
Land surface temperature, guided image super-resolution, multi-modal fusion, receptive field, benchmark datasetI Introduction
Land Surface Temperature (LST) is a critical physical parameter reflecting the complex exchange of mass and energy between the Earth’s surface and the atmosphere [1, 2, 3, 4]. Serving as a key metric for evaluating ecological and climate dynamics at various scales, LST is instrumental for environmental studies, including urban heat island analysis [5, 6], forest fire surveillance, surface evapotranspiration rates [7, 8, 9], soil moisture content inversion [10], and geothermal anomaly detection [11]. Consequently, acquiring high-resolution LST data is a crucial task in the fields of remote sensing, ecology, and climatology.
The pursuit of high-resolution LST data has long been hindered by a fundamental constraint inherent to satellite remote sensing technology, i.e., the unavoidable trade-off between temporal and spatial resolution [12, 13]. For example, Landsat 8 offers 100-meter spatial resolution but revisits areas only every 16 days [14], while MODIS provides bi-daily observations with a less detailed 1-kilometer spatial resolution [15]. This compromise between revisit frequency and spatial granularity hinders the ability to obtain LST data that is simultaneously frequent and spatially detailed. Additionally, the inherent lower resolution of thermal infrared bands compared to their multi-spectral counterparts limits the potential for leveraging synergistic spectral data. In response, guided LST downscaling [16], using higher-resolution auxiliary data, has emerged as a critical research domain, offering a resolution to the spatio-temporal trade-off and enabling a more fine-grained analysis of terrestrial thermal patterns.
Current LST downscaling techniques predominantly rely on statistical regression models to extrapolate fine-resolution data from coarser data, exploiting relationships between LST and surface physical parameters [17, 18, 19, 20, 21, 22, 13]. While effective for their simplicity and accuracy, these techniques often apply a uniform model globally, neglecting the localized spatial variability of LST. They fail to accommodate spatial non-stationarity, a condition where the statistical attributes of relevant variables fluctuate across different locations. Consequently, such models often underperform when extrapolated to regions with distinct characteristics, undermining their reliability for geographically diverse applications.
Recently, deep learning has catalyzed a paradigm shift in computer vision and remote sensing, also markedly affecting LST downscaling [23, 24, 25, 26, 27]. For instance, Wang and Tian pioneered the Super Resolution Deep Residual Network (SRDRN) to refine the downscaling of daily meteorological parameters [28], vastly outstripping conventional methods. Concurrently, Mukherjee and Liu advanced an encoder-decoder super-resolution framework [29], incorporating self-attention to increase the resolution of MODIS spectral bands with notable efficacy.
Despite these advancements, LST super-resolution (SR) has not kept pace with the rapid developments seen in single-image and depth map SR [30]. This stagnation may stem from a lack of a supportive ecosystem for deep learning innovation, with two primary obstacles identified:
-
1.
Absence of Very High-Resolution Benchmark Dataset: Satellite data disparities in region, time, and sensor selection hinder methodological comparisons. The lack of uniformity in satellite data selection and the scarcity of very high-resolution thermal infrared data () pose significant challenges for LST SR research. Therefore, establishing a standardized very high-resolution benchmark dataset are crucial for advancing the field.
-
2.
Scarcity of Open-Source LST SR Toolkit: The absence of a dedicated open-source toolkit for LST SR hinders the community’s ability to replicate, refine, and challenge existing methods. Such a toolkit would be essential for fostering collaborative development and accelerating progress in the field.
Moreover, most current deep learning models for LST downscaling are straightforward adaptations from guided image super-resolution models in computer vision, without fully considering the unique characteristics of LST data and its associated challenges [30]. As the resolution of thermal infrared bands reaches very high levels (), small-scale local features, such as buildings and roads, emerge alongside large-scale land cover types like water bodies, deserts, and grasslands. These local features are prone to mixing with their surroundings, introducing additional complexity to the downscaling process. According to an analysis of the high-resolution LST data, we identify two primary limitations in existing methodologies:
-
1.
Inability to Dynamically Adjust Receptive Fields: The stark spatial heterogeneity of LST necessitates a model capable of adjusting its receptive field to the diverse scales of temperature fluctuations. This adaptability is crucial for accurately capturing the local contrasts within LST distributions over various spatial extents.
-
2.
Multi-modal Fusion in a Uni-dimensional Manner: Existing approaches to integrating multi-modal auxiliary data with LST features have been restricted to simplistic, uni-dimensional operations, such as addition, multiplication, or concatenation. These approaches do not suffice to unravel the complex interdependencies within high-resolution guidance data, leading to suboptimal feature enhancement and an underutilization of the rich information available in multi-modal sources.
To address these challenges in high-resolution LST downscaling, we propose the Modality-Conditional Large Selective Kernel (MoCoLSK) Networks, a novel architecture that dynamically fuses multi-modal data. Our key idea is to modulate selective feature fusion via modality-conditioned projections. MoCoLSK re-engineers our previous single-modality Large Selective Kernel Network (LSKNet) [31] to achieve a confluence of dynamic receptive field adjustment and multi-modal feature integration. This is accomplished by replacing the vanilla convolution inside kernel selection mechanism with a dynamic non-linear projection, informed by the granularity of high-resolution multi-modal data, to adaptively condition the selective receptive field. Consequently, MoCoLSK facilitates more nuanced feature discrimination and complex multi-modal interactions, leading to enhanced LST prediction accuracy through representations that closely resonate with the intricacies of multi-spectral data.
Furthermore, to foster research and advancement in LST downscaling, we establish a comprehensive open-source ecosystem termed the GrokLST project. Our contributions include the GrokLST dataset, a benchmark featuring 641 pairs of low-resolution and high-resolution LST images from the SDGSAT-1 satellite data, along with corresponding auxiliary data of multiple modalities. Accompanying the dataset is GrokLST toolkit, an open-source PyTorch-based toolkit encapsulating our MoCoLSK model alongside other 40+ state-of-the-art approaches, empowering researchers to effortlessly leverage the GrokLST dataset and conduct standardized evaluations.
In summary, our contributions can be categorized into THREE main aspects:
-
1.
We introduce MoCoLSK, a novel dynamic multi-modal fusion architecture, which modulates receptive fields dynamically through modality-conditioned projections. To the best of our knowledge, this is the first architecture that employs modality-conditioned projections to modulate receptive fields dynamically.
-
2.
We have developed the GrokLST dataset, which serves as a high-resolution benchmark, enabling the research community to evaluate and advance LST downscaling techniques under standardized conditions.
-
3.
We introduce the open-source GrokLST toolkit, which encompasses over 40 state-of-the-art approaches, providing researchers with the necessary tools to develop LST downscaling methods.
Through extensive experimental results, we validate the effectiveness of MoCoLSK, showcasing its ability to capture the complex dependencies and subtle variations within multispectral data, outperforming existing methods in LST downscaling. The proposed MoCoLSK architecture and the GrokLST ecosystem pave the way for advancing research and applications in high-resolution LST retrieval, providing a solid foundation for future developments in this domain.
II Related Work
Terminology: Before we proceed, it is necessary to clarify the specific terminology regarding spatial resolution used in this work. Within the field of computer vision (CV), the terms “upscale” and “downscale” are respectively associated with the increase and decrease in spatial resolution, concepts that are synonymous with “upsample” and “downsample”. In contrast, in the context of climate and meteorological studies, as well as remote sensing research, “downscaling” typically refers to the process of increasing the resolution from coarser to finer resolution, transitioning from a less detailed to a more detailed representation. In this work, we employ the term “downscaling” consistent with its usage in remote sensing literature, to indicate an increase in spatial resolution.
II-A Deep Learning for Downscaling
In recent years, deep learning models have emerged as a powerful tool for downscaling low-resolution meteorological data to high-resolution outputs. These models leverage the ability of deep neural networks to learn complex spatial and temporal patterns from data, enabling them to effectively capture the relationships between low-resolution and high-resolution data.
In the context of high-resolution climate data generation, the Super Resolution Deep Residual Network stood out for its effective downscaling of daily meteorological elements like precipitation and temperature [32]. Building upon this, Mital et al. contributed a fine-scale (400 m) dataset, achieved via a data-driven downscaling model that discerned the impact of topography on climate variables [33]. Furthermore, Vaughan et al. introduced convolutional conditional neural processes, a versatile deep learning framework for multisite statistical downscaling, which enabled the generation of continuous stochastic forecasts for climate variables across any geographic location [34].
Shifting focus to remote sensing data enhancement, Yu et al. introduced a DisTrad-Super-Resolution Convolutional Network, integrating statistical methods with deep learning to significantly improve the spatial and temporal resolutions of remote sensing imagery [35]. This advancement allowed for a more refined analysis of lake surface temperature dynamics. Complementarily, Mukherjee and Liu developed an encoder-decoder super-resolution architecture that incorporated a custom loss function and a self-attention mechanism, adeptly increasing the resolution of MODIS spectral bands while maintaining spatial and spectral fidelity without supplementary spatial inputs [29].
Deep learning has also played a pivotal role in advancing the precision of climate model simulations through bias correction and downscaling. Baño-Medina et al. benchmarked convolutional neural networks for continental-scale downscaling within the VALUE framework, demonstrating their enhanced capability in precipitation downscaling and suitability for climate change projections due to their robust extrapolation abilities [36]. Similarly, Wang and Tian applied deep learning to rectify biases in climate simulations, preserving inter-variable dependencies and spatial characteristics, marking an advancement beyond conventional bias correction methods [28].
While the aforementioned works have made strides in applying deep learning to meteorological data downscaling and enhancement, our approach differs in two key aspects that address the limitations of existing methods:
-
1.
Dynamic Fusion Architecture: We identified limitations of existing deep learning approaches, mainly fixed receptive fields and uni-dimensional fusion, and proposed a novel dynamic multi-modal fusion architecture. This architecture adaptively modulates receptive fields through modality-conditioned projections, a clear contribution in the field.
-
2.
Open-Source Ecosystem: Beyond methodological contributions, we also aimed to foster reproducible research by establishing an open-source ecosystem. This ecosystem includes a benchmark dataset and a toolkit with implementations of over 40 state-of-the-art methods, distinguishing our work from previous studies.
II-B Guided Image Super-Resolution
Guided image super-resolution aims to restore high-resolution images from low-resolution ones by leveraging structural information from guidance images of the same scene, setting it apart from single image super-resolution [37, 38, 39]. Recent advances in guided image super-resolution [40, 41, 26, 42, 43] can be broadly categorized into two main approaches: cross-modal feature fusion and shared-private feature separation.
Cross-modal feature fusion methods focus on effectively combining information from the target and guidance images. For instance, Zhong et al. [44] introduced an attention-based hierarchical multi-modal fusion strategy that selected structurally consistent features. Building upon this, Shi et al. [45] proposed a symmetric uncertainty-aware transformation to filter out harmful information from the guidance image, ensuring more reliable feature fusion. Furthermore, Wang et al. [27] developed a structure-guided method that propagates high-frequency components from the guidance to the target image in both the frequency and gradient domains, enabling more comprehensive fusion of structural details.
On the other hand, shared-private feature separation methods aim to disentangle the common and unique information between the target and guidance images. Deng et al. [46] employed convolutional sparse coding to split the shared and private information across different modalities, facilitating more targeted feature fusion. Building on this concept, He et al. [47] separated RGB features into high-frequency and low-frequency components using octave convolution, allowing for more fine-grained information integration. Similarly, Zhu et al. [48] proposed a probabilistic global cross-modal upsampling approach to learn the cross-modal information of the guidance image, enabling more robust feature fusion. Additionally, Xiang et al. [42] introduced a detail injection fusion network to fully utilize the nonlinear complementary features of both the target and guidance images, achieving more effective detail restoration.
Our research, while conceptually aligns with guided image super-resolution, introduces a novel approach to LST downscaling that distinguishes itself in two fundamental aspects:
-
1.
Dynamic Receptive Field: Existing guided image super-resolution methods often rely on fixed receptive fields, which may not effectively capture the multi-scale dependencies in LST data. Our work highlights the significance of dynamic receptive field adjustment for LST downscaling. To the best of our knowledge, this is the first work to emphasize this factor in the field of guided image super-resolution.
-
2.
Dynamic Multi-modal Fusion: Previous studies have primarily employed uni-dimensional operations, such as addition, multiplication, or concatenation, for multi-modal fusion. However, these approaches may not fully capture the complex interactions between different modalities. Our MoCoLSK framework surpasses traditional uni-dimensional fusion methods by introducing a sophisticated, adaptive interplay between modalities.
II-C Selective Mechanism
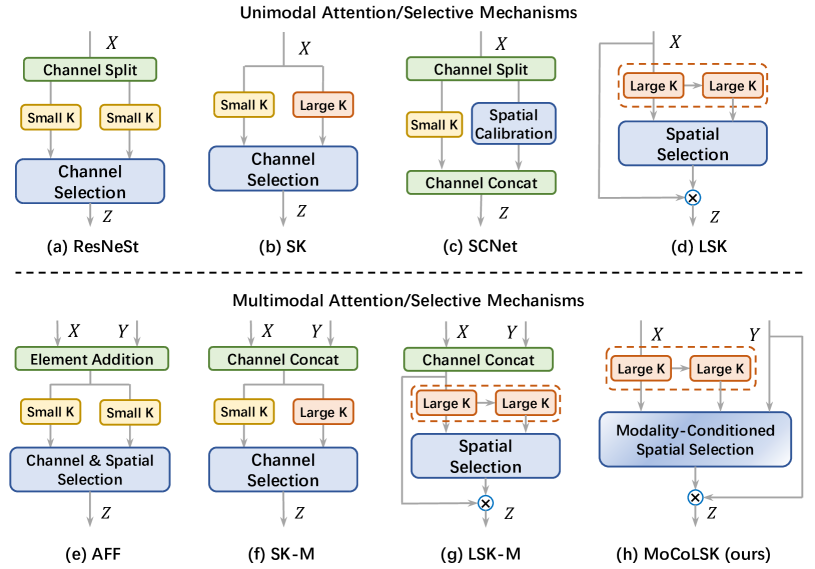
Our previous work on Selective Kernel Networks (SKNet) [49] introduced a dynamic selection mechanism for convolutional kernels of varying sizes within the network, enabling the adaptation of receptive fields based on the complexity and scale of input features. Building upon this, we proposed Attentional Feature Fusion (AFF) [50], which extended the applicability of selective mechanisms to feature fusion tasks by integrating the concept of multi-scale channel attention. More recently, our work on LSKNet [31] adapted the selective kernel philosophy for remote sensing object detection tasks, demonstrating the versatility of selective mechanisms in handling high-resolution imagery and the unique challenges posed by varying object scales and backgrounds.
Inspired by the success of SKNet, ResNeSt [51] incorporated the selective kernel concept into its architectural design, introducing split-attention blocks that allowed the network to selectively aggregate feature map groups. Similarly, the Self-Calibrated Network (SCNet) [52] employed branch attention and spatial attention to enrich feature representation and bolster localization capabilities.
While these advancements have significantly contributed to the field, our proposed MoCoLSK-Net extends the selective kernel concept in two fundamental aspects, addressing the limitations of existing methods:
-
1.
Single-modal vs. Cross-modal: Previous works primarily focused on fusing features from different receptive fields within the same modality. In contrast, MoCoLSK-Net aims to fuse features from different modalities, enabling the network to leverage complementary information from multiple sources and enhance the overall representation.
-
2.
Fixed vs. Dynamic convolution weights: Existing approaches relied on static convolutional weights for feature fusion. MoCoLSK-Net, on the other hand, dynamically generates attention fusion weights conditioned on multi-modal auxiliary features. This dynamic weighting capability allows MoCoLSK-Net to allocate fusion weights more effectively, tailoring the feature combination process to the nuanced characteristics of multi-modal data.
III GrokLSK: Open-Source Ecosystem
III-A GrokLSK Dataset
The recent proliferation of accessible satellite imagery has catalyzed the development of deep learning models in the domain of thermal remote sensing. However, the field of LST downscaling currently lacks very high-resolution open-source datasets, which hinders the comprehensive evaluation and comparison of emerging models. Moreover, the disparate preprocessing practices and dataset structures across different research efforts further impede the uniform assessment of state-of-the-art techniques.
Recognizing the need for consistency in model evaluation and the importance of very high-resolution data, we introduce GrokLSK, an open-source benchmark dataset specifically designed for LST downscaling. GrokLSK fills a critical gap in the field by providing a very high-resolution dataset that enables researchers to evaluate and compare their models on a standardized platform, fostering the advancement of LST downscaling through rigorous and consistent algorithm assessments.
III-A1 Data Source and Preparation
Our GrokLST dataset leverages the cutting-edge remote sensing capabilities of the Sustainable Development Goals Science Satellite 1 (SDGSAT-1), which was launched on November 5, 2021, to bolster the United Nations Sustainable Development Goals [53]. SDGSAT-1’s Multispectral Imager for Inshore (MII) and Thermal Infrared Spectrometer (TIS) sensors synergistically contribute to this dataset, with their spectral characteristics and band designations detailed in Tab. I.
| Sensor | Band | Bandwidth | Resolution | Note |
| Name | (m) | (m) | ||
| MII | Band 2 | 0.410 0.467 | 10 | Deep Blue |
| Band 3 | 0.457 0.529 | 10 | Blue | |
| Band 4 | 0.510 0.597 | 10 | Green | |
| Band 5 | 0.618 0.696 | 10 | Red | |
| Band 6 | 0.744 0.813 | 10 | VRE | |
| Band 7 | 0.798 0.911 | 10 | NIR | |
| TIS | Band 1 | 8.0 10.5 | 30 | |
| Band 2 | 10.3 11.3 | 30 | ||
| Band 3 | 11.5 12.5 | 30 |
The processing pipeline for SDGSAT-1 Level 4 data products comprises several stages, including relative radiation correction, band registration, High Dynamic Range (HDR) fusion, Remote Procedure Call (RPC) processing, and orthographic correction. The use of ground control points and digital elevation models in orthographic correction guarantees the fidelity of the data for a diverse range of remote sensing applications.
The Land Surface Temperature (LST) retrieval from SDGSAT-1 is facilitated by the three-channel split-window (TCSW) algorithm [54]. This method leverages the 10-meter resolution multispectral data to compute indices such as the Normalized Difference Water Index (NDWI), Normalized Difference Built-up Index (NDBI), and Normalized Difference Vegetation Index (NDVI), which serve as integral inputs for LST estimation. The surface emissivity is computed by integrating the thermal infrared (TIR) channels of SDGSAT-1 with the ASTER Global Emissivity DataSet version 3 (GEDv3) [55], using the NDVI threshold method [56]. We’ve further refined the atmospheric corrections for the TCSW algorithm with ECMWF Reanalysis v5 (ERA5) [57] for water vapor and the Thermodynamic Initial-Guess Retrieval (TIGR) database [58], in conjunction with MODTRAN 5.2 [59], to curate a custom atmospheric parameter database for SDGSAT-1.
The validation of the LST retrieval accuracy against in-situ measurements from the HiWATER sites, available at the National Cryosphere Desert Data Center (http://www.ncdc.ac.cn), reveals an RMSE of 2.598 K and an of 0.977. This dataset thereby augments the existing LST downscaling resources and underpins high-resolution environmental monitoring in alignment with the Sustainable Development Goals.
Building upon these advancements, our GrokLST dataset incorporates a comprehensive suite of ten spectral bands and indices from SDGSAT-1, enhancing the algorithm’s precision. The selected bands include “B2 Deepblue”, “B3 Blue”, “B4 Green”, “B5 Red”, and “B7 NIR”, while key indices feature the digital elevation model (DEM), NDWI, NDVI, and Normalized Difference Moisture Vegetation Index (NDMVI). These elements are pivotal for capturing detailed environmental characteristics, such as vegetation vigor and water content. The combination of LST data and these auxiliary inputs forms a rich dataset that significantly enhances the SDGSAT-based LST downscaling algorithm, setting it apart from previous approaches that relied on a more limited set of input features.
III-A2 Study Area
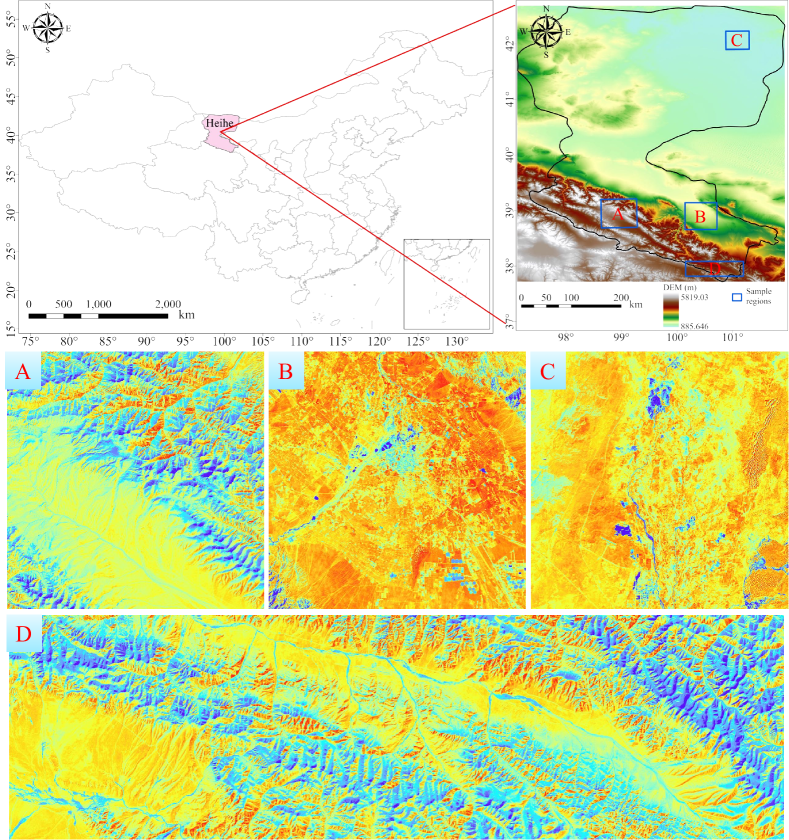
As depicted in Fig. 2, the pivotal focus of this study is the Heihe River Basin, the second-largest inland river basin in Northwestern China. Geographically positioned between 98° to 101°E longitude and 38° to 42°N latitude, the basin is nestled within the Hexi Corridor, serving as the primary inland watershed in Western Gansu and Qinghai provinces.
The Heihe River Basin’s unique positioning amidst the Eurasian landmass and its adjacency to towering mountain ranges bestow upon it a distinct continental climate. This climate is predominantly shaped by the mid-to-high latitude westerly wind circulation and periodic influxes of polar cold air masses. The basin is characterized by its arid conditions, punctuated by sparse and concentrated precipitation, frequent high winds, abundant sunshine, intense solar radiation, and significant diurnal temperature variations. Spanning 821 kilometers from its source to its terminus at Lake Juyan, the Heihe River carves its path through three distinct ecological environments, covering an area of approximately 142,900 square kilometers.
The intricate interplay of climatic factors and geographical diversity renders the Heihe River Basin a prime candidate for environmental remote sensing and land surface temperature downscaling studies. Its vast and varied land covers, which include impervious urban structures, verdant vegetation, and sprawling water bodies, provide a diverse palette for implementing advanced deep learning techniques and computational vision approaches. These methods are employed to super-resolve imagery, facilitating a granular environmental analysis, and thereby highlighting the unique value of this study area.
III-A3 Dataset Description
In this part, we introduce GrokLST, a dataset specifically designed for land surface temperature (LST) downscaling tasks. GrokLST comprises 641 images collected from the Heihe River Basin, a region known for its diverse land cover types and complex terrain. To ensure consistent input dimensions and mitigate the impact of no-data regions (i.e., pixels with no data or not a number) on model training, we cropped the original images to a uniform size of pixels.
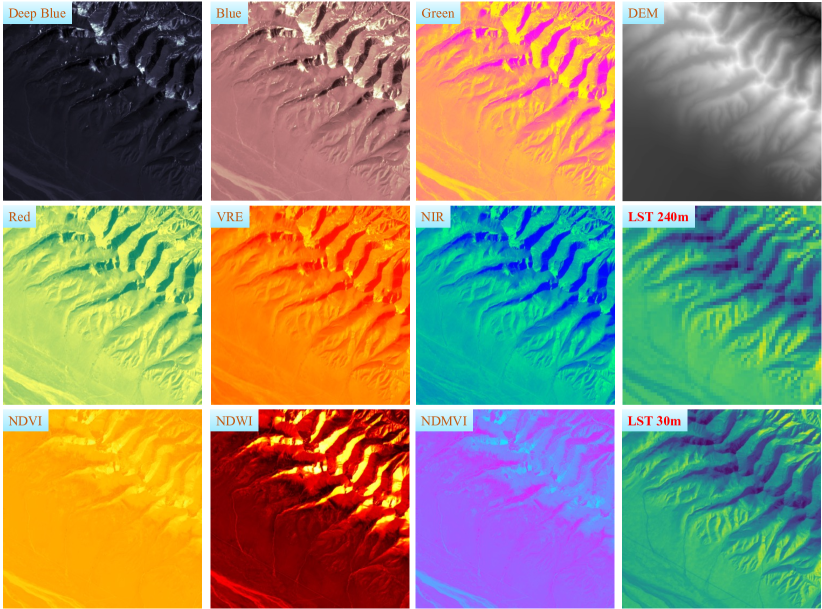
The GrokLST dataset encompasses a diverse set of 10 auxiliary data types (i.e., DEM, Deepblue, Blue, Green, Red, VRE, NIR, NDMVI, NDVI, and NDWI), each with a high spatial resolution of 10 meters. These auxiliary data contribute significantly to enriching the contextual understanding necessary for precise LST modeling. Moreover, the LST data, derived at a resolution of 30 meters, offers a detailed thermal profile conducive to high-precision research.
In addressing various downscaling challenges, we have adhered to Wald’s protocol to downsample the data to multiple resolutions, specifically 60, 120, and 240 meters. This approach facilitates a comprehensive exploration of various downscaling factors. Fig. 3 provides visual representations of these bands and indices, highlighting the spectral characteristics and quality of the dataset. For effective model training and validation, the GrokLST dataset is carefully segmented into three subsets: 60% for training, 10% for validation, and 30% for testing.
III-B GrokLST Toolkit
The field of LST downscaling has long been hindered by a lack of accessible, open-source tools that foster innovation and reproducibility. To address this gap, we introduce GrokLST, a comprehensive deep learning toolkit designed specifically for LST downscaling tasks. Built on the PyTorch framework, GrokLST offers high flexibility and speed in model development and training, drawing inspiration from proven architectures in generic computer vision toolboxes like MMDetection and Detectron2.
GrokLST distinguishes itself through several key features that cater to the unique demands of LST downscaling.
-
1.
Comprehensive Model Support: GrokLST provides out-of-the-box support for over 40 state-of-the-art super-resolution models. This extensive library not only facilitates easy comparison of different methods but also serves as a foundation for further research and development.
-
2.
Customizable Components: Unlike general-purpose toolkits, GrokLST offers enhanced flexibility in model configuration. Users can choose from a variety of backbones, necks, and attention mechanisms, tailoring the architecture to specific LST downscaling needs.
-
3.
Specialized Tools and Metrics: The toolkit includes specialized dataset loaders, data augmentation pipelines, and LST-specific evaluation metrics. These components are essential for accurately assessing model performance under diverse environmental conditions.
In summary, GrokLST is a powerful and user-friendly toolkit that addresses the long-standing need for accessible, open-source tools in the LST downscaling community.
IV Method
The problem of guided LST downscaling can be formulated as follows: Given a low-resolution (LR) LST map and the high-resolution (HR) guided data , the goal is to estimate an HR LST map that approximates the true HR LST map . Here, and denote the height and width of the LR LST map, is the scaling factor, and represents the number of channels in the guided data.
In recent years, deep learning-based approaches have emerged as a powerful tool for LST downscaling [60]. These methods leverage the ability of deep neural networks to learn intricate feature representations and model complex relationships between input data and the desired output. A typical deep learning-based LST downscaling model can be expressed as:
| (1) |
where represents the deep neural network with learnable parameters . The network takes the LR LST map and the HR guided data as inputs and generates the HR LST map . The network is trained on a dataset of paired LR-HR LST maps and HR guided data, with the objective of minimizing a loss function that measures the discrepancy between the predicted HR LST map and the ground truth, defined as:
| (2) |
IV-A MoCoLSK-Net Architecture
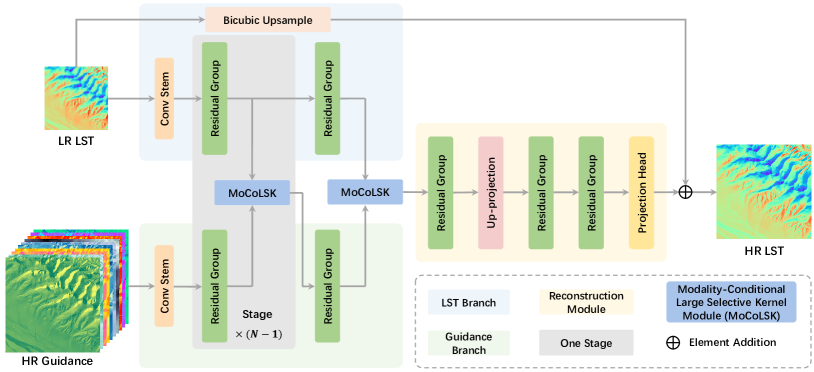
As depicted in Fig. 4, our proposed MoCoLSK-Net comprises four primary components: the LST branch, the guidance branch, the MoCoLSK module, and the reconstruction module, each designed to process and refine environmental data effectively.
LST and Guidance Branches: Apart from the different inputs, these two branches are almost completely homogeneous in structure. Each branch initiates with a convolutional stem that is responsible for extracting initial features from the input LR LST map or HR guidance image. Following the convolutional stem are stages of Residual Groups, where each stage consists of multiple residual blocks [61] with channel attention [62]. Additionally, the two branches differ in one aspect: the LR images in the LST branch are processed through a bicubic upsample layer to match the desired output resolution, which serves as the preliminary step for further refinement.
MoCoLSK Module: The MoCoLSK module is the core component of our network, designed to perform dynamic multi-modal fusion. It takes as input the features from the corresponding stages of the LST and guidance branches, and performs cross-modal feature fusion and refinement. Please refer to Section IV-B fore more details.
Reconstruction Module: The reconstruction module is responsible for aggregating the refined features from the MoCoLSK modules and generating the final HR LST map. Among a series of residual groups, this stage employs a up-projection unit [63] to generate HR features. Additionally, the final projection head, consisting of two convolutional layers and a LeakyReLU activation layer, works together with the bicubic interpolation results to generate the final downscaled LST. The final output is a high-fidelity HR LST image that provides enhanced spatial details crucial for accurate environmental assessment and decision-making.

IV-B MoCoLSK Module
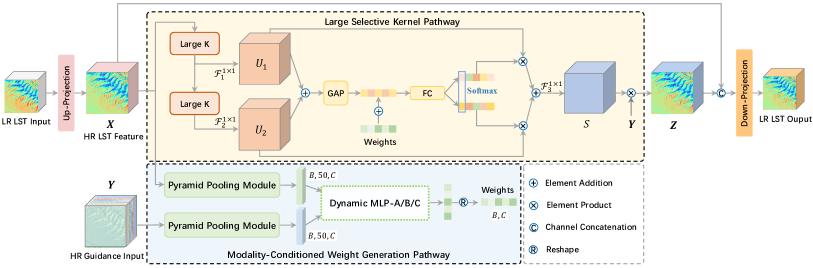
This subsection provides an in-depth examination of the MoCoLSK Module, a core component of the MoCoLSK-Net designed for dynamic multi-modal fusion in the downscaling of land surface temperature (LST). As illustrated in Fig. 5, the MoCoLSK module consists of two primary pathways: the Large Selective Kernel (LSK) pathway and the Modality-Conditioned Weight Generation (MCWG) pathway. These pathways work in concert to adaptively refine the network’s processing capabilities, enhancing both the spatial resolution and accuracy of LST predictions.
IV-B1 Large Selective Kernel Pathway
The LSK pathway is essential for extracting multiscale features from incoming LST feature maps. It enables the network to adjust its receptive fields dynamically, tailoring its response to the specific characteristics of the input data. This adaptability is crucial for capturing the intricate details necessary for accurate LST downscaling.
We try to keep the LSK pathway consistent with the original LSK [31] module, and improve it to receive bimodal feature input, namely LR LST feature and HR guidance feature, in order to perform cross-modal feature fusion and refinement. Prior to this, we first upsample the LR LST feature with the help of the up-projection layer [63] to match the resolution of the HR guided feature. This alignment facilitates a thorough and effective multimodal feature fusion. The HR LST features (denoted as ) and HR guidance features (denoted as ) are further fed into the LSK pathway to obtain the refined results (denoted as ) of dynamic multimodal feature fusion, i.e., , where “LSK-P" represents the large selective kernel pathway. This process can be subdivided into three main steps: 1) large kernel convolutions; 2) modality-conditioned spatial kernel selection; and 3) modality fusion.
1) Large Kernel Convolutions: The large kernel convolutions process in the MoCoLSK module follows the configuration of the original LSK module [31] and can be defined as follows:
| (3) | ||||
where and represent LST features with different large receptive fields. are point-wise convolutions. and denote depth-wise convolutions with kernel size 5, dilation 1 and kernel size 7, dilation 3, respectively.
2) Modality-Conditioned Spatial Kernel Selection: This spatial kernel selection aims to spatially select features from large convolution kernels with different receptive fields (i.e., and ) that are effective for refining HR LST data, assisted by convolution weights generated through modality modulation conditioned on the HR guidance features. Specifically, the and with different scale receptive fields are first concatenated, then subjected to channel-based average and maximum pooling (denoted as and , respectively), and concatenated again, as detailed by the following formula:
| (4) |
where is the spatial attention feature descriptor obtained through average and maximum pooling.
To obtain modality-conditioned spatial selection masks , we propose a dynamic modality-conditioned convolution layer, followed by a sigmoid activation layer. It is important to note that the convolution kernel weights of this convolution layer are dynamically generated in the modality-conditioned weight generation pathway, as detailed in Section IV-B2. This process can be defined as:
| (5) |
where is the dynamic modality-conditioned convolution layer, and superscript indicates that the number of channels in the feature map remains unchanged, still being 2. is sigmoid activation function and “" are the convolution kernel weights dynamically generated in the modality-conditioned weight generation pathway.
The features and are spatially weighted by their corresponding spatial masks, then summed and further fused through a point-wise convolution layer to obtain the final attention feature :
| (6) |
where is the element-wise multiplication.
3) Modality Fusion: The final modality fusion output of the LSK pathway is the element-wise multiplication between attention feature and guidance feature :
| (7) |
To stack an arbitrary number of MoCoLSK modules for more precise refinement of LST reconstruction results, the obtained fused features are concatenated with the HR LST features , followed by a down-projection layer [63] to downsample the combined features to match the resolution of the input LR LST data.
Next, we detail the modality-conditioned weight generation pathway and describe the process of generating the “" in Equation (5).
IV-B2 Modality-Conditioned Weight Generation Pathway
The MCWG pathway combines HR LST features with guidance features via the pyramid pooling module (PPM) and dynamic MLP (DMLP) modules. It generates modality-conditioned convolution weights dynamically, which are then utilized to modulate the generation of spatial mask features in the LSK pathway. This process can be formulated as (note that for better description, we omit operations such as reshape):
IV-B3 Integration and Dynamic Interaction
By integrating the LSK pathway and the MCWG pathway, the MoCoLSK module effectively captures multi-scale features and performs adaptive multi-modal fusion. This dynamic adaptation allows the network to leverage the complementary information from the auxiliary data and improve the accuracy of land surface temperature downscaling. The complete MoCoLSK Module can be formulated as:
| (10) | ||||
where MoCoLSK denotes the complete MoCoLSK module. and , representing the LR LST feature and HR guidance feature, serve as the input features for the MoCoLSK module of stage . Up and Down are up-projection and down-projection units [63], respectively. You can go to IV-B1 to figure out how is generated. is the output of the MoCoLSK module at stage .
V Experiments
V-A Experimental Settings
V-A1 Evaluation Metrics
Some key statistical indicators such as root mean square error (RMSE), mean absolute error (MAE), bias (BIAS), correlation coefficient (CC), and ratio of standard deviations (RSD) are used to quantitatively evaluate the performance of the model.
RMSE is the square root of the average of the squared differences between the predicted HR LST and the ground truth :
| (11) |
MAE represents the average of the absolute differences between and :
| (12) |
BIAS shows the average of the differences between and :
| (13) |
CC evaluates the correlation between and , with a value of 1 indicating perfect correlation:
| (14) |
where , , and .
RSD quantifies how closely the distribution of matches the distribution of :
| (15) |
where
| (16) | ||||
The closer the values of RMSE, MAE, BIAS, and RSD are to 0, and the closer CC is to 1, the better the downscaling method’s reconstruction performance.
V-A2 Implementation Details
We implemented our MoCoLSK-Net in our GrokLST toolkits and trained it on a platform equipped with four NVIDIA GeForce RTX 4090 GPUs using a distributed training approach. During training, we employ the AdamW optimizer [66] and the CosineAnnealingWarmRestarts parameter scheduler [67]. The initial learning rate is set to and weight decay by a factor of for iterations. Each GPU is assigned one training sample, and the batch size is fixed to 4. All other deep learning-based methods in the GrokLST toolkits use the above experimental configuration.
Next, we detail the key hyperparameters in MoCoLSK-Net.
Specifically, 1) Base Feature Dimension: In the Guidance branch, the feature dimension of all residual groups remains fixed at 32 (where 32 is considered the base dimension for MoCoLSK-Net). In contrast, in the LST branch, the feature dimension of the residual groups increases by 32 in each stage compared to the previous stage. Besides, the feature dimension of all submodules within the reconstruction module is maintained at .
2) Number of Stages: MoCoLSK-Net by default has 4 stages, with each stage containing two residual groups and one MoCoLSK module.
3) Number of Layers in DMLP: The DMLP contains multiple MLP layers to enhance the dynamic fitting capability of the module. In MoCoLSK-Net, the default number of DMLP layers is 1.
4) DMLP Versions: There are three versions of standard DMLP, namely A, B, and C. For details, please refer to [65].
5) Size of Weights: The weights dynamically generated by the MCWG pathway are used in the dynamic modality-conditioned convolution layer in the LSK pathway to obtain modality-conditioned spatial selection masks. The default size of the weights is 33.
V-B Ablation Study
In this section, we report the ablation study results of the key components in the MoCoLSK module on the GrokLST dataset at 8x downscaling. We utilize two NVIDIA GeForce RTX 4090 GPUs and increase the iteration count to 20k to obtain more reliable experimental results. All other configurations follow the default settings.
The Effectiveness of Key Components in the MoCoLSK Module. In this subsection, we conduct ablation experiments on the three main processes of the LSK pathway in the MoCoLSK module and the PPM in the MCWG pathway to validate their effectiveness.
| No. | LSK-P | Pooling | Metrics | ||||
| LKD | DConv | MF | PPM | AvgMax | RMSE | CC | |
| 1 | - | - | - | - | - | 0.7405 | 0.9605 |
| 2 | ✓ | ✓ | ✓ | 0.7154 | 0.9612 | ||
| 3 | ✓ | ✓ | ✓ | 0.7267 | 0.9603 | ||
| 4 | ✓ | ✓ | ✓ | 0.9407 | 0.9414 | ||
| 5 | ✓ | ✓ | ✓ | ✓ | 0.7153 | 0.9613 | |
| 6 | ✓ | ✓ | ✓ | ✓ | 0.7133 | 0.9613 | |
Table II presents the results of the ablation experiments. First, let us explain the meanings of certain items in the table. Specifically, case No. 1 indicates the baseline network, which uses identity module instead of the LSK and MCWG pathways, as shown in Fig. 9(a). “LKD" indicates whether large kernel decomposition is utilized; if unchecked, it signifies the use of a single larger kernel depth-wise convolution with the same receptive field to replace the two decomposed large kernels. “DConv" refers to dynamic modality-conditioned convolution; if unchecked, the original static convolution with a kernel size of 7 is employed in LSK. “MF" denotes modal fusion, as represented in Equation (7); if unchecked, it implements , similar to the original LSK.
Cases No. 2 and No. 6 validate that large kernel decomposition is superior to a single larger kernel. Cases No. 3 and No. 6 indicate that dynamic convolution with modality-conditioned weights generated by the supernetwork performs better than static convolution. Cases No. 4 and No. 6 demonstrate the necessity of further modality fusion. Cases No. 5 and No. 6 validate the effectiveness of the proposed PPM.
| (K, D) Sequence | RF | #P | FLOPs | RMSE | CC |
| (23, 1) | 23 | 0.02M | 4.44G | 0.7154 | 0.9612 |
| (3, 1) (3, 2) | 7 | 0.04M | 0.56G | 0.7233 | 0.9609 |
| (3, 1) (5, 2) | 11 | 0.04M | 0.69G | 0.7183 | 0.9613 |
| (5, 1) (7, 3) | 23 | 0.04M | 1.03G | 0.7133 | 0.9613 |
| (7, 1) (9, 4) | 39 | 0.04M | 1.49G | 0.7091 | 0.9620 |
| (9, 1) (11, 5) | 59 | 0.05M | 2.10G | 0.7092 | 0.9622 |
Larger Kernel, Better Performance? In this subsection, we conduct a deeper investigation into large kernel decomposition, aiming to understand whether larger kernels lead to better reconstruction performance. Table III shows the impact of a single larger kernel (with the same receptive field as the default settings) and a series of two large kernels with different receptive fields on the LST downscaling task. We can observe that: 1) A single large kernel convolution with the same receptive field (RF23) is less effective than the decomposed large kernel convolutions. 2) For the LST downscaling task, the reconstruction performance of large kernel decomposition convolutions improves with a larger receptive field. However, this conclusion is limited to the (K, D) sequence configurations presented in the table III. We do not investigate other configurations (RF59) due to limitations in computational resources.
| Pooling | Metrics | |||
| Avg. | Max. | PPM | RMSE | CC |
| ✓ | 0.7175 | 0.9610 | ||
| ✓ | 0.7237 | 0.9608 | ||
| ✓ | ✓ | 0.7153 | 0.9613 | |
| ✓ | 0.7133 | 0.9613 | ||
Pooling in MCWG Pathway. In this subsection, we conduct an in-depth exploration of different pooling methods in the MCWG pathway. Table IV presents the comparative results of different pooling methods. It can be observed that: 1) Average pooling performs better than max pooling; 2) Using both average and max pooling together is more effective than using average or max pooling alone; 3) Our proposed PPM outperforms the other three pooling strategies.
Size of Weights. We are very curious about the impact of different weight sizes on LST reconstruction performance. Does a larger weight size lead to better reconstruction performance? To address this question, we conduct an in-depth study of the effects of different versions of DMLP and their dynamically generated weight sizes on LST data reconstruction performance within the MCWG pathway. Different weight sizes indicate that the dynamic modality-conditioned convolution in the LSK pathway has varying receptive fields.
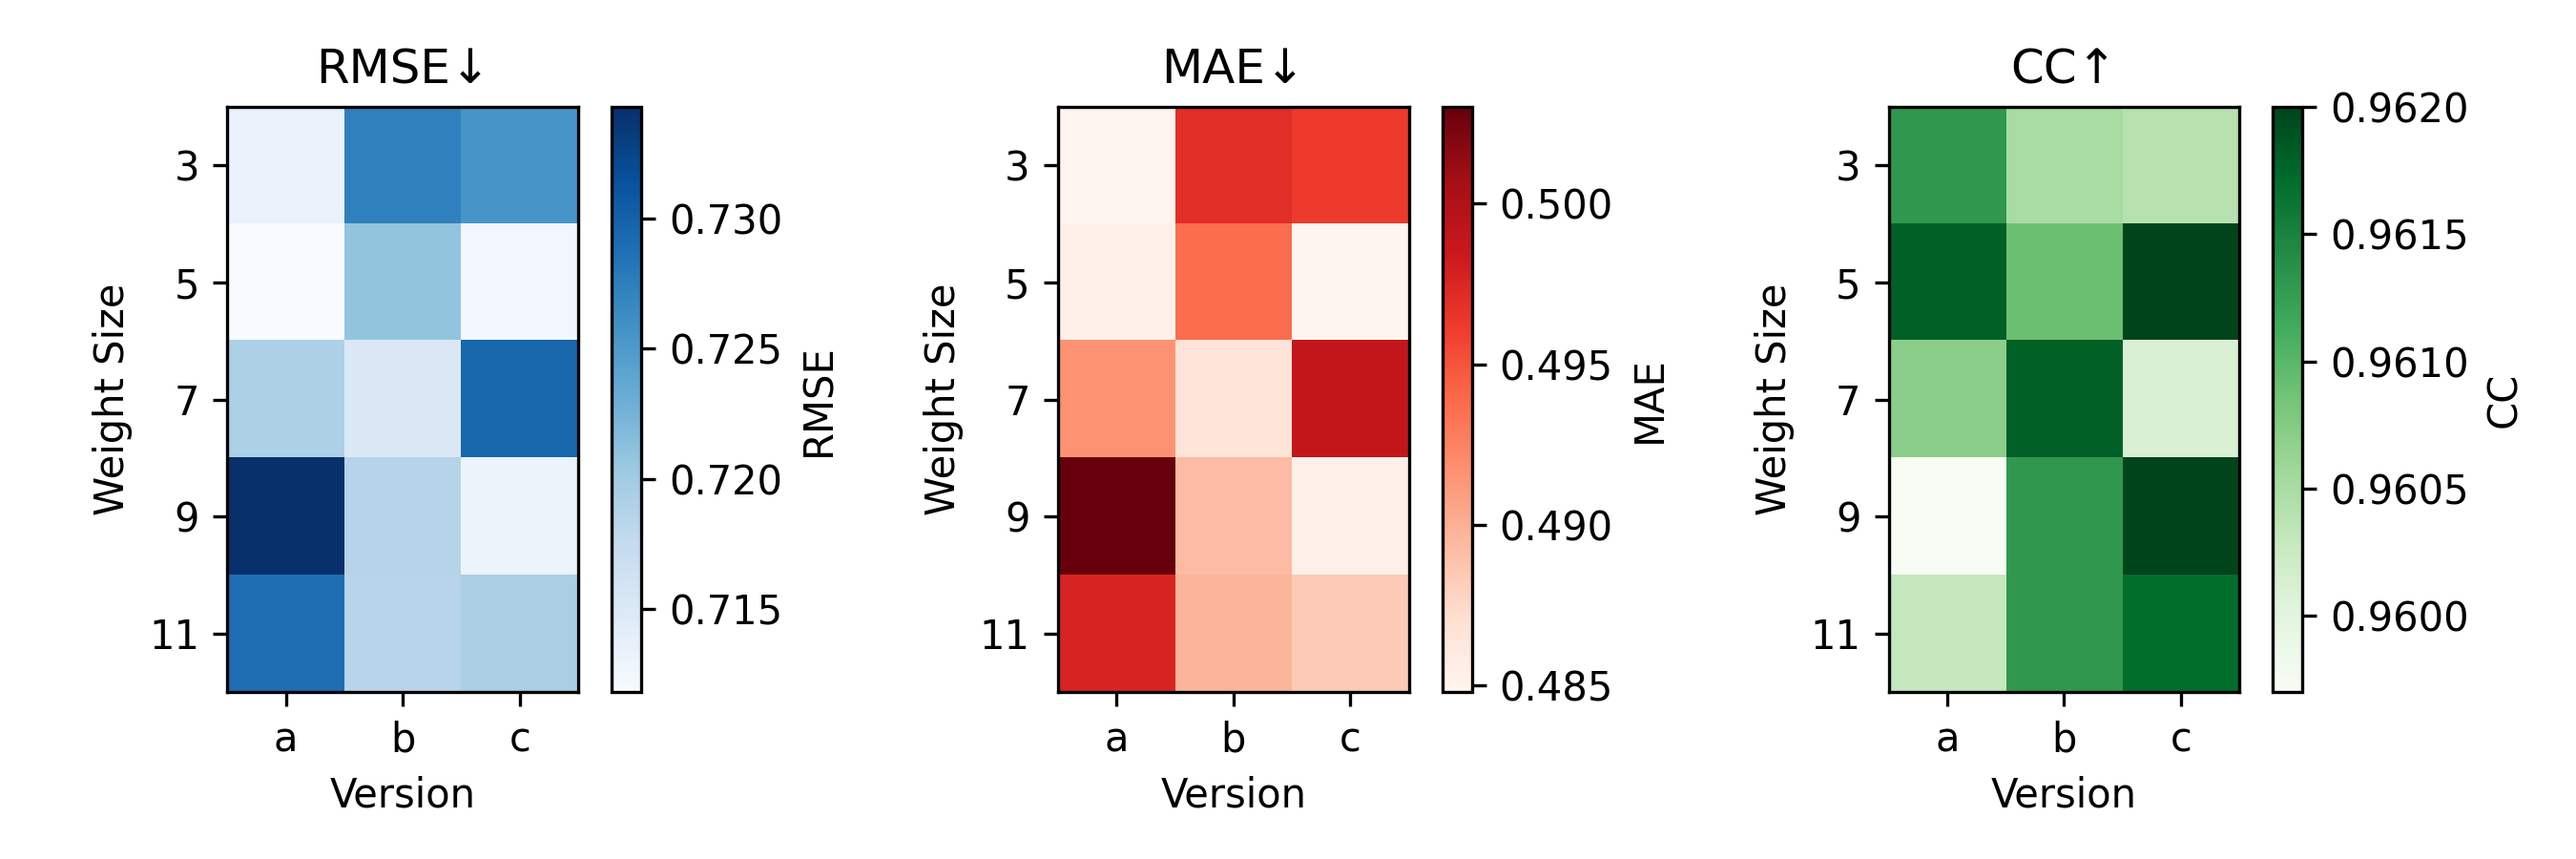
Fig. 6 provides detailed experimental results, focusing primarily on three metrics: RMSE, MAE, and CC. We can see the following facts: 1) The optimal weight sizes for different versions of DMLP vary but are generally similar. Version A has an optimal size of 55 (instead of the default 33), version B has 77, and version C also has 55 (with 99 being close). 2) Larger dynamically generated weight sizes don’t always lead to better performance. The optimal weight sizes are 55 or 77, which are generally consistent with the static standard convolution in the original LSK module [31] that uses a kernel size of 77.
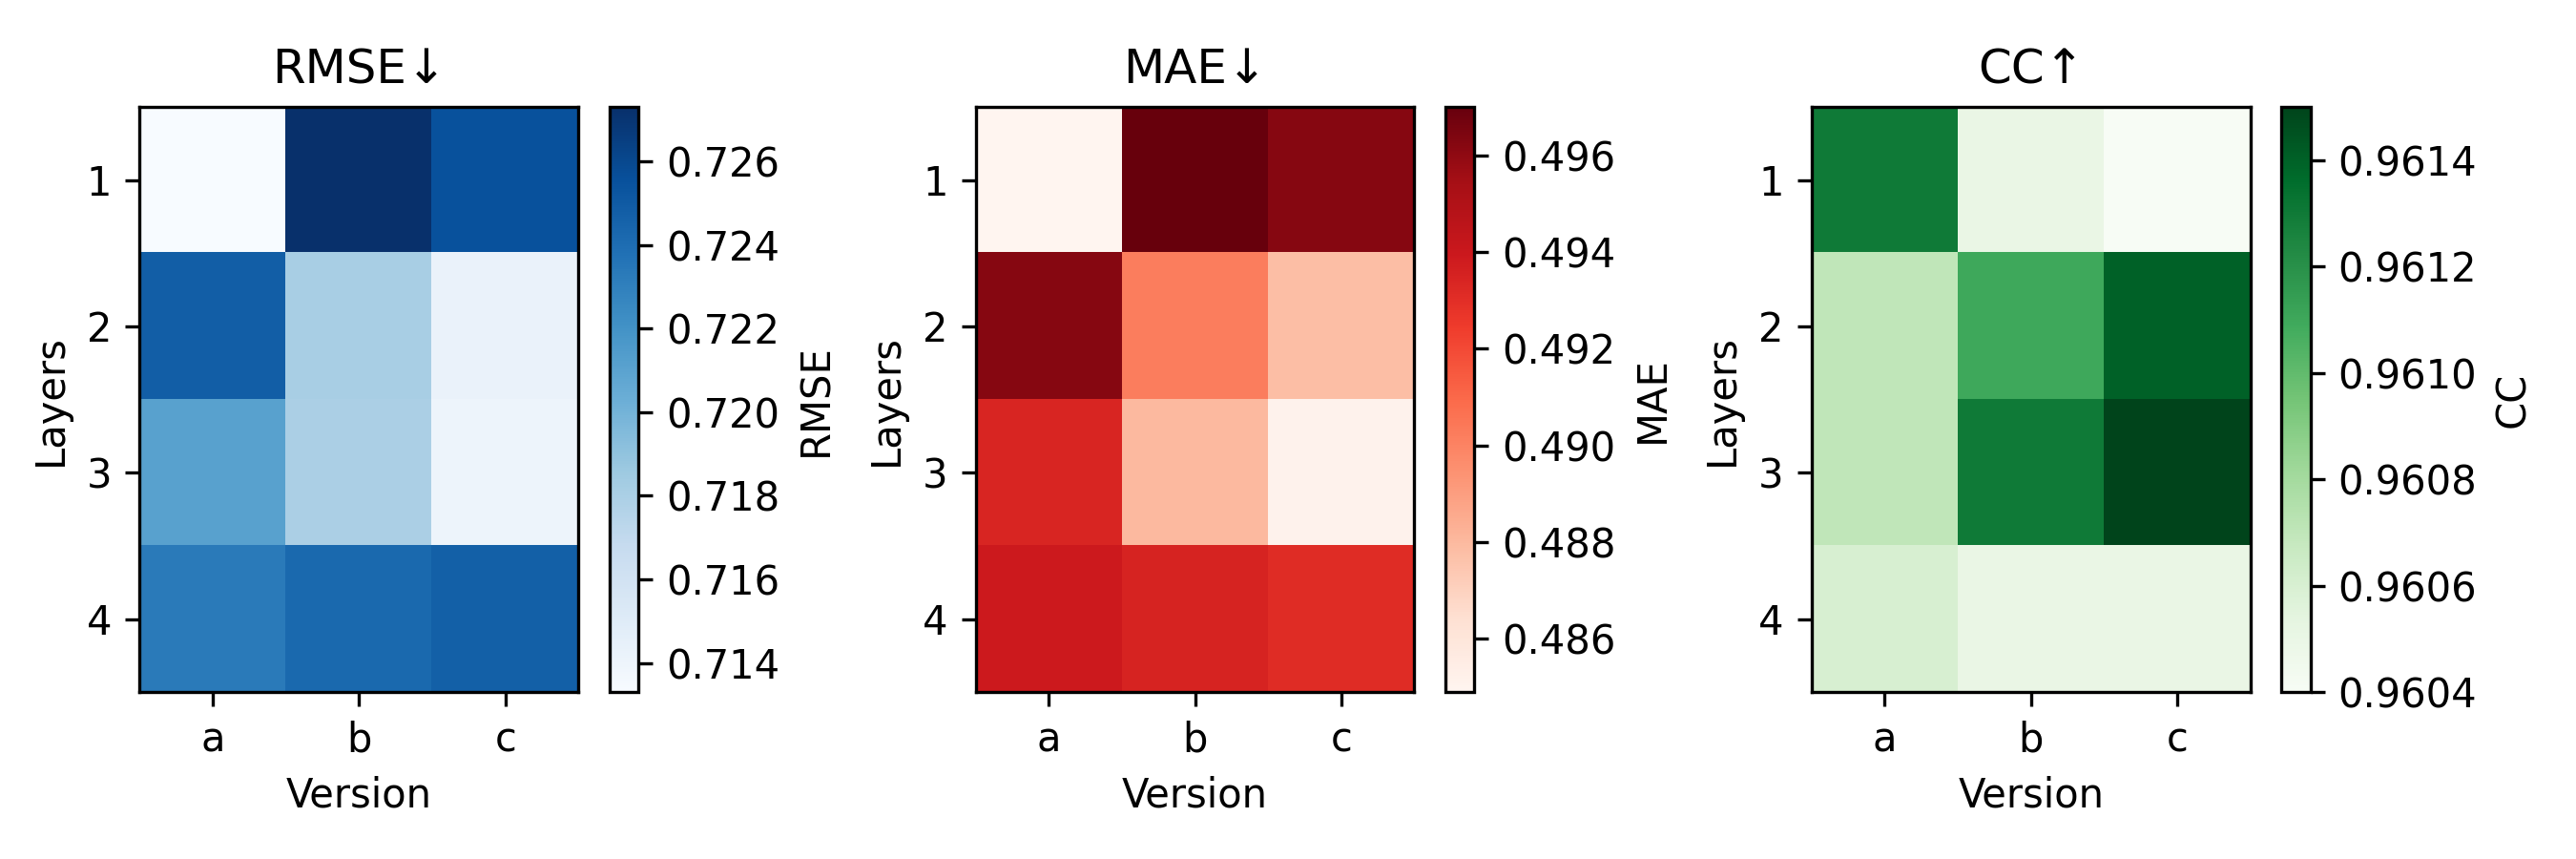
Number of Layers in DMLP. The number of layers in the MLP is a critical hyperparameter in different versions of the DMLP module. Fig. 7 shows the experimental results across three metrics, i.e., RMSE, MAE, and CC. We can clearly determine the optimal number of layers for different versions of the DMLP. Specifically, for the LST downscaling task, version A of DMLP achieves optimal performance with 1 layer, while versions B and C reach optimal reconstruction with 3 layers.
Number of Stages. Table V presents the impact of stacking different numbers of residual groups and the MoCoLSK module on LST reconstruction performance. Notably, a stage number of 4 achieves optimal reconstruction performance, whereas a number of 5 leads to a decline in performance.
| Stages | RMSE | MAE | BIAS | CC | RSD |
| 1 | 0.9076 | 0.6449 | 0.0017 | 0.9413 | 0.0553 |
| 2 | 0.8146 | 0.5738 | 0.0030 | 0.9506 | 0.0445 |
| 3 | 0.7511 | 0.5200 | 0.0041 | 0.9575 | 0.0360 |
| 4 | 0.7133 | 0.4849 | 0.0038 | 0.9613 | 0.0312 |
| 5 | 0.7441 | 0.4957 | 0.0042 | 0.9605 | 0.0306 |
Base Feature Dimension. In MoCoLSK-Net, the Base Feature Dimension (i.e., channel dimension) is also a critical hyperparameter. The channel dimensions of all modules in the network are in a multiplicative relationship (for details, see V-A2). As the dimension increases, the network’s reconstruction performance improves, as shown in Table VI. Due to memory constraints, we only increase the base dimension to 40, but we believe that further increasing the dimension appropriately would lead to even better reconstruction performance.
| Dim. | RMSE | MAE | BIAS | CC | RSD |
| 16 | 0.8719 | 0.6175 | 0.0030 | 0.9446 | 0.0512 |
| 24 | 0.7932 | 0.5549 | 0.0030 | 0.9536 | 0.0407 |
| 32 | 0.7133 | 0.4849 | 0.0038 | 0.9613 | 0.0312 |
| 40 | 0.6697 | 0.4445 | 0.0037 | 0.9663 | 0.0259 |
| Fusion Modules | S/C Sequence | RMSE | CC |
| MoCoLSK only | (S, S, S, S) | 0.7133 | 0.9613 |
| MoCoLSK-CS only | (C, C, C, C) | 0.7486 | 0.9599 |
| Interleaved MoCoLSK & MoCoLSK-CS | (S, C, S, C) | 0.7044 | 0.9627 |
| (C, S, C, S) | 0.7040 | 0.9627 | |
| (C, C, S, S) | 0.7181 | 0.9609 | |
| (S, S, C, C) | 0.7077 | 0.9621 | |
| (C, S, C, C) | 0.7000 | 0.9633 | |
| (S, C, S, S) | 0.7205 | 0.9606 |
Spatial Selection or Channel Selection? LSK-Net [31] proposes two feature selection modules, namely LSK-SS and LSK-CS, for spatial selection and channel selection, respectively. We also develop the MoCoLSK-CS module based on the channel selection mechanism, which integrates large kernel convolutions into the SK module [49], as illustrated in Fig. 8.
The default configuration of MoCoLSK-Net consists of four stages, each containing a MoCoLSK module. Therefore, to investigate the effectiveness of different selection mechanisms or interleaved selection mechanisms, we conduct a series of experiments. Table VII shows detailed configurations of the selection mechanisms along with the corresponding experimental results, allowing us to draw the following conclusions: 1) The reconstruction performance of the network configured solely with MoCoLSK modules outperforms that of the network configured only with MoCoLSK-CS modules. This indicates that for the LST downscaling task, spatial selection is significantly more important than channel selection. 2) MoCoLSK-Net with interleaved configurations of both MoCoLSK and MoCoLSK-CS modules has achieved relatively excellent performance, with the majority of interleaved configurations outperforming those with only MoCoLSK or MoCoLSK-CS modules. For example, four configurations, such as (S, C, S, C) and (C, S, C, S) representing average interleaving, as well as (S, S, C, C) and (C, S, C, C), show this trend. Among these, the configuration (C, S, C, C) achieves the best LST reconstruction performance in MoCoLSK-Net. Therefore, we recommend using the average interleaved configurations (S, C, S, C) and (C, S, C, S), or the optimal configuration (C, S, C, C) to achieve the LST downscaling task.
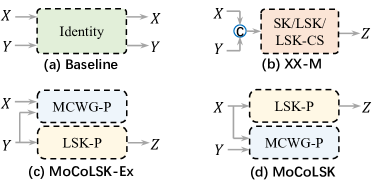
Comparison of Different Multimodal Selective Mechanisms. Fig. 1 presents several fusion modules based on multimodal selective mechanisms, such as SK-M and LSK-M. We compare these modules and their related variants with the MoCoLSK module to validate the effectiveness of MoCoLSK module. The thumbnails of all variants are shown in Fig. 9. Table VIII shows the experimental results of all variants, leading to the following conclusions: 1) The performance metrics of both the SK-M and LSK-CS-M modules are relatively poor, which further emphasizes that a fusion module with only a channel selection mechanism is not suitable for the LST downscaling task. 2) The LSK-M module demonstrates very good reconstruction performance, closely approaching that of our MoCoLSK. This highlights the importance of the spatial selection mechanism, particularly for the LST downscaling challenge. 3) The performance metrics of the MoCoLSK-Ex module are lower than those of our MoCoLSK module and even below the baseline. This indicates that feeding LST features into the LSK pathway is highly effective for reconstruction performance.
| No. | Fusion Modules | RMSE | CC |
| 1 | Baseline | 0.7405 | 0.9605 |
| 2 | SK-M | 1.0700 | 0.9181 |
| 3 | LSK-M | 0.7193 | 0.9612 |
| 4 | LSK-CS-M | 0.7314 | 0.9610 |
| 5 | MoCoLSK-Ex | 0.7461 | 0.9587 |
| 6 | MoCoLSK | 0.7133 | 0.9613 |
| Method | |||||||||||||||
| RMSE | MAE | BIAS | CC | RSD | RMSE | MAE | BIAS | CC | RSD | RMSE | MAE | BIAS | CC | RSD | |
| Interpolation | |||||||||||||||
| Bilinear | 0.6338 | 0.4292 | 0.0000 | 0.9794 | 0.0640 | 1.1798 | 0.8175 | 0.0000 | 0.9375 | 0.1277 | 1.7893 | 1.2787 | 0.0000 | 0.8664 | 0.2130 |
| Bicubic | 0.4818 | 0.3204 | 0.0000 | 0.9859 | 0.0278 | 1.0323 | 0.7069 | 0.0000 | 0.9478 | 0.0819 | 1.6709 | 1.1811 | 0.0000 | 0.8788 | 0.1612 |
| Single Image Downscaling | |||||||||||||||
| EDSR [37] | 0.4010 | 0.2605 | 0.0018 | 0.9889 | 0.0114 | 0.8921 | 0.6042 | 0.0061 | 0.9559 | 0.0441 | 1.4855 | 1.0397 | 0.0112 | 0.8933 | 0.1024 |
| RDN [25] | 0.3802 | 0.2478 | 0.0018 | 0.9898 | 0.0104 | 0.8227 | 0.5598 | 0.0066 | 0.9595 | 0.0400 | 1.2497 | 0.8742 | 0.0133 | 0.9110 | 0.0856 |
| RCAN [38] | 0.4046 | 0.2644 | 0.0017 | 0.9887 | 0.0117 | 0.8826 | 0.6009 | 0.0065 | 0.9562 | 0.0440 | 1.4446 | 1.0147 | 0.0114 | 0.8958 | 0.1017 |
| DBPN [63] | 0.4257 | 0.2803 | 0.0008 | 0.9879 | 0.0120 | 0.8865 | 0.6008 | 0.0072 | 0.9564 | 0.0431 | 1.4303 | 0.9982 | 0.0146 | 0.8975 | 0.0991 |
| CTNet [68] | 0.4012 | 0.2627 | 0.0021 | 0.9889 | 0.0118 | 0.8954 | 0.6064 | 0.0065 | 0.9561 | 0.0442 | - | - | - | - | - |
| FeNet [69] | 0.3995 | 0.2616 | 0.0017 | 0.9890 | 0.0116 | 0.9009 | 0.6118 | 0.0064 | 0.9557 | 0.0457 | 1.5193 | 1.0644 | 0.0113 | 0.8917 | 0.1074 |
| FENet [70] | 0.4018 | 0.2632 | 0.0020 | 0.9889 | 0.0117 | 0.8879 | 0.6017 | 0.0070 | 0.9564 | 0.0440 | 1.4844 | 1.0366 | 0.0135 | 0.8940 | 0.1030 |
| SRFBN [71] | 0.3962 | 0.2586 | 0.0020 | 0.9891 | 0.0113 | 0.8969 | 0.6067 | 0.0073 | 0.9560 | 0.0446 | 1.5212 | 1.0589 | 0.0131 | 0.8919 | 0.1060 |
| CFGN [72] | 0.4283 | 0.2814 | 0.0014 | 0.9877 | 0.0127 | 0.9386 | 0.6395 | 0.0053 | 0.9529 | 0.0485 | 1.5724 | 1.1052 | 0.0108 | 0.8867 | 0.1134 |
| DCTLSA [73] | 0.4616 | 0.2981 | -0.0056 | 0.9855 | 0.0226 | 0.9837 | 0.6720 | 0.0212 | 0.9456 | 0.0590 | 1.6282 | 1.1488 | -0.0107 | 0.8708 | 0.1156 |
| Guided Image Downscaling | |||||||||||||||
| MSG-Net [74] | 0.4294 | 0.2829 | 0.0021 | 0.9877 | 0.0120 | 0.8651 | 0.5914 | 0.0043 | 0.9578 | 0.0412 | 1.3418 | 0.9442 | 0.0070 | 0.9048 | 0.0893 |
| DGF [75] | 0.6577 | 0.4447 | 0.0000 | 0.9767 | 0.0571 | 1.0702 | 0.7339 | 0.0003 | 0.9448 | 0.0907 | 1.6574 | 1.1707 | 0.0002 | 0.8795 | 0.1589 |
| SVLRM [76] | 0.4612 | 0.3085 | 0.0045 | 0.9863 | 0.0232 | 0.8611 | 0.5974 | 0.0017 | 0.9567 | 0.0513 | 1.2357 | 0.8815 | -0.0101 | 0.9135 | 0.0863 |
| DJFR [77] | 0.3933 | 0.2603 | 0.0013 | 0.9891 | 0.0112 | 0.7784 | 0.5382 | 0.0031 | 0.9642 | 0.0390 | 1.1892 | 0.8436 | 0.0010 | 0.9181 | 0.0809 |
| P2P [78] | 0.4788 | 0.3200 | -0.0041 | 0.9860 | 0.0227 | 1.0003 | 0.6898 | -0.0298 | 0.9497 | 0.0602 | 1.5409 | 1.0952 | -0.0964 | 0.8914 | 0.1062 |
| DSRN [79] | 0.4480 | 0.2956 | 0.0574 | 0.9875 | 0.0243 | 0.9562 | 0.6543 | 0.1458 | 0.9525 | 0.0724 | 1.5587 | 1.1023 | 0.2025 | 0.8891 | 0.1477 |
| FDSR [47] | 0.4065 | 0.2698 | 0.0013 | 0.9885 | 0.0125 | 0.7779 | 0.5371 | 0.0047 | 0.9619 | 0.0396 | 1.1395 | 0.8096 | 0.0047 | 0.9210 | 0.0783 |
| DKN [80] | 0.4071 | 0.2695 | 0.0041 | 0.9884 | 0.0135 | 0.8388 | 0.5727 | 0.0026 | 0.9574 | 0.0416 | 1.3719 | 0.9589 | 0.0036 | 0.8976 | 0.1042 |
| FDKN [80] | 0.3717 | 0.2449 | 0.0032 | 0.9901 | 0.0099 | 0.7946 | 0.5456 | 0.0032 | 0.9612 | 0.0387 | 1.3312 | 0.9335 | 0.0038 | 0.9061 | 0.0978 |
| AHMF [44] | 0.3557 | 0.2348 | 0.0017 | 0.9908 | 0.0097 | 0.7224 | 0.4996 | 0.0028 | 0.9655 | 0.0352 | 1.1246 | 0.7959 | 0.0019 | 0.9229 | 0.0764 |
| CODON [81] | - | - | - | - | - | 0.9617 | 0.6642 | 0.0210 | 0.9492 | 0.0531 | 1.6690 | 1.1799 | -0.0001 | 0.8789 | 0.1608 |
| SUFT [45] | 0.3130 | 0.2093 | 0.0011 | 0.9927 | 0.0075 | 0.6046 | 0.4207 | 0.0021 | 0.9737 | 0.0265 | 0.8598 | 0.6061 | 0.0025 | 0.9468 | 0.0489 |
| DAGF [82] | 0.3917 | 0.2589 | 0.0005 | 0.9892 | 0.0110 | 0.7910 | 0.5451 | 0.0063 | 0.9613 | 0.0391 | 1.1935 | 0.8469 | 0.0070 | 0.9170 | 0.0879 |
| RSAG [26] | - | - | - | - | - | 0.7223 | 0.4990 | 0.0026 | 0.9654 | 0.0350 | 1.0118 | 0.7154 | 0.0012 | 0.9330 | 0.0638 |
| MoCoLSK | 0.2902 | 0.1951 | 0.0009 | 0.9937 | 0.0062 | 0.5590 | 0.3883 | 0.0020 | 0.9771 | 0.0218 | 0.8031 | 0.5642 | 0.0027 | 0.9514 | 0.0456 |
Which normalization method is better? The guided LST downscaling task comprises two parts of data: the LST data to be super-resolved and the guidance data. We raise two crucial questions: 1) Is it necessary to normalize both modalities of data? 2) Which normalization method should be adopted for both types of data to maximize the model’s performance?
We investigated three normalization techniques on a large number of SOTA deep learning-based downscaling methods, including single image downscaling and guided image downscaling methods: no normalization (denoted as None), Z-score, and Min-Max. The definitions of Z-score and Min-Max are as follows:
| (17) |
| (18) |
where is the original SLT data, , , and are the mean, standard deviation, minimum value, and maximum value of all LST data in the GrokLST dataset, respectively.
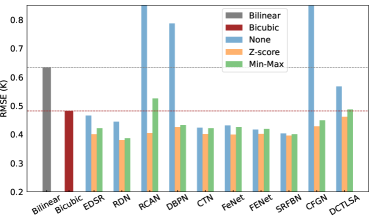
Fig. 10 illustrates a comparison of RMSE for LST data across ten advanced single image downscaling methods using different normalization techniques, revealing several key findings: 1) Models without normalization perform worse than those with normalization, and may even lead to difficulties in model convergence. 2) Models using Z-score normalization generally exhibit better performance compared to those using Min-Max normalization.
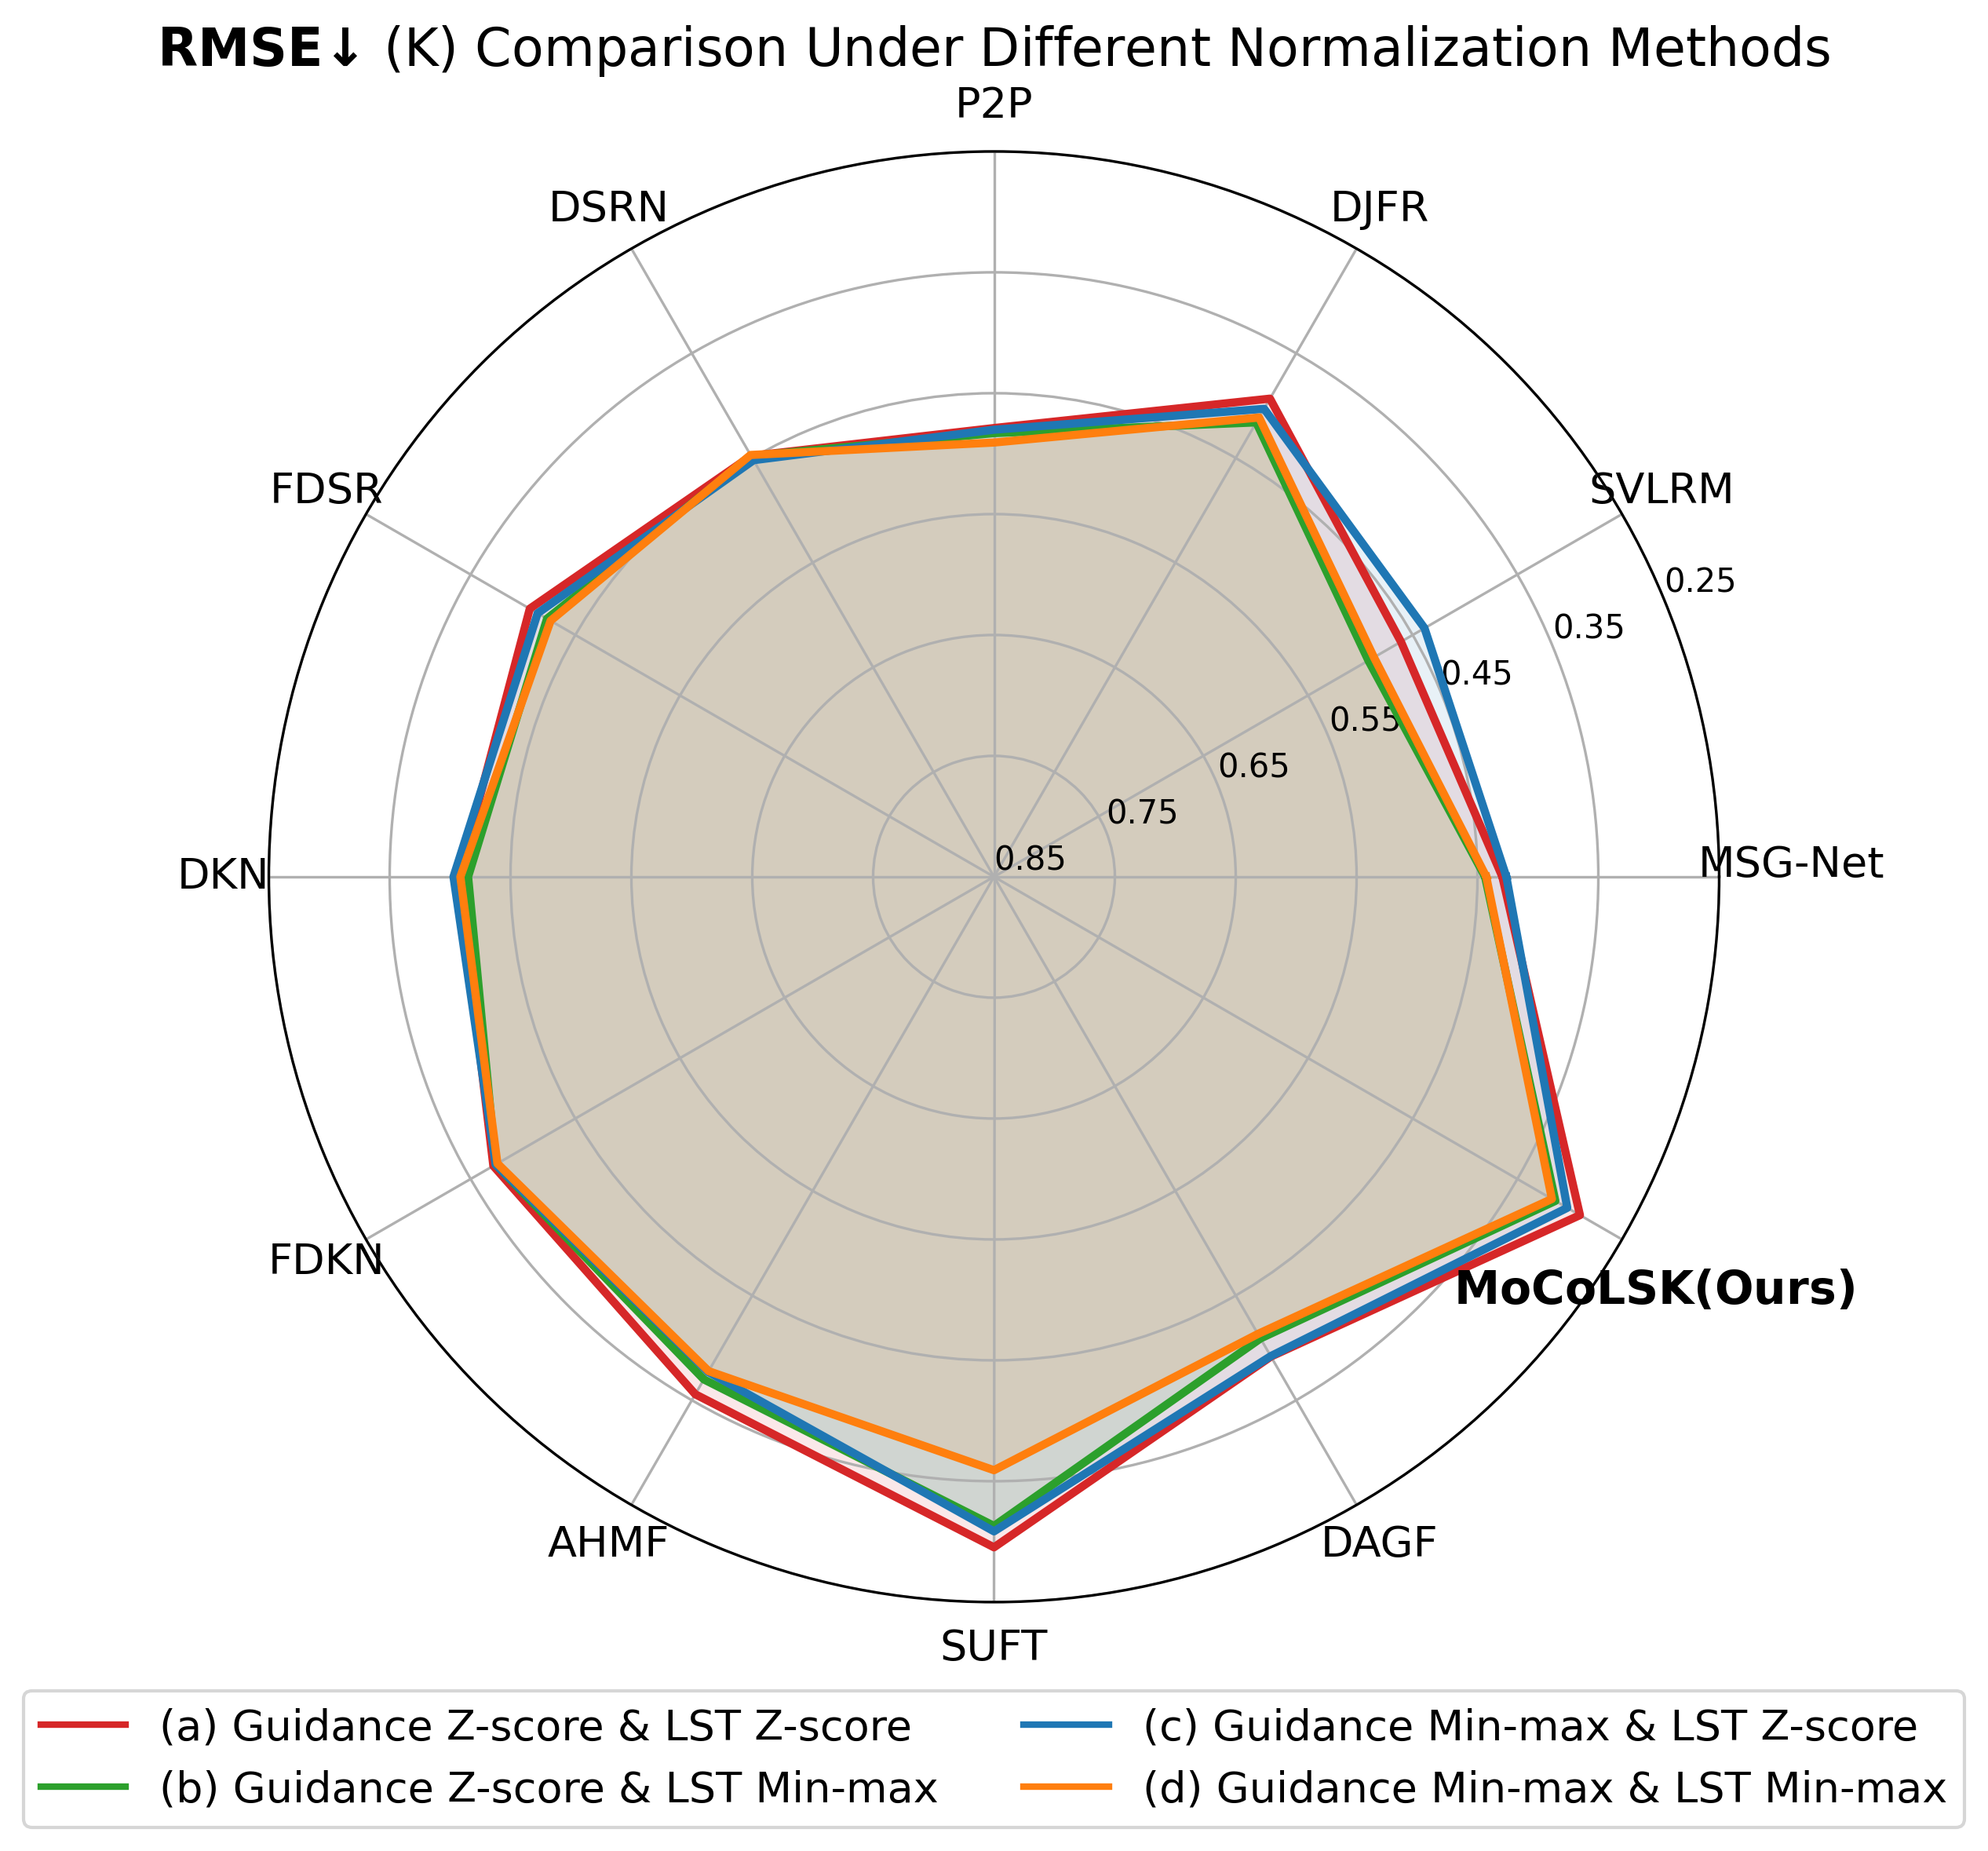
Fig. 11 shows the RMSE results for LST data and guidance data using different normalization methods across twelve SOTA models, highlighting several key points: 1) LST data tends to favor Z-score normalization. For example, most models using strategies (a) and (c) exhibit significantly better reconstruction performance compared to those using strategies (b) and (d). 2) Models using methods (a) and (c) both achieve good reconstruction performance, with method (a) showing superior results. Specifically, applying Z-score normalization to both guidance data and LST data typically enhances the reconstruction performance of most models. 3) Models using strategies (b) and (d) show almost identical reconstruction performance (except for SUFT). Further analysis suggests that most models may favor strategy (b), indicating a preference for Z-score normalization of guidance data as well.
Finally, we want to emphasize the importance and necessity of data normalization for LST downscaling tasks. Regardless of using single image or guided image downscaling deep learning models, Z-score normalization is worth considering for handling LST or guidance data.

V-C Comparison with State-of-the-Arts
We benchmark the reconstruction performance of our MoCoLSK-Net against current advanced downscaling methods, including two traditional interpolation methods, ten single image downscaling methods, and fourteen guided image downscaling methods. The benchmarking spans three scales: 2, 4, and 8, and is conducted on the GrokLST dataset using five evaluation metrics: RMSE, MAE, BIAS, CC, and RSD. The findings from the experiment are presented in Table IX. The following are our main conclusions:
1) Our MoCoLSK-Net achieves the best performance in almost all metrics (except for the BIAS metric) across various scale reconstruction challenges, highlighting the effectiveness of our dynamically adaptive cross-modal fusion MoCoLSK module. The MCWG pathway and the LSK pathway are integrated through the MoCoLSK module, allowing for dynamic adjustment of the receptive field to achieve adaptive multi-modal feature fusion. Through this modality-conditioned dynamic multi-modal feature fusion, our MoCoLSK-Net surpasses all other SOTA methods, achieving the most accurate land surface temperature downscaling results.
2) Almost all deep learning downscaling methods, including single image downscaling methods and guided image downscaling methods, outperform traditional interpolation methods such as Bilinear and Bicubic. Additionally, we find that the upper limit of reconstruction performance for guided image downscaling methods is significantly higher than that of single image downscaling methods. For example, the single image downscaling method RDN, which has the best reconstruction performance among its peers, still falls short in several metrics compared to many guided image downscaling methods, such as FDKN, AHMF, SUFT, and our MoCoLSK-Net.
3) Our MoCoLSK-Net consistently outperforms the SUFT method in challenging reconstruction tasks across three scales. SUFT constructs an iterative up-sampling and down-sampling pipeline to address resolution gaps and employs a symmetric uncertainty scheme to remove harmful guidance information for HR image reconstruction, which contributes to its excellent performance. In contrast, MoCoLSK-Net leverages dynamic adaptive multi-modal fusion and efficient multi-scale spatial feature selection mechanism to finely reconstruct high-frequency details of LST, thereby achieving superior results.
V-D Visual Analysis
The qualitative results presented in Fig. 12 provide an intuitive comparison of the reconstruction performance of various methods on representative images from the GrokLST dataset, complementing the previously discussed quantitative metrics. From the visualized images reconstructed by different methods at 8 downscaling challenge, we can intuitively gain the following crucial insights:
1) The visual effects of traditional interpolation algorithms are the most blurred. Additionally, the visual results of single image downscaling methods are generally inferior to those of guided image downscaling methods. This indicates that traditional interpolation algorithms are indeed inferior to contemporary deep learning methods. It also demonstrates that image downscaling methods guided by auxiliary information can provide more useful detail for image reconstruction, resulting in superior reconstruction outcomes compared to single image downscaling methods.
2) Thanks to the effective iterative upsampling and downsampling framework and the dynamically adaptive multi-modal fusion module, i.e., the MoCoLSK module, the visual results of our MoCoLSK-Net consistently beat those of existing SOTA methods. Specifically, from the zoomed-in local patches of the top and middle images in Fig. 12, it is clear that MoCoLSK-Net not only possesses more detailed texture structures but also exhibits richer and more accurate local contrast. This demonstrates its superior reconstruction performance, achieving the most precise prediction of surface temperatures. Furthermore, in the zoomed-in local patches of the bottom image in Fig. 12, SVLRM and DJFR exhibit the most pronounced contrast, even surpassing the ground truth, indicating that their predicted surface temperatures are higher (i.e., the local regions appear more red in the visual results). In addition, SUFT, DAGF, and RSAG also exhibit decent visual results, but upon closer inspection, they do not match MoCoLSK-Net. Our MoCoLSK-Net’s reconstructed LST image features richer detail textures and more accurate temperatures, with the red areas aligning more closely with the corresponding regions in the ground truth.
VI Conclusion
In summary, to foster rapid development within the LST super-resolution community, we have not only created a High-Resolution Benchmark Dataset, namely the GrokLST dataset, but also contributed an open-source LST Downscaling Toolkit, the GrokLST Toolkit, which includes over 40 super-resolution models. Furthermore, this study proposes a novel and effective dynamic multi-modal fusion network, MoCoLSK-Net, to tackle the challenge of high-resolution guided downscaling of land surface temperature. Based on quantitative and qualitative comparisons with 24 deep learning models on the GrokLST dataset, our MoCoLSK-Net has demonstrated the most outstanding reconstruction performance, achieving the most precise predictions of land surface temperature. This is primarily attributed to an iterative up-sampling and down-sampling pipeline and the dynamic adaptive multi-modal fusion module, known as the MoCoLSK module.
Acknowledgment
The authors would like to thank the International Research Center of Big Data for Sustainable Development Goals (CBAS) for kindly providing the SDGSAT-1 data.
References
- [1] A. Jia, S. Liang, and D. Wang, “Generating a 2-km, all-sky, hourly land surface temperature product from advanced baseline imager data,” Remote Sensing of Environment, vol. 278, p. 113105, 2022.
- [2] Y. Hu, R. Tang, X. Jiang, Z.-L. Li, Y. Jiang, M. Liu, C. Gao, and X. Zhou, “A physical method for downscaling land surface temperatures using surface energy balance theory,” Remote Sensing of Environment, vol. 286, p. 113421, 2023.
- [3] Z.-L. Li, H. Wu, S.-B. Duan, W. Zhao, H. Ren, X. Liu, P. Leng, R. Tang, X. Ye, J. Zhu, Y. Sun, M. Si, M. Liu, J. Li, X. Zhang, G. Shang, B.-H. Tang, G. Yan, and C. Zhou, “Satellite remote sensing of global land surface temperature: Definition, methods, products, and applications,” Reviews of Geophysics, vol. 61, no. 1, p. e2022RG000777, 2023.
- [4] Y. Su, C. Zhang, P. Ciais, Z. Zeng, A. Cescatti, J. Shang, J. M. Chen, J. Liu, Y.-P. Wang, W. Yuan et al., “Asymmetric influence of forest cover gain and loss on land surface temperature,” Nature Climate Change, vol. 13, no. 8, pp. 823–831, 2023.
- [5] D. Wang, Y. Chen, L. Hu, J. A. Voogt, J.-P. Gastellu-Etchegorry, and E. S. Krayenhoff, “Modeling the angular effect of modis lst in urban areas: A case study of toulouse, france,” Remote Sensing of Environment, vol. 257, p. 112361, 2021.
- [6] A. Siddiqui, G. Kushwaha, B. Nikam, S. Srivastav, A. Shelar, and P. Kumar, “Analysing the day/night seasonal and annual changes and trends in land surface temperature and surface urban heat island intensity (suhii) for indian cities,” Sustainable Cities and Society, vol. 75, p. 103374, 2021.
- [7] Y. Bai, N. Bhattarai, K. Mallick, S. Zhang, T. Hu, and J. Zhang, “Thermally derived evapotranspiration from the surface temperature initiated closure (stic) model improves cropland gpp estimates under dry conditions,” Remote Sensing of Environment, vol. 271, p. 112901, 2022.
- [8] B. Zhu, Y. Cheng, X. Hu, Y. Chai, W. R. Berghuijs, A. G. Borthwick, and L. Slater, “Constrained tropical land temperature-precipitation sensitivity reveals decreasing evapotranspiration and faster vegetation greening in cmip6 projections,” npj Climate and Atmospheric Science, vol. 6, no. 1, p. 91, 2023.
- [9] W. Zhu, L. Fan, and S. Jia, “Integration of microwave satellite soil moisture products in the contextual surface temperature-vegetation index models for spatially continuous evapotranspiration estimation,” ISPRS Journal of Photogrammetry and Remote Sensing, vol. 203, pp. 211–229, 2023.
- [10] R. Tang, Z. Peng, M. Liu, Z.-L. Li, Y. Jiang, Y. Hu, L. Huang, Y. Wang, J. Wang, L. Jia, C. Zheng, Y. Zhang, K. Zhang, Y. Yao, X. Chen, Y. Xiong, Z. Zeng, and J. B. Fisher, “Spatial-temporal patterns of land surface evapotranspiration from global products,” Remote Sensing of Environment, vol. 304, p. 114066, 2024.
- [11] M. Romaguera, R. G. Vaughan, J. Ettema, E. Izquierdo-Verdiguier, C. Hecker, and F. Van der Meer, “Detecting geothermal anomalies and evaluating lst geothermal component by combining thermal remote sensing time series and land surface model data,” Remote Sensing of Environment, vol. 204, pp. 534–552, 2018.
- [12] R. Pu, “Assessing scaling effect in downscaling land surface temperature in a heterogenous urban environment,” International Journal of Applied Earth Observation and Geoinformation, vol. 96, p. 102256, 2021.
- [13] D. Hu, F. Guo, Q. Meng, U. Schlink, S. Wang, D. Hertel, and J. Gao, “A novel dual-layer composite framework for downscaling urban land surface temperature coupled with spatial autocorrelation and spatial heterogeneity,” International Journal of Applied Earth Observation and Geoinformation, vol. 130, p. 103900, 2024.
- [14] X. Ye, J. Hui, P. Wang, J. Zhu, and B. Yang, “A modified transfer-learning-based approach for retrieving land surface temperature from landsat-8 tirs data,” IEEE Transactions on Geoscience and Remote Sensing, vol. 61, pp. 1–11, 2023.
- [15] W. Tang, J. Zhou, J. Ma, Z. Wang, L. Ding, X. Zhang, and X. Zhang, “Trims lst: a daily 1 km all-weather land surface temperature dataset for china’s landmass and surrounding areas (2000–2022),” Earth System Science Data, vol. 16, no. 1, pp. 387–419, 2024.
- [16] M. Sdraka, I. Papoutsis, B. Psomas, K. Vlachos, K. Ioannidis, K. Karantzalos, I. Gialampoukidis, and S. Vrochidis, “Deep learning for downscaling remote sensing images: Fusion and super-resolution,” IEEE Geoscience and Remote Sensing Magazine, vol. 10, no. 3, pp. 202–255, 2022.
- [17] C. Yang, Q. Zhan, Y. Lv, and H. Liu, “Downscaling land surface temperature using multiscale geographically weighted regression over heterogeneous landscapes in wuhan, china,” IEEE Journal of Selected Topics in Applied Earth Observations and Remote Sensing, vol. 12, no. 12, pp. 5213–5222, 2019.
- [18] Y. Peng, W. Li, X. Luo, and H. Li, “A geographically and temporally weighted regression model for spatial downscaling of modis land surface temperatures over urban heterogeneous regions,” IEEE Transactions on Geoscience and Remote Sensing, vol. 57, no. 7, pp. 5012–5027, 2019.
- [19] F. Guo, D. Hu, and U. Schlink, “A new nonlinear method for downscaling land surface temperature by integrating guided and gaussian filtering,” Remote Sensing of Environment, vol. 271, p. 112915, 2022.
- [20] C. Yoo, J. Im, D. Cho, Y. Lee, D. Bae, and P. Sismanidis, “Downscaling modis nighttime land surface temperatures in urban areas using aster thermal data through local linear forest,” International Journal of Applied Earth Observation and Geoinformation, vol. 110, p. 102827, 2022.
- [21] J. Wu, L. Xia, T. O. Chan, J. Awange, and B. Zhong, “Downscaling land surface temperature: A framework based on geographically and temporally neural network weighted autoregressive model with spatio-temporal fused scaling factors,” ISPRS Journal of Photogrammetry and Remote Sensing, vol. 187, pp. 259–272, 2022.
- [22] P. Dong, W. Zhan, C. Wang, S. Jiang, H. Du, Z. Liu, Y. Chen, L. Li, S. Wang, and Y. Ji, “Simple yet efficient downscaling of land surface temperatures by suitably integrating kernel-and fusion-based methods,” ISPRS Journal of Photogrammetry and Remote Sensing, vol. 205, pp. 317–333, 2023.
- [23] C. Dong, C. C. Loy, K. He, and X. Tang, “Learning a deep convolutional network for image super-resolution,” in Computer Vision–ECCV 2014: 13th European Conference, Zurich, Switzerland, September 6-12, 2014, Proceedings, Part IV 13. Springer, 2014, pp. 184–199.
- [24] B. Lim, S. Son, H. Kim, S. Nah, and K. Mu Lee, “Enhanced deep residual networks for single image super-resolution,” in Proceedings of the IEEE conference on computer vision and pattern recognition workshops, 2017, pp. 136–144.
- [25] Y. Zhang, Y. Tian, Y. Kong, B. Zhong, and Y. Fu, “Residual dense network for image super-resolution,” in Proceedings of the IEEE conference on computer vision and pattern recognition, 2018, pp. 2472–2481.
- [26] J. Yuan, H. Jiang, X. Li, J. Qian, J. Li, and J. Yang, “Recurrent structure attention guidance for depth super-resolution,” in Proceedings of the AAAI Conference on Artificial Intelligence, vol. 37, no. 3, 2023, pp. 3331–3339.
- [27] Z. Wang, Z. Yan, and J. Yang, “Sgnet: Structure guided network via gradient-frequency awareness for depth map super-resolution,” in Proceedings of the AAAI Conference on Artificial Intelligence, vol. 38, no. 6, 2024, pp. 5823–5831.
- [28] F. Wang and D. Tian, “On deep learning-based bias correction and downscaling of multiple climate models simulations,” Climate Dynamics, vol. 59, no. 11, pp. 3451–3468, 2022.
- [29] R. Mukherjee and D. Liu, “Downscaling modis spectral bands using deep learning,” GIScience & Remote Sensing, vol. 58, no. 8, pp. 1300–1315, 2021.
- [30] Y. Sun, K. Deng, K. Ren, J. Liu, C. Deng, and Y. Jin, “Deep learning in statistical downscaling for deriving high spatial resolution gridded meteorological data: A systematic review,” ISPRS Journal of Photogrammetry and Remote Sensing, vol. 208, pp. 14–38, 2024.
- [31] Y. Li, Q. Hou, Z. Zheng, M.-M. Cheng, J. Yang, and X. Li, “Large selective kernel network for remote sensing object detection,” in 2023 IEEE/CVF International Conference on Computer Vision (ICCV), 2023, pp. 16 748–16 759.
- [32] F. Wang, D. Tian, L. Lowe, L. Kalin, and J. Lehrter, “Deep learning for daily precipitation and temperature downscaling,” Water Resources Research, vol. 57, no. 4, p. e2020WR029308, 2021.
- [33] U. Mital, D. Dwivedi, J. B. Brown, and C. I. Steefel, “Downscaled hyper-resolution (400 m) gridded datasets of daily precipitation and temperature (2008–2019) for the east–taylor subbasin (western united states),” Earth System Science Data, vol. 14, no. 11, pp. 4949–4966, 2022. [Online]. Available: https://essd.copernicus.org/articles/14/4949/2022/
- [34] A. Vaughan, W. Tebbutt, J. S. Hosking, and R. E. Turner, “Convolutional conditional neural processes for local climate downscaling,” Geoscientific Model Development, vol. 15, no. 1, pp. 251–268, 2022. [Online]. Available: https://gmd.copernicus.org/articles/15/251/2022/
- [35] Z. Yu, K. Yang, Y. Luo, P. Wang, and Z. Yang, “Research on the lake surface water temperature downscaling based on deep learning,” IEEE Journal of Selected Topics in Applied Earth Observations and Remote Sensing, vol. 14, pp. 5550–5558, 2021.
- [36] J. Baño Medina, R. Manzanas, and J. M. Gutiérrez, “Configuration and intercomparison of deep learning neural models for statistical downscaling,” Geoscientific Model Development, vol. 13, no. 4, pp. 2109–2124, 2020.
- [37] B. Lim, S. Son, H. Kim, S. Nah, and K. Mu Lee, “Enhanced deep residual networks for single image super-resolution,” in Proceedings of the IEEE conference on computer vision and pattern recognition workshops, 2017, pp. 136–144.
- [38] Y. Zhang, K. Li, K. Li, L. Wang, B. Zhong, and Y. Fu, “Image super-resolution using very deep residual channel attention networks,” in Proceedings of the European conference on computer vision (ECCV), 2018, pp. 286–301.
- [39] A. Li, L. Zhang, Y. Liu, and C. Zhu, “Feature modulation transformer: Cross-refinement of global representation via high-frequency prior for image super-resolution,” in Proceedings of the IEEE/CVF International Conference on Computer Vision, 2023, pp. 12 514–12 524.
- [40] Z. Zhao, J. Zhang, S. Xu, Z. Lin, and H. Pfister, “Discrete cosine transform network for guided depth map super-resolution,” in Proceedings of the IEEE/CVF conference on computer vision and pattern recognition, 2022, pp. 5697–5707.
- [41] N. Metzger, R. C. Daudt, and K. Schindler, “Guided depth super-resolution by deep anisotropic diffusion,” in Proceedings of the IEEE/CVF Conference on Computer Vision and Pattern Recognition, 2023, pp. 18 237–18 246.
- [42] Z. Xiang, L. Xiao, J. Yang, W. Liao, and W. Philips, “Detail-injection-model-inspired deep fusion network for pansharpening,” IEEE Transactions on Geoscience and Remote Sensing, vol. 60, pp. 1–15, 2022.
- [43] M. Zhou, K. Yan, J. Pan, W. Ren, Q. Xie, and X. Cao, “Memory-augmented deep unfolding network for guided image super-resolution,” International Journal of Computer Vision, vol. 131, no. 1, pp. 215–242, 2023.
- [44] Z. Zhong, X. Liu, J. Jiang, D. Zhao, Z. Chen, and X. Ji, “High-resolution depth maps imaging via attention-based hierarchical multi-modal fusion,” IEEE Transactions on Image Processing, vol. 31, pp. 648–663, 2021.
- [45] W. Shi, M. Ye, and B. Du, “Symmetric uncertainty-aware feature transmission for depth super-resolution,” in Proceedings of the 30th ACM International Conference on Multimedia, 2022, pp. 3867–3876.
- [46] X. Deng and P. L. Dragotti, “Deep convolutional neural network for multi-modal image restoration and fusion,” IEEE transactions on pattern analysis and machine intelligence, vol. 43, no. 10, pp. 3333–3348, 2020.
- [47] L. He, H. Zhu, F. Li, H. Bai, R. Cong, C. Zhang, C. Lin, M. Liu, and Y. Zhao, “Towards fast and accurate real-world depth super-resolution: Benchmark dataset and baseline,” in Proceedings of the IEEE/CVF conference on computer vision and pattern recognition, 2021, pp. 9229–9238.
- [48] Z. Zhu, X. Cao, M. Zhou, J. Huang, and D. Meng, “Probability-based global cross-modal upsampling for pansharpening,” in Proceedings of the IEEE/CVF Conference on Computer Vision and Pattern Recognition, 2023, pp. 14 039–14 048.
- [49] X. Li, W. Wang, X. Hu, and J. Yang, “Selective kernel networks,” in Proceedings of the IEEE/CVF conference on computer vision and pattern recognition, 2019, pp. 510–519.
- [50] Y. Dai, F. Gieseke, S. Oehmcke, Y. Wu, and K. Barnard, “Attentional feature fusion,” in 2021 IEEE Winter Conference on Applications of Computer Vision (WACV), 2021, pp. 3559–3568.
- [51] H. Zhang, C. Wu, Z. Zhang, Y. Zhu, H. Lin, Z. Zhang, Y. Sun, T. He, J. Mueller, R. Manmatha et al., “Resnest: Split-attention networks,” in Proceedings of the IEEE/CVF conference on computer vision and pattern recognition, 2022, pp. 2736–2746.
- [52] J.-J. Liu, Q. Hou, M.-M. Cheng, C. Wang, and J. Feng, “Improving convolutional networks with self-calibrated convolutions,” in Proceedings of the IEEE/CVF conference on computer vision and pattern recognition, 2020, pp. 10 096–10 105.
- [53] H. Guo, C. Dou, H. Chen, J. Liu, B. Fu, X. Li, Z. Zou, and D. Liang, “Sdgsat-1: the world’s first scientific satellite for sustainable development goals,” Science Bulletin, vol. 68, no. 1, pp. 34–38, 2023.
- [54] D. Sun and R. T. Pinker, “Estimation of land surface temperature from a geostationary operational environmental satellite (goes-8),” Journal of Geophysical Research: Atmospheres, vol. 108, no. D11, 2003.
- [55] A. Baldridge, S. Hook, C. Grove, and G. Rivera, “The aster spectral library version 2.0,” Remote Sensing of Environment, vol. 113, no. 4, pp. 711–715, 2009.
- [56] A. K. Z. Qin and P. Berliner, “A mono-window algorithm for retrieving land surface temperature from landsat tm data and its application to the israel-egypt border region,” International Journal of Remote Sensing, vol. 22, no. 18, pp. 3719–3746, 2001.
- [57] H. Hersbach, B. Bell, P. Berrisford, S. Hirahara, A. Horányi, J. Muñoz-Sabater, J. Nicolas, C. Peubey, R. Radu, D. Schepers, A. Simmons, C. Soci, S. Abdalla, X. Abellan, G. Balsamo, P. Bechtold, G. Biavati, J. Bidlot, M. Bonavita, G. De Chiara, P. Dahlgren, D. Dee, M. Diamantakis, R. Dragani, J. Flemming, R. Forbes, M. Fuentes, A. Geer, L. Haimberger, S. Healy, R. J. Hogan, E. Hólm, M. Janisková, S. Keeley, P. Laloyaux, P. Lopez, C. Lupu, G. Radnoti, P. de Rosnay, I. Rozum, F. Vamborg, S. Villaume, and J.-N. Thépaut, “The era5 global reanalysis,” Quarterly Journal of the Royal Meteorological Society, vol. 146, no. 730, pp. 1999–2049, 2020.
- [58] F. Aires, A. Chédin, N. A. Scott, and W. B. Rossow, “A regularized neural net approach for retrieval of atmospheric and surface temperatures with the iasi instrument,” Journal of Applied Meteorology, vol. 41, no. 2, pp. 144 – 159, 2002.
- [59] A. Berk, G. P. Anderson, P. K. Acharya, L. S. Bernstein, L. Muratov, J. Lee, M. Fox, S. M. Adler-Golden, J. H. Chetwynd, M. L. Hoke, R. B. Lockwood, J. A. Gardner, T. W. Cooley, C. C. Borel, and P. E. Lewis, “MODTRAN 5: a reformulated atmospheric band model with auxiliary species and practical multiple scattering options: update,” in Algorithms and Technologies for Multispectral, Hyperspectral, and Ultraspectral Imagery XI, ser. Society of Photo-Optical Instrumentation Engineers (SPIE) Conference Series, vol. 5806, Jun. 2005, pp. 662–667.
- [60] C. Lanaras, J. Bioucas-Dias, S. Galliani, E. Baltsavias, and K. Schindler, “Super-resolution of sentinel-2 images: Learning a globally applicable deep neural network,” ISPRS Journal of Photogrammetry and Remote Sensing, vol. 146, pp. 305–319, 2018.
- [61] K. He, X. Zhang, S. Ren, and J. Sun, “Deep residual learning for image recognition,” in IEEE Conference on Computer Vision and Pattern Recognition (CVPR), 2016, pp. 770–778.
- [62] S. Woo, J. Park, J. Lee, and I. S. Kweon, “CBAM: convolutional block attention module,” in Computer Vision - ECCV 2018 - 15th European Conference, Munich, Germany, September 8-14, 2018, Proceedings, Part VII, 2018, pp. 3–19.
- [63] M. Haris, G. Shakhnarovich, and N. Ukita, “Deep back-projection networks for super-resolution,” in 2018 IEEE/CVF Conference on Computer Vision and Pattern Recognition, 2018, pp. 1664–1673.
- [64] H. Zhao, J. Shi, X. Qi, X. Wang, and J. Jia, “Pyramid scene parsing network,” in 2017 IEEE Conference on Computer Vision and Pattern Recognition (CVPR), 2017, pp. 6230–6239.
- [65] L. Yang, X. Li, R. Song, B. Zhao, J. Tao, S. Zhou, J. Liang, and J. Yang, “Dynamic mlp for fine-grained image classification by leveraging geographical and temporal information,” in Proceedings of the IEEE/CVF Conference on Computer Vision and Pattern Recognition (CVPR), June 2022, pp. 10 945–10 954.
- [66] I. Loshchilov, “Decoupled weight decay regularization,” arXiv preprint arXiv:1711.05101, 2017.
- [67] I. Loshchilov and F. Hutter, “Sgdr: Stochastic gradient descent with warm restarts,” arXiv preprint arXiv:1608.03983, 2016.
- [68] S. Wang, T. Zhou, Y. Lu, and H. Di, “Contextual transformation network for lightweight remote-sensing image super-resolution,” IEEE Transactions on Geoscience and Remote Sensing, vol. 60, pp. 1–13, 2021.
- [69] Z. Wang, L. Li, Y. Xue, C. Jiang, J. Wang, K. Sun, and H. Ma, “Fenet: Feature enhancement network for lightweight remote-sensing image super-resolution,” IEEE Transactions on Geoscience and Remote Sensing, vol. 60, pp. 1–12, 2022.
- [70] P. Behjati, P. Rodriguez, C. F. Tena, A. Mehri, F. X. Roca, S. Ozawa, and J. Gonzàlez, “Frequency-based enhancement network for efficient super-resolution,” IEEE Access, vol. 10, pp. 57 383–57 397, 2022.
- [71] Z. Li, J. Yang, Z. Liu, X. Yang, G. Jeon, and W. Wu, “Feedback network for image super-resolution,” in Proceedings of the IEEE/CVF conference on computer vision and pattern recognition, 2019, pp. 3867–3876.
- [72] T. Dai, M. Ya, J. Li, X. Zhang, S.-T. Xia, and Z. Zhu, “Cfgn: A lightweight context feature guided network for image super-resolution,” IEEE Transactions on Emerging Topics in Computational Intelligence, vol. 8, no. 1, pp. 855–865, 2024.
- [73] K. Zeng, H. Lin, Z. Yan, and J. Fang, “Densely connected transformer with linear self-attention for lightweight image super-resolution,” IEEE Transactions on Instrumentation and Measurement, vol. 72, pp. 1–12, 2023.
- [74] T.-W. Hui, C. C. Loy, , and X. Tang, “Depth map super-resolution by deep multi-scale guidance,” in Proceedings of European Conference on Computer Vision (ECCV), 2016, pp. 353–369. [Online]. Available: http://mmlab.ie.cuhk.edu.hk/projects/guidance_SR_depth.html
- [75] H. Wu, S. Zheng, J. Zhang, and K. Huang, “Fast end-to-end trainable guided filter,” in Proceedings of the IEEE Conference on Computer Vision and Pattern Recognition, 2018, pp. 1838–1847.
- [76] J. Pan, J. Dong, J. S. Ren, L. Lin, J. Tang, and M.-H. Yang, “Spatially variant linear representation models for joint filtering,” in Proceedings of the IEEE/CVF Conference on Computer Vision and Pattern Recognition, 2019, pp. 1702–1711.
- [77] Y. Li, J.-B. Huang, N. Ahuja, and M.-H. Yang, “Joint image filtering with deep convolutional networks,” IEEE Transactions on Pattern Analysis and Machine Intelligence, vol. 41, no. 8, pp. 1909–1923, 2019.
- [78] R. D. Lutio, S. D’aronco, J. D. Wegner, and K. Schindler, “Guided super-resolution as pixel-to-pixel transformation,” in Proceedings of the IEEE/CVF international conference on computer vision, 2019, pp. 8829–8837.
- [79] W. Han, S. Chang, D. Liu, M. Yu, M. Witbrock, and T. S. Huang, “Image super-resolution via dual-state recurrent networks,” in Proceedings of the IEEE conference on computer vision and pattern recognition, 2018, pp. 1654–1663.
- [80] B. Kim, J. Ponce, and B. Ham, “Deformable kernel networks for joint image filtering,” International Journal of Computer Vision, vol. 129, no. 2, pp. 579–600, 2021.
- [81] Y. Yang, Q. Cao, J. Zhang, and D. Tao, “Codon: on orchestrating cross-domain attentions for depth super-resolution,” International Journal of Computer Vision, vol. 130, no. 2, pp. 267–284, 2022.
- [82] Z. Zhong, X. Liu, J. Jiang, D. Zhao, and X. Ji, “Deep attentional guided image filtering,” IEEE Transactions on Neural Networks and Learning Systems, pp. 1–15, 2023.
![[Uncaptioned image]](/html/2409.19835/assets/figs/biography/QunDai.jpg) |
Qun Dai received her M.S. degree in Avionics Engineering in 2017. Subsequently, she worked as an Avionics Engineer at China Eastern Airlines Technology Co., Ltd., where she gained extensive experience in the field of aviation electronics and systems integration. Currently, she is a Research Assistant at Nanjing University of Science and Technology, where she focuses on advancing the state-of-the-art in image restoration techniques for enhanced object detection performance. |
![[Uncaptioned image]](/html/2409.19835/assets/figs/biography/ChunyangYuan.jpg) |
Chunyang Yuan received the B.S degree in energy and power engineering from Henan Polytechnic University, Henan, China, in 2021. He is currently pursuing a master’s degree in Computer Science and Technology at Nanjing University of Posts and Telecommunications, Nanjing, China. His research interests include machine learning, SAR image processing, and computer vision. |
![[Uncaptioned image]](/html/2409.19835/assets/x10.jpg) |
Yimian Dai received the Ph.D. degree in signal and information processing from Nanjing University of Aeronautics and Astronautics, Nanjing, China, in 2021, during which he honed his research skills as a visiting Ph.D. student at the University of Copenhagen and the University of Arizona between March 2018 and October 2020. Since 2021, he has been with the School of Computer Science and Engineering, Nanjing University of Science and Technology (NJUST), Nanjing, where he is currently an Assistant Researcher. His research interests include remote sensing, computer vision, and deep learning, with a focus on developing algorithms for object detection, data assimilation, and computational imaging to tackle real-world challenges. He has authored more than 20 peer-reviewed journal and conference papers such as IJCV, TGRS, TAES, etc. |
![[Uncaptioned image]](/html/2409.19835/assets/figs/biography/Yuxuan-Crop.png) |
Yuxuan Li is currently a Ph.D. student at the Department of Computer Science, Nankai University, China. He graduated from University College London (UCL) with a first-class degree in Computer Science. He was the champion of the Second Jittor Artificial Intelligence Challenge in 2022, was awarded 2nd place in Facebook Hack-a-Project in 2019 and was awarded 2nd place in the Greater Bay Area International Algorithm Competition in 2022. His research interests include neural architecture design, and remote sensing object detection. |
![[Uncaptioned image]](/html/2409.19835/assets/figs/biography/Xiang_Li.png) |
Xiang Li is an Associate Professor in College of Computer Science, Nankai University. He received the PhD degree from the Department of Computer Science and Technology, Nanjing University of Science and Technology (NJUST) in 2020. There, he started the postdoctoral career in NJUST as a candidate for the 2020 Postdoctoral Innovative Talent Program. In 2016, he spent 8 months as a research intern in Microsoft Research Asia, supervised by Prof. Tao Qin and Prof. Tie-Yan Liu. He was a visiting scholar at Momenta, mainly focusing on monocular perception algorithm. His recent works are mainly on: neural architecture design, CNN/Transformer, object detection/recognition, unsupervised learning, and knowledge distillation. He has published 20+ papers in top journals and conferences such as TPAMI, CVPR, NeurIPS, etc. |
![[Uncaptioned image]](/html/2409.19835/assets/x11.png) |
Kang Ni (Member, IEEE) received the M.S. degrees from Changchun University of Technology, Jilin, China, in 2016, and the Ph.D. degree from Nanjing University of Aeronautics and Astronautics, Jiangsu, China, in 2020. He is a Lecturer with the School of Computer Science, Nanjing University of Posts and Telecommunications, Nanjing, and also a member with the Jiangsu Key Laboratory of Big Data Security and Intelligent Processing, Nanjing. His research interests include machine learning, SAR image processing, and computer vision. |
![[Uncaptioned image]](/html/2409.19835/assets/figs/biography/Jianhui_Xu.jpg) |
Jianhui Xu received the Ph.D. degree in multi-source remote sensing data assimilation from Wuhan University, Wuhan, China, in 2015. He is currently an Associate Professor with the Guangzhou Institute of Geography, Guangdong Academy of Sciences. He has published numerous SCI papers in prestigious journals, such as The Science of The Total Environment, Journal of Geophysical Research Atmospheres and Building and Environment, in the area of data fusion and urban remote sensing. His research interests include data fusion and assimilation, land surface temperature and urban remote sensing. |
![[Uncaptioned image]](/html/2409.19835/assets/figs/biography/Xiangbo-Shu.png)
|
Xiangbo Shu (Senior Member, IEEE) received the Ph.D. degree from Nanjing University of Science and Technology, Nanjing, China, in 2016. From 2014 to 2015, he worked as a Visiting Scholar at the National University of Singapore, Singapore. He is currently a Professor with the School of Computer Science and Engineering, Nanjing University of Science and Technology. His current research interests include computer vision, and multimedia. He has authored over 100 journals and conference papers in these areas, including IEEE T RANSACTIONS ON PATTERN A NALYSIS AND M ACHINE I NTELLIGENCE (TPAMI), T RANSACTIONS ON N EURAL N ETWORKS AND L EARNING S YS TEMS (TNNLS), IEEE T RANSACTIONS ON I MAGE P ROCESSING (TIP), IEEE Conference on Computer Vision and Pattern Recognition (CVPR), IEEE International Conference on Computer Vision (ICCV), European Conference on Computer Vision (ECCV), and ACM International Conference on Multimedia (ACM MM). Dr. Shu is a member of ACM and a Senior Member of CCF. He has received the Best Student Paper Award in International Conference on MultiMedia Modeling (MMM) 2016 and the Best Paper Runner-Up in ACM MM 2015. He has served on an editorial boards for IEEE TNNLS, IEEE T RANSACTIONS ON C IRCUITS AND S YSTEMS FOR V IDEO (TCSVT), and Information Sciences. |
![[Uncaptioned image]](/html/2409.19835/assets/figs/biography/Jian_Yang.jpeg)
|
Jian Yang received the PhD degree from Nanjing University of Science and Technology (NJUST) in 2002, majoring in pattern recognition and intelligence systems. From 2003 to 2007, he was a Postdoctoral Fellow at the University of Zaragoza, Hong Kong Polytechnic University and New Jersey Institute of Technology, respectively. From 2007 to present, he is a professor in the School of Computer Science and Technology of NJUST. Currently, he is also a visiting distinguished professor in the College of Computer Science of Nankai University. He is the author of more than 300 scientific papers in pattern recognition and computer vision. His papers have been cited over 40000 times in the Scholar Google. His research interests include pattern recognition and computer vision. Currently, he is/was an associate editor of Pattern Recognition, Pattern Recognition Letters, IEEE Trans. Neural Networks and Learning Systems, and Neurocomputing. He is a Fellow of IAPR. |