∎
3. IVIP, Nanjing University of Posts and Telecommunications
4. School of Computer Science and Engineering, Nanjing University of Science and Technology
Corresponding authors.
HazyDet: Open-source Benchmark for Drone-View Object Detection with Depth-cues in Hazy Scenes
Abstract
Drone-based object detection in adverse weather conditions is crucial for enhancing drones’ environmental perception, yet it remains largely unexplored due to the lack of relevant benchmarks. To bridge this gap, we introduce HazyDet, a large-scale dataset tailored for drone-based object detection in hazy scenes. It encompasses 383,000 real-world instances, collected from both naturally hazy environments and normal scenes with synthetically imposed haze effects to simulate adverse weather conditions. By observing the significant variations in object scale and clarity under different depth and haze conditions, we designed a Depth Conditioned Detector (DeCoDet) to incorporate this prior knowledge. DeCoDet features a Multi-scale Depth-aware Detection Head that seamlessly integrates depth perception, with the resulting depth cues harnessed by a dynamic Depth Condition Kernel module. Furthermore, we propose a Scale Invariant Refurbishment Loss to facilitate the learning of robust depth cues from pseudo-labels. Extensive evaluations on the HazyDet dataset demonstrate the flexibility and effectiveness of our method, yielding significant performance improvements. Our dataset and toolkit are available at https://github.com/GrokCV/HazyDet.
Keywords:
Adverse weather, Drone-view object detection, Foggy Conditions, Depth-conditioned detector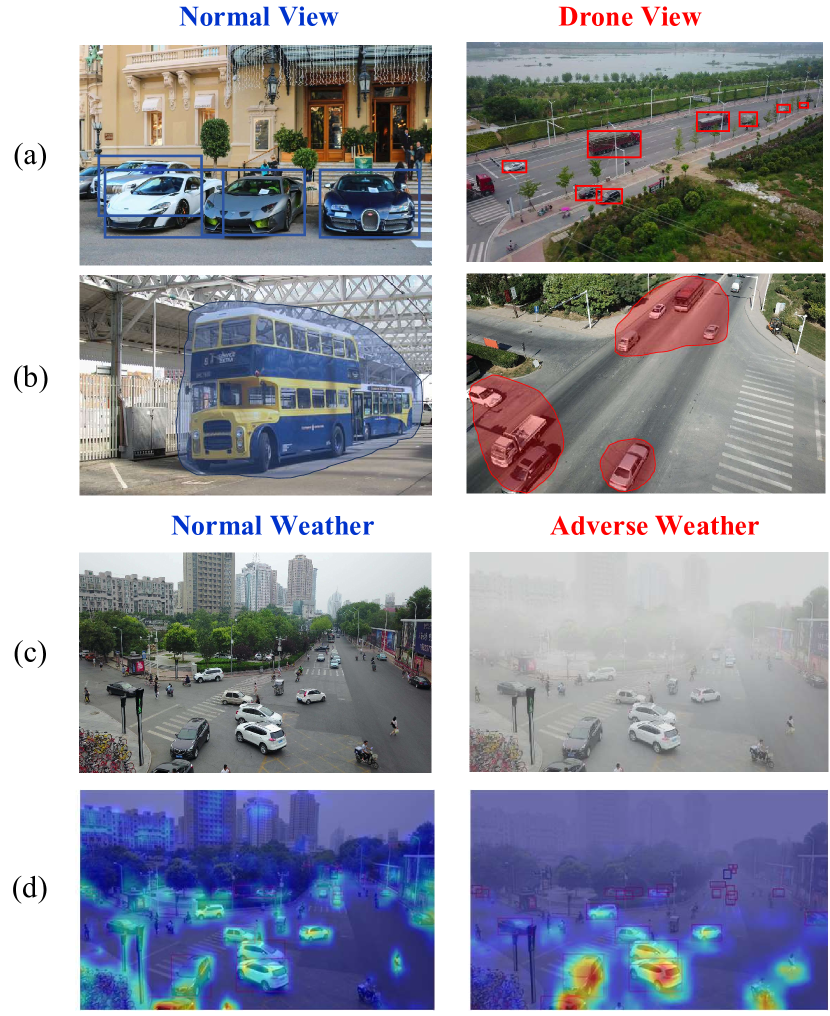
1 Introduction
In recent years, drones, commonly known as Unmanned Aerial Vehicles (UAVs), have experienced exponential growth due to their cost-effectiveness and versatility TGRS2023CFANet ; IJCV2024UAVFrequency . Drones have been adopted across various sectors, including precision agriculture ISPRSJPRS2021plantcount , urban traffic management ISPRS2021MultiscaleAdversarial , and military reconnaissance DefenceTech2021BPMFPN . The success of these applications rests on the accurate perceptual capabilities of onboard drone cameras. Consequently, developing robust and efficient object detection techniques for drone-view images emerges as a critical research area.
While significant advances have been made in general object detection ECCV2020DETR ; tianFCOSFullyConvolutional2019 ; Arxiv2018yolov3 ; TPAMI2017FasterRCNN , their direct application to drone-captured imagery often falls short of expectations. This shortfall is primarily due to the unique perspectives afforded by drones CVPR2022QueryDet ; CVPR2023CEASC . Specifically:
-
•
Scale Variation: As shown in Fig. 1 (a), drone imagery is characterized by significant scale variations due to changing perspectives and altitudes, often leading to a higher prevalence of smaller objects.
-
•
Non-uniform Distribution: As illustrated in Fig. 1 (b), objects in drone images are irregularly distributed across the frame, contrasting with the centralized placement typical in normal perspectives.
To tackle these peculiarities, specialized algorithms are developed RemoteSensing2023TPH-YOLOv5++ ; ICCV2019ClusterDet . One approach involves incorporating multi-scale features to improve detection accuracy by capturing objects at various scales RemoteSensing2022Multi-ScaleFusion ; GRSL2023SelfAtteMultiscaleFusion . This is achieved through feature pyramids and multi-resolution architectures that help mitigate the impact of scale variations. Another approach adopts a coarse-to-fine strategy to address non-uniform object distribution TIP2021GLSAN ; TMM2023AdaZoom . This method uses a coarse detector to identify broader instances and applies fine-grained detectors to localize smaller targets, thereby improving both detection accuracy and efficiency.
However, these methods predominantly concentrate on the intrinsic characteristics of drone imagery, frequently neglecting the influence of adverse weather conditions prevalent in outdoor environments on drone-view detection:
-
•
Image Degradation: As shown in Fig. 1 (c), adverse weather conditions impair atmospheric transmission, reducing visibility and causing color distortions in images, ultimately affecting image quality and subsequent vision-based perception.
-
•
Domain Gap: As depicted in Fig. 1 (d), weather-induced image degradation impairs feature recognition, a crucial component of neural networks, leading to blurred and semantically ambiguous features, resulting in a substantial domain gap.
Efforts to mitigate the effects of adverse weather typically focus on standard perspectives in autonomous driving field. Some strategies integrate detectors with image restoration networks AAAI2020FFANet to improve visual quality, but the restored images can contain subtle noise that disrupts subsequent tasks TPAMI2022AttackNetwork . A promising avenue is combining image restoration with detection tasks TPAMI2020DSNet ; AAAI2022IAYOLO ; TPAMI2023DetectionFriendlyDehazing . This approach seeks to link low-level image restoration with high-level object detection, learning domain-invariant features from paired clean and degraded images. The above methods significantly enhance the detector’s understanding of scenes in adverse weather conditions, improving detection performance.
Despite the progress made by the aforementioned methods, their effectiveness on the drone platform under hazy condition remains largely unexplored. A major obstacle is the lack of relevant datasets. To address this gap, we present the HazyDet dataset focused on fog—a prevalent and impactful weather condition affecting drone perception. HazyDet includes thousands of carefully curated drone images, annotated with high-quality bounding boxes for approximately 383,000 objects across various categories. To our knowledge, it is the first large-scale dataset specifically designed for drone-based detection under adverse weather scenarios. This dataset fills a critical gap, facilitating the development and evaluation of robust object detectors.
Additionally, previous models often overlook auxiliary information such as scene depth and frequently encounter issues with fixed network designs that hinder their adaptive capabilities. Given these considerations, we introduce a novel detection framework called the Depth-cue Conditional Detector (DeCoDet). DeCoDet enhances detection performance in foggy conditions by leveraging depth information without explicit image recovery. It is founded on two key observations: the correlation between object characteristics and depth in drone images and the relationship between fog distribution in the image space and scene depth. DeCoDet dynamically adjusts its detection strategy based on learned depth cues. This adaptive approach effectively addresses challenges posed by foggy environments and drone perspectives, significantly improving detection performance.
In summary, our contributions are threefold:
-
•
HazyDet Dataset: We introduce HazyDet, a large-scale dataset aimed at object detection in adverse weather from a drone’s perspective, featuring valuable real-world data. This dataset significantly addresses the resource scarcity for these specific tasks.
-
•
DeCoDet: We propose an innovative object detection framework that utilizes depth information to improve drone detection in foggy conditions. By dynamically adjusting detection strategies based on depth cues, our network effectively tackles the challenges presented by drone perspectives and fog, enhancing overall detector performance.
-
•
Benchmark and Leaderboard: We conduct comprehensive quantitative and qualitative evaluations of state-of-the-art (SOTA) detection and dehazing methods using HazyDet. This establishes a benchmark and leaderboard, providing the research community with a platform to understand the limitations of existing methods and develop robust solutions for object detection under foggy conditions.
2 Related Work
2.1 Drone-View Datasets
In recent years, a variety of datasets have been specifically developed to advance research in drone-view detection. The VEDAI JVCIR2016VEDAI dataset is geared towards evaluating small vehicle detection in aerial views, containing over 1,200 images annotated with more than 3,700 vehicles. Another dataset, CARPK ICCV2017CAPRK , includes 1,448 drone-captured images of parking lots, annotated with 89,777 cars. UAVDT IJCV2020UAVDT provides approximately 40,000 images, each at a resolution of about 1080 × 540 pixels, with annotations for cars, buses, and trucks in urban settings. VisDrone TPAMI2022VisDrone , one of the most widely utilized datasets, comprises 10,209 images with detailed annotations for ten object categories, including bounding boxes and occlusion and truncation ratios. However, these datasets generally focus on clear, ideal conditions.
With drones increasingly deployed in adverse environments, the need for datasets that reflect challenging conditions has become more apparent. Efforts to address this gap include the RS-Haze TIP2023RSHaze dataset by Song et al., which provides over 50,000 haze-simulated images using Landsat-8 Level-1 multispectral data to enhance aerial image dehazing research. Similarly, UAV-Rain1k CVPRW2024UAVRain1k by Chang et al. focuses on the removal of raindrops, using Blender to simulate raindrop shapes on drone images from diversified angles. Despite these advancements, such datasets primarily target low-level image restoration tasks and typically lack the annotations necessary for downstream vision tasks like object detection.
We introduce the HazyDet dataset to tackle the limitations of haze, a prevalent issue in adverse weather. This dataset offers paired images for image restoration, precise object annotations for detection, and auxiliary depth information. This comprehensive approach enhances research in challenging conditions, addressing a crucial gap in drone-based object detection.
2.2 Drone-View Object Detection
Object detection in drone imagery faces unique challenges due to significant variations in flight altitude, angle, and scene coverage. A key strategy to address these complexities is multi-scale feature fusion, essential for managing objects of different sizes. For instance, CFANet uses cross-layer feature aggregation to bridge semantic gaps across scales, enhancing detection accuracy, particularly for small objects TGRS2023CFANet . Similarly, SODNet employs adaptive spatial parallel convolution modules to boost real-time detection of small objects through specialized feature extraction and information fusion techniques RemoteSensing2022Multi-ScaleFusion .
Furthermore, the uneven distribution of objects in drone imagery necessitates innovative restructuring of the detection process, often employing coarse-to-fine pipelines. GLSANet utilizes a self-adaptive region selection algorithm to refine dense areas and improve sub-region resolution with a local super-resolution network TIP2021GLSAN . The UFPMP-DET framework integrates a unified foreground packing pipeline and a multi-proxy learning mechanism to address challenges with small objects and uneven distributions, thereby improving detection performance AAAI2022UFPMPDet . ClusDet enhances detection by predicting clustered regions and adjusting their sizes ICCV2019ClusterDet . Additionally, models like OGMN ISPRS2023OGMN explicitly model occlusions among target objects, resulting in significant performance improvements.
Despite these advancements, the impact of adverse weather conditions on drone-based detection performance remains largely unexamined, a gap our research seeks to address. By focusing on these conditions, our approach is distinct and expands upon existing studies.
2.3 Object Detection in Adverse Conditions
Object detection in harsh environments poses greater challenges than in normal conditions due to degraded image quality and atypical features TGRS2024Night-timedrone ; TIV2024MisalignedMMDrone . Approaches to address this issue can be categorized as either seperate or joint optimization paradigms.
Separate paradigms employ restoration algorithms to preprocess images, aiming to enhance quality before implementing object detection models. While this approach is theoretically advantageous, it often does not yield proportional improvements in detection accuracy TIP2020ConnectingDenoisingwitHighVision . In some instances, it may even detract from performance by eliminating critical high-frequency details TIP2020ConnectingDenoisingwitHighVision , an issue particularly detrimental in drone imagery where small objects are frequently observed.Conversely, joint optimization paradigms that integrate image restoration with object detection in a unified framework show promising potential. AOD-Net ICCV2017AODNet was among the pioneers in integrating image dehazing with object detection. IA-YOLO AAAI2022IAYOLO introduced an image-adaptive framework wherein each image is adaptively enhanced to bolster detection performance. DSNet TPAMI2020DSNet features a dual-subnet architecture with shared feature extraction layers, trained using multi-task learning. BAD-Net TPAMI2023DetectionFriendlyDehazing developed an end-to-end architecture linking dehazing and detection, incorporating a dual-branch structure with an attention fusion module to utilize both hazy and dehazed features effectively. However, these methods typically need paired data from both the source and degraded domains, which is often impractical to acquire.
Our approach distinguishes itself from traditional methods by leveraging auxiliary depth information instead of establishing a direct connection between detection and the restoration network. This strategy enriches the network’s comprehension of challenging weather conditions while eliminating the necessity for paired data. Consequently, our method significantly improves detection performance in foggy environments and integrates smoothly into established frameworks, demonstrating considerable potential for practical applications.
3 HazyDet Dataset
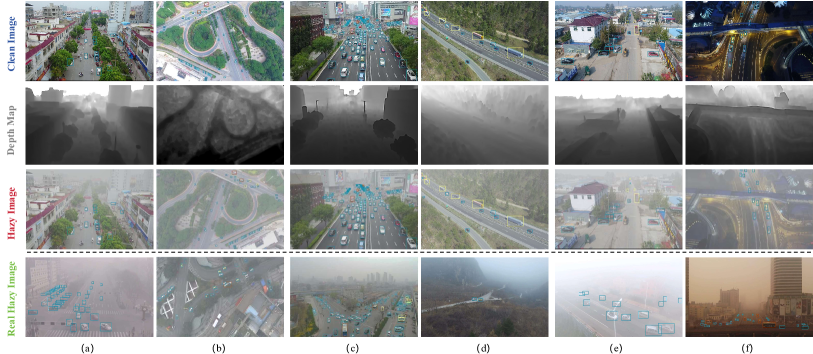
The absence of standardized benchmarks impedes drone-based object detection in hazy conditions. To address this issue, we developed HazyDet, the first large-scale dataset for drone-view detection in adverse environments. HazyDet features both synthetic and real-world data, with high-quality annotations across diverse scenarios, as illustrated in Fig. 2. The real data aligns well with the synthetic data despite variations in perspective, scene, and lighting. However, the real data presents more diverse atmospheric variations, complicating visual interpretation. This section outlines the dataset’s construction and analyzes its characteristics.
3.1 Dataset Construction
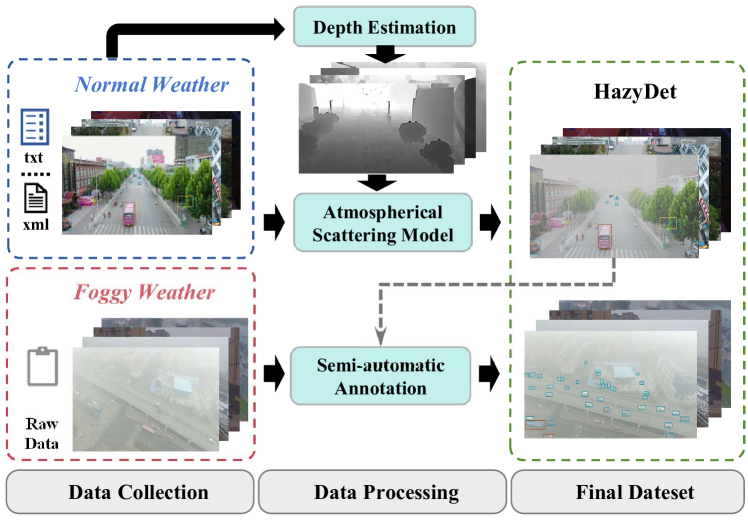
The dataset construction process is illustrated in Fig. 3. The foundation of any benchmark is a robust dataset. However, acquiring extensive drone imagery under foggy conditions presents significant challenges, and annotating these low-quality images can be prohibitively expensive. Therefore, we choose to construct the HazyDet dataset using existing data. Utilizing the Atmospheric Scatter Model (ASM), we simulate and generate a large-scale drone detection dataset tailored for haze scenarios to support the development and evaluation of algorithms. Additionally, we create an independent Real-hazy Drone Detection Testing Set (RDDTS) within the HazyDet to evaluate detector performance in real-world conditions.
Data Collection. We initially gathered a substantial amount of annotated data from public and private datasets under normal weather conditions TPAMI2022VisDrone ; ICCV2017CAPRK ; TAI2021VehicleDetection_VDDV . During this process, issues such as high scene repetition rates, erroneous labels, and inconsistent labeling formats were observed. Consequently, we undertook extensive data cleaning, which includes removing blurry images to ensure subsequent simulation stability. In addition, we collect numerous unlabeled drone images in foggy weather through field photography and online sources, capturing a broad range of targets across diverse environments such as urban, rural, and coastal areas, along with varying flight heights and shooting angles.
Data Processing. Numerous studies, such as CVPR2024Synfog ; TIP2019RESIDE , have explored generating realistic synthetic foggy images using methods like generative adversarial networks or diffusion models. These approaches can distort images due to the randomness of deep networks, rendering original annotations useless. Therefore, we use a more stable physical degradation method based on the ASM TIP2023RSHaze ; CVPR2024Synfog ; TCSVT2024BridgeGapDehaze . The synthesis process detailed below uses ASM as a classical formula for generating hazy images:
| (1) |
where is the observed hazy image, is the recoverable scene radiance, denotes global atmospheric light, and is the transmission matrix, defined as:
| (2) |
In this context, represents the atmospheric scattering coefficient, and indicates the relative distance between scene objects and the camera.
In the simulation process, the hyperparameters and in equations (1) and (2) are crucial. While TIP2019RESIDE uses fixed values, TGRS2023Trinity-Net samples within defined ranges, both failing to reflect the real-world haze distribution and often overrepresenting dense conditions. Our research, after extensive analysis, adopts truncated normal distributions for sampling and , setting between with and , and between with and . This method produces simulated data that more accurately represents real fog conditions, improving the reliability of subsequent analyses.
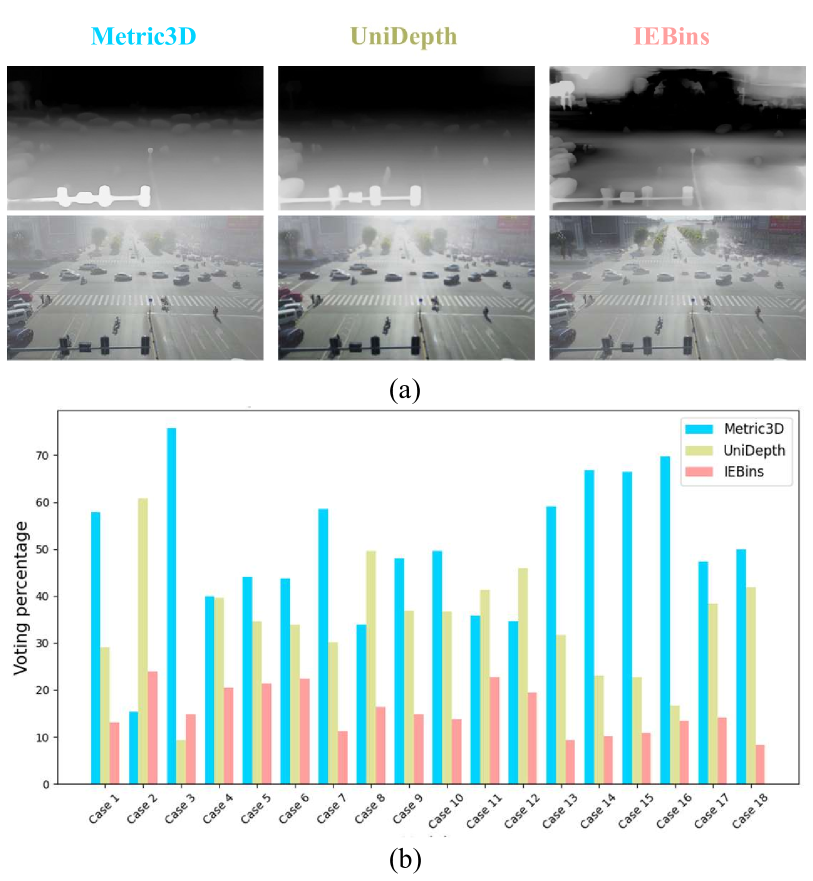
Inspired by TIP2019RESIDE , we used a depth estimation model to determine . However, the model struggled with generalization in new environments. After researching SOTA depth estimation methods, we chose three models that excel in zero-shot learning, offering superior generalization in unknown domains Arxiv2024metric3d ; CVPR2024Unidepth ; NEURIPS2023IEBins . The simulation results are depicted in Fig. 4 (a). Recognizing that the lack of no-reference metrics to accurately assess the effects of fog simulation, we also conducted a questionnaire with 280 college students and experts to evaluate realism, brightness distribution, and fog consistency of synthetic images across 18 scenarios. Fig. 4 (b) shows that images generated using Arxiv2024metric3d closely resembled real-world scenes.
For the unlabeled real foggy images collected, a semi-automatic annotation approach was employed. Initially, we trained high-precision models on synthetic data to generate rough-labels, which were then manually refined. Each label underwent a secondary review to ensure accuracy, providing robust ground truth for RDDTS and testing model adaptability to real-world foggy scenarios.
3.2 Dataset Statistics and Characteristics
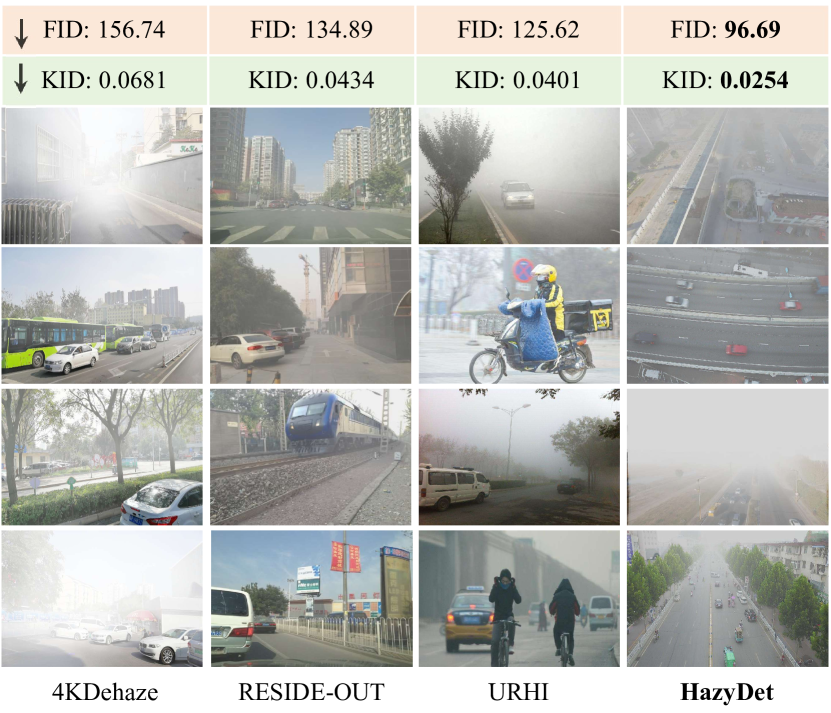
Dataset Authenticity. To evaluate the authenticity of our synthetic data, we used the Fréchet Inception Distance (FID) arxiv2021FID and Kernel Inception Distance (KID) ICLR2018KID to test the similarity between the hazy datasets and the real data distribution of RDDTS. Fig. 5 reveals that HazyDet offers closer approximations to real drone-captured foggy conditions than datasets like RESIDE-Out TIP2019RESIDE and 4KDehaze CVPR2021_4KDehaze . Even compared to the real data within URHI TIP2019RESIDE dataset, our approach excels due to its alignment with drone perspectives. While FID and KID indices offer some insight into the quality of synthesized haze images, they share limitations with other blind quality assessment methods, as predicted scores may not always align with human perception. To address this, we conducted a subjective visual comparison of our dataset with existing mainstream datasets, illustrated in Fig. 5. The results clearly indicate that HazyDet more accurately mirrors real foggy conditions across different haze levels.
| Split | Images | Objects | Class | Object Size | ||
| Small | Medium | Large | ||||
| Train | 8,000 | 264,511 | Car | 159,491 | 77,527 | 5,177 |
| Truck | 4,197 | 6,262 | 1,167 | |||
| Bus | 1,990 | 7,879 | 861 | |||
| Val | 1,000 | 34,560 | Car | 21,051 | 9,881 | 630 |
| Truck | 552 | 853 | 103 | |||
| Bus | 243 | 1,122 | 125 | |||
| Test | 2,000 | 65,322 | Car | 38,910 | 19,860 | 1,256 |
| Truck | 881 | 1,409 | 263 | |||
| Bus | 473 | 1,991 | 279 | |||
| RDDTS | 600 | 19,296 | Car | 8,167 | 8,993 | 1,060 |
| Truck | 112 | 290 | 87 | |||
| Bus | 69 | 363 | 155 | |||
Statistics and Characteristics of Instances Tab. 1 offers a comprehensive breakdown of the number of images and instances within each subset of the HazyDet dataset. This dataset consists of 11,000 synthesized images, containing a total of 365,000 object instances. It is meticulously divided into training, validation, and testing subsets in an 8:1:2 ratio, encompassing object categories such as Car, Truck, and Bus. Alongside the synthetic data, we have collected 600 images in foggy weather conditions, annotated consistently with our synthetic methods. The integration of both synthetic and real data, characterized by high object density, ensures that our dataset serves as a high-quality resource ideal for the comprehensive evaluation of various detection models.
As shown in Tab. 1, key characteristics of HazyDet include: Long-Tail Distribution: The dataset exhibits a pronounced long-tail distribution, with cars dominating across all subsets. Prominent Small Objects: HazyDet features a higher proportion of small targets compared to traditional datasets, presenting additional detection challenges and necessitating refined feature extraction techniques.
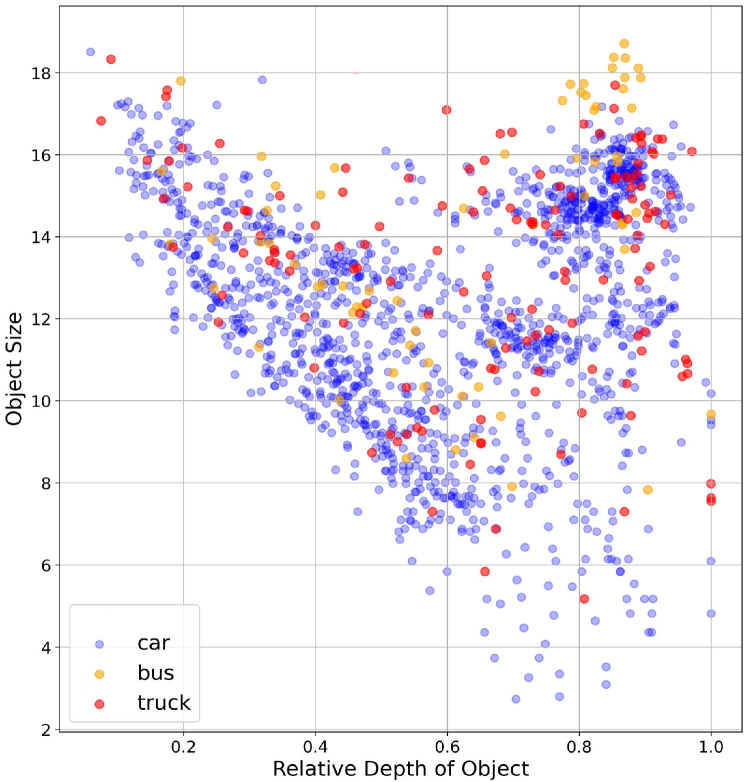
Depth-related Characteristics. HazyDet has a more extensive connection with depth information. The ASM indicates a exponential correlation between the intensity of pixel degradation and scene depth cues under consistent atmospheric parameters, implying a close connection between depth map and foggy scene distribution. Furthermore, the unique flight altitudes and shooting angles of drones enhance the perspective effect in images, highlighting a clear relationship between target size and depth. As shown in Fig. 6, closer targets appear larger, consistent with intuitive expectations. The cluster in the upper right corner results from images captured from a vertical perspective, where depth values converge to their maximum. These depth-related insights provide essential context for interpreting drone imagery in foggy environments, potentially supporting a variety of scene interpretation tasks.
4 Methodology
We present DeCoDet, a novel solution that integrates auxiliary depth information into the detector. This design leverages the synergy between depth data and drone imagery, especially in foggy conditions, as analyzed in Sec. 3.2. We hypothesize that depth information can enhance the network’s ability to comprehend the intrinsic mechanisms of haze degradation and objectt features from a drone’s perspective. Our objective is to enable the network to effectively learn deep cues and utilize them todynamicly adapt the detector’s behavior, thereby enhancing performance. In this section, we begin with an overview of the framework architecture. We then explore the specifics of depth-aware processing and depth condition, emphasizing their roles and functions within the framework. Finally, we present the loss functions employed to optimize the network.
4.1 Overview of DeCoDet
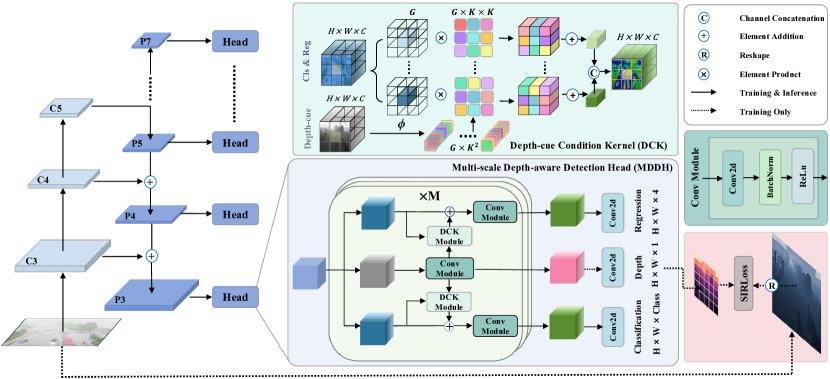
As illustrated in Fig. 7, our network comprises a backbone, a Feature Pyramid Network (FPN), and Multi-scale Depth-aware Detection Heads (MDDH) that include a Depth-cue Condition Kernel (DCK) module. The backbone network, along with the FPN, extracts multi-scale features from input images. Our MDDH derives depth maps at various scales from these features and computes a Scale Invariant Refurbishment Loss (SIRLoss), allowing the detection network to accurately interpret depth information from pseudo depth map. The DCK module dynamically generates filter kernels based on features containing depth cues to condition classification and regression features. Ultimately, these modulated features are employed for final object detection.
4.2 Multi-scale Depth-aware Detection Head
The primary challenge is enabling the network to learn depth information. Unlike previous works TPAMI2023DetectionFriendlyDehazing ; IVC2024DepthCOD that utilize computationally intensive upsampling branches, we concentrate on the detector head. We introduce a dedicated depth estimation branch within the existing framework, resulting in a MDDH. Specifically, we obtain multi-scale feature maps from a backbone network using FPN, with representing the feature map from the n-th head. For each scale’s feature map , we apply layers of convolution, denoting the output of the m-th convolution layer as . The process can be summarized as follows:
| (3) |
where ReLU(·) and BN(·) denote ReLU activation function and batch normalization, respectively. Among them, . For the final depth prediction, we used a separate convolutional layer with an output channel of 1. The final depth map estimation is:
| (4) |
This design allows the network to learn depth information across varying scales, laying a foundation for further development. High-level depth estimation captures the global scene distribution, distinguishing between areas like the sky and ground, while low-level depth estimation provides detailed scene clues that are beneficial for detecting small targets.
4.3 Depth-cue Condition Kernel
The second challenge is leveraging learned depth information to enhance detection performance. We aim to optimize detection by conditioning classification and regression features on depth cues. This is motivated by recognizing that depth cues contain prior scene knowledge that is useful for reducing false detections and providing scale references for multi-scale targets’ bounding box regression. Traditional feature fusion methods fail to adjust feature weights based on pixel-wise depth-cues dynamically. Inspired by hypernetworks CVPR2021Involution ; CVPR2022DynamicMLP ; CVPR2022Hyperstyle , we design a DCK mechanism.
From the depth feature , we generated DCK. The kernel generation function , where indicates the kernel size related to the depth cues’ spatial influence range and is the number of groups sharing a kernel to enhance channel diversity, is defined as:
| (5) |
Here, represents each pixel in the depth feature map . The matrices and are linear transformations that create a bottleneck, with the reduction ratio decreasing the input feature channels for efficiency. The function denotes batch normalization and a non-linear activation function, which enhances expressiveness.
The output weight affects detection through a multiply-accumulate operation on classification and regression features, consistent in dimension with the depth feature , denoted as . The operation process is:
| (6) |
where refers to the set of offsets in the neighborhood considering kernel conducted on the center pixel, written as ( indicates Cartesian product here):
| (7) |
We apply cascaded architecture with layers at each scale to deepen conditioning, using residual connections to prevent detection impairment from erroneous depth estimations. The design of the DCK has the following advantages: the network can adaptively allocate weights based on depth-cue at different spatial positions, prioritize the most informative visual elements, and thereby improve the capability to adapt visual patterns across different spatial locations.
| Network | MDDH | DCK | SIRLoss | Para(M) | GFLOPs | AP on Test-set | AP on RDDTS | |||||||
|---|---|---|---|---|---|---|---|---|---|---|---|---|---|---|
| Car | Truck | Bus | mAP | Car | Truck | Bus | mAP | |||||||
| DeCoDet | 32.11 | 191.48 | 54.4 | 27.1 | 56.2 | 45.9 | 43.3 | 8.7 | 16.4 | 22.8 | ||||
| ✓ | 34.59 | 240.64 | 55.5 | 25.8 | 57.3 | 46.2 | 42.7 | 9.0 | 18.2 | 23.3 | ||||
| ✓ | ✓ | 34.60 | 240.64 | 55.7 | 27.9 | 55.7 | 46.4 | 42.1 | 8.5 | 18.7 | 23.1 | |||
| ✓ | ✓ | 34.61 | 249.91 | 55.6 | 26.5 | 58.6 | 46.9 | 43.8 | 9.6 | 18.9 | 24.1 | |||
| ✓ | ✓ | ✓ | 34.61 | 249.91 | 55.9 | 28.6 | 57.6 | 47.4 | 48.1 | 11.1 | 17.8 | 24.3 | ||
4.4 Loss Function
We design the loss function for DeCoDet, incorporating depth estimation and detection losses to ensure proficiency in object detection and depth estimation.
To achieve stable depth learning, we propose SIRLoss. Unlike traditional loss functions, which are sensitive to scale variations, our approach employs a scale-invariant error metric from NIPS2014scale-invariant . This metric evaluates relative pixel pair relationships after applying logarithmic depth transformation, focusing on differences in logarithmic depth values rather than absolute scales. For a predicted depth map and ground truth , the loss for pixels is:
| (8) |
where . In addition, depth maps generated by depth estimation networks can be prone to errors in unseen scenarios, which may impede the network’s ability to learn accurate depth information. We address these label errors as noise and mitigate them through label refurbishment. Specifically, for each pixel, we compute the refurbished label as follows:
| (9) |
indicates noisy label confidence; set to 0.9 to replace noisy labels with clean ones. Combining label refurbishment with scale invariance yields the final loss function, improving depth estimation accuracy and stability through refurbishment and smoothing. The final SIRLoss is:
| (10) |
where .
For optimized dehazing favorable to detection, we use the original detection loss, :
| (11) |
where , , and are localization, centeredness, and classification losses, respectively. Weights , , and follow original configuration. The final loss function is:
| (12) |
Here, represents the balancing coefficient for the depth estimation loss, set to 2.0, to ensure that it neither excessively affects detection nor is too minimal for the network to acquire useful information.
5 Experiments
5.1 Implementation Details
We select ResNet-50, pre-trained on ImageNet, for its exceptional capabilities in feature extraction. To enhance data diversity, each image is subjected to random horizontal flipping with a probability of 0.5. The network is trained using the Stochastic Gradient Descent (SGD) optimizer for a total of 12 epochs, initiating with a learning rate of 0.01. This learning rate is adjusted through a linear warm-up phase and reduced by a factor of 10 following the 8th and 11th epochs. The batch size is set to 2, with weight decay and momentum configured at 0.0001 and 0.938, respectively. Input RGB images were standardized to a resolution of 1333×800 pixels. Our implementation is conducted using the PyTorch framework, and experiments are performed on workstations equipped with NVIDIA 3090 GPUs. All experiments utilized the HazyDet training dataset and were evaluated on both its test set and the RDDTS. The depth maps for DeCoDet is generated from the depth maps described in Sec. 3.1. Notably, all training and validation sets within HazyDet will be made available as open-source resources.
To objectively assess the algorithm’s performance, we utilize mean Average Precision (mAP) and Average Precision (AP) to evaluate detection accuracy. For efficiency evaluation, we consider Giga Floating-Point Operations Per Second (GFLOPs) and model parameters. Additionally, to evaluate the dehazing method’s performance, we employ two widely recognized image restoration metrics: Peak Signal-to-Noise Ratio (PSNR) and Structural Similarity Index Measure (SSIM).
5.2 Ablation Study
This section presents a comprehensive validation of the DeCoDet network’s components through ablation experiments. We employed FCOS tianFCOSFullyConvolutional2019 , a prevalent single-stage detector, as the baseline for these studies. Metrics for evaluation included detector precision on both synthetic and real data, as well as model parameter count and computational burden. The ablation study in Tab. 2 demonstrates the contributions of each component of DeCoDet on the HazyDet dataset. Starting with the baseline, improvements were sequentially added through MDDH, DCK, and SIRLoss. Introducing MDDH yielded a slight mAP increase across the test set and RDDTS, benefiting from multi-scale depth awareness despite higher computational costs. Adding SIRLoss with MDDH further enhanced detection accuracy, particularly for trucks, though it slightly decreased performance for buses, highlighting its stabilizing effect on depth estimation. The integration of DCK, even without SIRLoss, notably boosted mAP, especially for trucks and cars, demonstrating its effectiveness in utilizing depth cues. The fully integrated DeCoDet model, combining MDDH, DCK, and SIRLoss, achieved the highest overall mAP, with a minor decline in the RDDTS bus category, emphasizing the crucial role of each component in improving detection in hazy conditions.
| Model | mAP on Test-set | mAP on RDDTS |
|---|---|---|
| VA-DepthNet ICLR2023vadepthnet | 42.1 | 19.9 |
| ZoeDepth Arxiv2023zoedepth | 46.1 | 22.3 |
| IEBins NEURIPS2023IEBins | 46.5 | 23.3 |
| UniDepth CVPR2024Unidepth | 46.8 | 22.7 |
| Metric3D Arxiv2024metric3d | 47.4 | 24.3 |
Effectiveness of Depth Map. We conduct experiments to evaluate the impact of depth maps generated by various estimation models. Beyond the models discussed in Sec. 3.1, we include VA-DepthNet ICLR2023vadepthnet and ZoeDepth Arxiv2023zoedepth . Tab. 3 demonstrates that prediction of Metric3D Arxiv2024metric3d achieved superior results, attributed to its exceptional depth estimation accuracy and generalization capacity in novel environments. These results underscore the critical necessity of accurate depth maps for enhancing detection capabilities.
| Setting | Para(M) | GFLOPs | Test-set | RDDTS | |
|---|---|---|---|---|---|
| W/o cls | 34.6 | 245.37 | 46.0 | 23.0 | |
| W/o reg | 34.6 | 245.37 | 47.0 | 24.0 | |
| Kernel | 3 | 34.53 | 244.74 | 38.7 | 19.2 |
| 5 | 34.57 | 247.81 | 44.3 | 22.5 | |
| 7 | 34.61 | 249.91 | 47.4 | 24.3 | |
| 9 | 34.68 | 257.02 | 47.2 | 24.6 | |
| Groups | 1 | 34.52 | 243.71 | 42.5 | 22.0 |
| 4 | 35.54 | 245.76 | 47.1 | 23.6 | |
| 16 | 34.61 | 249.91 | 47.4 | 24.3 | |
| 64 | 34.92 | 276.48 | 47.5 | 23.9 |
Effectiveness of Different DCK Settings. Tab. 4 explores various hyperparameters within the DCK module and their effects on detection performance. Initially, the performance impact of utilizing depth cues on different branches is examined. Removing the classification branch while applying DCK solely to regression features results in a significant performance drop, emphasizing the importance of modulating the classification branch with depth information for improved category information extraction. Conversely, removing the regression branch leads to less pronounced degradation, possibly due to the low resolution of the depth prediction map affecting regression enhancement.
Additionally, a thorough evaluation of hyperparameters is conducted. In exploring spatial dimensions, we assess the impact of kernel size. Increasing the kernel size to consistently improved performance with minimal increases in computational cost. However, further enlarging the kernel size results in performance degradation, likely due to the introduction of excessive context or noise. Regarding channel dimensions, we evaluate the use of different kernel groups. Compared to employing a single modulation kernel across all channels, increasing the number of groups improve information exchange within channels and enhanced network performance. Nevertheless, expanding channel groups beyond a certain point leads to diminishing returns due to redundancy and significantly increases computational costs.
| Loss function | SmoothL1 | MSE | SIRLoss |
|---|---|---|---|
| mAP on Test-set | 44.7 | 46.9 | 47.4 |
| mAP on RDDTS | 21.3 | 24.1 | 24.3 |
| 0.1 | 1.0 | 2.0 | 4.0 | 8.0 | |
|---|---|---|---|---|---|
| mAP on Test-set | 46.8 | 47.2 | 47.4 | 45.2 | 43.1 |
| mAP on RDDTS | 23.6 | 23.5 | 24.3 | 22.5 | 21.0 |
| Model | Backbone | Para (M) | GFLOPs | AP on Test-set | AP on RDDTS | |||||||
|---|---|---|---|---|---|---|---|---|---|---|---|---|
| Car | Truck | Bus | mAP | Car | Truck | Bus | mAP | |||||
| One-stage | ||||||||||||
| YOLOv3 Arxiv2018yolov3 | DarkNet-53 | 61.63 | 20.19 | 36.1 | 21.4 | 47.5 | 35.0 | 30.2 | 7.1 | 20.4 | 19.2 | |
| GFL CVPR2021GFLv2 | ResNet-50 | 32.26 | 198.65 | 50.3 | 11.5 | 48.5 | 36.8 | 33.5 | 2.4 | 5.9 | 13.9 | |
| YOLOX Arxiv2021yolox | CSPDark | 8.94 | 13.32 | 53.1 | 23.0 | 51.2 | 42.3 | 48.0 | 11.0 | 17.7 | 24.7 | |
| RepPoints ICCV2019RepPoints | ResNet-50 | 36.83 | 184.32 | 52.7 | 24.6 | 54.2 | 43.8 | 42.4 | 5.0 | 16.5 | 21.3 | |
| FCOS tianFCOSFullyConvolutional2019 | ResNet-50 | 32.11 | 191.48 | 54.4 | 27.1 | 56.2 | 45.9 | 43.3 | 8.7 | 16.4 | 22.8 | |
| Centernet ICCV2019CenterNet | ResNet-50 | 32.11 | 191.49 | 56.7 | 27.9 | 57.0 | 47.2 | 45.6 | 8.6 | 17.3 | 23.8 | |
| ATTS CVPR2020ATTS | ResNet-50 | 32.12 | 195.58 | 58.5 | 32.2 | 60.4 | 50.4 | 48.5 | 8.1 | 18.8 | 25.1 | |
| DDOD ACMICMM2021DDOD | ResNet-50 | 32.20 | 173.05 | 59.5 | 32.1 | 60.4 | 50.7 | 48.2 | 9.2 | 20.9 | 26.1 | |
| VFNet CVPR2021VFNet | ResNet-50 | 32.89 | 187.39 | 59.6 | 32.5 | 61.3 | 51.1 | 48.8 | 8.9 | 19.1 | 25.6 | |
| TOOD ICCV2021TOOD | ResNet-50 | 32.02 | 192.51 | 58.4 | 33.6 | 62.2 | 51.4 | 48.3 | 9.0 | 20.1 | 25.8 | |
| Two-stage | ||||||||||||
| Sparse RCNN TPAMI2023SparseRCNN | ResNet-50 | 108.54 | 147.45 | 33.0 | 14.2 | 35.6 | 27.7 | 20.0 | 3.4 | 7.8 | 10.4 | |
| Dynamic RCNN ECCV2020DynamicRCNN | ResNet-50 | 41.35 | 201.72 | 56.8 | 27.3 | 58.7 | 47.6 | 44.3 | 6.1 | 17.0 | 22.5 | |
| Faster RCNN TPAMI2017FasterRCNN | ResNet-50 | 41.35 | 201.72 | 56.3 | 30.5 | 59.3 | 48.7 | 44.0 | 7.9 | 19.0 | 23.6 | |
| Libra RCNN CVPR2019LibraRCNN | ResNet-50 | 41.62 | 209.92 | 57.3 | 30.4 | 59.3 | 49.0 | 45.7 | 8.5 | 16.8 | 23.7 | |
| Grid RCNN CVPR2019GridRCNN | ResNet-50 | 64.46 | 317.44 | 58.1 | 32.8 | 50.7 | 50.5 | 46.5 | 10.1 | 18.9 | 25.2 | |
| Cascade RCNN CVPR2018CascadeRCNN | ResNet-50 | 69.15 | 230.40 | 59.0 | 34.2 | 61.7 | 51.6 | 46.5 | 10.6 | 20.9 | 26.0 | |
| End2End | ||||||||||||
| Conditional DETR ICCV2019ConditionDETR | ResNet-50 | 43.55 | 94.17 | 42.1 | 12.6 | 36.8 | 30.5 | 22.2 | 2.3 | 11.2 | 11.7 | |
| DAB DETR ICLR2022DABDETR | ResNet-50 | 43.70 | 97.02 | 36.8 | 15.1 | 42.3 | 31.3 | 22.2 | 2.3 | 11.2 | 11.7 | |
| Deform DETR ICLR2021DeformableDETR | ResNet-50 | 40.01 | 192.51 | 58.8 | 34.1 | 62.9 | 51.9 | 46.3 | 11.2 | 21.9 | 26.5 | |
| Plug-and-play | ||||||||||||
| FCOS-DeCoDet | ResNet-50 | 34.61 | 249.91 | 55.9 | 28.6 | 57.6 | 47.4 (+1.5) | 48.1 | 11.1 | 17.8 | 24.3 (+1.5) | |
| VFNet-DeCoDet | ResNet-50 | 34.62 | 225.37 | 58.3 | 33.7 | 62.5 | 51.5 (+0.4) | 49.0 | 9.0 | 19.7 | 25.9 (+0.3) | |
Effectiveness of Depth Estimate Loss. Tab. 5 outlines the performance impacts of various depth estimate loss functions. Traditional loss functions like SmoothL1 and MSE focus on absolute differences, making them susceptible to noise in pseudo-labels and thus limiting effective depth-cue utilization for condition. In contrast, SIRLoss maintains scale invariance and enhances label refurbishment, yielding superior mAP scores. Additionally, a unified loss function incorporating depth estimation with object detection is optimized via the parameter , with providing an optimal balance as shown in Tab. 6. Values too low or high disrupt this balance, leading to potential underfitting or overfitting.
5.3 Comparison to SOTA method
We establish a comprehensive benchmark to evaluate the performance of current mainstream object detection and dehazing algorithms on the HazyDet dataset. Initially, we assess the detection algorithms’ performance, providing valuable insights for future developments. Subsequently, we evaluate the performance of SOTA image restoration models.
5.3.1 Performance of SOTA Detectors
We evaluate 18 leading object detectors on the HazyDet dataset, including single-stage, two-stage, and end-to-end methods. To ensure fair comparisons, all models are trained with a default schedule of 12 epochs (1), except for DAB-DETR and Deformable DETR, which use 50 epochs, and YOLOv3 and YOLOX, which utilize 300 epochs. We exclude test-time augmentation and multi-scale training, except for DAB-DETR and Deformable DETR, which require enhanced data augmentation. All models are trained on synthetic data from HazyDet’s training set and evaluate on its test set and RDDTS, using accuracy and efficiency as metrics. Detailed results can be found in Tab. 7.
| Type | Method | PSNR | SSIM | AP on Test-set | AP on RDDTS | |||||||
|---|---|---|---|---|---|---|---|---|---|---|---|---|
| Car | Truck | Bus | mAP | Car | Truck | Bus | mAP | |||||
| Baseline | Faster RCNN | - | - | 49.4 | 21.7 | 47.3 | 39.5 | 41.0 | 8.8 | 14.6 | 21.5 | |
| Dehaze | GridDehaze ICCV2019GridDehazeNet | 12.66 | 0.713 | 48.7 | 21.2 | 46.8 | 38.9 (-0.6) | 37.6 | 8.0 | 13.3 | 19.6 (-1.9) | |
| Dehaze | MixDehazeNet Arxiv2023mixdehazenetmixstructure | 15.52 | 0.743 | 49.5 | 22.0 | 48.4 | 39.9 (+0.4) | 40.8 | 8.3 | 14.4 | 21.2 (-0.3) | |
| Dehaze | DSANet NeuralNetworks2024DSANet | 19.01 | 0.751 | 50.1 | 23.0 | 49.2 | 40.8 (+1.3) | 41.8 | 9.7 | 15.8 | 22.4 (+0.9) | |
| Dehaze | FFA AAAI2020FFANet | 19.25 | 0.798 | 50.2 | 23.5 | 49.9 | 41.2 (+1.7) | 41.1 | 9.4 | 15.5 | 22.0 (+0.5) | |
| Dehaze | DehazeFormer TIP2023DehazeFormer | 17.53 | 0.802 | 51.3 | 24.7 | 51.5 | 42.5 (+3.0) | 41.2 | 9.3 | 15.2 | 21.9 (+0.4) | |
| Dehaze | gUNet Arxiv2022gUNet | 19.49 | 0.822 | 51.4 | 25.3 | 51.3 | 42.7 (+3.2) | 41.7 | 9.0 | 15.8 | 22.2 (+0.7) | |
| Dehaze | C2PNet CVPR2023C2PNet | 21.31 | 0.832 | 51.5 | 25.4 | 51.7 | 42.9 (+3.4) | 41.8 | 9.5 | 16.0 | 22.4 (+0.9) | |
| Dehaze | DCP CVPR2009DCP | 16.98 | 0.824 | 51.7 | 25.3 | 55.0 | 44.0 (+4.5) | 38.5 | 9.0 | 14.3 | 20.6 (-0.9) | |
| Dehaze | RIDCP CVPR2023RIDCP | 16.15 | 0.718 | 52.9 | 26.1 | 55.4 | 44.8 (+5.3) | 43.9 | 9.7 | 19.0 | 24.2 (+2.7) | |
| Joint | IA-YOLO AAAI2022IAYOLO | - | - | 44.1 | 22.2 | 48.6 | 38.3 | 41.9 | 8.0 | 17.3 | 22.4 | |
| Joint | TogetherNet ComputerGraphicsForum2022TogetherNet | - | - | 53.4 | 25.4 | 55.0 | 44.6 | 48.2 | 11.3 | 16.1 | 25.2 | |
Analysis of the Tab. 7 reveals consistent performance trends across detectors on both the test set and RDDTS, evidencing that our simulated environment effectively mirrors real-world hazy scenarios. While each detector exhibits strengths in hazy conditions, they also have inherent limitations. Single-stage detectors excel in speed and resource efficiency but often compromise on accuracy and generalization capabilities. Two-stage detectors deliver superior detection accuracy but at the cost of computational efficiency. End-to-end detectors simplify the process workflow, yet face challenges in complex training procedures. Current algorithms still have significant potential for improved accuracy, particularly under real-world haze conditions. The variation in detection accuracy among target types (e.g., cars, buses, trucks) highlights challenges related to the long-tail distribution in datasets, indicating a need for further algorithmic enhancements. Our method, DeCoDet, outperforms most single-stage and two-stage detectors but is surpassed by the state-of-the-art end-to-end detector, Deformable DETR ICLR2021DeformableDETR . However, these advanced detectors rely heavily on extensive data augmentation and longer training times, limiting their practical application. Additionally, our detector requires fewer parameters, offering a distinct advantage.
5.3.2 Performance of SOTA Dehazing Models
We conduct a comprehensive evaluation of contemporary dehazing models to assess their impact on detection tasks and investigate the relationship between low-level and high-level visual tasks. Our findings reveal that integrating dehazed outputs with detection models trained on hazy images generally leads to a decline in performance, a trend observed across almost all evaluated models. The study involves preprocessing test images with various dehazing algorithms before inputting the results into pre-trained detection models. We use the widely adopted Faster RCNN TPAMI2017FasterRCNN as the baseline, which is trained for twelve epochs on unmodified clear images.
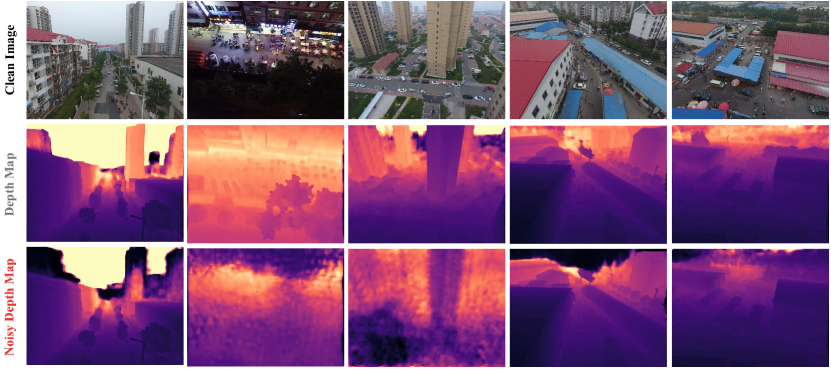
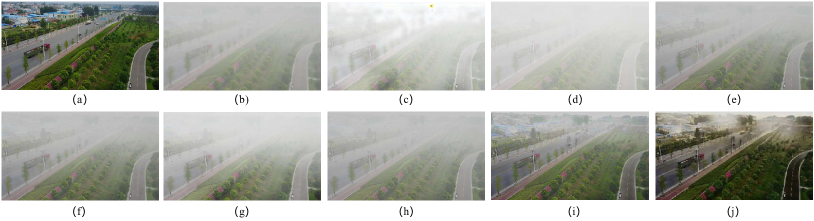
Fig. 8 displays the dehazing outcomes from different models, while Tab. 8 illustrates the detection network’s performance post-dehazing, evaluated through accuracy and image restoration metrics. As shown, most dehazing models only achieve slight improvements in clarity and visibility, likely due to the lack of design considerations for drone perspectives. Moreover, as Tab. 8 indicates, dehazing does not uniformly lead to enhanced detection performance. For example, GridDehaze and MixDehazeNet exhibit a dip in performance on the RDDTS dataset. In contrast, some models like DSANet NeuralNetworks2024DSANet , FFA AAAI2020FFANet , DehazeFormer TIP2023DehazeFormer , gUNet Arxiv2022gUNet , and C2PNet CVPR2023C2PNet demonstrate moderate improvements in detection accuracy, with RIDCP CVPR2023RIDCP showing significant advantages. These findings suggest that while dehazing can be beneficial, some models might inadvertently compromise essential features of hazy images, leading to new domain shift challenges during the dehazing process. The relationship between restoration metrics and detection accuracy is complex; heightened clarity or subjective image quality (as measured by PSNR and SSIM) does not inherently translate to improved detection capabilities. Detection models appear to gain more from preprocessing approaches that enhance visual quality while preserving or boosting features critical for object detection.
Additionally, we investigate two detection models optimized in conjunction with dehazing models: IA-YOLO AAAI2022IAYOLO and TogetherNet ComputerGraphicsForum2022TogetherNet . Despite these optimizations, both methods underperform compared to models trained directly on hazy images. This suboptimal performance may be attributed to the inadequacies of the baseline used.
| Noisy label ratio | 0 | 25% | 50% | 75% | 100% |
|---|---|---|---|---|---|
| mAP on Test-set | 47.4 | 45.1 | 43.5 | 41.2 | 39.7 |
| mAP on RDDTS | 24.3 | 22.0 | 21.1 | 21.8 | 21.0 |
5.4 Additional Analysis
Impact of Depth Map Quality. We argue that the limited progress in the existing DeCoDet model is primarily due to inaccurate depth map labeling. To explore this, we analyze the impact of depth prediction errors. In the absence of higher-quality depth estimation, we introduce noise into the original images, leading to degraded depth maps, as shown in Fig. 9. We gradually replace the original labels with these noisy ones. As seen in Tab. 9, high-quality depth maps yield significant performance boosts, while poor-quality maps impair network learning and degrade performance. We expect that enhancing depth model quality or using accurate depth maps will significantly boost performance, a direction for our future research.
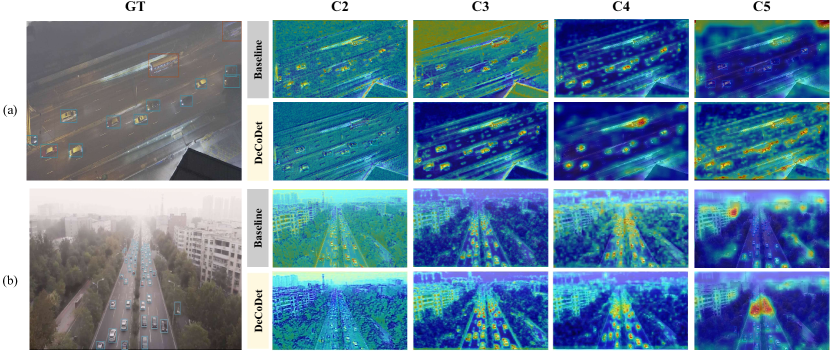
Visualization. Fig. 10 presents feature heatmaps of backbone comparing the baseline with DeCoDet under both synthetic and real foggy conditions. The integration of DeCoDet enables the network to more accurately pinpoint potential target regions and effectively concentrate its attention, resulting in improved detection accuracy. This enhancement is particularly evident in challenging foggy environments, where traditional models often struggle. By leveraging depth cues, DeCoDet not only refines the focus on relevant features but also mitigates the impact of haze, demonstrating its robustness and efficacy in adverse weather conditions.
Effectiveness on Other Detectors. Tab. 7 demonstrates that integrating DeCoDet with various single-stage detectors improves performance. FCOS-DeCoDet shows a significant mAP increase from 45.9 to 47.4 on the test set and from 22.8 to 24.3 on RDDTS. However, the gains for VFNet-DeCoDet are less significant due to their specialized detection heads, which may hinder the learning of depth information and create challenges in balancing depth estimation with detection tasks. Thus, while DeCoDet is beneficial, it’s essential to consider the detector’s architecture during integration to optimize performance.
6 Limitations and Future Work
The dataset proposed in this study, while comprehensive, still shows discrepancies when compared to the complex distributions present in real-world scenarios. These differences can lead to domain gap between simulated and real data. Thus, exploring more effective simulation methods is crucial for enhancing our understanding of visual perception under actual foggy conditions. Moreover, the operational environments for drones present additional challenges, such as rain, snow, and low-light conditions, which we plan to address in future research endeavors. This paper introduces a straightforward, practical, and effective approach to utilizing depth information as an auxiliary tool in detection tasks. However, the current method’s effectiveness is limited by the less-than-ideal accuracy of pseudo depth labels. Future work could address these limitations by incorporating more accurate depth data and designing specialized architectures to improve the performance and capabilities of drone target detection in adverse weather situations.
7 Conclusion
In this paper, we introduce HazyDet, which is the first and largest of its kind tailored for drone imagery detection under adverse weather conditions. Our aim is to make a substantial contribution to the field of object detection from a drone’s perspective. In pursuit of this, we develop the DeCoDet network to leverage previously overlooked scene auxiliary information, particularly depth. This innovative network combines depth estimation with object detection, employing cross-modal depth information. We design the MDDH to enable the network to learn depth information across various scales. Furthermore, we introduce the DCK mechanism, which uses the learned depth-cues to condition classification and regression tasks, thereby enhancing detection performance under drone viewpoints and foggy conditions. Our experiments confirm the effectiveness of this framework and its constituent modules. While the proposed framework achieves advanced performance on the large-scale benchmark, there remains considerable scope for further improvement. We hope that this work inspires more researchers to explore and contribute to advancements in drone detection under adverse weather conditions, thereby fostering broader development and applications of drones in real-world scenarios.
Data Availability Statement
We confirm that data supporting the results of this study can be obtained from TIP2019RESIDE , CVPR2021_4KDehaze and HazyDet.
Acknowledgment
The authors would like to thank the editor and the anonymous reviewers for their critical and constructive comments and suggestions. This research is supported by the National Natural Science Foundation of China (Grant No. 62301261, 62206134, 62361166670) and the Fellowship of China Postdoctoral Science Foundation (Grant No. 2021M701727). We acknowledge the Tianjin Key Laboratory of Visual Computing and Intelligent Perception (VCIP) for their essential resources. We extend our profound gratitude to Professor Pengfei Zhu and the dedicated AISKYEYE team from Tianjin University, whose invaluable data support has been instrumental to our research.
References
- [1] Yunzuo Zhang, Cunyu Wu, Wei Guo, Tian Zhang, and Wei Li. CFANet: Efficient Detection of UAV Image Based on Cross-Layer Feature Aggregation. IEEE Transactions on Geoscience and Remote Sensing, 61:1–11, 2023.
- [2] Kunyu Wang, Xueyang Fu, Chengjie Ge, Chengzhi Cao, and Zheng-Jun Zha. Towards generalized UAV object detection: A novel perspective from frequency domain disentanglement. International Journal of Computer Vision, pages 1–29, 2024.
- [3] Lucas Prado Osco, Mauro dos Santos de Arruda, Diogo Nunes Gonçalves, Alexandre Dias, Juliana Batistoti, Mauricio de Souza, Felipe David Georges Gomes, Ana Paula Marques Ramos, Lúcio André de Castro Jorge, Veraldo Liesenberg, Jonathan Li, Lingfei Ma, José Marcato, and Wesley Nunes Gonçalves. A CNN approach to simultaneously count plants and detect plantation-rows from UAV imagery. ISPRS Journal of Photogrammetry and Remote Sensing, 174:1–17, April 2021.
- [4] Ruiqian Zhang, Shawn Newsam, Zhenfeng Shao, Xiao Huang, Jiaming Wang, and Deren Li. Multi-scale adversarial network for vehicle detection in UAV imagery. ISPRS Journal of Photogrammetry and Remote Sensing, 180:283–295, October 2021.
- [5] Lei Fu, Wen bin Gu, Wei Li, Liang Chen, Yong bao Ai, and Hua lei Wang. Bidirectional parallel multi-branch convolution feature pyramid network for target detection in aerial images of swarm uavs. Defence Technology, 17(4):1531–1541, 2021.
- [6] Nicolas Carion, Francisco Massa, Gabriel Synnaeve, Nicolas Usunier, Alexander Kirillov, and Sergey Zagoruyko. End-to-End Object Detection with Transformers. In Andrea Vedaldi, Horst Bischof, Thomas Brox, and Jan-Michael Frahm, editors, Computer Vision - ECCV 2020 - 16th European Conference, Glasgow, UK, August 23-28, 2020, Proceedings, Lecture Notes in Computer Science, pages 213–229, Cham, 2020. Springer International Publishing.
- [7] Zhi Tian, Chunhua Shen, Hao Chen, and Tong He. FCOS: Fully Convolutional One-Stage Object Detection. In 2019 IEEE/CVF International Conference on Computer Vision, ICCV 2019, Seoul, Korea (South), October 27 - November 2, 2019, pages 9626–9635, October 2019.
- [8] Joseph Redmon and Ali Farhadi. Yolov3: An incremental improvement, 2018.
- [9] Shaoqing Ren, Kaiming He, Ross Girshick, and Jian Sun. Faster R-CNN: Towards Real-Time Object Detection with Region Proposal Networks. IEEE Transactions on Pattern Analysis and Machine Intelligence, 39(6):1137–1149, June 2017.
- [10] Chenhongyi Yang, Zehao Huang, and Naiyan Wang. QueryDet: Cascaded Sparse Query for Accelerating High-Resolution Small Object Detection. In IEEE/CVF Conference on Computer Vision and Pattern Recognition, CVPR 2022, New Orleans, LA, USA, June 18-24, 2022, pages 13658–13667, June 2022.
- [11] Bowei Du, Yecheng Huang, Jiaxin Chen, and Di Huang. Adaptive Sparse Convolutional Networks with Global Context Enhancement for Faster Object Detection on Drone Images. In IEEE/CVF Conference on Computer Vision and Pattern Recognition, CVPR 2023, Vancouver, BC, Canada, June 17-24, 2023, pages 13435–13444, June 2023.
- [12] Qi Zhao, Binghao Liu, Shuchang Lyu, Chunlei Wang, and Hong Zhang. TPH-YOLOv5++: Boosting Object Detection on Drone-Captured Scenarios with Cross-Layer Asymmetric Transformer. Remote Sensing, 15(6):1687, March 2023.
- [13] Fan Yang, Heng Fan, Peng Chu, Erik Blasch, and Haibin Ling. Clustered Object Detection in Aerial Images. In IEEE Conference on Computer Vision and Pattern Recognition, CVPR 2019, Long Beach, CA, USA, June 16-20, 2019, pages 8311–8320, Seoul, Korea (South), April 2019. arXiv.
- [14] Guanqiu Qi, Yuanchuan Zhang, Kunpeng Wang, Neal Mazur, Yang Liu, and Devanshi Malaviya. Small Object Detection Method Based on Adaptive Spatial Parallel Convolution and Fast Multi-Scale Fusion. Remote Sensing, 14(2):420, January 2022.
- [15] Yunzuo Zhang, Cunyu Wu, Tian Zhang, Yameng Liu, and Yuxin Zheng. Self-Attention Guidance and Multiscale Feature Fusion-Based UAV Image Object Detection. IEEE Geoscience and Remote Sensing Letters, 20:1–5, 2023.
- [16] Sutao Deng, Shuai Li, Ke Xie, Wenfeng Song, Xiao Liao, Aimin Hao, and Hong Qin. A Global-Local Self-Adaptive Network for Drone-View Object Detection. IEEE Transactions on Image Processing, 30:1556–1569, 2021.
- [17] Jingtao Xu, Ya-Li Li, and Shengjin Wang. AdaZoom: Towards Scale-Aware Large Scene Object Detection. IEEE Transactions on Multimedia, 25:4598–4609, 2023.
- [18] Xu Qin, Zhilin Wang, Yuanchao Bai, Xiaodong Xie, and Huizhu Jia. FFA-Net: Feature Fusion Attention Network for Single Image Dehazing. In Thirty-Fourth AAAI Conference on Artificial Intelligence, AAAI 2020, volume 34, pages 11908–11915, Hilton New York Midtown, New York, USA, 2020.
- [19] Naveed Akhtar, Mohammad A. A. K. Jalwana, Mohammed Bennamoun, and Ajmal Mian. Attack to fool and explain deep networks. IEEE Transactions on Pattern Analysis and Machine Intelligence, 44(10):5980–5995, October 2022.
- [20] Shih-Chia Huang, Trung-Hieu Le, and Da-Wei Jaw. DSNet: Joint Semantic Learning for Object Detection in Inclement Weather Conditions. IEEE Transactions on Pattern Analysis and Machine Intelligence, pages 1–1, 2020.
- [21] Wenyu Liu, Gaofeng Ren, Runsheng Yu, Shi Guo, Jianke Zhu, and Lei Zhang. Image-Adaptive YOLO for Object Detection in Adverse Weather Conditions. In Thirty-Sixth AAAI Conference on Artificial Intelligence, AAAI 2022, volume 36, pages 1792–1800, Vancouver, Canada, June 2022.
- [22] Chengyang Li, Heng Zhou, Yang Liu, Caidong Yang, Yongqiang Xie, Zhongbo Li, and Liping Zhu. Detection-Friendly Dehazing: Object Detection in Real-World Hazy Scenes. IEEE Transactions on Pattern Analysis and Machine Intelligence, 45(7):1–12, 2023.
- [23] Sebastien Razakarivony and Frederic Jurie. Vehicle detection in aerial imagery : A small target detection benchmark. Journal of Visual Communication and Image Representation, 34(C):187–203, January 2016.
- [24] Meng-Ru Hsieh, Yen-Liang Lin, and Winston H. Hsu. Drone-based object counting by spatially regularized regional proposal network. In IEEE International Conference on Computer Vision, ICCV 2017, Venice, Italy, October 22-29, 2017, pages 4145–4153, 2017.
- [25] Hongyang Yu, Guorong Li, Weigang Zhang, Qingming Huang, Dawei Du, Qi Tian, and Nicu Sebe. The unmanned aerial vehicle benchmark: Object detection, tracking and baseline. International Journal of Computer Vision, 128:1141–1159, 2020.
- [26] Pengfei Zhu, Longyin Wen, Dawei Du, Xiao Bian, Heng Fan, Qinghua Hu, and Haibin Ling. Detection and Tracking Meet Drones Challenge. IEEE Transactions on Pattern Analysis and Machine Intelligence, 44(11):7380–7399, November 2022.
- [27] Yuda Song, Zhuqing He, Hui Qian, and Xin Du. Vision Transformers for Single Image Dehazing. IEEE Transactions on Image Processing, 32:1927–1941, 2023.
- [28] Wenhui Chang, Hongming Chen, Xin He, Xiang Chen, and Liangduo Shen. UAV-Rain1k: A benchmark for raindrop removal from uav aerial imagery. In Proceedings of the IEEE/CVF Conference on Computer Vision and Pattern Recognition (CVPR) Workshops, pages 15–22, June 2024.
- [29] Yecheng Huang, Jiaxin Chen, and Di Huang. UFPMP-Det:Toward Accurate and Efficient Object Detection on Drone Imagery. In Thirty-Sixth AAAI Conference on Artificial Intelligence, AAAI 2022, volume 36, pages 1026–1033, June 2022.
- [30] Xuexue Li, Wenhui Diao, Yongqiang Mao, Peng Gao, Xiuhua Mao, Xinming Li, and Xian Sun. OGMN: Occlusion-guided multi-task network for object detection in UAV images. ISPRS Journal of Photogrammetry and Remote Sensing, 199:242–257, 2023.
- [31] Yue Xi, Wenjing Jia, Qiguang Miao, Junmei Feng, Jinchang Ren, and Heng Luo. Detection-Driven Exposure-Correction Network for Nighttime Drone-View Object Detection. IEEE Transactions on Geoscience and Remote Sensing, 62:1–14, 2024.
- [32] Kechen Song, Xiaotong Xue, Hongwei Wen, Yingying Ji, Yunhui Yan, and Qinggang Meng. Misaligned Visible-Thermal Object Detection: A Drone-based Benchmark and Baseline. IEEE Transactions on Intelligent Vehicles, pages 1–12, 2024.
- [33] Ding Liu, Bihan Wen, Jianbo Jiao, Xianming Liu, Zhangyang Wang, and Thomas S. Huang. Connecting Image Denoising and High-Level Vision Tasks via Deep Learning. IEEE Transactions on Image Processing, 29:3695–3706, 2020.
- [34] Boyi Li, Xiulian Peng, Zhangyang Wang, Jizheng Xu, and Dan Feng. AOD-Net: All-in-One Dehazing Network. In 2017 IEEE International Conference on Computer Vision (ICCV), pages 4780–4788, Venice, October 2017. IEEE.
- [35] Xianghui Li, Xinde Li, Zhijun Li, Xinran Xiong, Mohammad Omar Khyam, and Changyin Sun. Robust vehicle detection in high-resolution aerial images with imbalanced data. IEEE Transactions on Artificial Intelligence, 2(3):238–250, 2021.
- [36] Yiming Xie, Henglu Wei, Zhenyi Liu, Xiaoyu Wang, and Xiangyang Ji. Synfog: A photo-realistic synthetic fog dataset based on end-to-end imaging simulation for advancing real-world defogging in autonomous driving. In 2024 IEEE/CVF Conference on Computer Vision and Pattern Recognition (CVPR), pages 21763–21772, June 2024.
- [37] Boyi Li, Wenqi Ren, Dengpan Fu, Dacheng Tao, Dan Feng, Wenjun Zeng, and Zhangyang Wang. Benchmarking Single-Image Dehazing and Beyond. IEEE Transactions on Image Processing, 28:492–505, 2019.
- [38] Yuxin Feng, Zhuo Su, Long Ma, Xin Li, Risheng Liu, and Fan Zhou. Bridging the gap between haze scenarios: A unified image dehazing model. IEEE Transactions on Circuits and Systems for Video Technology, pages 1–1, 2024.
- [39] Kaichen Chi, Yuan Yuan, and Qi Wang. Trinity-net: Gradient-guided swin transformer-based remote sensing image dehazing and beyond. IEEE Transactions on Geoscience and Remote Sensing, 61:1–14, 2023.
- [40] Mu Hu, Wei Yin, Chi Zhang, Zhipeng Cai, Xiaoxiao Long, Hao Chen, Kaixuan Wang, Gang Yu, Chunhua Shen, and Shaojie Shen. Metric3d v2: A versatile monocular geometric foundation model for zero-shot metric depth and surface normal estimation, 2024.
- [41] Luigi Piccinelli, Yung-Hsu Yang, Christos Sakaridis, Mattia Segu, Siyuan Li, Luc Van Gool, and Fisher Yu. Unidepth: Universal monocular metric depth estimation. In 2024 IEEE/CVF Conference on Computer Vision and Pattern Recognition (CVPR), pages 10106–10116, June 2024.
- [42] Shuwei Shao, Zhongcai Pei, Xingming Wu, Zhong Liu, Weihai Chen, and Zhengguo Li. IEBins: Iterative elastic bins for monocular depth estimation. In A. Oh, T. Naumann, A. Globerson, K. Saenko, M. Hardt, and S. Levine, editors, Advances in Neural Information Processing Systems, volume 36, pages 53025–53037. Curran Associates, Inc., 2023.
- [43] Eric J. Nunn, Pejman Khadivi, and Shadrokh Samavi. Compound frechet inception distance for quality assessment of GAN created images, 2021.
- [44] JD Sutherland, Michael Arbel, and Arthur Gretton. Demystifying mmd gans. In International Conference for Learning Representations (ICLR), pages 1–36, 2018.
- [45] Zhuoran Zheng, Wenqi Ren, Xiaochun Cao, Xiaobin Hu, Tao Wang, Fenglong Song, and Xiuyi Jia. Ultra-high-definition image dehazing via multi-guided bilateral learning. In 2021 IEEE/CVF Conference on Computer Vision and Pattern Recognition (CVPR), pages 16180–16189, 2021.
- [46] Xinran Liua, Lin Qia, Yuxuan Songa, and Qi Wen. Depth Awakens: A Depth-perceptual Attention Fusion Network for RGB-D Camouflaged Object Detection. Image and Vision Computing, 143, March 2024.
- [47] Duo Li, Jie Hu, Changhu Wang, Xiangtai Li, Qi She, Lei Zhu, Tong Zhang, and Qifeng Chen. Involution: Inverting the inherence of convolution for visual recognition. In IEEE Conference on Computer Vision and Pattern Recognition, CVPR 2021, virtual, June 19-25, 2021, pages 12321–12330, June 2021.
- [48] Lingfeng Yang, Xiang Li, Renjie Song, Borui Zhao, Juntian Tao, Shihao Zhou, Jiajun Liang, and Jian Yang. Dynamic mlp for fine-grained image classification by leveraging geographical and temporal information. In IEEE/CVF Conference on Computer Vision and Pattern Recognition, CVPR 2022, New Orleans, LA, USA, June 18-24, 2022, pages 10935–10944, 2022.
- [49] Yuval Alaluf, Omer Tov, Ron Mokady, Rinon Gal, and Amit Bermano. Hyperstyle: Stylegan inversion with hypernetworks for real image editing. In IEEE/CVF Conference on Computer Vision and Pattern Recognition, CVPR 2022, New Orleans, LA, USA, June 18-24, 2022, pages 18490–18500, 2022.
- [50] David Eigen, Christian Puhrsch, and Rob Fergus. Depth map prediction from a single image using a multi-scale deep network. In Proceedings of the 27th International Conference on Neural Information Processing Systems - Volume 2, NIPS’14, page 2366–2374, Cambridge, MA, USA, 2014. MIT Press.
- [51] Ce Liu, Suryansh Kumar, Shuhang Gu, Radu Timofte, and Luc Van Gool. VA-depthnet: A variational approach to single image depth prediction. In International Conference on Learning Representations (ICLR), 2023.
- [52] Shariq Farooq Bhat, Reiner Birkl, Diana Wofk, Peter Wonka, and Matthias Müller. Zoedepth: Zero-shot transfer by combining relative and metric depth, 2023.
- [53] Xiang Li, Wenhai Wang, Xiaolin Hu, Jun Li, Jinhui Tang, and Jian Yang. Generalized focal loss v2: Learning reliable localization quality estimation for dense object detection. In 2021 IEEE/CVF Conference on Computer Vision and Pattern Recognition (CVPR), pages 11627–11636, 2021.
- [54] Zheng Ge, Songtao Liu, Feng Wang, Zeming Li, and Jian Sun. Yolox: Exceeding yolo series in 2021, 2021.
- [55] Ze Yang, Shaohui Liu, Han Hu, Liwei Wang, and Stephen Lin. Reppoints: Point set representation for object detection. In 2019 IEEE/CVF International Conference on Computer Vision, ICCV 2019, Seoul, Korea (South), October 27 - November 2, 2019, pages 9656–9665, 2019.
- [56] Kaiwen Duan, Song Bai, Lingxi Xie, Honggang Qi, Qingming Huang, and Qi Tian. Centernet: Keypoint triplets for object detection. In 2019 IEEE/CVF International Conference on Computer Vision, ICCV 2019, Seoul, Korea (South), October 27 - November 2, 2019, pages 6568–6577, 2019.
- [57] Shifeng Zhang, Cheng Chi, Yongqiang Yao, Zhen Lei, and Stan Z. Li. Bridging the gap between anchor-based and anchor-free detection via adaptive training sample selection. In 2020 IEEE/CVF Conference on Computer Vision and Pattern Recognition (CVPR), pages 9756–9765, 2020.
- [58] Zehui Chen, Chenhongyi Yang, Qiaofei Li, Feng Zhao, Zheng-Jun Zha, and Feng Wu. Disentangle your dense object detector. In Proceedings of the 29th ACM International Conference on Multimedia, MM ’21, page 4939–4948, New York, NY, USA, 2021. Association for Computing Machinery.
- [59] Haoyang Zhang, Ying Wang, Feras Dayoub, and Niko Sünderhauf. Varifocalnet: An iou-aware dense object detector. In 2021 IEEE/CVF Conference on Computer Vision and Pattern Recognition (CVPR), pages 8510–8519, 2021.
- [60] Chengjian Feng, Yujie Zhong, Yu Gao, Matthew R. Scott, and Weilin Huang. TOOD: Task-aligned one-stage object detection. In 2021 IEEE/CVF International Conference on Computer Vision, ICCV 2021, Montreal, QC, Canada, October 10-17, 2021, pages 3490–3499, 2021.
- [61] Peize Sun, Rufeng Zhang, Yi Jiang, Tao Kong, Chenfeng Xu, Wei Zhan, Masayoshi Tomizuka, Zehuan Yuan, and Ping Luo. Sparse R-CNN: An end-to-end framework for object detection. IEEE Transactions on Pattern Analysis and Machine Intelligence, 45(12):15650–15664, 2023.
- [62] Hongkai Zhang, Hong Chang, Bingpeng Ma, Naiyan Wang, and Xilin Chen. Dynamic R-CNN: Towards high quality object detection via dynamic training. In Computer Vision – ECCV 2020: 16th European Conference, Glasgow, UK, August 23–28, 2020, Proceedings, Part XV, page 260–275, Berlin, Heidelberg, 2020. Springer-Verlag.
- [63] Jiangmiao Pang, Kai Chen, Jianping Shi, Huajun Feng, Wanli Ouyang, and Dahua Lin. Libra R-CNN: towards balanced learning for object detection. In IEEE Conference on Computer Vision and Pattern Recognition, CVPR 2019, Long Beach, CA, USA, June 16-20, 2019, pages 821–830, 2019.
- [64] Xin Lu, Buyu Li, Yuxin Yue, Quanquan Li, and Junjie Yan. Grid r-cnn. In 2019 IEEE/CVF Conference on Computer Vision and Pattern Recognition (CVPR), pages 7355–7364, 2019.
- [65] Zhaowei Cai and Nuno Vasconcelos. Cascade R-CNN: delving into high quality object detection. In 2018 IEEE Conference on Computer Vision and Pattern Recognition, CVPR 2018, Salt Lake City, UT, USA, June 18-22, 2018, pages 6154–6162, 2018.
- [66] Depu Meng, Xiaokang Chen, Zejia Fan, Gang Zeng, Houqiang Li, Yuhui Yuan, Lei Sun, and Jingdong Wang. Conditional DETR for fast training convergence. In 2019 IEEE/CVF International Conference on Computer Vision, ICCV 2019, Seoul, Korea (South), October 27 - November 2, 2019, pages 3651–3660, October 2021.
- [67] Shilong Liu, Feng Li, Hao Zhang, Xiao Yang, Xianbiao Qi, Hang Su, Jun Zhu, and Lei Zhang. DAB-DETR: Dynamic anchor boxes are better queries for DETR. In International Conference on Learning Representations (ICLR), 2022.
- [68] Xizhou Zhu, Weijie Su, Lewei Lu, Bin Li, Xiaogang Wang, and Jifeng Dai. Deformable DETR: deformable transformers for end-to-end object detection. In 9th International Conference on Learning Representations, ICLR 2021, Virtual Event, Austria, May 3-7, 2021. OpenReview.net, 2021.
- [69] Xiaohong Liu, Yongrui Ma, Zhihao Shi, and Jun Chen. Griddehazenet: Attention-based multi-scale network for image dehazing. In 2019 IEEE/CVF International Conference on Computer Vision, ICCV 2019, Seoul, Korea (South), October 27 - November 2, 2019, pages 7313–7322, 2019.
- [70] LiPing Lu, Qian Xiong, DuanFeng Chu, and BingRong Xu. Mixdehazenet : Mix structure block for image dehazing network, 2023.
- [71] Yuning Cui and Alois Knoll. Dual-domain strip attention for image restoration. Neural Networks, 171:429–439, 2024.
- [72] Yuda Song, Zhuqing He, Hui Qian, and Xin Du. Vision transformers for single image dehazing. IEEE Transactions on Image Processing, 32:1927–1941, 2023.
- [73] Yu Zheng, Jiahui Zhan, Shengfeng He, Junyu Dong, and Yong Du. Curricular contrastive regularization for physics-aware single image dehazing. In IEEE/CVF Conference on Computer Vision and Pattern Recognition, CVPR 2023, Vancougridver, BC, Canada, June 17-24, 2023, pages 5785–5794, 2023.
- [74] Kaiming He, Jian Sun, and Xiaoou Tang. Single image haze removal using dark channel prior. In 2009 IEEE Conference on Computer Vision and Pattern Recognition, pages 1956–1963, 2009.
- [75] Rui-Qi Wu, Zheng-Peng Duan, Chun-Le Guo, Zhi Chai, and Chongyi Li. RIDCP: Revitalizing real image dehazing via high-quality codebook priors. In IEEE/CVF Conference on Computer Vision and Pattern Recognition, CVPR 2023, Vancouver, BC, Canada, June 17-24, 2023, pages 22282–22291, 2023.
- [76] Yuda Song, Yang Zhou, Hui Qian, and Xin Du. Rethinking performance gains in image dehazing networks, 2022.
- [77] Yongzhen Wang, Xuefeng Yan, Kaiwen Zhang, Lina Gong, Haoran Xie, Fu Lee Wang, and Mingqiang Wei. Togethernet: Bridging image restoration and object detection together via dynamic enhancement learning. Computer Graphics Forum, 41(7):465–476, 2022.
- [78] Ramprasaath R. Selvaraju, Michael Cogswell, Abhishek Das, Ramakrishna Vedantam, Devi Parikh, and Dhruv Batra. Grad-CAM: Visual explanations from deep networks via gradient-based localization. In 2017 IEEE International Conference on Computer Vision (ICCV), pages 618–626, 2017.