Mixed Warm Dark Matter Constraints using Milky Way Satellite Galaxy Counts
Abstract
Warm dark matter has been strongly constrained in recent years as the sole component of dark matter. However, a less-explored alternative is that dark matter consists of a mixture of warm and cold dark matter (MWDM). In this work, we use observations of Milky Way satellite galaxies to constrain MWDM scenarios where the formation of small-scale structure is suppressed either by generic thermal relic warm dark matter or a sterile neutrino produced through the Shi-Fuller mechanism. To achieve this, we model satellite galaxies by combining numerical simulations with semi-analytical models for the subhalo population, and use a galaxy–halo connection model to match galaxies onto dark matter subhalos. By comparing the number of satellites predicted by MWDM models to the observed satellite population from the Dark Energy Survey and Pan-STARRS1, we constrain the fraction of warm dark matter, , as a function of its mass, . We exclude dark matter being composed entirely of thermal relic warm dark matter with keV at a posterior ratio of 10:1, consistent with previous works. However, we find that warm dark matter with smaller mass is allowed when mixed with cold dark matter, and that the constraints strengthen with decreasing until they plateau at for keV. Likewise, in the case of a sterile neutrino with mass of 7 keV produced through the Shi-Fuller mechanism, we exclude a fraction of , independent of mixing angle. Our results extend constraints on MWDM to a region of parameter space that has been relatively unconstrained with previous analysis.
FERMILAB-PUB-24-0586-PPD
1 Introduction
The existence of non-baryonic dark matter can be inferred from a variety of astronomical and cosmological observations accumulated over the last century (see reviews by Einasto 2009 and Bertone & Hooper 2018). However, its particle nature still remains unknown and is considered to be one of the most important open problems in modern cosmology and particle physics, as shown by the enormous investment in experimental and theoretical investigations of dark matter (e.g., see reviews by Bertone et al. 2005 and Freese 2017).
The current cosmological paradigm consists of a cosmological constant, , and collisionless cold dark matter (CDM). In this model, dark matter is composed of a heavy, stable and non-interacting particle responsible for structure formation (Peebles, 1982; Blumenthal et al., 1984). While observations of the cosmic microwave background (CMB), big bang nucleosynthesis (BBN), galaxy clustering, weak lensing, and the Lyman- forest are in good agreement with the CDM model at length scales of Mpc (Chabanier et al., 2019; Aghanim et al., 2020; Ferreira, 2021), smaller scales are less observationally constrained, and dark matter might have properties that deviate from the standard CDM model at these smaller scales (e.g., Bullock & Boylan-Kolchin, 2017).
Due to their high dark matter content, small size and close proximity, the ultra-faint dwarf galaxy (UFD) satellites of the Milky Way (MW) are excellent systems to probe the properties of dark matter at the smallest scales (Simon, 2019). For example, the properties of dark matter such as its mass, interaction cross section, and thermal history can have a large impact on the number counts, luminosity function, kinematics and density profiles of UFDs (e.g., Lovell et al., 2014; Rocha et al., 2013; Kaplinghat et al., 2016; Peñarrubia et al., 2016; Bullock & Boylan-Kolchin, 2017; Nadler et al., 2019a; Dalal & Kravtsov, 2022; Esteban et al., 2023). UFDs are also among the best targets for indirect searches for dark matter annihilation or decay products (see Strigari 2018 for a review).
One alternative to the CDM model is warm dark matter (WDM), which has free-streaming effects that can suppress structure formation and thus the formation of dwarf galaxies (Kolb & Turner, 1990). One possible WDM candidate is the sterile neutrino (Dodelson & Widrow, 1994; Shi & Fuller, 1999) with right-handed chirality and no electric charge, which interacts with Standard Model particles through mixing with either neutrinos or through some beyond the Standard Model interaction (Abazajian, 2017; Adhikari et al., 2017; Boyarsky et al., 2019). The claimed detection of a 3.57 keV X-ray line in the halos of galaxies and galaxy clusters (Boyarsky et al., 2014; Bulbul et al., 2014) drew particular attention to a sterile neutrino with mass of 7 keV. However, follow-up observations and reanalysis have not reproduced the detection of this X-ray line (Slatyer, 2017; Dessert et al., 2020, 2024).
Numerous studies place strict constraints on WDM as the sole component of dark matter for both the general thermal relic case and specific sterile neutrino models (Zelko et al., 2022; Lovell, 2023). Using MW satellite counts, various works have placed stringent constraints on the mass of thermal relic WDM (Kennedy et al., 2014; Lovell et al., 2016; Enzi et al., 2021; Newton et al., 2021; Dekker et al., 2022; Newton et al., 2024), the strongest of which yields a 95% Bayesian lower limit of 6.5 keV (Nadler et al., 2021b). Other measurements of the Lyman– forest (e.g., Iršič et al., 2024), UV luminosity function (e.g., Liu et al., 2024), stellar streams (e.g., Banik et al., 2021) and gravitationally lensed quasars (e.g., Keeley et al., 2024) have also been used to set limits on the thermal relic WDM mass at 5.7, 3.2, 3.6, and 6.1 keV, respectively (using a variety of significance criteria). Moreover, through a combined analysis of MW satellites counts and strong gravitational lenses, Nadler et al. (2021a) produced a stringent joint constraint of 9.7 keV at a 95% Bayesian lower limit and 7.4 keV at a 20:1 marginal likelihood ratio. While Enzi et al. (2021) obtained limits of 6.0 keV at a 95% Bayesian lower limit and 2.6 keV at a 20:1 likelihood ratio by combining the analysis of gravitational lenses, Lyman- forest, and MW satellite counts.
Such constraints are alleviated if dark matter is composed partly of WDM and partly of CDM (Anderhalden et al., 2012; Parimbelli et al., 2021). Compared to the pure WDM scenario, there has been relatively little work constraining mixed warm dark matter (MWDM) scenarios. Using 21-cm absorption lines, Schneider (2018) found that the WDM fraction cannot be larger than 17 percent of the total dark matter abundance for thermal-relic WDM with mass of keV. Furthermore, Boyarsky et al. (2009) used the Lyman– forest to investigate the mixed CDM and sterile neutrino scenario, allowing sterile neutrino fraction below 60 percent of the total dark matter abundance for non-resonantly produced sterile neutrino with mass of keV. Additionally, Inoue et al. (2023) and Keeley et al. (2023) forecast future prospects for constraining MWDM models using JWST observations of lensed quasars. Many of these constraints are made with different model assumptions, therefore it is important to have complementary searches.
In this analysis, we use the population counts MW satellite galaxies found in Dark Energy Survey (DES: DES Collaboration et al., 2016) and Pan-STARRS1 (PS1: Chambers et al., 2016) survey to put constraints on MWDM properties. In Section 2, we first discuss the Semi-Analytical Sub-Halo Inference ModelIng code (sashimi; Hiroshima et al., 2018; Ando et al., 2019; Dekker et al., 2022) used to obtain the mass distribution of subhalos for different MWDM scenarios and present an analytical approximation for the suppression of the subhalo mass function relative to CDM. Section 3 describes the galaxy–halo connection model (Nadler et al., 2021b) used to predict the number of MW satellites that would be observable in different MWDM scenarios. We compare these predictions to the observed MW satellite counts to obtain constraints on mixed thermal-relic scenarios (Section 4) and mixed sterile neutrinos scenarios (Section 5). We discuss our analysis and conclude in Section 6. In our analysis, we adopt the flat MWDM model as our fiducial cosmology with km s-1 Mpc-1, , , , , , .
While completing this analysis, we were informed of a similar analysis of MWDM models based on cosmological N-body zoom-in simulations by An et al., (in prep). We find that our two analyses give qualitatively similar results, lending strength to both approaches.
2 Subhalo population of Mixed WDM
The free-streaming length of WDM suppresses the formation of low-mass subhalos that could host the faintest galaxies (Lovell et al., 2014). However, this suppression is reduced in the presence of CDM. In this work, we consider mixed dark matter with total dark matter abundance given by , and a WDM fraction given by .
In our analysis, we use the subhalo populations obtained from two GADGET-2-based (Springel, 2005) cosmological zoom-in simulations from Mao et al. (2015) as a basis for the CDM subhalo mass function. We have selected two simulated host halos that have similar masses ( and ), concentrations ( and 10.5.), and assembly histories as the MW halo, as well as an analog of the Large Magellanic Cloud halo. The simulations have a minimum particle mass of .
We account for the MWDM scenario by multiplying the distribution of subhalo masses in CDM, known as the subhalo mass function, with a subhalo suppression function , defined as
| (1) |
where is the subhalo mass function, is the subhalo mass at accretion within a radius where its mean density is 200 times the critical density of the Universe, is the WDM mass, and is the WDM fraction. Throughout this work, we calculate the subhalo suppression function based on the subhalo mass at accretion, which we assume is equal to its peak mass.
We further assume that the only difference between the MWDM and CDM scenario is the number of subhalos, and all other properties remain identical. Indeed, it has been demonstrated that the radial distribution of the subhalos large enough to consistently form galaxies does not change between CDM and WDM cosmologies (Lovell et al., 2014; Bose et al., 2017; Lovell et al., 2021). However, other differences between the CDM and MWDM models may affect the abundance of MW satellite galaxies. For instance the concentration-mass-redshift relation is different for CDM and WDM (Ludlow et al., 2016; Gilman et al., 2020), which might further reduce the predicted number of MW satellites. Our results are conservative in the sense that we do not account for this reduction.
In order to obtain the suppression function for a large range of (), we use the semi-analytical sashimi code (Hiroshima et al., 2018; Ando et al., 2019; Dekker et al., 2022). sashimi predicts subhalo properties for a given matter power spectrum and host halo mass, and has been tested against numerical simulations in the case of pure CDM and WDM. Semi-analytical models provide a fast and flexible platform for computing subhalo properties, allowing us to make quick estimates of the predictions from different dark matter scenarios. Alternative approaches exploring MWDM scenarios through cosmological N-body simulations are forthcoming and will provide a valuable cross check (An et al., in prep)
Here, we describe the case of MWDM comprised of a thermal relic WDM candidate, and we discuss applications to a sterile neutrino WDM candidate in Section 5. We compute the matter power spectrum with the Boltzmann code CLASS (Lesgourgues, 2011), where we specify , , and the relative temperature of WDM with respect to the photon temperature, . We obtain the relative temperature through
| (2) |
where is the spin degrees of freedom at decoupling, which can be found through the WDM abundance as
| (3) |
with the degrees of freedom for a fermionic dirac dark matter (Bode et al., 2001; Vogel & Abazajian, 2023). Moreover, when computing the matter power spectrum in CLASS, we turn off the fluid approximation through ncdm_fluid_approximation to increase precision. We observe that the transfer functions reach a plateau at large due to the CDM component at a height that depends on .
We obtain the subhalo suppression functions (Eq. 1) with sashimi for host halo mass of and consider keV with interval of 0.5 keV, and with interval of 0.1. In order to obtain an analytical expression for the suppression function, we fit the MWDM subhalo suppression functions to the following analytical function
| (4) |
where , , are fitting parameters. We find a good fit with the sashimi suppression functions when we parameterize the fitting parameters as:
| (5) | ||||
where is given by
| (6) |
For comparison, Lovell et al. (2014) found the following fitting parameters in the case of pure WDM: , , and .
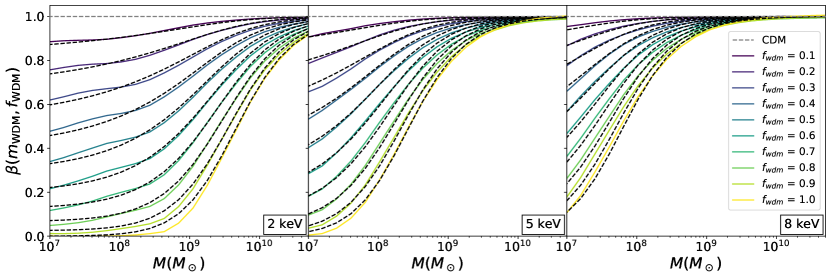
Fig. 1 illustrates the subhalo suppression functions obtained from the analytical fits (dashed) compared to the subhalo suppression functions obtained with sashimi (solid) for WDM mass of 2 keV (left), 5 keV (middle) and 8 keV (right). The difference between the two functions is less than 5% for subhalo masses in the range of and thermal-relic WDM mass of 1.5 keV 8keV. We find that our analytical fitting functions break down for keV, and thus we do not include those low masses in our analysis.
3 galaxy–halo connection model
We adopt the galaxy–halo connection model described in Nadler et al. (2019b, 2020) to predict the number of MW satellite galaxies that are expected to be observed in DES and PS1 for different MWDM scenarios. The model “paints” satellite galaxies onto the well-resolved simulated subhalos with a peak mass of , present-day maximum circular velocity of 9 km s-1 and peak circular velocity of 10 km s-1, as discussed in the following.
In this galaxy–halo connection model, the total number of predicted MW satellites, , is given by
| (7) |
where indexes the simulated subhalos, is the galaxy occupation fraction (probability that the subhalo will host a satellite galaxy), is the probability that a subhalo would be disrupted due to baryonic effects (Nadler et al., 2018), is probability of the galaxy being detected in DES and PS1 calculated using survey selection functions from Drlica-Wagner et al. (2020), and (Eq. 4) is the subhalo suppression function relative to the simulated subhalo population in CDM. For a given set of galaxy–halo connection parameters (, see Nadler et al. 2020 for more details), and a specific subhalo suppression function, , we can generate a predicted population of satellite galaxies.
4 Limits on Mixed Thermal Relic WDM
To constrain MWDM scenarios, we compare the predicted galaxy counts from individual MWDM models with the observed counts of 17 and 19 known satellites from DES and PS1, respectively (see Nadler et al. 2020 for details on how the satellites are selected).
To incorporate the luminosity and size information of the satellites, we bin the predicted and observed satellites based on their absolute magnitude and surface brightness.111We first bin the galaxies into 7 equally-spaced bins based on their absolute magnitude from . We further split the galaxies into 4 bins, based on a surface brightness threshold at 28 mag arcsec-2 and whether the galaxies would be found in the DES and PS1, resulting in a total of 28 galaxy bins. We obtain the likelihood that the predicted number of galaxies for each MWDM scenario represent the observed MW satellite population in DES and PS1 by assuming that the predicted number of satellite galaxies follows a Poisson distribution in each bin (Nadler et al., 2020).
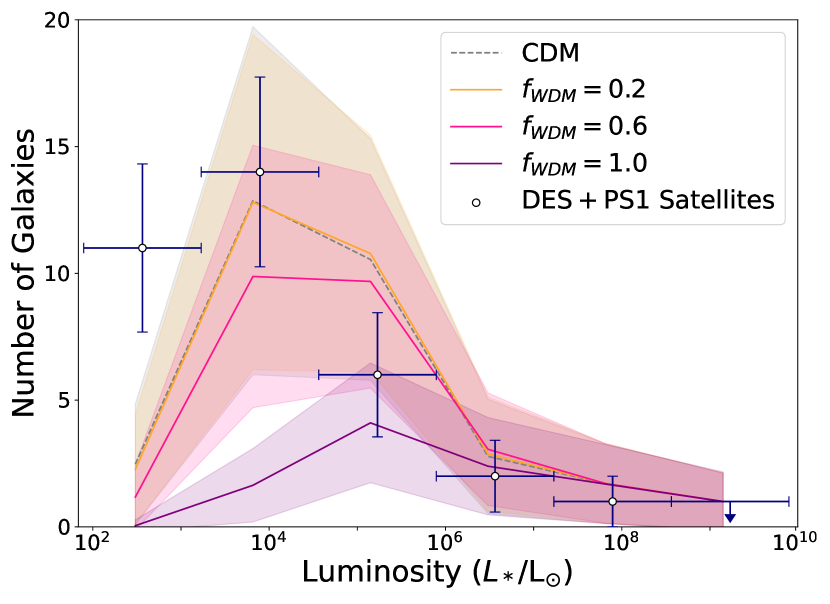
Fig. 2 shows the binned predicted luminosity functions of galaxies observed in both the DES and PS1 regions for CDM and MWDM with keV. For each scenario, we use the Markov Chain Monte Carlo sampler emcee (Foreman-Mackey et al., 2013) to sample the posterior distribution of the galaxy–halo connection parameters. The shaded band represents the uncertainty due to different galaxy-halo connection model values and the stochasticity of the model. The uncertainties of the luminosities and number counts of the observed satellites is associated with the size of the luminosity bins used in the analysis and Poisson statistics, respectively. We find that due to the uncertainty in the galaxy-halo connection parameters, the , keV MWDM scenario predicts roughly the same number of MW satellite galaxies as CDM, while the scenario starts to show a deviation from CDM. Note that for illustrative purposes, we only bin the galaxies based on their luminosities in Fig. 2.
We use emcee (Foreman-Mackey et al., 2013) to sample the marginalized posterior distribution of the galaxy–halo connection model for different MWDM models. In our analysis, we scan over fixed WDM mass and leave the WDM fraction as a free parameter between . For each WDM mass, we run emcee for 20,000 steps with 8 walkers to sample the posterior of nine free parameters in the model, . The first eight parameters are the galaxy–halo connection parameters, and we marginalize over them in this analysis. We run the MCMC chains for WDM masses in the range of keV at mass intervals of 0.5 keV.
To obtain constraints, we find the value of that yields a posterior odds ratio compared to CDM of : : (and 20:1) following the approach of Nadler et al. (2021a) and Keeley et al. (2024). We obtain the marginalized posterior odds ratio, : , by comparing the number of walkers for particular WDM fraction, with the walkers at the CDM limit using a histogram with bin size of .
An alternative method commonly quoted in the WDM literature is the 95% credible interval (Viel et al., 2013; Nadler et al., 2021b), which is defined as the range of parameter values which enclosed 95% of the integrated marginal posterior. While the credible interval methods includes more information of the shape of the posterior, our posteriors are unbounded in the limit of large , and thus the limits obtained would be sensitive to the boundary of the priors adopted for the WDM parameters which can be arbitrary.222The full posterior distribution can be found https://github.com/chinyitan/mwdm.
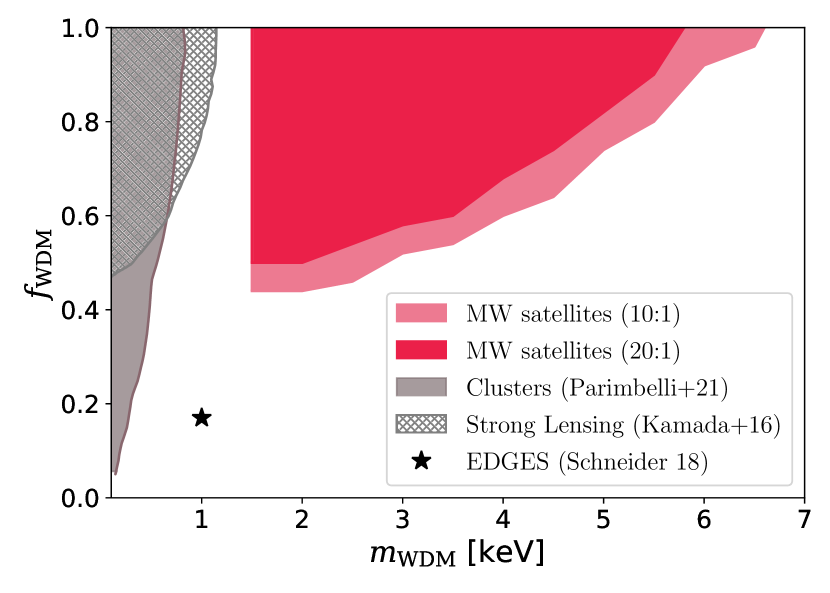
Fig. 3 shows the parameter space that is disfavored by the MW satellite galaxy counts. We exclude WDM with mass keV (5.8 keV) with a posterior ratio of 10:1 (or 20:1) from being all of dark matter. This is similar to the pure WDM constraints found in Nadler et al. (2021a), which excluded keV also at marginalized posterior ratio of 20:1 using a slightly different form for the suppression of the subhalo mass function. As we move towards lower , our allowed WDM fraction, , decreases until our constraints starts to converge at (0.50). Moreover, we find that fixing the galaxy–halo connection parameters would result in a constraint on that linearly decreases with , lowering the minimum allowed values below for keV. In Fig. 3, we also compare our constraints with previous constraints at smaller values, as shown as grey shaded regions from gravitational lenses (Kamada et al., 2016), and cluster number counts (Parimbelli et al., 2021). Moreover, the star represent constraints from the 21-cm absorption feature claimed by EDGES (Bowman et al., 2018), which excludes for 1 keV (Schneider, 2018).
5 Limits on Mixed Sterile Neutrino
We apply our analysis to a MWDM model consisting of a keV sterile neutrino produced through the Shi-Fuller mechanism (Shi & Fuller, 1999), in which its production is resonantly enhanced due to the presence of a net lepton asymmetry in the primordial plasma. Sterile neutrino’s are not produced thermally, and their spectral energy distributions are typically warmer than thermal WDM at comparable mass. We use the public sterile-dm code (Venumadhav et al., 2016) to generate the phase-space distributions of and for a range of lepton asymmetry values that correspond to sterile neutrino abundances, , and mixing angles, . We obtain the shape of the matter power spectrum by providing the phase-space distributions as an input for the Boltzmann code CLASS (Lesgourgues, 2011). We obtain the subhalo suppression function using sashimi for mixing angles and fractions in the range of and with fraction steps of 0.1. The subhalo suppression function can be approximated using Eq. 4, for which we fit the parameters , , and for fractions in the range of .
We note that there is uncertainty in modeling the phase-space distribution of sterile neutrinos (e.g., Lovell, 2023). For example, the phase-space distributions obtained by Ghiglieri & Laine (2015) are colder than the ones produced by sterile-dm (Venumadhav et al., 2016), especially at large mixing angles. For the 7.1 keV sterile neutrino considered by Lovell (2023), we find that the expected number of observable MW satellite galaxies produced by the Ghiglieri & Laine (2015) model is larger than the prediction from Venumadhav et al. (2016) by a factor of for , but that for smaller mixing angles of the difference is a factor of . This theoretical modeling uncertainty is not included in our constraints.
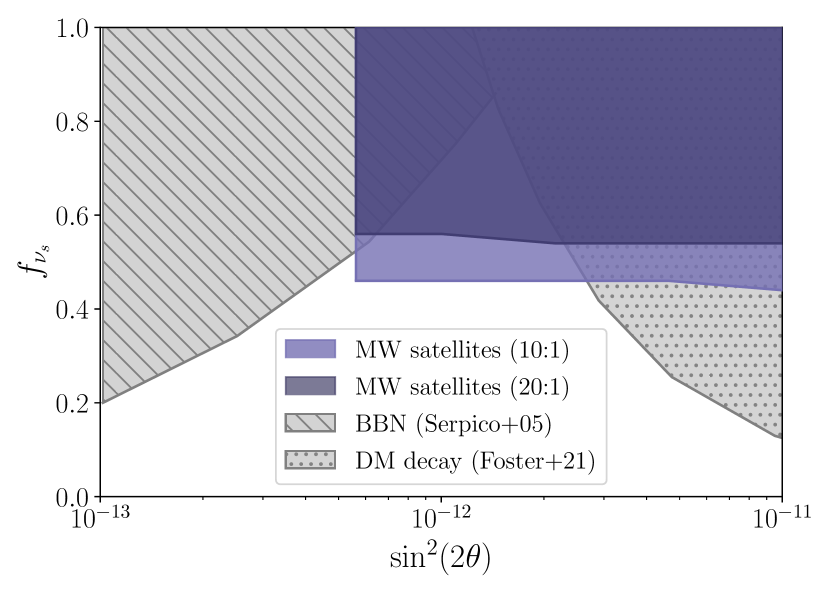
Fig. 4 shows the exclusion region of the fraction of dark matter composed of a 7 keV sterile neutrino as a function of mixing angle derived from the same galaxy–halo connection model as for the thermal relic WDM scenario. For the mixing angles considered in this work, the constraints on the fraction are roughly constant with at a posterior ratio of 10:1 (or 20:1). This is consistent with the results for the thermal relic WDM at low mass ( keV). The grey hatched region shows the bound obtained from the maximum allowed lepton asymmetry value from BBN of (Serpico & Raffelt, 2005), which we translate to the parameter space using the sterile-dm code. Moreover, sterile neutrinos can decay into an active neutrino and photon, which would be detectable as a monochromatic X-ray line at . The grey dotted region shows constraints from the non-observation of a line in XMM-Newton data by Foster et al. (2021), which has been scaled inversely with .
6 Discussion and Conclusion
Using the population of MW satellite galaxies detected by DES and PS1, we put new constraints on MWDM scenarios. We use the CDM subhalo population obtained from Mao et al. (2015) and implemented the MWDM scenario by suppressing the subhalo population using an analytical function, , derived from the semi-analytical subhalo inference model, sashimi (Hiroshima et al., 2018; Ando et al., 2019; Dekker et al., 2022). Using the galaxy–halo connection model from Nadler et al. (2020, 2021b), we estimate the predicted number of MW satellites for different MWDM scenarios and calculate the likelihood of observing the known satellites in DES and PS1 given the MWDM model parameters.
We find that MW satellite galaxy counts constrain the fraction of thermal WDM at keV for at a posterior ratio threshold of 10:1. As we decrease the WDM mass, our allowed WDM fraction decreases to for keV. These constraints from MW satellite counts extend existing MWDM constraints to much higher masses ( keV) compared to previous analysis that used different methods. Due to uncertainties in the galaxy–halo connection parameters and the limited population of observed MW satellites, our analysis cannot differentiate among MWDM scenarios with leading our constraints to asymptote to this value at low .
In addition to the thermal relic MWDM scenario, we also constrain a mixed dark matter model consisting of CDM and a 7 keV sterile neutrino produced by the Shi-Fuller mechanism. We find that MW satellite galaxy counts constrain a 7 keV sterile neutrino to be a subdominant fraction () of the dark matter for mixing angles between at a posterior ratio of 10:1. When our constraints are combined with limits from BBN and X-rays, we find that a 7 keV sterile neutrino produced by the Shi-Fuller mechanism is constrained to make up of the dark matter across the range of mixing angles that are commonly considered.
In this work, we relied on only two cosmological zoom-in simulations for our MW subhalo population. This limits our ability to investigate uncertainties in the host halo mass (which changes the normalization of the subhalo mass function and thus the total number of subhalos), host environments and formation histories. Recent efforts to simulate a much larger suite of MW-like hosts in CDM (Nadler et al., 2023; Buch et al., 2024) and alternative dark matter scenarios (e.g., Nadler et al. in prep., An et al. in prep.) are expected to better constrain these systematic uncertainties. In addition, sashimi could be used to generate subhalo populations for a range of host halo masses; however, this would require modifications to incorporate spatial information and the effects of the LMC on the satellite population.
Our constraints come from the MW satellite population found in DES and PS1 and the corresponding survey selection functions (Drlica-Wagner et al., 2020). However, the known population of MW satellites has grown significantly over the past few years (e.g., Mau et al., 2020; Cerny et al., 2021, 2023a, 2023b; Smith et al., 2023; Homma et al., 2024; Tan et al., 2024). Furthermore, current and near-future surveys such as the DECam Local Volume Exploration survey (DELVE; Drlica-Wagner et al., 2021, 2022), the Hyper Suprime-Cam Strategic Survey Program (HSC-SSP; Aihara et al., 2018), the Ultraviolet Near Infrared Optical Northern Survey (UNIONS; Ibata et al., 2017), and the Rubin Observatory’s Legacy Survey of Space and Time (LSST; Ivezić et al., 2019) are expected significantly increase the known population of MW satellites in the coming years (e.g., Hargis et al., 2014; Jethwa et al., 2018; Newton et al., 2018; Nadler et al., 2020; Manwadkar & Kravtsov, 2022; Nadler et al., 2024). This growing population of UFDs will improve our understanding of dark matter and allow for more sensitive searches for potential deviation from CDM.
References
- Abazajian (2017) Abazajian, K. N. 2017, Phys. Rep., 711, 1, doi: 10.1016/j.physrep.2017.10.003
- Adhikari et al. (2017) Adhikari, R., Agostini, M., Ky, N. A., et al. 2017, J. Cosmology Astropart. Phys, 2017, 025, doi: 10.1088/1475-7516/2017/01/025
- Aghanim et al. (2020) Aghanim, N., Akrami, Y., Arroja, F., et al. 2020, Astronomy &; Astrophysics, 641, A1, doi: 10.1051/0004-6361/201833880
- Aihara et al. (2018) Aihara, H., Arimoto, N., Armstrong, R., et al. 2018, PASJ, 70, S4, doi: 10.1093/pasj/psx066
- Anderhalden et al. (2012) Anderhalden, D., Diemand, J., Bertone, G., Macciò, A. V., & Schneider, A. 2012, J. Cosmology Astropart. Phys, 2012, 047, doi: 10.1088/1475-7516/2012/10/047
- Ando et al. (2019) Ando, S., Ishiyama, T., & Hiroshima, N. 2019, Galaxies, 7, 68, doi: 10.3390/galaxies7030068
- Astropy Collaboration et al. (2018) Astropy Collaboration, Price-Whelan, A. M., Sipőcz, B. M., et al. 2018, AJ, 156, 123, doi: 10.3847/1538-3881/aabc4f
- Banik et al. (2021) Banik, N., Bovy, J., Bertone, G., Erkal, D., & de Boer, T. J. L. 2021, J. Cosmology Astropart. Phys, 2021, 043, doi: 10.1088/1475-7516/2021/10/043
- Bertone & Hooper (2018) Bertone, G., & Hooper, D. 2018, Reviews of Modern Physics, 90, 045002, doi: 10.1103/RevModPhys.90.045002
- Bertone et al. (2005) Bertone, G., Hooper, D., & Silk, J. 2005, Phys. Rep., 405, 279, doi: 10.1016/j.physrep.2004.08.031
- Blumenthal et al. (1984) Blumenthal, G. R., Faber, S. M., Primack, J. R., & Rees, M. J. 1984, Nature, 311, 517, doi: 10.1038/311517a0
- Bode et al. (2001) Bode, P., Ostriker, J. P., & Turok, N. 2001, Astrophys. J., 556, 93, doi: 10.1086/321541
- Bose et al. (2017) Bose, S., Hellwing, W. A., Frenk, C. S., et al. 2017, MNRAS, 464, 4520, doi: 10.1093/mnras/stw2686
- Bowman et al. (2018) Bowman, J. D., Rogers, A. E. E., Monsalve, R. A., Mozdzen, T. J., & Mahesh, N. 2018, Nature, 555, 67, doi: 10.1038/nature25792
- Boyarsky et al. (2019) Boyarsky, A., Drewes, M., Lasserre, T., Mertens, S., & Ruchayskiy, O. 2019, Progress in Particle and Nuclear Physics, 104, 1, doi: 10.1016/j.ppnp.2018.07.004
- Boyarsky et al. (2009) Boyarsky, A., Lesgourgues, J., Ruchayskiy, O., & Viel, M. 2009, J. Cosmology Astropart. Phys, 2009, 012, doi: 10.1088/1475-7516/2009/05/012
- Boyarsky et al. (2014) Boyarsky, A., Ruchayskiy, O., Iakubovskyi, D., & Franse, J. 2014, Phys. Rev. Lett., 113, 251301, doi: 10.1103/PhysRevLett.113.251301
- Buch et al. (2024) Buch, D., Nadler, E. O., Wechsler, R. H., & Mao, Y.-Y. 2024, ApJ, 971, 79, doi: 10.3847/1538-4357/ad554c
- Bulbul et al. (2014) Bulbul, E., Markevitch, M., Foster, A., et al. 2014, ApJ, 789, 13, doi: 10.1088/0004-637X/789/1/13
- Bullock & Boylan-Kolchin (2017) Bullock, J. S., & Boylan-Kolchin, M. 2017, ARA&A, 55, 343, doi: 10.1146/annurev-astro-091916-055313
- Cerny et al. (2021) Cerny, W., Pace, A. B., Drlica-Wagner, A., et al. 2021, ApJ, 920, L44, doi: 10.3847/2041-8213/ac2d9a
- Cerny et al. (2023a) Cerny, W., Simon, J. D., Li, T. S., et al. 2023a, ApJ, 942, 111, doi: 10.3847/1538-4357/aca1c3
- Cerny et al. (2023b) Cerny, W., Martínez-Vázquez, C. E., Drlica-Wagner, A., et al. 2023b, ApJ, 953, 1, doi: 10.3847/1538-4357/acdd78
- Chabanier et al. (2019) Chabanier, S., Millea, M., & Palanque-Delabrouille, N. 2019, MNRAS, 489, 2247, doi: 10.1093/mnras/stz2310
- Chambers et al. (2016) Chambers, K. C., Magnier, E. A., Metcalfe, N., et al. 2016, arXiv e-prints, arXiv:1612.05560, doi: 10.48550/arXiv.1612.05560
- Dalal & Kravtsov (2022) Dalal, N., & Kravtsov, A. 2022, arXiv e-prints, arXiv:2203.05750, doi: 10.48550/arXiv.2203.05750
- Dekker et al. (2022) Dekker, A., Ando, S., Correa, C. A., & Ng, K. C. Y. 2022, Phys. Rev. D, 106, 123026, doi: 10.1103/PhysRevD.106.123026
- DES Collaboration et al. (2016) DES Collaboration, Abbott, T., Abdalla, F. B., et al. 2016, MNRAS, 460, 1270, doi: 10.1093/mnras/stw641
- Dessert et al. (2024) Dessert, C., Foster, J. W., Park, Y., & Safdi, B. R. 2024, Astrophys. J., 964, 185, doi: 10.3847/1538-4357/ad2612
- Dessert et al. (2020) Dessert, C., Rodd, N. L., & Safdi, B. R. 2020, Science, 367, 1465, doi: 10.1126/science.aaw3772
- Dodelson & Widrow (1994) Dodelson, S., & Widrow, L. M. 1994, Phys. Rev. Lett., 72, 17, doi: 10.1103/PhysRevLett.72.17
- Drlica-Wagner et al. (2020) Drlica-Wagner, A., Bechtol, K., Mau, S., et al. 2020, ApJ, 893, 47, doi: 10.3847/1538-4357/ab7eb9
- Drlica-Wagner et al. (2021) Drlica-Wagner, A., Carlin, J. L., Nidever, D. L., et al. 2021, ApJS, 256, 2, doi: 10.3847/1538-4365/ac079d
- Drlica-Wagner et al. (2022) Drlica-Wagner, A., Ferguson, P. S., Adamów, M., et al. 2022, ApJS, 261, 38, doi: 10.3847/1538-4365/ac78eb
- Einasto (2009) Einasto, J. 2009, arXiv e-prints, arXiv:0901.0632, doi: 10.48550/arXiv.0901.0632
- Enzi et al. (2021) Enzi, W., et al. 2021, Mon. Not. Roy. Astron. Soc., 506, 5848, doi: 10.1093/mnras/stab1960
- Enzi et al. (2021) Enzi, W., Murgia, R., Newton, O., et al. 2021, MNRAS, 506, 5848, doi: 10.1093/mnras/stab1960
- Esteban et al. (2023) Esteban, I., Peter, A. H. G., & Kim, S. Y. 2023, arXiv e-prints, arXiv:2306.04674, doi: 10.48550/arXiv.2306.04674
- Ferreira (2021) Ferreira, E. G. M. 2021, A&A Rev., 29, 7, doi: 10.1007/s00159-021-00135-6
- Foreman-Mackey et al. (2013) Foreman-Mackey, D., Hogg, D. W., Lang, D., & Goodman, J. 2013, PASP, 125, 306, doi: 10.1086/670067
- Foster et al. (2021) Foster, J. W., Kongsore, M., Dessert, C., et al. 2021, Phys. Rev. Lett., 127, 051101, doi: 10.1103/PhysRevLett.127.051101
- Freese (2017) Freese, K. 2017, International Journal of Modern Physics D, 26, 1730012, doi: 10.1142/S0218271817300129
- Ghiglieri & Laine (2015) Ghiglieri, J., & Laine, M. 2015, Journal of High Energy Physics, 2015, 171, doi: 10.1007/JHEP11(2015)171
- Gilman et al. (2020) Gilman, D., Birrer, S., Nierenberg, A., et al. 2020, MNRAS, 491, 6077, doi: 10.1093/mnras/stz3480
- Hargis et al. (2014) Hargis, J. R., Willman, B., & Peter, A. H. G. 2014, ApJ, 795, L13, doi: 10.1088/2041-8205/795/1/L13
- Hiroshima et al. (2018) Hiroshima, N., Ando, S., & Ishiyama, T. 2018, Physical Review D, 97, doi: 10.1103/physrevd.97.123002
- Homma et al. (2024) Homma, D., Chiba, M., Komiyama, Y., et al. 2024, PASJ, doi: 10.1093/pasj/psae044
- Hunter (2007) Hunter, J. D. 2007, Computing in Science and Engineering, 9, 90, doi: 10.1109/MCSE.2007.55
- Ibata et al. (2017) Ibata, R. A., McConnachie, A., Cuillandre, J.-C., et al. 2017, ApJ, 848, 128, doi: 10.3847/1538-4357/aa855c
- Inoue et al. (2023) Inoue, K. T., Shinohara, T., Suyama, T., & Takahashi, T. 2023, arXiv e-prints, arXiv:2312.17536, doi: 10.48550/arXiv.2312.17536
- Iršič et al. (2024) Iršič, V., Viel, M., Haehnelt, M. G., et al. 2024, Phys. Rev. D, 109, 043511, doi: 10.1103/PhysRevD.109.043511
- Ivezić et al. (2019) Ivezić, Ž., Kahn, S. M., Tyson, J. A., et al. 2019, ApJ, 873, 111, doi: 10.3847/1538-4357/ab042c
- Jethwa et al. (2018) Jethwa, P., Erkal, D., & Belokurov, V. 2018, MNRAS, 473, 2060, doi: 10.1093/mnras/stx2330
- Jones et al. (2001) Jones, E., Oliphant, T., Peterson, P., & Others. 2001, SciPy: Open source scientific tools for Python. http://www.scipy.org/
- Kamada et al. (2016) Kamada, A., Inoue, K. T., & Takahashi, T. 2016, Phys. Rev. D, 94, 023522, doi: 10.1103/PhysRevD.94.023522
- Kaplinghat et al. (2016) Kaplinghat, M., Tulin, S., & Yu, H.-B. 2016, Phys. Rev. Lett., 116, 041302, doi: 10.1103/PhysRevLett.116.041302
- Keeley et al. (2023) Keeley, R. E., Nierenberg, A. M., Gilman, D., et al. 2023, MNRAS, 524, 6159, doi: 10.1093/mnras/stad2251
- Keeley et al. (2024) —. 2024, arXiv e-prints, arXiv:2405.01620, doi: 10.48550/arXiv.2405.01620
- Kennedy et al. (2014) Kennedy, R., Frenk, C., Cole, S., & Benson, A. 2014, Mon. Not. Roy. Astron. Soc., 442, 2487, doi: 10.1093/mnras/stu719
- Kluyver et al. (2016) Kluyver, T., Ragan-Kelley, B., Pérez, F., et al. 2016, in Positioning and Power in Academic Publishing: Players, Agents and Agendas, ed. F. Loizides & B. Schmidt (IOS Press BV, Amsterdam, Netherlands), 87 – 90, doi: 10.3233/978-1-61499-649-1-87
- Kolb & Turner (1990) Kolb, E. W., & Turner, M. S. 1990, The early universe, Vol. 69
- Lesgourgues (2011) Lesgourgues, J. 2011, The Cosmic Linear Anisotropy Solving System (CLASS) I: Overview. https://arxiv.org/abs/1104.2932
- Liu et al. (2024) Liu, B., Shan, H., & Zhang, J. 2024, ApJ, 968, 79, doi: 10.3847/1538-4357/ad4ed8
- Lovell (2023) Lovell, M. R. 2023, MNRAS, 524, 6345, doi: 10.1093/mnras/stad2237
- Lovell et al. (2021) Lovell, M. R., Cautun, M., Frenk, C. S., Hellwing, W. A., & Newton, O. 2021, MNRAS, 507, 4826, doi: 10.1093/mnras/stab2452
- Lovell et al. (2014) Lovell, M. R., Frenk, C. S., Eke, V. R., et al. 2014, MNRAS, 439, 300, doi: 10.1093/mnras/stt2431
- Lovell et al. (2016) Lovell, M. R., Bose, S., Boyarsky, A., et al. 2016, Mon. Not. Roy. Astron. Soc., 461, 60, doi: 10.1093/mnras/stw1317
- Ludlow et al. (2016) Ludlow, A. D., Bose, S., Angulo, R. E., et al. 2016, MNRAS, 460, 1214, doi: 10.1093/mnras/stw1046
- Manwadkar & Kravtsov (2022) Manwadkar, V., & Kravtsov, A. V. 2022, MNRAS, 516, 3944, doi: 10.1093/mnras/stac2452
- Mao et al. (2015) Mao, Y.-Y., Williamson, M., & Wechsler, R. H. 2015, ApJ, 810, 21, doi: 10.1088/0004-637X/810/1/21
- Mau et al. (2020) Mau, S., Cerny, W., Pace, A. B., et al. 2020, ApJ, 890, 136, doi: 10.3847/1538-4357/ab6c67
- McKinney (2010) McKinney, W. 2010, in Proceedings of the 9th Python in Science Conference, ed. Stéfan van der Walt & Jarrod Millman, 56 – 61, doi: 10.25080/Majora-92bf1922-00a
- Nadler et al. (2021a) Nadler, E. O., Birrer, S., Gilman, D., et al. 2021a, ApJ, 917, 7, doi: 10.3847/1538-4357/abf9a3
- Nadler et al. (2019a) Nadler, E. O., Gluscevic, V., Boddy, K. K., & Wechsler, R. H. 2019a, ApJ, 878, L32, doi: 10.3847/2041-8213/ab1eb2
- Nadler et al. (2024) Nadler, E. O., Gluscevic, V., Driskell, T., et al. 2024, ApJ, 967, 61, doi: 10.3847/1538-4357/ad3bb1
- Nadler et al. (2019b) Nadler, E. O., Mao, Y.-Y., Green, G. M., & Wechsler, R. H. 2019b, ApJ, 873, 34, doi: 10.3847/1538-4357/ab040e
- Nadler et al. (2018) Nadler, E. O., Mao, Y.-Y., Wechsler, R. H., Garrison-Kimmel, S., & Wetzel, A. 2018, ApJ, 859, 129, doi: 10.3847/1538-4357/aac266
- Nadler et al. (2020) Nadler, E. O., Wechsler, R. H., Bechtol, K., et al. 2020, ApJ, 893, 48, doi: 10.3847/1538-4357/ab846a
- Nadler et al. (2021b) Nadler, E. O., Drlica-Wagner, A., Bechtol, K., et al. 2021b, Phys. Rev. Lett., 126, 091101, doi: 10.1103/PhysRevLett.126.091101
- Nadler et al. (2023) Nadler, E. O., Mansfield, P., Wang, Y., et al. 2023, ApJ, 945, 159, doi: 10.3847/1538-4357/acb68c
- Newton et al. (2018) Newton, O., Cautun, M., Jenkins, A., Frenk, C. S., & Helly, J. C. 2018, MNRAS, 479, 2853, doi: 10.1093/mnras/sty1085
- Newton et al. (2024) Newton, O., Lovell, M. R., Frenk, C. S., et al. 2024, arXiv e-prints, arXiv:2408.16042, doi: 10.48550/arXiv.2408.16042
- Newton et al. (2021) Newton, O., Leo, M., Cautun, M., et al. 2021, JCAP, 08, 062, doi: 10.1088/1475-7516/2021/08/062
- Oliphant (2015) Oliphant, T. E. 2015, Guide to NumPy, 2nd edn. (USA: CreateSpace Independent Publishing Platform)
- Parimbelli et al. (2021) Parimbelli, G., Scelfo, G., Giri, S. K., et al. 2021, J. Cosmology Astropart. Phys, 2021, 044, doi: 10.1088/1475-7516/2021/12/044
- Peñarrubia et al. (2016) Peñarrubia, J., Ludlow, A. D., Chanamé, J., & Walker, M. G. 2016, MNRAS, 461, L72, doi: 10.1093/mnrasl/slw090
- Peebles (1982) Peebles, P. J. E. 1982, ApJ, 263, L1, doi: 10.1086/183911
- Rocha et al. (2013) Rocha, M., Peter, A. H. G., Bullock, J. S., et al. 2013, MNRAS, 430, 81, doi: 10.1093/mnras/sts514
- Schneider (2018) Schneider, A. 2018, Phys. Rev. D, 98, 063021, doi: 10.1103/PhysRevD.98.063021
- Serpico & Raffelt (2005) Serpico, P. D., & Raffelt, G. G. 2005, Phys. Rev. D, 71, 127301, doi: 10.1103/PhysRevD.71.127301
- Shi & Fuller (1999) Shi, X., & Fuller, G. M. 1999, Phys. Rev. Lett., 82, 2832, doi: 10.1103/PhysRevLett.82.2832
- Simon (2019) Simon, J. D. 2019, ARA&A, 57, 375, doi: 10.1146/annurev-astro-091918-104453
- Slatyer (2017) Slatyer, T. R. 2017, arXiv e-prints, arXiv:1710.05137, doi: 10.48550/arXiv.1710.05137
- Smith et al. (2023) Smith, S. E. T., Jensen, J., Roediger, J., et al. 2023, AJ, 166, 76, doi: 10.3847/1538-3881/acdd77
- Springel (2005) Springel, V. 2005, MNRAS, 364, 1105, doi: 10.1111/j.1365-2966.2005.09655.x
- Strigari (2018) Strigari, L. E. 2018, Reports on Progress in Physics, 81, 056901, doi: 10.1088/1361-6633/aaae16
- Tan et al. (2024) Tan, C. Y., Cerny, W., Drlica-Wagner, A., et al. 2024, arXiv e-prints, arXiv:2408.00865, doi: 10.48550/arXiv.2408.00865
- Venumadhav et al. (2016) Venumadhav, T., Cyr-Racine, F.-Y., Abazajian, K. N., & Hirata, C. M. 2016, Phys. Rev. D, 94, 043515, doi: 10.1103/PhysRevD.94.043515
- Viel et al. (2013) Viel, M., Becker, G. D., Bolton, J. S., & Haehnelt, M. G. 2013, Phys. Rev. D, 88, 043502, doi: 10.1103/PhysRevD.88.043502
- Vogel & Abazajian (2023) Vogel, C. M., & Abazajian, K. N. 2023, Phys. Rev. D, 108, 043520, doi: 10.1103/PhysRevD.108.043520
- Zelko et al. (2022) Zelko, I. A., Treu, T., Abazajian, K. N., et al. 2022, Phys. Rev. Lett., 129, 191301, doi: 10.1103/PhysRevLett.129.191301