Gravitational Wave Forecasts Constrained by JWST AGN Observations for
Early Massive Black Hole Mergers
Abstract
Massive black holes (BHs) grow by gas accretion and mergers, observable through electromagnetic and gravitational wave (GW) emission. The James Webb Space Telescope (JWST) has detected faint active galactic nuclei (AGNs) powered by accreting BHs with masses of , revealing a previously unknown, abundant population of BHs. This mass range overlaps with the detection scopes of space-based GW interferometers and approaches the upper bounds of the predicted mass of seed BHs. We model BH mass assembly in light of the new JWST findings to investigate their formation channels and predict merger events. Two types of seed BHs are considered: heavy seeds () formed in rare and overdense cosmic regions, and light seeds () formed as stellar remnants in less massive dark-matter halos. The BHs grow through episodic accretion and merger events, which we model by fitting the AGN luminosity function to observational data including JWST-identified AGNs at . We find that heavy seeds alone struggle to explain quasars and faint JWST-selected AGNs simultaneously, requiring the more abundant light seeds. The observed merger rate of BHs from heavy seeds alone is limited to for major mergers at . However, the presence of light seeds increases the major merger rate by several orders of magnitude, which peaks at a total BH mass of over at a rate of . These events are detectable by future GW observatories such as the Laser Interferometer Space Antenna (LISA) and the pathfinder to DECi-hertz Interferometer Gravitational-wave Observatory (B-DECIGO). Precise sky localization and distance measurement of those GW events, with solid angle and luminosity distance uncertainties , will enable electromagnetic identification of mergers at and subsequent multi-messenger follow-up observations.
I Introduction
Gravitational wave (GW) observations have ushered in a new era for characterizing the cosmic black hole (BH) population. Ground-based observatories, sensitive to GW frequencies of Hz, now routinely detect mergers involving stellar-mass BHs (mass –, [1], and references therein). Pulsar Timing Array (PTA) experiments present evidence for a stochastic GW background in the nano-Hz (nHz) band, which is ascribed to extremely massive BHs (, [2, 3, 4, 5]).
Space-based GW interferometers planned in the next decade, e.g., the Laser Interferometer Space Antenna (LISA, [6, 7]), the pathfinder to DECi-hertz Interferometer Gravitational-wave Observatory (B-DECIGO, [8]), TianQin [9], and Taiji [10], will probe GWs in the milli-Hz to deci-Hz (mHz–dHz) bands with advanced sensibilities, characterizing BHs in the intermediate mass range () at redshifts up to . This will chart the mass assembly history of supermassive BHs hosted by massive galaxies in the local universe. Born as seeds in the mass range at high redshift (see Ref. [11] for a review), these BHs are believed to gain mass over cosmic time by accreting surrounding gas and by merging with other BHs [12, 13].
This evolutionary history is currently probed by electromagnetic (EM) observations when massive BHs (MBHs) rapidly accrete gas and appear as active galactic nuclei (AGN). Thus far, wide-field quasar surveys have identified BHs with masses at redshifts (e.g., [14, 15, 16, 17, 18]). Recently, the James Webb Space Telescope (JWST) has been unveiling faint AGNs at –7 with abundances one to two orders of magnitude higher than extrapolations of ground-based quasar luminosity functions (LFs; [19, 20, 21, 22, 23]). These faint AGNs likely indicate MBHs with less extreme masses, and, together with the quasars, provide increasingly representative statistics to constrain MBH growth models.
Current EM observations of MBHs have yet to extend significantly beyond , the epoch when MBHs were seeded and initiated their early growth. Extensive theoretical research has discussed two MBH formation channels. “Light-seed” BHs are expected to form abundantly as remnants of the first generation of stars (Population III, hereafter Pop III). These Pop III stars are conceived in small dark-matter halos at [24, 25], with typical stellar masses up to in simulations [26, 27, 28, 29]. MBHs seeded from the Pop III stars likely encounter unfavorable conditions for rapid mass assembly [30, 31, 32, 33, 34] and have difficulty explaining the brightest quasars at [35, 36], although their contribution to the less extreme population remains poorly understood.
On the other hand, in the “heavy-seed” scenario, a massive gas cloud directly collapses into a seed BH of mass [37, 38, 39]. Peculiar environmental effects are required to keep the cloud from vigorous fragmentation [40, 41, 42, 43, 44], and these conditions are considered to be too stringent to be commonly realized in typical regions of the high-redshift universe. Recent studies found that progenitors of high-redshift quasar host halos, i.e., rare, overdense cosmic regions, fulfill the physical conditions to form heavy-seed BHs at due to dark-matter halo clustering [45, 46]. Subsequent mass growth of these BHs explains the quasar LFs [47, 48, 49, 50].
Connecting seeding models with high-redshift AGN data represents a crucial discovery space for future GW observations and is the focus of this paper. In this work, we extend the model developed by Ref. [47], which outlined the episodic accretion history of MBHs from initial seeding through emergence as high-redshift quasars. We incorporate mergers into this framework to predict GW events. Moreover, new JWST data extends constraints on the faint end of the LF, enabling us to examine the necessity of light-seed BHs and thus explore the BH mergers within this previously hidden population. We predict that mergers involving heavy seeds alone will be very infrequent (with a fiducial major merger rate in the observer’s frame), while light-seed BH mergers are expected to occur at significantly higher rates of . LISA is anticipated to detect more than half of these events, whereas B-DECIGO will capture almost all due to its sensitivity to higher frequencies. These observations will offer new insights into the early assembly of MBHs.
This paper is organized as follows. In Section II, we describe our methods of MBH seeding, accretion, mergers, data-fitting, and GW event rate prediction. We find in Section III that the heavy-seed population alone has difficulty explaining the JWST AGNs and implies infrequent GW events. In Section IV, we demonstrate that the combined heavy- and light-seed populations account for the unobscured AGN LF and produce plentiful GW events. We discuss in Section V model extensions related to the time needed before the BHs may merge, the afterglows of GW events, and the MBH mass density evolution. We also compare our model to previous works. We summarize our findings in Section VI. Our predicted unobscured AGN LF, BHMF, and the merger rate distribution are publicly available on GitHub111https://github.com/hanpu-liu/BHMF_AGNLF_data. Throughout this work, we adopt the Planck Collaboration et al. [51] cosmological parameters, i.e., = 0.307, = 0.693, = 0.0486, and . All densities in this work are based on the comoving volume. All magnitudes in this work are in the AB system.
II Method
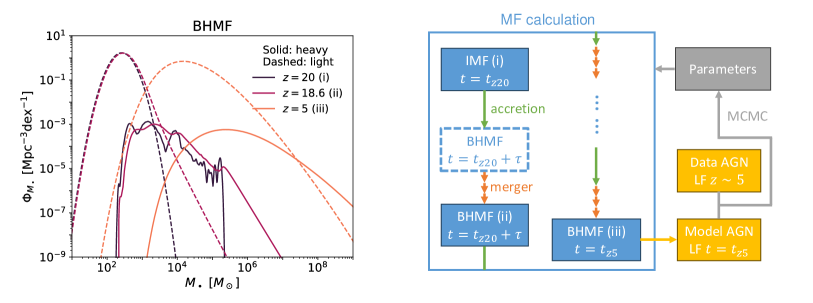
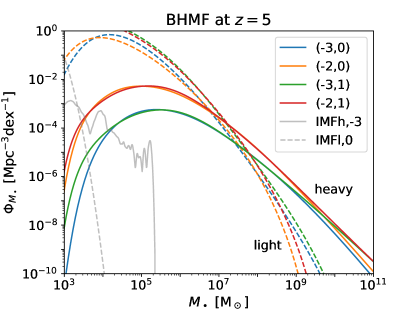
Figure 1 provides an overview of our method. We calculate the BH number distribution per unit comoving volume per logarithmic mass, known as the black hole mass function (BHMF). At birth, the heavy- and light-seed BHs are introduced (Section II.1), which then evolve via accretion (Section II.2) and mergers (Section II.3) in multiple time steps. The BHMF at is converted to the unobscured AGN LF and fit to observational data (Section II.4). The calculation is repeated in the Markov chain Monte Carlo (MCMC) method to sample the parameter space. The best-fit parameter set and the corresponding evolutionary history imply the properties of merger events to be detected by GW observatories (Section II.5). The cosmic time and corresponds to and .
II.1 The birth of MBHs: heavy and light seeds
In the framework of structure formation, primordial density fluctuations give rise to dark-matter halos, whose potential wells accumulate baryons that later build galaxies and MBHs. In highly biased, overdense regions at –20, heavy-seed BHs form in the main progenitors of quasar host galaxies via the collapse of massive baryonic clouds. The cloud is kept warm by \ceH2-dissociating radiation, successive dark-matter halo mergers, and baryonic streaming motion until the gas mass accumulated in the halo substantially exceeds the Jeans mass of the warm gas. Since the gas remains nearly isothermal via atomic cooling, the gas cloud undergoes collapse without efficient fragmentation and eventually leaves a heavy-seed BH (see [11] for a review). Based on this, Ref. [47] modeled the initial mass function (IMF) of heavy-seed BHs with a number density and a mass range , as shown in Figure 1. We note that this IMF continuously spans the mass range from heavy-seed to light-seed BHs, reflecting the diversity of the progenitor halo properties in overdense environments, distinct from scenarios that assume a bimodal distribution (e.g., Pop III remnants vs. direct-collapse BHs) or focus exclusively on one seed population. The vast majority of these BHs have already formed by , which when evolved to explain the quasar LF from ground-based surveys. We use the same seeding process in this work except that we treat , the number density of heavy-seed BHs at , as a variable parameter.
In contrast, in commoner minihalos in the early universe, efficient cooling of molecular hydrogen leads to cloud fragmentation and the formation of the first generation of protostars [25]. In a million-year timescale, these Pop III stars will likely evolve into BHs of several tens or hundreds of solar masses [52]. These light-seed BHs, formed prior to heavy-seed BHs, may also contribute to the AGN population. However, their accretion will be severely limited by the gas evacuating from the shallow gravitational potential well, until the host halo becomes sufficiently massive to gravitationally bound the gas heated by BH feedback [33, 53, 34]. Mergers present an alternative mass assembly channel, but GW recoils eject the merging BHs at velocities (, depending on the mass ratio and spin configuration) typically exceeding the escape velocity of minihalos (). This likely isolates the descendent BH from the gas or other BHs in halos and suppresses its subsequent growth [54]. Therefore, even though Pop III stars may be ubiquitous in minihaloes, rapid growth of their descendent BHs is feasible only in massive halos with a virial temperature of , which provide a dense gas reservoir [35, 55] and sufficient gravitational binding to prevent the gas or the BH itself from escaping.
In this work, we adopt the number density of such atomically-cooling halos with as an upper bound of the number density of light-seed BHs. In the redshift range of initial BH growth, , the number density is calculated as [56], and thus we consider two cases with and . These values are substantially lower than those estimated in previous studies that focused on the bulk population of Pop III stars in more abundant minihalos and aimed to explain stellar-mass binary BH formation or chemical enrichment (e.g., in Ref. [57]; see also [58, 59]). We insert light-seed BHs in a single event at and assume that massive Pop III stars hardly form later due to the rise of H2-dissociating far-ultraviolet radiation emitted from nearby galaxies [60, 61, 62]. We adopt a log-normal BHMF centered on with a log-space standard deviation of 0.235, as shown in Figure 1. These parameters are determined by fitting the Pop III IMF derived from Ref. [63]. We neglect mass loss during stellar evolution and pair-instability supernovae given the uncertainties in the number density and IMF of Pop III stars (see Ref. [64] for a review).
II.2 MBH episodic accretion from initial seeding to
We briefly describe the MBH evolution model due to episodic accretion, similar to that in Ref. [47]. Starting from initial seeding at , the BHMF is updated at each accretion episode with a timescale of yr. The accretion keeps the total comoving BH number density unchanged but modifies the abundance distribution.
A minimum number of parameters control accretion. The BH accretion rate is given by
| (1) |
where is the ratio of the bolometric luminosity of the accreting SMBH to its Eddington luminosity , and is the Eddington accretion rate assuming a radiative efficiency of ([65]; the efficiency is consistent with that from the Soltan argument, e.g., [66, 13]). The function
| (2) |
where we adopt [67] and , characterizes the positive mass-dependent radiative efficiency as found among AGN at [68, 69]. The growth of the most massive BHs is thereby suppressed, although this effect becomes negligible in the limit of , where and Equation (1) reduces to exponential growth with an -folding timescale of Myr.
Observation has constrained quasar activity to a cosmologically short lifetime ( yr, [70]), consistent with the theoretical picture that accretion bursts with strong gas inflow are limited by BH feedback [71, 72]. This suggests an episodic MBH growth history involving diverse Eddington ratio values. Here, we model the Eddington ratio distribution function (ERDF) as a Schechter function using two free parameters, and :
| (3) |
where the prefactor with the incomplete Gamma function normalizes the probability distribution. The profile fits well the ERDF of low- AGNs over [73]. Following Ref. [47], we adopt the minimum Eddington ratio suggested by X-ray AGN observations [74] and BH feedback models [75].
To model the episodic accretion activity, we introduce a time duration , during which the mass growth of an MBH is governed by Equation (1) with a fixed randomly assigned from Equation (3). The MBH in its entire evolutionary history undergoes many such episodes with different values of . Thus, the BHMF at a given time is updated to with
| (4) |
where is the Eddington ratio required for a BH with to grow up to in , implied by Equation (1). Integrating over on both sides of Equation (4), one finds that the total number densities are the same before and after the accretion.
We newly introduce the light-seed BH population compared to Ref. [47]. From now on, we distinguish the heavy- and light-seed quantities with the subscripts and (e.g., the total BHMF is decomposed as ). We assume the same episodic accretion behavior for heavy- and light-seed BHs except that the ERDF of the latter has a smaller characteristic Eddington ratio, i.e., , in line with the theoretical expectation of relatively slow accretion (see Section II.1). This formulation implies that the light-seed population only accounts for faint AGNs at high redshift, leaving the brighter quasars to the rare, heavy-seed BHs.
II.3 MBH mergers with the coagulation model
In contrast to accretion, mergers boost the average BH mass at the expense of the total number density. After accretion in each time step , reaching the intermediate state in the flowchart in Figure 1, we consider mergers by updating the BHMF in the same time step using the coagulation formalism.
The coagulation model describes the evolution of a population of objects undergoing mergers [76]. The theory applies to any physical system involving two-body interactions and has been extensively used in nuclear reactions, asteroids, aerosols, etc. The following assumptions are made. Firstly, the merging BHs are spatially homogeneous, i.e., the merging process is independent of location. Secondly, each merger is a two-body process, whose merger rate is proportional to the product of the abundance of each component. Mergers involving three or more BHs are naively rarer as the merger rate will scale to higher orders of the abundance, but may become a significant orbital decay mechanism for MBH binaries that otherwise do not merge efficiently within a Hubble time (e.g., [77, 78, 79]). Thirdly, individual merger events obey mass conservation, i.e., the merger remnant mass equals the sum of the progenitor masses. We thus ignore mass loss due to GW radiation during mergers. Post-Newtonian calculations indicate that the mass loss relative to the total progenitor mass is for major mergers (mergers involving progenitors of similar masses), depending on the mass ratio and spin (see Equations 4 and 5 in Ref. [80]). Therefore, the coagulation formalism will not significantly overestimate the total mass density unless each MBH on average experiences on the order of 10 major mergers in its evolutionary history, an order of magnitude larger than empirical predictions of galaxy major mergers [81].
Given the above assumptions, the BHMF evolution due to mergers is governed by
| (5a) | ||||
| (5b) | ||||
where
| (6) |
For a particular infinitesimal (logarithmic) mass bin centered on , the first term on the right-hand side of Equation (5) describes the abundance loss as BHs in the bin participate in mergers, whereas the second term denotes the abundance gain as smaller BHs merge to produce remnants of mass . As we consider two MBH populations, three types of mergers may arise, i.e., heavy-heavy (), heavy-light (), and light-light (). We assume the remnant BH belongs to the heavy-seed category if one or two merger progenitors originate from heavy seeds while the merger between light-seed BHs produces a light-seed one. This formulation conserves the BH total mass density defined by
| (7) |
and thus changes with only due to accretion.
The coagulation kernel characterizes the merger rate per unit volume per unit number density of the two progenitors. Simple models suggest that the kernel likely increases with mass (Appendix A). We use the sum kernel to capture the positive mass dependence:
| (8) |
This kernel form is mathematically well-understood, with available series solutions in general and closed-form ones for some specific initial distribution (e.g., [82]). To connect with other theoretical works, we note that the specific BH major merger rate (with dimensions of inverse time) is approximately given by . The local galaxy stellar mass function is a weakly decreasing function proportional to for ( in Ref. [83]). Thus, the sum kernel predicts that the specific galaxy major merger rate in this mass range scales as , which is in approximate agreement with semi-empirical, simulation-based, and semi-analytical studies ([84, 85, 81, 86], although the rates for suggest a stronger-than-linear -dependence for the kernel). We assume the same kernel for all three types of mergers.
With the sum kernel, integration of Equation (5a) over mass gives the evolution of the heavy-seed BH number density:
| (9) |
where is the heavy-seed BH mass density defined analogously as in Equation (7). We rewrite Equation (9) as
| (10) |
where characterizes the BH number density decay; note that this timescale does not correspond to an individual merger process but rather represents a statistical property of the system. A short timescale indicates frequent mergers. We assume this parameter remains constant over time, leading to an exponential decay in the number density, as described by Equation (10). Over time, will increase due to accretion and heavy-light mergers, so a constant implies a reducing . This deceleration qualitatively agrees with the behavior of dark-matter halo mergers [87]. As for the number density of the light-seed BHs, we similarly integrate Equation (5b) to obtain
| (11) |
The light-seed BH number density thus decays faster than the heavy-seed counterpart.
II.4 MCMC-fitting to observed LF at
| Symbol | ||||||||
|---|---|---|---|---|---|---|---|---|
| Unit | Myr | Myr | - | - | - | - | ||
| Definition | Sect. II.1 | Sect. II.1 | Eq. (10) | Sect. II.2 | Eq. (2) | Eq. (3) | Sect. II.2 | Eq. (3) |
| Vary in MCMC? | ||||||||
| – heavy-only | N/A | ✓ | ✓ | ✓ | N/A | ✓ | ||
| – heavy+light | ✓ | ✓ | ✓ | ✓ | ✓ | ✓ |
The free parameters in this work have been described in the above sections and are summarized in Table 1. For a given set of parameters, we evolve the BHMF from through combining the accretion and merger treatments. The cosmic time interval is split into durations of equal length (any remainder forms an additional duration). We first advance one accretion time step, updating the BHMF using the analytical formula in Equation (4). Then, to account for mergers, we split the same accretion time step into smaller steps and update the accreted BHMF using Equation (5). This is done numerically, with details described in Appendix B. The accretion–merger calculation is repeated for the next duration of until the terminal redshift.
Following Ref. [47], we convolve the model BHMF at with the ERDF in Equation (3) to obtain the intrinsic AGN bolometric LF, which is then converted to the unobscured LF in the rest-frame 1450 Å band:
| (12) |
where is the rest-frame ultraviolet (UV) absolute magnitude at 1450 Å and . The relation is calculated using a bolometric correction (read from Figure 12 in Ref. [88]), and the luminosity-dependent obscuration factor is adopted from X-ray AGN observations at ([67], their Equation 3).
To compare the model with data, we use the rest-UV-selected unobscured quasar LF from Ref. [15], which covers the Å absolute magnitudes mag based on the Sloan Digital Sky Survey and mag observed with the Subaru Hyper Suprime-Cam. Additionally, we incorporate unobscured AGN candidates selected with JWST photometry (J. Guo et al., in preparation), which cover the UV magnitudes mag. We note that the latter data set still awaits spectroscopic confirmation and gives an upper limit of the AGN abundance within the magnitude range. However, the abundance estimate agrees with those based on spectroscopically confirmed unobscured AGN samples [20, 22], though the statistics are limited. We exclude the data fainter than mag due to potential incompleteness.
In our first set of fittings with only heavy-seed BHs, we manually vary and to understand their effects on the model outputs and let MCMC explore the rest of the parameter space. In our second set of fittings including heavy- and light-seed BHs, and are controlled while and vary in the MCMC runs. We set up the same prior as in Ref. [47] for (our corresponds to in their work), and , and use a likelihood. Where needed, we use a log-uniform prior for , as shorter merger timescales produce an unrealistically small number of quasars while mergers become negligible for longer . We introduce a uniform prior for ; the light-seed BHs would have difficulty reproducing JWST AGNs if were too low. The parameter variation is summarized in Table 1.
We use the emcee MCMC Python package [89]. In each run, 128 walkers are sampled for 3000 steps. The posterior distribution is tested to converge using doubled step numbers.
II.5 Observed GW event rates from mergers
After the best-fit parameter values are determined, the merger process in the model implies a differential merger event rate in the observer’s frame, (), or the all-sky event number per unit observer’s year per unit logarithmic remnant BH mass per unit redshift. It is given by
| (13) |
where is the differential comoving volume.
According to Equations (9), (10), and (13), the observed heavy-heavy merger rate earlier than a given redshift only depends on and but not on the BHMF profiles of the two populations:
| (14) |
where and . In the limit of , the merger rate decreases as . On the other hand, the merger rate saturates in the limit of shorter merger timescales:
| (15) |
This sets an upper bound for the observed heavy-heavy merger event rate, which will be reached if the number density promptly vanishes, i.e., all BHs merge right after birth. Importantly, this bound applies to any merger model with a well-defined initial number density. The generality of this limit (e.g., its independence of the coagulation formalism and the exponential number density decay) is demonstrated in Appendix C. The total merger rate is also constrained by this limit, with replaced with and replaced with ; namely,
| (16) |
Further, we evaluate the detectability of merger events by comparing the signal spectrum and the detector noise curves. We generate GW waveforms using PhenomD [90, 91], a phenomenological model for spin-aligned binary BHs, and its Python implementation, BOWIE [92]. We assume for simplicity that all merging MBHs have no spin, so the observed GW will only depend on the remnant mass , the secondary-to-primary mass ratio , and redshift . On the detector side, we mainly consider the noise curves of LISA [93] and B-DECIGO [94]. We take a nominal signal-to-noise (SNR) threshold of , above which a given event is assumed to be detectable.
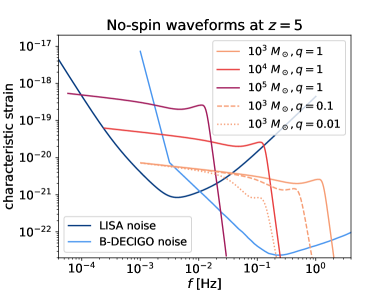
Figure 2 shows the strain amplitudes of merger events of different binary black hole chirp masses and mass ratios. GW waveforms are calculated from the inspiral phase one year before the merger through the ringdown phase (using a longer detected inspiral time would slightly extend the low-frequency end of the waveforms). The signal curves with are copies of one profile shifted to different frequencies and amplitudes. Different mass ratios with the same chirp mass have identical inspiral spectra, but the merger–ringdown amplitude is significantly suppressed for unequal-mass mergers. Therefore, major mergers are likely the most readily detected gravitational wave sources if other factors (e.g., event rates) are controlled.
Figure 2 also presents the noise curves of LISA and B-DECIGO222Ref. [94] presented the B-DECIGO noise curve for . We assume a pessimistic dimensionless noise amplitude for lower frequencies (cf. [92]).. The LISA devices will follow a heliocentric orbit while the B-DECIGO ones will circle the Earth with shorter interferometer arm lengths. As a result of the different designs, B-DECIGO has lower noises for (thus more suitable for relatively light MBHs), but LISA performs better at lower frequencies.
III Results: heavy-seed BHs
| (Mpc-3) | (Myr) | (Myr) | - | - | - | - | - |
|---|---|---|---|---|---|---|---|
| -3 | 3 | 28.1 | -1.474 | 0.324 | 0.623 | 0.230 | -293 |
| () | () | () | () | ||||
| -3 | 4 | 34.1 | -2.08 | 0.274 | 0.873 | 0.253 | -194 |
| () | () | () | () | ||||
| -3 | 5 | 34.1 | -2.09 | 0.274 | 0.880 | 0.255 | -184 |
| () | () | () | () | ||||
| -2 | 3 | 57.4 | -1.421 | 0.307 | 0.358 | 0.162 | -191 |
| () | () | () | () | ||||
| -2 | 4 | 57.6 | -1.76 | 0.279 | 0.533 | 0.182 | -123 |
| () | () | () | () | ||||
| -2 | 5 | 57.5 | -1.80 | 0.274 | 0.557 | 0.184 | -118 |
| () | () | () | () |
| (Mpc-3) | (Myr) | (Mpc-3) | ( Mpc-3) | (yr-1) | (yr-1) | (yr-1) |
|---|---|---|---|---|---|---|
| -3 | 3 | |||||
| -3 | 4 | |||||
| -3 | 5 | |||||
| -2 | 3 | |||||
| -2 | 4 | |||||
| -2 | 5 |
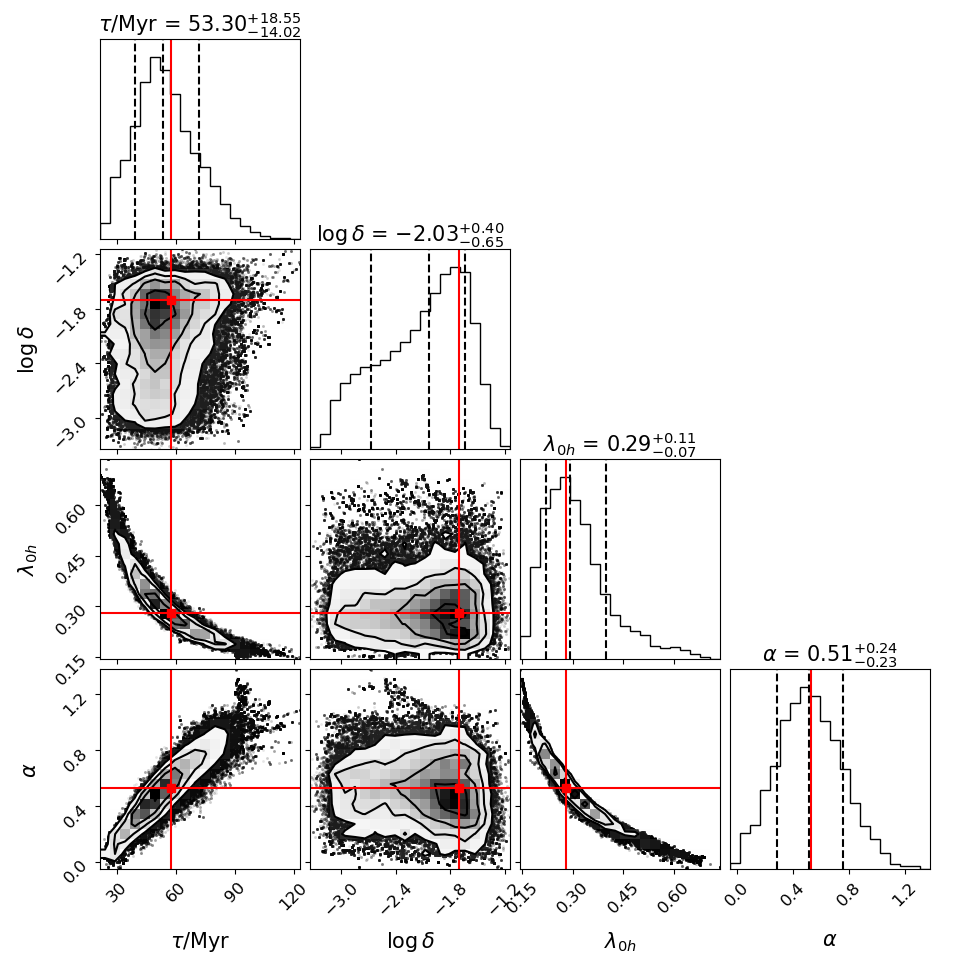
In the heavy-seed-only model, we perform six MCMC runs with different and values. The default in Ref. [47] is333The exact value is from the number density of dark-matter halos with masses at . ; we additionally explore ten times this value (i.e., ) to see if the heavy-seed BH population alone may explain the abundance of JWST AGNs. After some initial tests, we choose the values as , , and . The shortest is approximately equal to the total elapsed time of . The results for the six cases are listed in Table 2.
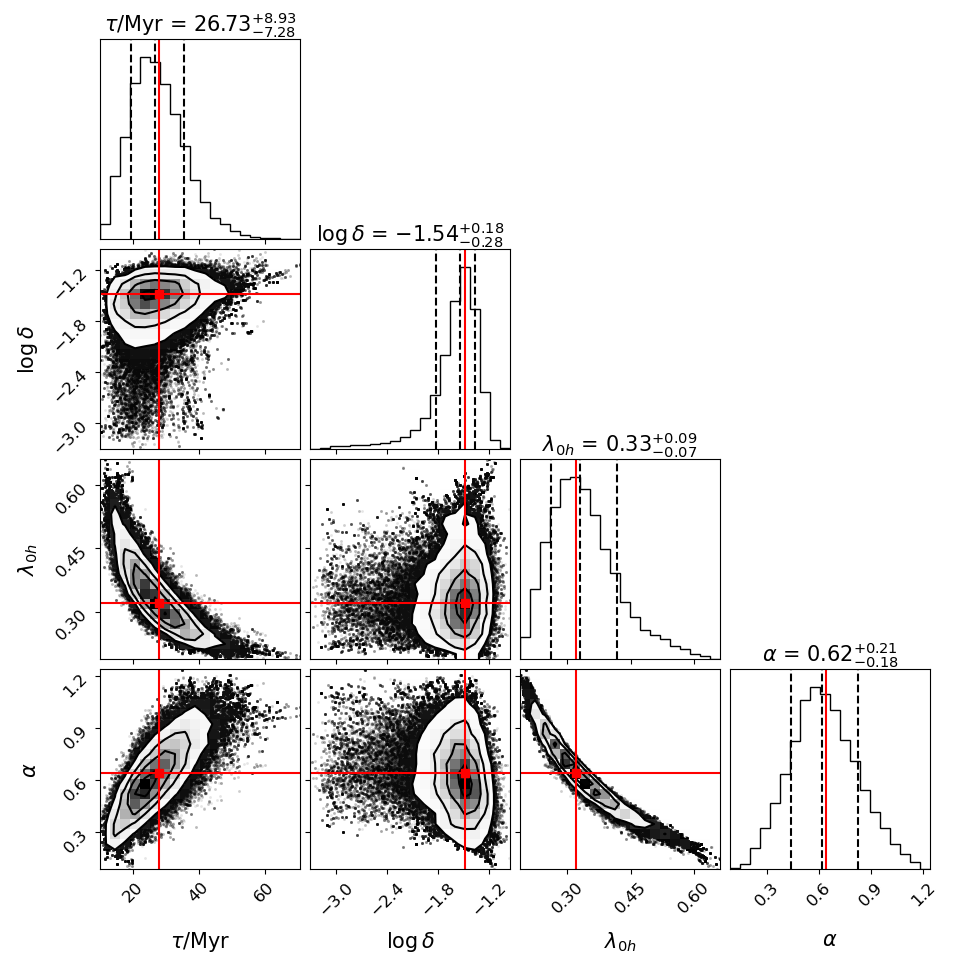
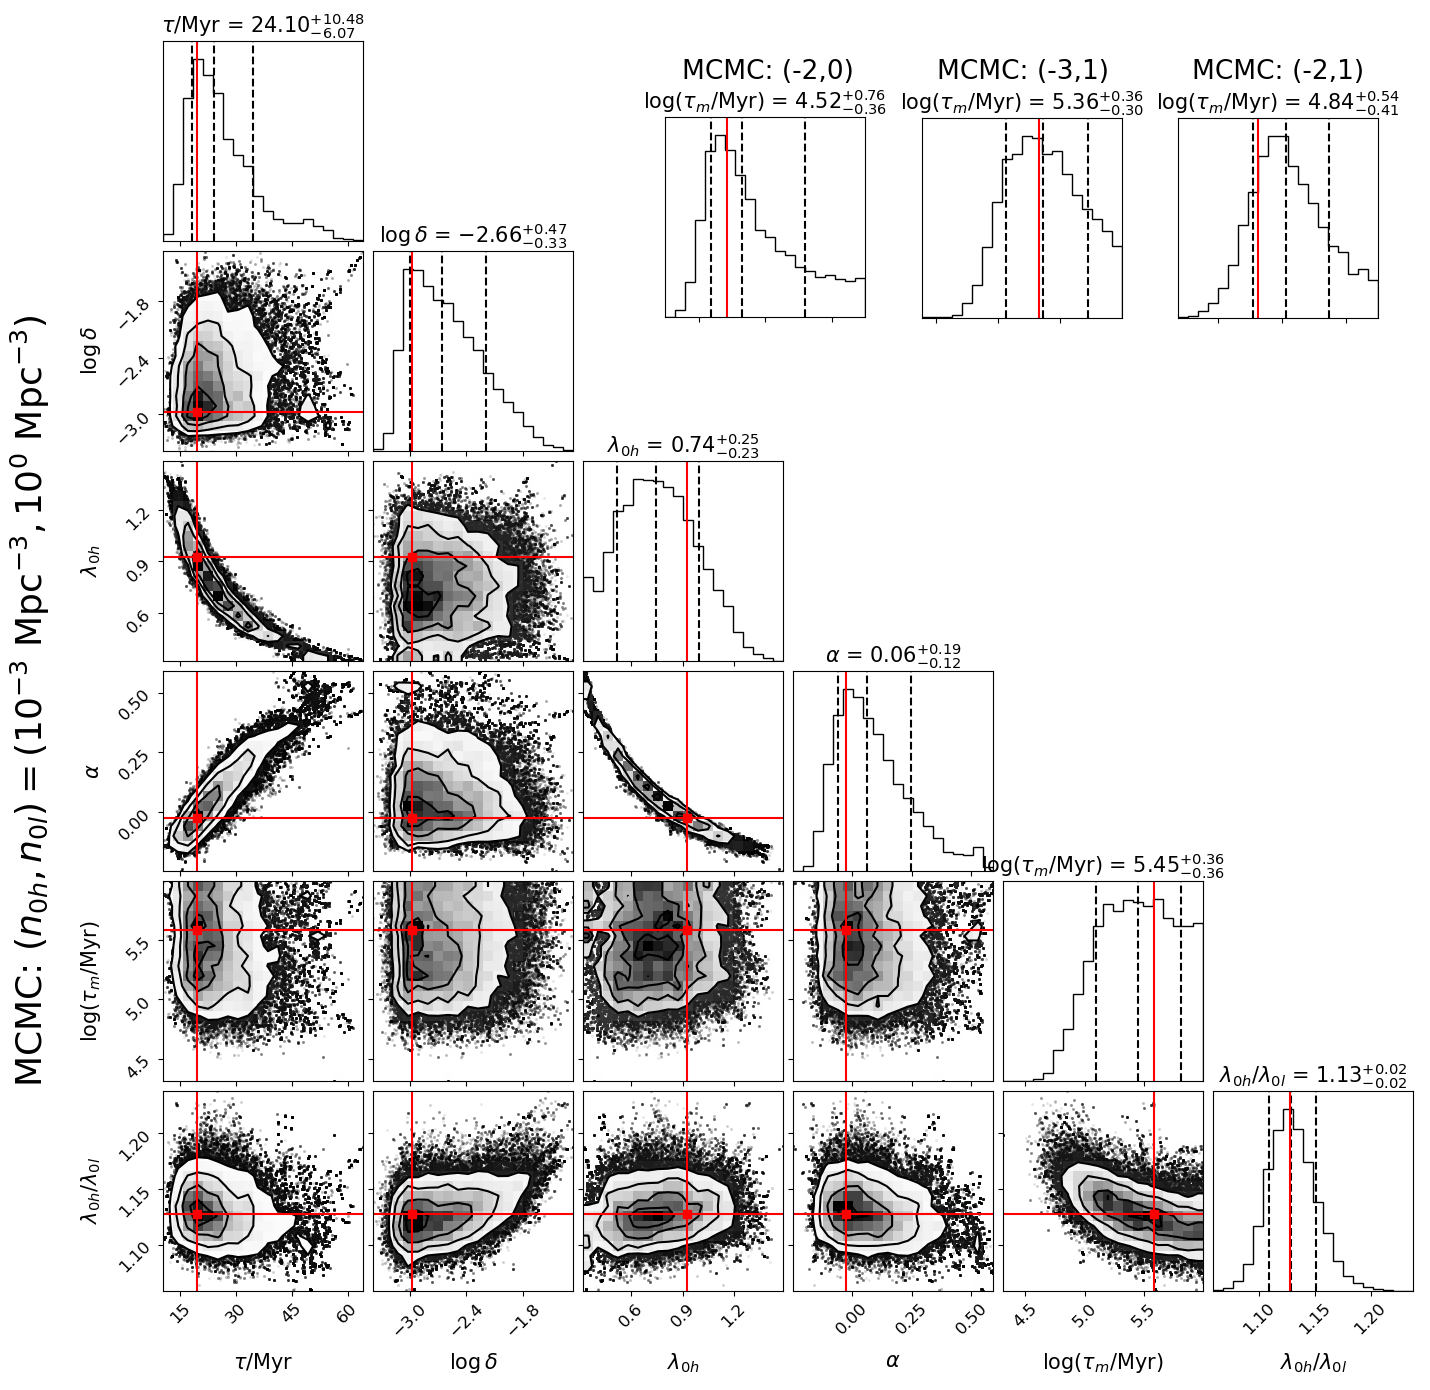
We first discuss the parameter posterior distribution in the run with and , visualized in the left panel in Figure 3. The histograms along the diagonal show that the parameters , , and are relatively tightly constrained. In contrast, the distribution of is wide and has a peak on the right of the median, indicating that suppression of high-mass BH growth is modestly favored. In the off-diagonal panels, one observes that and are positively correlated with each other and anti-correlated with . The anti-correlations, also present in Ref. [47], are likely because all the three parameters have similar effects of enhancing the abundance of the most luminous quasars. A long accretion timescale would enable sustained growth for MBHs with large Eddington ratios, thus boosting the high-mass end of the BHMF. A large characteristic Eddington ratio would increase the likelihood of rapid accretion. A large power-law index in the ERDF would increase the mean Eddington ratio. On the other hand, the – correlation was not obvious in Ref. [47] and might not have a straightforward interpretation. The posterior plots in a different run of and (right panel in Figure 3) are qualitatively similar except for a sharper distribution, which implies a stronger model preference to retard the growth of MBHs of mass .
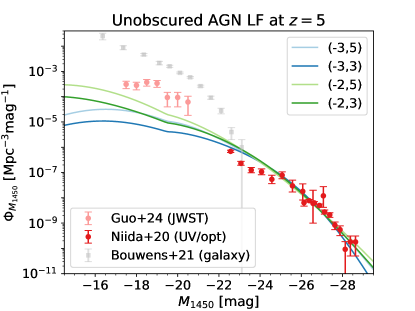
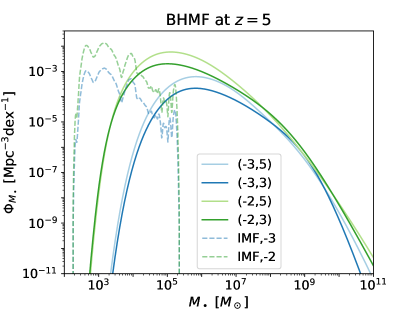
Table 2 reports the best-fit parameter values and the maximum posterior probability in each run, along with the posterior distributions characterized by the median values with upper and lower uncertainties. The mean Eddington ratios are also calculated using Equation (3) and the best-fit and values. Figures 4 and 5 present the corresponding best-fit unobscured AGN LF and the total (unobscured and obscured) BHMF. For clarity, these figures only present the curves with or ; the cases are very similar to the ones. The first four columns of Table 3 list the total number and mass density of the heavy-seed BHs, and . Note that is calibrated with analytical calculations (Equation 10; see also Appendix B) while is numerically measured from the BHMF.
The number density of seed BHs significantly influences the parameter distribution. While the best-fit accretion timescales are on the order of several , higher seed abundances result in longer accretion timescales. Additionally, an increase in the seed number density leads to decreased mean Eddington ratios to avoid overproducing the quasars. The additional BHs raise the faint end of the AGN LF, bringing it closer to the observed abundance and explaining why higher values of tend to yield higher posterior probabilities.
The case with and is similar to the model in Ref. [47]444Their model BHMF and LF are publicly available on GitHub: https://github.com/WenxiuLiii. Their study found larger best-fit and smaller , leading to a broader distribution in both the LF and BHMF. The difference arises from the fitting data adopted. This earlier work was calibrated to ground-based unobscured LF and observed BHMF at , where the bright-end () LF cutoff was loosely bound. Furthermore, the new JWST data requires abundant MBHs to have moderate luminosity. As a result, the LF in our work favors AGNs concentrated within the interval , with fewer brighter AGNs. The mean Eddington ratio we derive () is comparable to the one found in Ref. [47] ().
Back to this work, the influence of the merger timescale depends on its value. One may expect that mergers have negligible effects on the MBH evolutionary process once . Indeed, and do not strongly influence the total MBH number density and give similar posterior parameter distributions. Therefore, they may be regarded as convergent to an accretion-dominant scenario. On the other hand, in the case of , the significant number density reduction indicates that mergers are becoming important: the parameter distributions deviate from the accretion-dominant counterparts. In both cases of and , shorter merger timescales prefer stronger suppression of the growth of the heaviest MBHs (i.e., larger ) and more inactive MBHs (i.e., smaller ). The average Eddington ratio is reduced despite mildly larger . These illustrate the complementary role of accretion and mergers: the sum kernel of the merger process encourages rapid assembly of the most massive population, so accretion must be weakened to match observation.
The rarity of heavy seeds in our model has two implications. Firstly, even the best-fit LF curves fall short of the JWST AGN candidate abundance by a factor of several or more. This indicates that the heavy-seed population alone has difficulty explaining the data, and suggests that additional MBHs may contribute to the LF. Secondly, assuming that heavy-seed BHs account for the LF at , the fitting results impose strict limits on mergers. Table 3 lists the total observed event rates as well as the rates for mergers with and , respectively. We define as major mergers and as minor ones. The merger rates of heavy-heavy seed BHs, , agree well with the analytical predictions in Equation (14), which is times lower than the upper bound given in Equation (15) due to the large . Shorter would struggle even more to sustain a sufficient number density of AGNs at the faint end, which is why we exclude cases with from consideration. Importantly, models with the fiducial value of have ; even with the most optimistic parameter set ( and ), the major merger rates remain below . In summary, while heavy-seed BHs can reproduce quasars at , their rarity likely suggests an insufficient number density to explain fainter AGNs and a pessimistic merger rate for future GW observation.
IV Results: heavy- and light-seed BHs
IV.1 AGN LF and BHMF
| (Mpc-3) | (Mpc-3) | (Myr) | - | - | - | (Myr) | - | - | - |
|---|---|---|---|---|---|---|---|---|---|
| -3 | 0 | 19.5 | -2.98 | 0.926 | -0.027 | 5.59 | 1.1278 | 0.220 | -50.1 |
| () | () | () | () | () | () | ||||
| -2 | 0 | 36.8 | -2.76 | 0.566 | 0.037 | 4.34 | 1.0002 | 0.170 | -67.3 |
| () | () | () | () | () | () | ||||
| -3 | 1 | 35.4 | -2.39 | 0.774 | -0.058 | 5.329 | 1.404 | 0.182 | -46.9 |
| () | () | () | () | () | () | ||||
| -2 | 1 | 44.1 | -2.99 | 0.609 | -0.085 | 4.50 | 1.165 | 0.147 | -57.2 |
| () | () | () | () | () | () |
| (Mpc-3) | (Mpc-3) | ( Mpc-3) | (yr-1) | (yr-1) | (yr-1) | |||
|---|---|---|---|---|---|---|---|---|
| -3 | 0 | 0.913 | ||||||
| -2 | 0 | 0.757 | ||||||
| -3 | 1 | 4.27 | ||||||
| -2 | 1 | 4.17 | ||||||
In this section, we consider heavy-and-light-seed models. We perform four MCMC runs with different and values. In contrast to the previous section, we let MCMC find the best-fit . The setup and outputs are summarized in Table 4.
Figure 6 presents the posterior distribution of our fiducial case with and . The first four parameters are similarly distributed as those in the heavy-seed-only model in Section III except that a smaller (i.e., approximately exponential growth) is now preferred. The merger timescale distribution here forms a broad peak at and quickly declines at , disfavoring more frequent mergers. A mild decreasing trend on the right of the peak extends to the prior upper bound, , so fewer mergers than the best fit may adequately explain the data. The ratio forms a sharp peak at . Thus, light- and heavy-seed BHs accrete with comparable typical rates (the latter are faster); even a slight deviation in significantly modifies the prediction because the difference is exponentially enlarged during the BH mass growth. The off-diagonal panels suggest that is weakly but positively correlated with , and negatively with . Increasing the value of implies that on average, less massive BHs accrete faster than their heavier counterparts at the same Eddington ratio, while decreasing the value of leads to rapid light-seed BH mergers (the heavy-seed BHs are not significantly influenced until ). Both have similar effects as increasing relative to on the mass assembly of the light-seed BHs.
The posterior profiles and correlation in other runs generally resemble the fiducial case. However, their distribution functions of decline faster on the right of the peak and thus indicate a tighter constraint on the merger rate, as shown on the top-right panels in Figure 6. Additionally, in the run with and , the best-fit almost reaches the lower bound of the prior, suggesting that allowing faster light-seed BH accretion in this case may better fit the observed AGN LF.
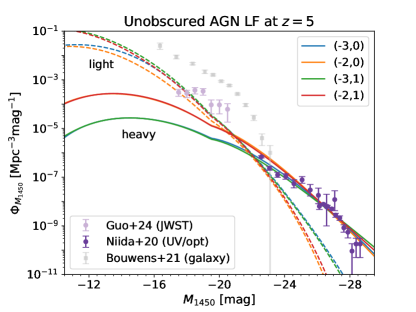
Tables 4 and 5 show the MCMC outputs and BHMF properties of the four runs. The unobscured AGN LF and the total BHMF are visualized in Figures 7 and 8. The substantially higher posterior probability indicates that introducing the light-seed population improves the fit. Indeed, the light-seed model LF curves reach abundances comparable to the JWST unobscured AGN candidates. Notably, in all four runs, the bright end of the LF, i.e., , mainly comprises the heavy-seed population, whereas the light-seed population dominates the LF for . The two types of MBHs explain the ground- and space-based AGNs respectively, in agreement with the conclusion in the previous section.
How the best-fit values depend on the number density is similar to the previous section: higher or increases and decreases . The newly introduced parameter appears positively correlated with . As a qualitative understanding, increasing the seed abundance shifts the model AGN LF upward, which must thus retreat leftward to meet data. This trend applies to both heavy- and light-seed BHs, whose bright-end LF slopes are mainly anchored by the quasar and JWST AGN data respectively.
Runs with different parameters yield converging heavy-seed LFs at mag and light-seed LFs at mag. In the magnitude range , the model unobscured AGN LF is lower than the observed galaxy LF [95] by a factor of 10–50, the difference shrinking toward the fainter end. Further, all model light-seed LFs still rise at until fainter than . Future deep AGN surveys will directly test our predictions. If the observed AGN LF starts to turn downward at , then either substantially fewer light seeds than assumed actually become AGNs, or mergers between light BHs are more common, reducing the number density at the fainter end without overgrowing the most massive population.
While the AGN LF requires the light-seed BHs, the abundance of this population brings a large mass density: in all four runs, . This poses a potential tension with observation constraining the mass density budget of X-ray-selected AGNs. We will further discuss this issue in Section V.4.
IV.2 Observed merger event rates
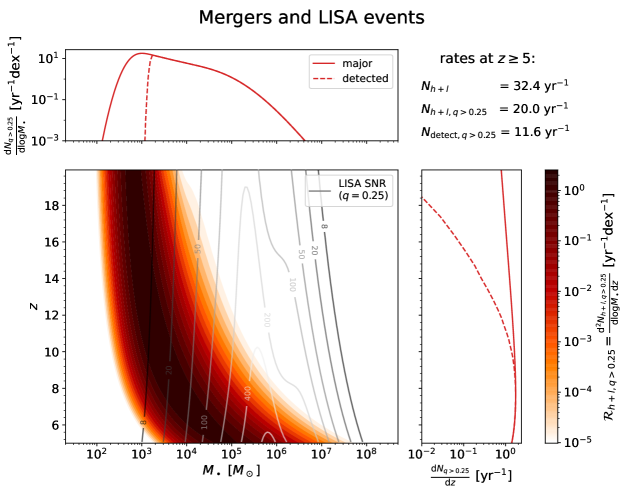
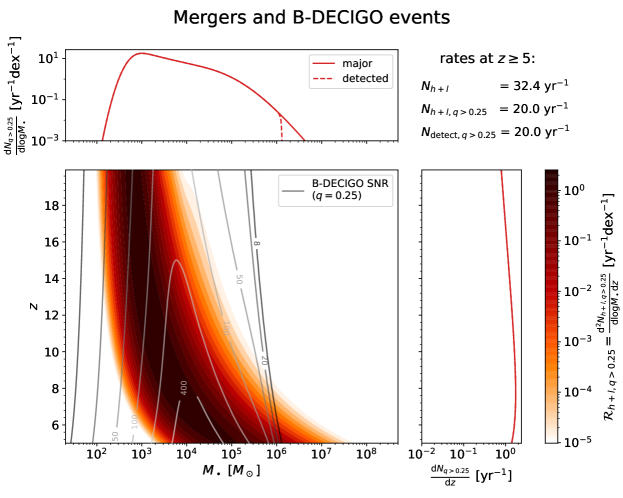
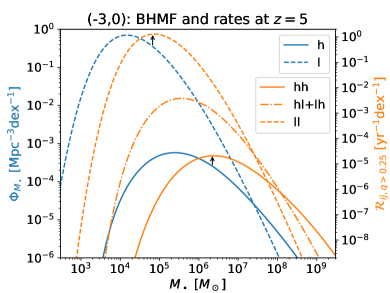
Table 5 summarizes the number densities and merger rates of the two BH populations. The total and major merger rates for heavy-heavy, heavy-light, and light-light mergers satisfy . This is expected from our sum-kernel formalism, which suggests at a given time in a given parameter set. The major merger rate accounts for a significant proportion in and , but because heavy- and light-seed BHs are likely to have very different masses. The fact that the abundant light-seed BHs more readily undergo mergers also leads to a faster reduction in compared to . Since the best-fit merger timescales exceed the elapsed cosmic time, the heavy-seed BH number density (still calibrated with Equation 10) undergoes negligible changes.
The evolution of is independent of the light-seed population, which is not the case vice versa. Equation (11) implies that, if (valid in all four runs), increasing will slow down the decay in . This explains the fact that the runs with have shorter than , but and remain comparable for a fixed . Since all types of mergers obey the same coagulation kernel proportional to , a higher with a lower may give similar merger histories and number reduction of light-seed BHs.
Frequent merger rates enable statistical studies. In Figure 9, we show the major merger rate distribution in the fiducial run and as a function of the remnant BH mass and redshift down to . Overall, the distribution tracks the MBH mass assembly process, the most frequent events occurring from at through at . The maximum merger event rate density lies at at . Similarly, in the top-left panel, the most frequent mergers correspond to remnant BH masses of . The major merger rate vs. mass distribution then follows a power law of until breaking at the point . In the bottom-right panel, the redshift evolution of the merger rate forms a moderate peak at due to the combined effect of the nonlinear redshift-time correspondence ( decreases with ) and the MBH number density reduction.
Overplotted in the main panel in Figure 9 are the constant SNR contours observed with LISA, evaluated from merger waveforms and the LISA noise curves. The four-year galactic foreground noise [93] is considered in the calculation. For simplicity, only major mergers with are assumed to be detectable. In the visualized case, LISA can identify more than half of the major mergers at , but the SNR threshold lies close to the location of the maximum merger rate density discussed above. Mergers of at will be missed, which requires observatories sensitive to higher frequencies.
In Figure 10, we repeat the calculation with the noise curve of B-DECIGO. This observatory will focus on the dHz band and thus cover a lighter mass range than LISA. Almost all the predicted major mergers fall within , allowing for a full characterization of early MBH mergers.
IV.3 Comparing BHMF with merger rates
Given sufficient merger events, one may hope to extract demographic information from the merger rates, e.g., finding the most abundant BH mass. Our formulation predicts that the peak of the BHMF is likely lighter than the mass producing the most frequent mergers since the coagulation kernel is positively correlated with mass.
Figure 11 illustrates this with the run and . At , the light-seed BHMF peaks at , whereas the light-light major merger rate peaks at . Similarly, the most abundant heavy-seed BHs weigh , compared to for the heavy-heavy major merger rate.
One may understand this difference analytically. The merger rate per unit logarithmic mass and unit redshift, , is proportional to (Equation (13)). In Equation (6), we now insert a delta-function into the integral to account for equal-mass mergers only, and thus (the sum kernel contributes to a factor of ). Therefore, the mass giving approximately matches the maximum of . The black arrows in Figure 11 point from such locations vertically, and indeed, the arrow heads are close to the peaks of .
In the above example, the most abundant mass of the BHMF and the merger rate differ by a factor of 5 (10) for light- (heavy-) seed BHs. In general, as long as the coagulation kernel is positively correlated with the BH mass, the difference is at least a factor of 2. Because mergers preferentially occur between high-mass BHs, the GW event demographics are biased toward the massive end and require careful statistical consideration to infer the underlying BHMF.
V Discussion
V.1 Delayed mergers
Thus far, our analysis assumes a constant to characterize the number density reduction of MBHs. However, constraints from AGN LFs do not rule out the possibility that two BHs orbiting each other could mimic a single BH powering an AGN (due to the lack of spatial resolution to separate a dual AGN and periodic signatures indicative of a binary BH system). Their orbital decay may be delayed before reaching the final merger stage, which our model using an average constant does not account for. The delay of BH mergers is influenced by various environmental factors within the galactic nucleus, introducing significant uncertainty in theoretical models of GW event rates [7]. Optimistic estimates based on BH-disk interactions suggest a delay timescale as short as [96], while more pessimistic scenarios propose delays exceeding a Hubble time. In this subsection, we briefly discuss how these potential delays might affect the predicted merger rates.
To account for delay effects occurring at unresolved nuclear scales – resulting from inefficient energy and angular momentum transport from the binary BH to the surrounding stars and gas – we apply a time shift to the same merger rate distribution as obtained in the fiducial run. We adopt a log-uniform distribution of the delay time , comparable to the light-seed scenario with delays but without supernova feedback as discussed in Ref. [97]. We assume that BHs pause accretion when subject to this delay.
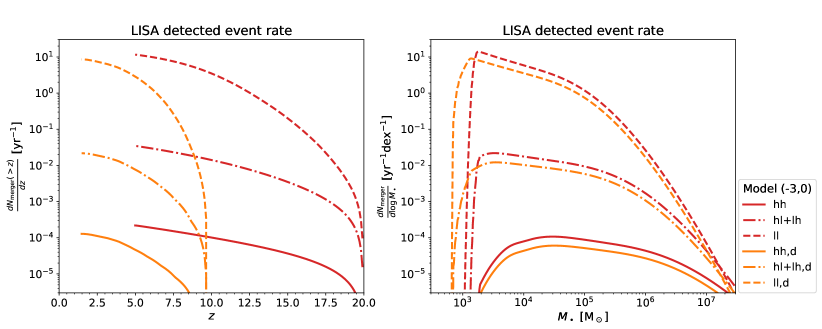
Figure 12 presents the major mergers detectable by LISA in the run with and both with (orange) and without delays (red). The left panel shows the cumulative merger rate by a redshift of and the right panel shows the total detected rate differentiated by the logarithmic remnant BH mass. In each panel, we distinguish between the three types of mergers: light-light (dashed), light-heavy (dot-dashed), and heavy-heavy seed BHs (solid). We first describe the results without delays. The cumulative detection rate is dominated by mergers between light-seed BHs (see also Figure 11). This rate exceeds at redshifts and saturates at , whereas the event rates involving heavy-seed BHs only amount to . In the right panel, BH mergers with remnant masses of are most likely to be detected. Moreover, detections at higher masses will constrain the shape of the merger-rate mass function, which is predicted to follow a double power-law form with indices and and a characteristic mass scale of . Note that within the four-year LISA operation period, the shape of the merger-rate mass function is expected to be well constrained for . In contrast, the rate–mass distributions of mergers involving heavy-seed BHs exhibit shallower slopes, though these are unlikely to be detectable.
We now turn to the model with delays555The curves with delays only consider mergers that would occur at if without delays.. The event rates are still dominated by light-light mergers. The minimum delay time of prevents mergers from occurring at . At lower redshifts, the detected event rate accumulates and reaches at , or 500 Myr later than the no-delay case. The saturated detection rate of is slightly lower than our no-delay case as the comoving volume per unit cosmic time decreases at lower redshifts, though this is partially compensated by LISA becoming more sensitive at lower redshifts and capable of detecting a larger proportion of the mergers. Since our assumed maximum delay time of is significantly shorter than the time interval between and the present universe, those high-redshift mergers are only postponed but not stalled, i.e., the BH number density reduction at the terminal redshift is unchanged. A maximum delay time comparable to or longer than a Hubble time would instead cause some BHs never to merge and significantly reduce the detected GW event rate.
On the other hand, the mass distributions of event rates with and without delays are similar in the double-power-law profile at remnant masses . The model with delays predicts a lower contribution on the heavy side, mainly owing to the reduced differential comoving volume at low redshifts, and a higher contribution for due to these mergers occurring at closer luminosity distances and thus more readily detectable by LISA.
V.2 Comparison with other works
Many previous studies have modeled detailed physical scenarios, such as BH seeding and BH sinking processes through gravitational interactions with surrounding gas and stars, and their influence on the merger rate, based on dark-matter halo merger trees (e.g., [98, 99, 79, 100, 97]). However, our approach differs: the merger timescale, , is a free parameter constrained by the unobscured AGN LF data. Mergers modify the MBH demographics, characterized by the number density at the zeroth order and the BHMF shape in more detail. The demographics, in turn, provide clues about the merger rate. We directly calculate BH properties without assuming a specific relationship between the BHs and their host galaxies or dark-matter halos, and our method is insensitive to uncertainties of delays at resolved spatial scales.
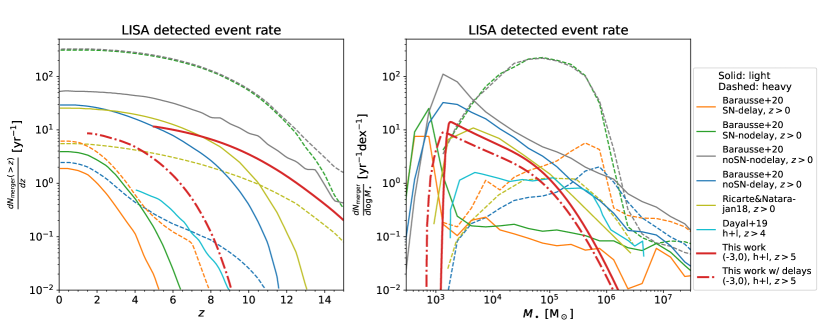
In Figure 13, we compare our detection rate distributions of all merger types with those from previous studies [99, 97, 100]666Ref. [100] reported the merger rate mass function depending on the redshifted mass and used an SNR threshold of 7 instead of 8. When plotting the right panel, we shift their curve left by 7 to approximate the intrinsic BH mass since their detected merger rate peaked at . Ref. [99] reported the same function depending on the chirp mass, which we multiply by 3 to approximate the remnant mass. The left panel shows the accurate results coordinated in Ref. [7].. The first two works cited above considered two distinct BH seeding models: light-seed (solid) and heavy-seed BHs (dashed). The last work combined the two seeding channels (to which this study is similar), and we use solid curves here to represent their total rates. Across the literature, even in a single study, theoretical event rate predictions can vary by orders of magnitude depending on the physical assumptions and techniques used (see also discussion in Ref. [7]).
The redshift trend of the detection rate in our fiducial case closely resembles previous models that do not account for delays, including Ref. [99] and the no-delay, no-supernova (SN) scenario in Ref. [97]. In contrast, the models with delays primarily at larger scales but not in the nucleus (Ref. [100] and the scenarios in Ref. [97] with delays) typically show detection rates that increase significantly later, after the initial seeding of BHs, and their cumulative rates at a given redshift are substantially lower than their no-delay counterparts (e.g., the blue vs. grey curve). Our model with delays at unresolved nuclear scales behave similarly. The mass function of merger rates in our no-delay model is comparable to the light-seed, no-SN cases in Ref. [97] and the light-seed case in Ref. [99]. Our curves drop quickly at both the light and heavy ends of the mass spectrum, mainly because our analysis do not cover , where LISA would have access to a broader detectable mass range. We have discussed in Section V.1 that the delays in our model do not strongly modify the profile of the merger-rate mass function, which agrees with, e.g., the comparison between the noSN-nodelay and noSN-delay cases in Ref. [97].
Comparison requires caution. We consider co-existing and co-evolving heavy- and light-seed BHs, which formed in early cosmic regions biased at different extents. Our heavy-heavy merger rates fall below the boundary of Figure 13 (but see Figure 12). Our approach differs from, for instance, Ref. [97], where only one type of seed was considered in each model setup and orders of magnitude higher event rates were predicted. On the other hand, Ref. [100] studied multiple populations and found light-light mergers dominating the event rates, similar to our findings. Compared to their work, ours originally shows that multiple MBH seeding channels are not just theoretically expected [11] but also observationally preferred by JWST AGN observations.
V.3 GW Localization and observation of merger afterglows
A substantial GW-event detection rate potentially enables multi-messenger observations of these MBH mergers. Combining EM and GW signals is expected to reveal rich insights into the physics and environment of the evolving BH [7]. In the following, we estimate the opportunity of unambiguously identifying a merger’s possible afterglow at , i.e., observing EM signals after the GW event. This will utilize the full inspiral, merger, and ringdown signals in GWs to minimize localization errors.
If a BH merger leads to a GW detection with uncertainties of the remnant mass , sky localization (in units of deg2), and luminosity distance , the number of MBHs within this parameter error box is given by
| (17) |
where at . Ref. [101] calculated the LISA parameter estimation errors of BH mergers up to , which we extrapolate to and find the optimal error box at for major mergers. The error of each parameter is calculated as , , and , where the full GW waveforms including inspiral, merger, and ringdown phases (PhenomC [102]) are taken into account777Ref. [101] calculated the uncertainties in the inspiral stage. They then scaled the sky localization uncertainty by and the luminosity distance uncertainty by to account for the full waveforms, where SNR is the accumulated GW signal-to-noise ratio; see their Equations (13) and (14). We similarly scale their relative mass uncertainty in the inspiral stage by (accurate for post-Newtonian inspiral signals [103], but only approximate for the full waveforms) to obtain the full-waveform uncertainty.. Since the total MBH abundance at is (see Figure 8), we thus obtain .
A more observationally relevant estimate is the number of AGNs within sky localization and redshift errors, which will become candidates to associate with the merger event. This is given by
| (18) |
where and give the physically plausible magnitude range of the merger afterglow. If we assume that the merger remnant BH launches super-Eddington accretion, then and mag, given by at the mass . This implies , higher than because the Eddington ratio of a post-merger BH is highly uncertain.
The result of challenges matching a LISA-detected event at to a unique EM target. Note that this estimation is based on the BHMF and the unobscured AGN LF where our models with different and converge within an order of magnitude. However, more accurate parameter estimation is possible. Regarding the source, a GW event with a low inclination angle and high ecliptic latitude may achieve an order of magnitude smaller than the above-reported average result [101]. Regarding the detector, joint detection with a network of GW observatories may improve the sky localization by a factor of a few to several orders of magnitude (e.g., LISA with B-DECIGO, [104]; with TianQin, [105]; with Taiji, [106]), depending on the detector design. Enhanced precision in sky location and distance measurements, , will filter out AGNs irrelevant to the merger and enable deep subsequent follow-up observations.
V.4 Evolution of MBH mass density
The evolution of the MBH total mass density, driven solely by accretion, is directly linked to the luminosity of AGNs. With an assumed radiative efficiency , the total AGN luminosity integrated over cosmic time agrees with the dynamically measured mass density of local MBHs. This is known as the Soltan argument [66]. Following this idea, X-ray observations have constrained the mass budget of MBHs to high redshifts (, [107, 67]).
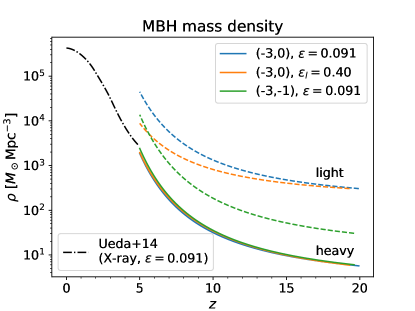
Figure 14 presents the MBH mass density evolution calculated using the best-fit parameters in our model with and (blue curves). This is compared to the result inferred from the X-ray AGN luminosity assuming ([67], the plot here adjusted for the different values of the assumed radiative efficiency). The heavy-seed population is consistent with constraints from the X-ray, in agreement with previous works [48]. However, the light-seed population at has a mass density exceeding observation by an order of magnitude.
One potential alleviation is that the light-seed BHs have radiative efficiency , which requires less to account for the JWST-selected AGN abundance. [108] argued for a high radiative efficiency for the dust-reddened, broad-line AGNs discovered by JWST based on their accreted mass density at . To explore a similar scenario for unobscured AGNs, we perform an additional MCMC fitting with and but with the light-seed BH radiative efficiency modified to 0.4, close to the theoretical limit for maximally rotating BHs. The best-fit result is also presented in Figure 14 (orange). Compared to the fiducial model, this setup matches the observed LF slightly better (), with reduced by a factor of 5. However, the total mass density remains in tension with the X-ray observations.
Alternatively, we may speculate that fewer light seeds participate in the MBH evolution than we have estimated. We thus run another MCMC with and and with fiducial radiative efficiencies, with the best fit shown in Figure 14 (green). The maximum posterior probability () is mildly worse than fiducial, but reduces by a factor of 3. The reduction factor in the above scenario is less than the naive expectation of 10 (from the change of the initial number density) as MCMC tunes the parameters to fit the AGN LF.
The discrepancy between our model’s total BH mass density and the integrated mass density inferred from X-ray-selected AGNs at is a consequence of the abundance of the JWST-selected unobscured AGN candidates, which are one to two orders of magnitude more numerous than the X-ray bright AGN populations at of comparable bolometric luminosities (noted in, e.g., [20]; see also [108]). A possible explanation for the difference in abundance is that previous X-ray surveys at may have missed AGNs that are X-ray faint, a common feature in unobscured AGNs identified with JWST (e.g., [109, 110]). However, to comply with Soltan’s argument, the growth of this X-ray faint population’s mass density at lower redshifts must slow down and become surpassed by that of the X-ray bright BHs, unless both populations have radiative efficiencies higher than . The decelerated mass density growth could be due to weakened accretion or reduced membership, the latter by mergers with X-ray bright populations or by unknown processes enhancing X-ray emission. Future deep surveys on low-luminosity AGNs in the redshift range will be essential in establishing representative MBH samples, connecting the present-day BHs and their progenitors in the first billion years of the universe.
VI Summary
The evolutionary history of MBHs is being unraveled through EM observations and will be further elucidated by GW probes. In this study, we model the BH mass assembly process in light of the new JWST-identified AGNs to investigate BH formation channels and predict GW events. We consider two types of seed BHs: heavy seeds () formed in rare and overdense cosmic regions, and light seeds () formed as stellar remnants in commoner dark-matter halos. The BHs grow through episodic accretion and mergers, which are constrained by the LF data of quasars and JWST-selected AGN candidates at . This work builds upon the model presented in Ref. [47], incorporating new elements including multiple seeding channels, mergers, and JWST-selected AGN candidate data. The model aims to contextualize future multi-messenger observations of MBHs within their mass assembly history for . We highlight our results as follows:
-
1.
While reproducing the quasar LF, models with heavy-seed BHs alone have difficulty explaining the JWST-selected faint AGN candidates (Figure 4). Our best fits with the seed abundance () fall below the data by a factor of ().
-
2.
The combined heavy- and light-seed BH population explains the observed AGN LF throughout available magnitudes (Figure 7). Quasars with are mainly attributed to heavy-seed BHs, but most fainter, JWST-selected AGN candidates may originate from light seeds.
-
3.
Both the total merger rate and the merger rate involving only heavy-seed BHs are subject to model-independent upper bounds (Equations 15 and 16) and further restricted by the AGN LF. We predict a heavy-heavy major merger rate of . On the other hand, light-seed BHs give merger rates mainly due to their abundance, with major mergers comprising a significant fraction (Table 5) and being readily detectable by space-based GW observatories such as LISA and B-DECIGO (Figures 9 and 10). The remnant BH mass distribution of the detected GW events is predicted to follow a double power-law form with and and a characteristic mass scale of . Within the LISA operation period, the mass function shape is expected to be well constrained for (Figure 12).
-
4.
If a merger occurs with a remnant BH mass , where LISA achieves optimal SNR, the number of AGNs as afterglow candidates within the parameter estimation error box is . Precise sky localization and distance measurement of the GW events, possibly facilitated by preferred source direction and multi-detector GW observation, may enable electromagnetic identification of mergers at and subsequent multi-messenger follow-up observations.
Interpreting our results comes with several caveats. Firstly, our merger prescription is simplistic (Section II.3). Without a more complicated parameter design, our model predicts trends similar to previous works without detailed physics such as delays and feedback. Secondly, all our best-fit merger timescales are longer than . This tends to be pessimistic because is the only parameter for mergers, and MCMC may prefer the more flexible accretion channel tuned by four parameters. Still, our analytical upper bounds for the merger rates apply to all merger timescales. Thirdly, the JWST AGN candidate data adopted here await confirmation and provide upper bounds of the real unobscured AGN LF, although the data are consistent with those based on broad-line AGN samples compiled in Refs. [20, 22]. The obscuration fraction of these JWST-selected AGNs is also uncertain as the value adopted in this work is inferred from X-ray-bright AGNs at . The intrinsic AGN LF at the faint end will be refined by future spectral follow-up observations and multi-wavelength surveys.
Acknowledgements.
We greatly thank Wenxiu Li for sharing their code to model BH accretion and compare theory to data. We also wish to thank Xian Chen, Jingsong Guo, and Priyamvada Natarajan for constructive discussions and Pau Amaro-Seoane for help with figure adaptation. K. I. acknowledges support from the National Natural Science Foundation of China (12073003, 12003003, 11721303, 11991052, 11950410493), and the China Manned Space Project (CMS-CSST-2021-A04 and CMS-CSST-2021-A06). MCMC computation in this work is supported by the High-Performance Computing Platform of Peking University.Appendix A Physical interpretation and simplistic models of the coagulation kernel
Here, we describe two models to interpret the coagulation kernel qualitatively and justify its positive mass dependence. Before proceeding, we note that the coagulation kernel has a dimension of . This implies the physical interpretation of the kernel as , i.e., the product of the BH collisional cross-section and the relative velocity.
Firstly, a simplistic treatment of two merging BHs assumes two-body Newtonian interactions, and a merger likely occurs when the BH distance is sufficiently close such that general relativistic corrections become significant. Each BH is thus crudely analogous to a hard sphere with radius , where is a dimensionless factor and is the Schwarzschild radius. For BHs with equal masses, as they approach each other with an impact parameter and relative velocity at infinity , their closest distance satisfies
| (19) |
The enlarged relative to is known as gravitational focusing. Substituting into the above formula gives the collisional cross-section. If is of order unity and , then
| (20) |
The above model idealizes BH mergers regardless of their host galaxies. Alternatively, we model that BH mergers are related to the collisional cross-section of their host galaxies, assuming the BH mergers closely follow the galaxy mergers. Specifically, we treat galaxy mergers using a tidal impulse approximation. Between the two progenitor galaxies, one is considered as a gravitational perturber to the other. Assuming that the impact parameter is much larger than the characteristic galaxy size (the tidal approximation) and that the encounter timescale is much shorter than the galaxy crossing timescale (the impulse approximation), one expands the perturbed gravitational potential to second order to derive the decrement of the intergalactic potential energy [111]
| (21) |
where and are the masses of the perturber and the perturbed galaxy, is the root-mean-squared radius of the perturbed galaxy, and and are the distance and relative velocity of the two galaxies at the closest approach. A merger is assumed to occur if this energy decrement exceeds the kinetic energy at infinity. For identical galaxies, , the critical condition is (the factor of two accounting for the reciprocal perturbations)
| (22) |
Energy and angular momentum conservation relate and to and :
| (23) | |||
| (24) |
which finally implies
| (25) |
Here, likely positively correlates with [112]. Numerical simulations demonstrated that the impulse approximation captures the merger behavior even for slow encounters [113]. The scaling applies to the BH mass in place of assuming a power-law BH-galaxy mass relation with the exponent close to unity [114].
Appendix B Numerical methods for mergers and code test
We implement the numerical merger process in Equation (5) with the forward Euler method, which is first-order accurate in time. Let denote a discrete, log-uniform mass grid indexed by with a bin width and and the heavy- and light-seed BHMF at the center of each mass bin. The discretized equations for the sum kernel are
| (26) |
| (27) |
where , is the time step, satisfies
| (28) |
and gives the mass index satisfying
| (29) |
The indices correspond to the mass indices of the remnant, the secondary progenitor, and the primary progenitor. In each time step, we first numerically evaluate the heavy-seed BH mass density and then obtain . Then, we update and using Equations (26) and (27), i.e., with the forward Euler method. After each time step, we adjust (the default value is ) adaptively such that the numerical heavy-seed BH number density deviates from the theoretical prediction by less than . Then, we re-normalize the former to match the latter (cf. [115], where the mass density is re-normalized instead). We also clear minor negative values in the BHMFs due to numerical errors and reduce if any point in the BHMFs drops below .
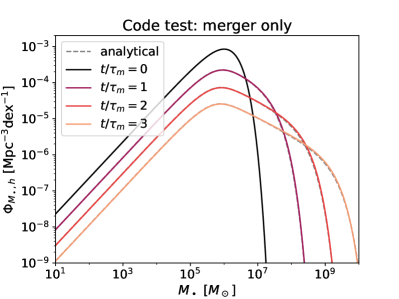
We test our merger implementation using an IMF with a tractable analytical solution. Specifically, we consider the Schechter function [116] for the heavy-seed BHs:
| (30) |
where is a normalization factor, is a power-law parameter, and is a characteristic mass. We ignore the light-seed BH population here. The initial number and mass densities are given by and , where is the Gamma function. The solution is given by ([82], with different notations)
| (31) |
where . Figure 15 shows the test result in the case , exhibiting good agreement with the analytical solution.
Appendix C Proof of the upper limit for merger rates in the observer’s frame
We assume that is the redshift when a significant proportion of the seed BHs have already formed. The value is equal to 20 in this work but may vary in the literature. In general, the observed merger rate earlier than a given redshift takes the form
| (32) |
where [117]
| (33) |
and is the luminosity distance. In the equation, denotes the merger-induced BH number reduction over time, subject to the constraint
| (34) |
where is the total seed comoving number density. If present, triple/quadruple BH mergers are counted as two/three distinct events.
Cosmology implies that is positive and monotonically increases with redshift [117], so its maximum value in the redshift interval of interest is . Therefore,
| (35) |
In the limiting case where all BHs merge immediately after birth, such that , Equations (15) and (16) will be recovered.
The above proof applies to seeds forming at a given redshift and readily extends to seeding over a redshift range. We only use the number density evolution and cosmology in the proof, so the result is widely applicable. For example, the most abundant heavy-seed scenario in Ref. [118] predicted , which, given , implied , consistent with the total merger rates in Ref. [119] where the same heavy-seed model was used.
References
- Abbott et al. [2023] R. Abbott, T. D. Abbott, F. Acernese, K. Ackley, C. Adams, N. Adhikari, R. X. Adhikari, V. B. Adya, C. Affeldt, D. Agarwal, et al. (LIGO Scientific Collaboration, Virgo Collaboration, and KAGRA Collaboration), Phys. Rev. X 13, 041039 (2023).
- Agazie et al. [2023] G. Agazie, A. Anumarlapudi, A. M. Archibald, Z. Arzoumanian, P. T. Baker, B. Bécsy, L. Blecha, A. Brazier, P. R. Brook, S. Burke-Spolaor, et al., ApJL 951, L8 (2023), arXiv:2306.16213 [astro-ph.HE] .
- Reardon et al. [2023] D. J. Reardon, A. Zic, R. M. Shannon, G. B. Hobbs, M. Bailes, V. Di Marco, A. Kapur, A. F. Rogers, E. Thrane, J. Askew, et al., ApJL 951, L6 (2023), arXiv:2306.16215 [astro-ph.HE] .
- EPTA Collaboration et al. [2023] EPTA Collaboration, InPTA Collaboration, J. Antoniadis, P. Arumugam, S. Arumugam, S. Babak, M. Bagchi, A. S. Bak Nielsen, C. G. Bassa, A. Bathula, et al., A&A 678, A50 (2023), arXiv:2306.16214 [astro-ph.HE] .
- Xu et al. [2023] H. Xu, S. Chen, Y. Guo, J. Jiang, B. Wang, J. Xu, Z. Xue, R. Nicolas Caballero, J. Yuan, Y. Xu, et al., Research in Astronomy and Astrophysics 23, 075024 (2023), arXiv:2306.16216 [astro-ph.HE] .
- Amaro-Seoane et al. [2017] P. Amaro-Seoane, H. Audley, S. Babak, J. Baker, E. Barausse, P. Bender, E. Berti, P. Binetruy, M. Born, D. Bortoluzzi, et al., arXiv e-prints , arXiv:1702.00786 (2017), arXiv:1702.00786 [astro-ph.IM] .
- Amaro-Seoane et al. [2023] P. Amaro-Seoane, J. Andrews, M. Arca Sedda, A. Askar, Q. Baghi, R. Balasov, I. Bartos, S. S. Bavera, J. Bellovary, C. P. L. Berry, et al., Living Reviews in Relativity 26, 2 (2023), arXiv:2203.06016 [gr-qc] .
- Kawamura et al. [2019] S. Kawamura, T. Nakamura, M. Ando, N. Seto, T. Akutsu, I. Funaki, K. Ioka, N. Kanda, I. Kawano, M. Musha, et al., International Journal of Modern Physics D 28, 1845001 (2019).
- Luo et al. [2016] J. Luo, L.-S. Chen, H.-Z. Duan, Y.-G. Gong, S. Hu, J. Ji, Q. Liu, J. Mei, V. Milyukov, M. Sazhin, et al., Classical and Quantum Gravity 33, 035010 (2016), arXiv:1512.02076 [astro-ph.IM] .
- Luo et al. [2020] Z. Luo, Z. Guo, G. Jin, Y. Wu, and W. Hu, Results in Physics 16, 102918 (2020).
- Inayoshi et al. [2020] K. Inayoshi, E. Visbal, and Z. Haiman, ARA&A 58, 27 (2020), arXiv:1911.05791 [astro-ph.GA] .
- Lynden-Bell [1969] D. Lynden-Bell, Nature 223, 690 (1969).
- Yu and Tremaine [2002] Q. Yu and S. Tremaine, MNRAS 335, 965 (2002), arXiv:astro-ph/0203082 [astro-ph] .
- Akiyama et al. [2018] M. Akiyama, W. He, H. Ikeda, M. Niida, T. Nagao, J. Bosch, J. Coupon, M. Enoki, M. Imanishi, N. Kashikawa, et al., PASJ 70, S34 (2018), arXiv:1704.05996 [astro-ph.GA] .
- Niida et al. [2020] M. Niida, T. Nagao, H. Ikeda, M. Akiyama, Y. Matsuoka, W. He, K. Matsuoka, Y. Toba, M. Onoue, M. A. R. Kobayashi, et al., ApJ 904, 89 (2020), arXiv:2010.00481 [astro-ph.GA] .
- Jiang et al. [2016] L. Jiang, I. D. McGreer, X. Fan, M. A. Strauss, E. Bañados, R. H. Becker, F. Bian, K. Farnsworth, Y. Shen, F. Wang, et al., ApJ 833, 222 (2016), arXiv:1610.05369 [astro-ph.GA] .
- Matsuoka et al. [2018] Y. Matsuoka, M. A. Strauss, N. Kashikawa, M. Onoue, K. Iwasawa, J.-J. Tang, C.-H. Lee, M. Imanishi, T. Nagao, M. Akiyama, et al., ApJ 869, 150 (2018), arXiv:1811.01963 [astro-ph.GA] .
- Schindler et al. [2023] J.-T. Schindler, E. Bañados, T. Connor, R. Decarli, X. Fan, E. P. Farina, C. Mazzucchelli, R. Nanni, H.-W. Rix, D. Stern, et al., ApJ 943, 67 (2023), arXiv:2212.04179 [astro-ph.GA] .
- Onoue et al. [2023] M. Onoue, K. Inayoshi, X. Ding, W. Li, Z. Li, J. Molina, A. K. Inoue, L. Jiang, and L. C. Ho, ApJL 942, L17 (2023), arXiv:2209.07325 [astro-ph.GA] .
- Harikane et al. [2023] Y. Harikane, Y. Zhang, K. Nakajima, M. Ouchi, Y. Isobe, Y. Ono, S. Hatano, Y. Xu, and H. Umeda, ApJ 959, 39 (2023), arXiv:2303.11946 [astro-ph.GA] .
- Kocevski et al. [2023] D. D. Kocevski, M. Onoue, K. Inayoshi, J. R. Trump, P. Arrabal Haro, A. Grazian, M. Dickinson, S. L. Finkelstein, J. S. Kartaltepe, M. Hirschmann, et al., ApJL 954, L4 (2023), arXiv:2302.00012 [astro-ph.GA] .
- Maiolino et al. [2023] R. Maiolino, J. Scholtz, E. Curtis-Lake, S. Carniani, W. Baker, A. de Graaff, S. Tacchella, H. Übler, F. D’Eugenio, J. Witstok, et al., arXiv e-prints , arXiv:2308.01230 (2023), arXiv:2308.01230 [astro-ph.GA] .
- Matthee et al. [2024] J. Matthee, R. P. Naidu, G. Brammer, J. Chisholm, A.-C. Eilers, A. Goulding, J. Greene, D. Kashino, I. Labbe, S. J. Lilly, et al., ApJ 963, 129 (2024).
- Abel et al. [2002] T. Abel, G. L. Bryan, and M. L. Norman, Science 295, 93 (2002), arXiv:astro-ph/0112088 [astro-ph] .
- Yoshida et al. [2008] N. Yoshida, K. Omukai, and L. Hernquist, Science 321, 669 (2008), arXiv:0807.4928 [astro-ph] .
- Bromm et al. [2002] V. Bromm, P. S. Coppi, and R. B. Larson, The Astrophysical Journal 564, 23 (2002).
- Hirano et al. [2014] S. Hirano, T. Hosokawa, N. Yoshida, H. Umeda, K. Omukai, G. Chiaki, and H. W. Yorke, ApJ 781, 60 (2014), arXiv:1308.4456 [astro-ph.CO] .
- Stacy et al. [2016] A. Stacy, V. Bromm, and A. T. Lee, MNRAS 462, 1307 (2016), arXiv:1603.09475 [astro-ph.GA] .
- Jaura et al. [2022] O. Jaura, S. C. O. Glover, K. M. J. Wollenberg, R. S. Klessen, S. Geen, and L. Haemmerlé, MNRAS 512, 116 (2022).
- Kitayama et al. [2004] T. Kitayama, N. Yoshida, H. Susa, and M. Umemura, ApJ 613, 631 (2004), arXiv:astro-ph/0406280 [astro-ph] .
- Whalen et al. [2004] D. Whalen, T. Abel, and M. L. Norman, ApJ 610, 14 (2004), arXiv:astro-ph/0310283 [astro-ph] .
- Johnson and Bromm [2007] J. L. Johnson and V. Bromm, MNRAS 374, 1557 (2007), arXiv:astro-ph/0605691 [astro-ph] .
- Alvarez et al. [2009] M. A. Alvarez, J. H. Wise, and T. Abel, ApJL 701, L133 (2009), arXiv:0811.0820 [astro-ph] .
- Tanaka et al. [2012] T. Tanaka, R. Perna, and Z. Haiman, MNRAS 425, 2974 (2012), arXiv:1205.6467 [astro-ph.CO] .
- Inayoshi et al. [2016] K. Inayoshi, Z. Haiman, and J. P. Ostriker, MNRAS 459, 3738 (2016), arXiv:1511.02116 [astro-ph.HE] .
- Pacucci et al. [2017] F. Pacucci, P. Natarajan, M. Volonteri, N. Cappelluti, and C. M. Urry, ApJL 850, L42 (2017), arXiv:1710.09375 [astro-ph.GA] .
- Bromm and Loeb [2003] V. Bromm and A. Loeb, ApJ 596, 34 (2003), arXiv:astro-ph/0212400 [astro-ph] .
- Lodato and Natarajan [2006] G. Lodato and P. Natarajan, MNRAS 371, 1813 (2006), arXiv:astro-ph/0606159 [astro-ph] .
- Shang et al. [2010] C. Shang, G. L. Bryan, and Z. Haiman, MNRAS 402, 1249 (2010), arXiv:0906.4773 [astro-ph.CO] .
- Omukai [2001] K. Omukai, ApJ 546, 635 (2001), arXiv:astro-ph/0011446 [astro-ph] .
- Tanaka and Li [2014] T. L. Tanaka and M. Li, MNRAS 439, 1092 (2014), arXiv:1310.0859 [astro-ph.CO] .
- Inayoshi et al. [2014] K. Inayoshi, K. Omukai, and E. Tasker, MNRAS 445, L109 (2014), arXiv:1404.4630 [astro-ph.GA] .
- Becerra et al. [2015] F. Becerra, T. H. Greif, V. Springel, and L. E. Hernquist, MNRAS 446, 2380 (2015), arXiv:1409.3572 [astro-ph.GA] .
- Wise et al. [2019] J. H. Wise, J. A. Regan, B. W. O’Shea, M. L. Norman, T. P. Downes, and H. Xu, Nature 566, 85 (2019), arXiv:1901.07563 [astro-ph.GA] .
- Li et al. [2021] W. Li, K. Inayoshi, and Y. Qiu, ApJ 917, 60 (2021), arXiv:2105.12637 [astro-ph.GA] .
- Lupi et al. [2021] A. Lupi, Z. Haiman, and M. Volonteri, MNRAS 503, 5046 (2021).
- Li et al. [2023] W. Li, K. Inayoshi, M. Onoue, and D. Toyouchi, ApJ 950, 85 (2023), arXiv:2210.02308 [astro-ph.GA] .
- Li et al. [2024] W. Li, K. Inayoshi, M. Onoue, W. He, Y. Matsuoka, Z. Pan, M. Akiyama, T. Izumi, and T. Nagao, ApJ 969, 69 (2024), arXiv:2306.06172 [astro-ph.GA] .
- Trinca et al. [2022] A. Trinca, R. Schneider, R. Valiante, L. Graziani, L. Zappacosta, and F. Shankar, MNRAS 511, 616 (2022), arXiv:2201.02630 [astro-ph.GA] .
- Jeon et al. [2024] J. Jeon, V. Bromm, B. Liu, and S. L. Finkelstein, arXiv e-prints , arXiv:2402.18773 (2024), arXiv:2402.18773 [astro-ph.GA] .
- Planck Collaboration et al. [2016] Planck Collaboration, P. A. R. Ade, N. Aghanim, M. Arnaud, M. Ashdown, J. Aumont, C. Baccigalupi, A. J. Banday, R. B. Barreiro, J. G. Bartlett, et al., A&A 594, A13 (2016), arXiv:1502.01589 [astro-ph.CO] .
- Yoon et al. [2012] S. C. Yoon, A. Dierks, and N. Langer, A&A 542, A113 (2012), arXiv:1201.2364 [astro-ph.SR] .
- Jeon et al. [2012] M. Jeon, A. H. Pawlik, T. H. Greif, S. C. O. Glover, V. Bromm, M. Milosavljević, and R. S. Klessen, ApJ 754, 34 (2012), arXiv:1111.6305 [astro-ph.CO] .
- Haiman [2004] Z. Haiman, ApJ 613, 36 (2004), arXiv:astro-ph/0404196 [astro-ph] .
- Ryu et al. [2016] T. Ryu, T. L. Tanaka, R. Perna, and Z. Haiman, MNRAS 460, 4122 (2016), arXiv:1603.08513 [astro-ph.GA] .
- Sheth et al. [2001] R. K. Sheth, H. J. Mo, and G. Tormen, MNRAS 323, 1 (2001), arXiv:astro-ph/9907024 [astro-ph] .
- Tanikawa et al. [2021] A. Tanikawa, H. Susa, T. Yoshida, A. A. Trani, and T. Kinugawa, ApJ 910, 30 (2021), arXiv:2008.01890 [astro-ph.HE] .
- Magg et al. [2016] M. Magg, T. Hartwig, S. C. O. Glover, R. S. Klessen, and D. J. Whalen, MNRAS 462, 3591 (2016), arXiv:1606.06294 [astro-ph.GA] .
- Skinner and Wise [2020] D. Skinner and J. H. Wise, MNRAS 492, 4386 (2020), arXiv:2001.04480 [astro-ph.GA] .
- Haiman et al. [1997] Z. Haiman, M. J. Rees, and A. Loeb, ApJ 476, 458 (1997), arXiv:astro-ph/9608130 [astro-ph] .
- Machacek et al. [2001] M. E. Machacek, G. L. Bryan, and T. Abel, ApJ 548, 509 (2001), arXiv:astro-ph/0007198 [astro-ph] .
- Johnson et al. [2013] J. L. Johnson, C. Dalla Vecchia, and S. Khochfar, MNRAS 428, 1857 (2013), arXiv:1206.5824 [astro-ph.CO] .
- Hirano et al. [2015] S. Hirano, T. Hosokawa, N. Yoshida, K. Omukai, and H. W. Yorke, MNRAS 448, 568 (2015), arXiv:1501.01630 [astro-ph.GA] .
- Klessen and Glover [2023] R. S. Klessen and S. C. O. Glover, ARA&A 61, 65 (2023), arXiv:2303.12500 [astro-ph.CO] .
- Shakura and Sunyaev [1973] N. I. Shakura and R. A. Sunyaev, A&A 24, 337 (1973).
- Soltan [1982] A. Soltan, MNRAS 200, 115 (1982).
- Ueda et al. [2014] Y. Ueda, M. Akiyama, G. Hasinger, T. Miyaji, and M. G. Watson, ApJ 786, 104 (2014), arXiv:1402.1836 [astro-ph.CO] .
- Cao and Li [2008] X. Cao and F. Li, MNRAS 390, 561 (2008), arXiv:0808.0759 [astro-ph] .
- Li et al. [2012] Y.-R. Li, J.-M. Wang, and L. C. Ho, ApJ 749, 187 (2012), arXiv:1202.3516 [astro-ph.CO] .
- Martini [2004] P. Martini, in Coevolution of Black Holes and Galaxies, edited by L. C. Ho (2004) p. 169, arXiv:astro-ph/0304009 [astro-ph] .
- Di Matteo et al. [2005] T. Di Matteo, V. Springel, and L. Hernquist, Nature 433, 604 (2005), arXiv:astro-ph/0502199 [astro-ph] .
- Hopkins et al. [2005] P. F. Hopkins, L. Hernquist, T. J. Cox, T. Di Matteo, P. Martini, B. Robertson, and V. Springel, ApJ 630, 705 (2005), arXiv:astro-ph/0504190 [astro-ph] .
- Schulze et al. [2015] A. Schulze, A. Bongiorno, I. Gavignaud, M. Schramm, J. Silverman, A. Merloni, G. Zamorani, M. Hirschmann, V. Mainieri, L. Wisotzki, et al., MNRAS 447, 2085 (2015), arXiv:1412.0754 [astro-ph.GA] .
- Aird et al. [2018] J. Aird, A. L. Coil, and A. Georgakakis, MNRAS 474, 1225 (2018), arXiv:1705.01132 [astro-ph.HE] .
- Novak et al. [2011] G. S. Novak, J. P. Ostriker, and L. Ciotti, ApJ 737, 26 (2011), arXiv:1007.3505 [astro-ph.GA] .
- Smoluchowski [1916] M. V. Smoluchowski, Zeitschrift fur Physik 17, 557 (1916).
- Hoffman and Loeb [2007] L. Hoffman and A. Loeb, MNRAS 377, 957 (2007), arXiv:astro-ph/0612517 [astro-ph] .
- Amaro-Seoane et al. [2010] P. Amaro-Seoane, A. Sesana, L. Hoffman, M. Benacquista, C. Eichhorn, J. Makino, and R. Spurzem, MNRAS 402, 2308 (2010), arXiv:0910.1587 [astro-ph.CO] .
- Bonetti et al. [2019] M. Bonetti, A. Sesana, F. Haardt, E. Barausse, and M. Colpi, MNRAS 486, 4044 (2019), arXiv:1812.01011 [astro-ph.GA] .
- Lousto et al. [2010] C. O. Lousto, M. Campanelli, Y. Zlochower, and H. Nakano, Classical and Quantum Gravity 27, 114006 (2010), arXiv:0904.3541 [gr-qc] .
- O’Leary et al. [2021] J. A. O’Leary, B. P. Moster, T. Naab, and R. S. Somerville, MNRAS 501, 3215 (2021), arXiv:2001.02687 [astro-ph.GA] .
- Scott [1968] W. T. Scott, Journal of the Atmospheric Sciences 25, 54 (1968).
- Baldry et al. [2012] I. K. Baldry, S. P. Driver, J. Loveday, E. N. Taylor, L. S. Kelvin, J. Liske, P. Norberg, A. S. G. Robotham, S. Brough, A. M. Hopkins, et al., MNRAS 421, 621 (2012), arXiv:1111.5707 [astro-ph.CO] .
- Hopkins et al. [2010] P. F. Hopkins, K. Bundy, D. Croton, L. Hernquist, D. Keres, S. Khochfar, K. Stewart, A. Wetzel, and J. D. Younger, ApJ 715, 202 (2010), arXiv:0906.5357 [astro-ph.CO] .
- Rodriguez-Gomez et al. [2015] V. Rodriguez-Gomez, S. Genel, M. Vogelsberger, D. Sijacki, A. Pillepich, L. V. Sales, P. Torrey, G. Snyder, D. Nelson, V. Springel, et al., MNRAS 449, 49 (2015), arXiv:1502.01339 [astro-ph.GA] .
- Hŭsko et al. [2022] F. Hŭsko, C. G. Lacey, and C. M. Baugh, MNRAS 509, 5918 (2022), arXiv:2107.05601 [astro-ph.GA] .
- Fakhouri et al. [2010] O. Fakhouri, C.-P. Ma, and M. Boylan-Kolchin, MNRAS 406, 2267 (2010), arXiv:1001.2304 [astro-ph.CO] .
- Richards et al. [2006] G. T. Richards, M. Lacy, L. J. Storrie-Lombardi, P. B. Hall, S. C. Gallagher, D. C. Hines, X. Fan, C. Papovich, D. E. Vanden Berk, G. B. Trammell, et al., ApJS 166, 470 (2006), arXiv:astro-ph/0601558 [astro-ph] .
- Foreman-Mackey et al. [2013] D. Foreman-Mackey, D. W. Hogg, D. Lang, and J. Goodman, PASP 125, 306 (2013), arXiv:1202.3665 [astro-ph.IM] .
- Husa et al. [2016] S. Husa, S. Khan, M. Hannam, M. Pürrer, F. Ohme, X. J. Forteza, and A. Bohé, PhRvD 93, 044006 (2016), arXiv:1508.07250 [gr-qc] .
- Khan et al. [2016] S. Khan, S. Husa, M. Hannam, F. Ohme, M. Pürrer, X. J. Forteza, and A. Bohé, PhRvD 93, 044007 (2016), arXiv:1508.07253 [gr-qc] .
- Katz and Larson [2019] M. L. Katz and S. L. Larson, MNRAS 483, 3108 (2019), arXiv:1807.02511 [gr-qc] .
- Babak et al. [2021] S. Babak, M. Hewitson, and A. Petiteau, arXiv e-prints , arXiv:2108.01167 (2021), arXiv:2108.01167 [astro-ph.IM] .
- Kawamura [2023] S. Kawamura, in The Sixteenth Marcel Grossmann Meeting. On Recent Developments in Theoretical and Experimental General Relativity, Astrophysics, and Relativistic Field Theories, edited by R. Ruffino and G. Vereshchagin (2023) pp. 3254–3260.
- Bouwens et al. [2021] R. J. Bouwens, P. A. Oesch, M. Stefanon, G. Illingworth, I. Labbé, N. Reddy, H. Atek, M. Montes, R. Naidu, T. Nanayakkara, et al., AJ 162, 47 (2021), arXiv:2102.07775 [astro-ph.GA] .
- Haiman et al. [2009] Z. Haiman, B. Kocsis, and K. Menou, ApJ 700, 1952 (2009), arXiv:0904.1383 [astro-ph.CO] .
- Barausse et al. [2020] E. Barausse, I. Dvorkin, M. Tremmel, M. Volonteri, and M. Bonetti, ApJ 904, 16 (2020), arXiv:2006.03065 [astro-ph.GA] .
- Barausse [2012] E. Barausse, MNRAS 423, 2533 (2012), arXiv:1201.5888 [astro-ph.CO] .
- Ricarte and Natarajan [2018] A. Ricarte and P. Natarajan, MNRAS 481, 3278 (2018), arXiv:1809.01177 [astro-ph.GA] .
- Dayal et al. [2019] P. Dayal, E. M. Rossi, B. Shiralilou, O. Piana, T. R. Choudhury, and M. Volonteri, MNRAS 486, 2336 (2019), arXiv:1810.11033 [astro-ph.GA] .
- Mangiagli et al. [2020] A. Mangiagli, A. Klein, M. Bonetti, M. L. Katz, A. Sesana, M. Volonteri, M. Colpi, S. Marsat, and S. Babak, PhRvD 102, 084056 (2020), arXiv:2006.12513 [astro-ph.HE] .
- Santamaría et al. [2010] L. Santamaría, F. Ohme, P. Ajith, B. Brügmann, N. Dorband, M. Hannam, S. Husa, P. Mösta, D. Pollney, C. Reisswig, et al., PhRvD 82, 064016 (2010), arXiv:1005.3306 [gr-qc] .
- Cutler and Flanagan [1994] C. Cutler and É. E. Flanagan, PhRvD 49, 2658 (1994), arXiv:gr-qc/9402014 [gr-qc] .
- Grimm and Harms [2020] S. Grimm and J. Harms, PhRvD 102, 022007 (2020), arXiv:2004.01434 [gr-qc] .
- Torres-Orjuela et al. [2024] A. Torres-Orjuela, S.-J. Huang, Z.-C. Liang, S. Liu, H.-T. Wang, C.-Q. Ye, Y.-M. Hu, and J. Mei, Science China Physics, Mechanics, and Astronomy 67, 259511 (2024), arXiv:2307.16628 [gr-qc] .
- Wang et al. [2020] G. Wang, W.-T. Ni, W.-B. Han, S.-C. Yang, and X.-Y. Zhong, PhRvD 102, 024089 (2020), arXiv:2002.12628 [gr-qc] .
- Hopkins et al. [2007] P. F. Hopkins, G. T. Richards, and L. Hernquist, ApJ 654, 731 (2007), arXiv:astro-ph/0605678 [astro-ph] .
- Inayoshi and Ichikawa [2024] K. Inayoshi and K. Ichikawa, arXiv e-prints , arXiv:2402.14706 (2024), arXiv:2402.14706 [astro-ph.GA] .
- Yue et al. [2024] M. Yue, A.-C. Eilers, T. T. Ananna, C. Panagiotou, E. Kara, and T. Miyaji, arXiv e-prints , arXiv:2404.13290 (2024), arXiv:2404.13290 [astro-ph.GA] .
- Maiolino et al. [2024] R. Maiolino, G. Risaliti, M. Signorini, B. Trefoloni, I. Juodzbalis, J. Scholtz, H. Uebler, F. D’Eugenio, S. Carniani, A. Fabian, et al., arXiv e-prints , arXiv:2405.00504 (2024), arXiv:2405.00504 [astro-ph.GA] .
- Spitzer [1958] L. J. Spitzer, ApJ 127, 17 (1958).
- Kravtsov [2013] A. V. Kravtsov, ApJL 764, L31 (2013), arXiv:1212.2980 [astro-ph.CO] .
- Dekel et al. [1980] A. Dekel, M. Lecar, and J. Shaham, ApJ 241, 946 (1980).
- Kormendy and Ho [2013] J. Kormendy and L. C. Ho, ARA&A 51, 511 (2013), arXiv:1304.7762 [astro-ph.CO] .
- Li et al. [2022] R. Li, Y.-X. Chen, and D. N. C. Lin, MNRAS 510, 5246 (2022), arXiv:2112.08233 [astro-ph.EP] .
- Schechter [1976] P. Schechter, ApJ 203, 297 (1976).
- Haehnelt [1994] M. G. Haehnelt, MNRAS 269, 199 (1994), arXiv:astro-ph/9405032 [astro-ph] .
- Volonteri et al. [2008] M. Volonteri, G. Lodato, and P. Natarajan, MNRAS 383, 1079 (2008), arXiv:0709.0529 [astro-ph] .
- Klein et al. [2016] A. Klein, E. Barausse, A. Sesana, A. Petiteau, E. Berti, S. Babak, J. Gair, S. Aoudia, I. Hinder, F. Ohme, et al., PhRvD 93, 024003 (2016), arXiv:1511.05581 [gr-qc] .