How Early Could the Milky Way’s Disk Form?
Abstract
We investigate early, , galaxy formation in a cosmological zoom-in simulation of a close, early-forming Milky Way (MW) analog extracted from TNG50 simulation and re-simulated with detailed modeling of cold interstellar medium (ISM) formation, coupled with on-the-fly UV radiative transfer, turbulence-regulated star formation, and stellar feedback. In our enhanced-physics simulation, the galaxy develops a bi-stable ISM structure (warm, with , and cold, with ) and exhibits significantly more efficient, early, and bursty star formation than in TNG. Notably, the stellar disk of this MW progenitor forms extremely early, around , and exhibits chemo-kinematic properties consistent with the low-metallicity population of the MW stars. The disk forms rapidly, on a timescale of 0.2 Gyr which is significantly shorter than the timescale implied by the observable chemo-kinematic signatures of disk spinup, 0.7 Gyr, due to the scatter in the age-metallicity relation. The rotational support of the gas disk and the location of the galaxy on the main sequence are consistent with early disk galaxies observed by JWST and ALMA at , suggesting that some of these galaxies could be progenitors of MW-like systems. Remarkably, the variation of the global star formation rate (SFR) before disk formation is similar to the observed SFR scatter at these early times. Our findings underscore the critical role of modeling a turbulent cold ISM and turbulence-regulated star formation and feedback in driving early SFR variability, while at the same time enabling early disk formation, without destroying it with overly efficient stellar feedback.
1 Introduction
Within its first two years, the James Webb Space Telescope (JWST) has fundamentally transformed our paradigm of galaxy formation. The first results revealed a surprising abundance of bright galaxies in the early Universe (e.g., finkelstein22; naidu22; boylan-kolchin23; labbe23). Although these findings appear to be in tension with the theoretical models of galaxy evolution, some existing cosmological simulations and analytical models produced abundances of bright galaxies consistent with the JWST results as long as the variability of star formation rates (SFRs) at early times was accounted for (e.g., keller23; mccaffrey23; sun23-fire; shen23; kravtsov-belokurov24). Whether this high SFR variability is physical or is too large, e.g., due to overly efficient feedback, remains a subject of active debate.
Several alternative explanations for this high abundance of early galaxies have been proposed in the literature, that among others include stellar feedback being inefficient at early times (e.g., dekel23; qin23; boylan-kolchin24), and variations in the initial mass function (IMF) shape (e.g., shen23; yung24) and dust content (e.g., ferrara23). Regardless of the specific details, the point stands that in the early universe, galaxies form and evolve qualitatively differently from the local universe.
Apart from the high abundance of early bright galaxies, results from JWST (e.g., ferreira22a; ferreira22b; jacobs22; naidu22; nelson22; robertson23) and earlier from ALMA (e.g., smit18; neeleman20; pensabene20; rizzo20; rizzo21; fraternali21; lelli21; tsukui-iguchi21; herreracamus22; posses23; romanoliveira23) showed that dynamically cold galactic disks can form significantly earlier than previously thought. Galaxies observed with JWST exhibit predominantly disk morphologies out to (ferreira22b). If these galaxies are indeed disks, this will imply that disks form very early and persist throughout cosmic time (see, however, gibson24; pandya24). Closer to home, the local Galactic archaeological data also suggest that the disk of our own Milky Way formed surprisingly early, within the first 2 Gyr of evolution (bk22; conroy22; rix22; xiang-rix22), which appears to be in tension with the results of state-of-the-art cosmological simulations of MW-mass galaxies, which typically form disks several Gyr later (bk22; mccluskey23).
These findings make the first 2 Gyr of the evolution of the universe, i.e., , interesting in the context of early disk assembly and the transition from early chaotic and bursty galaxy formation to steady star-forming disk galaxies typical of the present-day universe. Modeling galaxy formation at these early times is particularly challenging because simulations often rely on extrapolation of subgrid models calibrated against local observations to the extreme regimes typical for the early universe: high densities and SFRs, high levels of turbulence, low metallicity, and, early on, the absence of a well-defined disk.
Accurately modeling the processes of star formation and feedback is crucial for disk formation, as has been shown in a large body of literature over the past two decades (e.g., governato04; governato07; okamoto05; robertson06; scannapieco08; zavala08; brook12; bird13; bird21; fire; fire2; ubler14; agertz15; agertz16; genel15; christensen16; auriga; el-badry18; garrison-kimmel18; pillepich19; vintergatan1; vintergatan2; vintergatan3; gurvich22; hafen22; khoperskov22a; khoperskov22c; rodriguez-gomez22; vintergatan4; yu22; semenov23a). Stellar feedback plays multiple different roles in disk formation. First, it expels low-angular momentum gas from galaxies, preventing its accumulation in the center and buildup of bulge-dominated systems (e.g., agertz16). Second, by keeping the disk mass fraction low, feedback stabilizes disks against global gravitational instabilities that could also drive material into the center and cause disk fragmentation (efstathiou82; mo-mao-white98). Third, by powering the matter cycle through the circumgalactic medium, recycled outflows can bring in high-angular momentum gas from the halo outskirts promoting disk growth (e.g., ubler14; christensen16; defelippis17; semenov23b). Finally, overly strong feedback can substantially thicken or even destroy the disk (e.g., agertz16).
The last effect may explain why current state-of-the-art zoom-in simulations of MW-like galaxies struggle to reproduce early disk formation (bk22). While efficient feedback can induce significant variation in the SFR at early times in the galaxy assembly process, alleviating the tension with the observed abundances of early UV-bright galaxies, the same effect can delay or hinder the formation of galactic disks at these high redshifts (e.g., dekel20; gurvich22). For example, while FIRE-2 simulations are consistent with the JWST luminosity functions up to owing to the efficient and bursty nature of implemented stellar feedback (sun23-fire), the galactic disks in MW-mass progenitors form significantly later than suggested by Galactic archaeological data (at ; mccluskey23).
On the other hand, the early formation of the MW could be attributed to the unusually rapid assembly of its dark matter halo (dillamore24; semenov23a). As was shown by semenov23a based on the TNG50 cosmological simulation, although on average MW-mass disks indeed form relatively late (consistent with the results of zoom-in simulations), the variation in disk formation times is substantial, so that of such galaxies form disks as early as the MW data suggests. However, in TNG50, the modeling of star formation and feedback relies on the effective equation of state approach, which tends to produce significantly smoother star formation histories compared to high-resolution zoom-in simulations that explicitly model the formation of a cold ISM. The reduced burstiness is one of the reasons why such simulations underpredict the number of bright galaxies at (kannan23). Thus, the interplay between feedback modeling and assembly history in galactic disk formation and evolution remains an open question.
To explore this issue, we investigate the formation and evolution of a close MW analog at in cosmological simulations with detailed modeling of a cold ISM, star formation, and feedback. Specifically, we extract one of the early-forming MW-like disk galaxies from the TNG50 simulation that exhibits a remarkably similar chemo-kinematic structure of the stellar disk to observations at suggesting a mass assembly history similar to that of the MW (chandra23). We re-simulate this galaxy using a high-resolution cosmological zoom-in setup with explicit modeling of cooling and heating coupled with a self-consistently evolving UV radiation field and a physically motivated model for turbulence-regulated star formation and stellar feedback developed and thoroughly tested in semenov16; semenov18; semenov21-tf. This model has successfully reproduced the observed near-linear correlation between molecular gas and SFR on kpc scales without imposing such a relation locally (semenov17; semenov19), as well as their spatial decoupling on sub-kpc scales (semenov21-tf). The latter statistic is particularly challenging to capture in galaxy simulations, making it a sensitive probe of the star formation and feedback modeling (semenov18; fujimoto19; chevance23). Recently, polzin23; polzin24 also explored the model in simulations of low-metallicity dwarf disk galaxies, extending down to . The fact that such an agreement is achieved without tuning and instead with forward-modeling ISM properties like unresolved turbulent energy and local star formation efficiencies makes this model particularly appealing for exploring the effects of star formation and feedback on early galaxy evolution, where subgrid model calibration is difficult.
Our paper is structured as follows. In Section 2, we describe the choice of the initial conditions and outline the numerical galaxy formation models used in our study. Section 3 presents the key findings by contrasting the results of our new simulation with the original TNG model in terms of the global gas distribution, star formation histories, and early galactic disk formation and evolution. In particular, in Sections 3.4 and 3.6, we show that the new simulation is broadly consistent with both the local observations of low-metallicity stars in the MW and high-redshift disk galaxies observed by JWST and ALMA. We discuss our findings in Section 4 and summarize our conclusions in Section 5. Appendices A and B provide additional details on the resolution of our simulations and the calculation of metal abundances, respectively.
2 Methods
| Property | ART | TNG |
|---|---|---|
| Hydrodynamics framework | Adaptive mesh refinement | Moving mesh |
| Baryon resolution | ; aaThe cited mass resolution corresponds to the gas mass refinement criterion (see the text and Figure 11 in Appendix A). The cell size at a given refinement level is fixed in comoving units and the cited value is provided at , where most of the comparison in this paper is done. is the median cell size in the galaxy ISM, defined as all gas cells at densities greater than . | ; |
| ISM thermodynamics | Explicit - and UV-dependent cooling down to few K | Effective EoS with at bbSee Figure 2. |
| Heating sources | On-the-fly UV RT (background + stars) + dissipation of subgrid turbulence | Uniform UV background + AGN |
| Non-thermal pressure | Subgrid turbulent pressure | — |
| Star formation prescription | Locally variable | KS-like relation calibrated at |
| Stellar feedback | Adaptive energy and momentum injection | Effective EoS + decoupled winds |
| AGN feedback | — | Thermal + kinetic modes |
| Molecular chemistry | Non-equilibrium network | — |
In this section, we describe how the initial conditions for our simulations of an early-forming MW analog were selected (Section 2.1), and outline the key features of the two versions of our runs: the new simulation with detailed cold ISM physics run with the ART code, which we henceforth label “ART” (Section 2.2) and the original TNG model (Section 2.3). The main differences between the two models are summarized in Table 1.
2.1 Galaxy Model: Early-Forming MW Analog
To both investigate early galaxy evolution and draw a plausible picture of the early formation of the MW’s disk, we select a prototypical MW analog from the TNG50 cosmological simulation studied by chandra23. This is one of the early-forming MW-mass galaxies identified in semenov23b; semenov23a, which shows the formation of a stellar disk at lower than average metallicities, [Fe/H] , consistent with the observational measurements by bk22, and additionally features structures in the [Fe/H] vs. plane (such as the thick and thin disks and the transitions between them) which are remarkably similar to the MW data (chandra23). The halo mass of this galaxy at and —when we perform most of our analysis below—is and , respectively.
To generate the initial conditions (ICs) for zoom-in resimulations of this galaxy from the original TNG50 ICs (a representative comoving Mpc3 region of the universe, assuming Planck XIII planck-xiii cosmology), the resolution of the dark matter particles was degraded outside of the Lagrangian volume of its halo (the numerical details of this procedure will be described in puchwein24). The dark matter particle resolution within the Lagrangian region of our target halo was kept the same as that in TNG50, . At , when we perform most of our analyses, no low-resolution dark matter particles reside within the virial radius in the TNG run, while in the ART run, they contribute of the total dark matter mass. This difference originates from the back-reaction of cold and dense gas on the dark matter structure formation.
One of the differences of our target halo from other early-forming MW analogs in TNG50 is that it experiences two significant mergers at and (see Figure 8 in chandra23). While with the TNG model, the disk survives through these mergers, this is not the case with the detailed ISM modeling in ART, which we find by resimulating the targeted halo at a lower resolution past these mergers. For this reason we perform our analysis at , prior to such a destructive merger occurring in ART. We discuss the potential effects of the ISM modeling on mergers and disk survivability in Section 4 and leave a detailed study for future work.
2.2 ART Overview
To investigate the effects of realistic cold ISM modeling on the formation of galactic disks in the early universe, we re-simulate the above MW analog from TNG50 using the adaptive mesh refinement -body and hydrodynamics code ART (kravtsov99; kravtsov02; rudd08; gnedin11) with on-the-fly modeling of UV radiation transfer (gnedin14) and using the ISM, star formation, and feedback model that was developed and thoroughly tested in semenov16; semenov17; semenov18; semenov19; semenov21-tf. In MW-mass galaxies, this model produces a realistic Kennicutt-Schmidt (KS) relation for total and molecular gas, in terms of both normalization and slope without imposing such a relation locally (semenov17; semenov19) and allows us to make meaningful predictions for the local properties of star-forming gas at resolution scales thanks to a physically-motivated model for turbulence regulated star formation efficiency (semenov18; semenov21-tf). In particular, as shown in semenov21-tf, this model is able, without tuning, to reproduce the observed spatial decorrelation of young stars and dense gas on sub-kiloparsec scales—the statistic which was shown to be a sensitive probe of the star formation–feedback cycle modeling (semenov18; fujimoto19; chevance23). This model was also tested in low-metallicity (down to 0.01 solar) regimes by polzin23; polzin24. All this makes the model particularly appealing for application in simulations of early galaxy formation where more common models calibrated against observations necessarily rely on extrapolation. The key improvements in our new simulation compared to the original TNG model are summarized in Table 1. Here we briefly outline these differences and for a more detailed description of the model refer to semenov21-tf.
We adopt a higher baryon resolution in our ART simulation than in the original TNG50 run, motivated by the typical resolution of the idealized galaxy simulations where our model has been extensively tested (see the references above). Specifically, the AMR grid is adaptively refined, when the total gas mass in a cell exceeds , thereby keeping the median cell gas mass on different levels roughly constant, , which is a factor of smaller than in TNG, albeit with a significantly larger scatter (see Figure 11 in Appendix A). The mesh is refined in this fashion down to the minimal cell size of comoving pc, or pc at . The star particle mass resolution in ART () is also higher than in TNG (), allowing for better temporal and sampling resolution in the stellar properties discussed throughout this paper.
The gravitational potential is calculated by using a Fast Fourier Transform at the lowest grid level and relaxation method on all higher refinement levels, with the effective resolution for gravity corresponding to 2–4 cells (see kravtsov97; gnedin16; mansfield21). The gravitational potential used to accelerate dark matter particles is computed at 3 levels above the highest resolution level, corresponding to the cell size of comoving pc, while the potential for stars and gas is reconstructed at the highest resolution level, corresponding to comoving pc. We have checked that increasing and decreasing the gravity resolution for dark matter particles has only a small impact on the dark matter halo assembly, especially compared to the effects from the formation of dense and cold gas.
Apart from differences in hydrodynamics framework and resolution, the most important difference between our new simulation and TNG is the modeling of ISM physics, which includes realistic cooling and heating dependent on metallicity and a local incident UV radiation field (gnedin12), on-the-fly transfer of UV radiation (using the Optically Thin Variable Eddington Tensor, OTVET, approximation; gnedin01; gnedin14), and a dynamic model for unresolved turbulence (using the “shear-improved” Large-Eddy Simulation model of schmidt14 as described in semenov16). As we show below, with these changes, the ISM gas develops a complex multiphase structure, while the unresolved turbulent energy provides non-thermal pressure support in each cell and is used to modulate the local star formation.
We parametrize the local star formation rate in each cell via the star formation efficiency per freefall time, :
| (1) |
Galaxy simulations often treat as a tunable parameter and introduce star formation thresholds calibrated against available observations. In our simulation, we instead allow to vary continuously with the local properties of unresolved turbulence, enabling us to make meaningful predictions about the distribution and evolution of at high redshifts. Specifically, in our simulation, depends on the (subgrid) virial parameter, , following the fit to magnetohydrodynamic simulations of turbulent star-forming regions by padoan12:
| (2) |
with the choice of the prefactor explained in semenov16 and the virial parameter defined as for a uniform sphere with the radius equal to half of the cell size, (bertoldi92):
| (3) |
where accounts for both the unresolved turbulent velocity dispersion, , and thermal support, expressed via the sound speed, . The small-scale turbulent velocity dispersion is calculated from the explicitly followed subgrid turbulent energy, , which is sourced by the local cascade of kinetic energy from resolved scales and dissipates into heat on local cell-crossing time (see semenov16, for details).
Young stars affect the ISM by sourcing UV radiation that is self-consistently propagated by the RT solver and via injection of thermal energy and radial momentum following our fiducial model from semenov21-tf. The amount of energy and radial momentum injected per supernova (SN) depends on local gas density, metallicity, and cell size, using results from simulations of SN remnants expanding into a nonuniform ISM by martizzi15. In our fiducial model, we additionally boost the radial momentum by a factor of 5 to account for the effects of SN clustering (e.g., gentry17; gentry19) and cosmic ray pressure (diesing18), both of which can increase the injected momentum by a factor of a few. To approximate the effect of pre-supernova feedback due to stellar winds, unresolved H II regions, and radiation pressure we start the injection of energy and momentum promptly upon formation of the stellar particle, without a few Myr delay corresponding to the lifetime of the most massive SNII progenitors. This is motivated by the mechanical luminosity of these early feedback processes being approximately equal to that of the SNe (e.g., agertz13). This approximation neglects the metallicity-dependence of early feedback, however, we find that, in our model, early feedback has only a weak effect on the global SFR when the local is not too high, so that only a small fraction of star-forming region is converted into stars before the first SN explodes (semenov18; semenov21-tf). The total number of SNe for a given star particle is computed using the chabrier03 IMF.
Unlike TNG, the ART run does not include AGN feedback. As we explicitly demonstrate below, at early times when we perform our analyses, our target galaxy is not massive enough for AGN feedback to produce a significant effect, and therefore the absence of AGN feedback in ART cannot explain the differences between the runs that we report below.
During their evolution, stellar particles return a fraction of their mass following the prescription of leitner11. In ART, we separately follow the total mass fractions of metals injected by SNe type II and Ia, and , which we use to reconstruct [Fe/H] assuming the TNG yield tables (pillepich18) as described in Appendix B.
We also explicitly follow the formation and destruction of molecular gas using a non-equilibrium 6-species chemical network from gnedin11 coupled with the locally variable UV radiation field. The molecular gas is modeled independently from star formation, which allows us to make predictions for the relation between molecular and star-forming gas in the early universe, which we do in a companion paper.
2.3 TNG Overview
To facilitate a direct comparison with the original TNG model, we rerun the same zoom-in ICs with the model parameters as the TNG50 simulation but with a higher output cadence matching that of the ART simulation.
The simulation was carried out using the moving-mesh -body and magnetohydrodynamic code Arepo (arepo), where the unstructured mesh based on Voronoi tesselation of the domain continuously moves and deforms following the flow in quasi-Lagrangian fashion, with the mass of gas cells maintained within a factor of two from the target resolution, . The resulting mass-weighted median cell size in the ISM gas with at is (see Appendix A and Figure 11). The gravitational softening length for dark matter, stellar, and wind particles is 575 comoving pc at and 288 physical pc at , while for gas, the softening length varies with the cell size as , where is the radius of a sphere with the same volume as the Voronoi cell.
In TNG, the gas with densities is subject to radiative cooling (primordial, Compton, and metal-line) and heating from a spatially uniform (vogelsberger13) UV background, which is turned on at , and by local AGN sources using the approximate method described in vogelsberger13. At densities , the gas temperature and pressure are set by the sh03 effective equation of state, with modifications described in vogelsberger13 and nelson19.
The local star formation rate, which is used to stochastically convert gas cells into star particles, is calibrated against the observed Kennicutt–Schmidt relation from kennicutt98. The corresponding local star formation efficiency per freefall time, , varies smoothly and very weakly as a function of density between and 4%—due to the variation of the cold gas fraction in the sh03 model—and therefore can be considered fixed.
Galaxy scale stellar feedback is modeled by stochastically ejecting locally prescribed ISM gas mass in the form of decoupled wind particles, which are recoupled with the background gas after they leave the galaxy (pillepich18; nelson19). Unlike ART, the TNG model also includes AGN feedback, which is modeled in two modes, based on the local Eddington-limited Bondi gas accretion rate: continuous injection of thermal energy and stochastic kinetic kicks at high and low accretion rates, respectively (weinberger17).
The TNG simulation explicitly tracks 9 chemical elements including H and Fe, which can be used to compare with the observed stellar abundances, [Fe/H]. In ART, on the other hand, we do not follow individual species and instead follow the total mass fractions of metals injected by SNe type II and Ia, and —quantities, that are also available in TNG. To make the comparison between TNG and ART consistent, we derive [Fe/H] from and using TNG yield tables (pillepich18) as described in Appendix B.
3 Results
In this section, we present the results of our zoom-in resimulation of a MW-analog from TNG50 using the detailed ISM, star formation, and feedback modeling in the ART code and compare it with the results from the TNG model. As described in Section 2.1, we present our analysis at , which is approximately the time when the final disk forms in this galaxy in the original TNG50 simulation and before the destructive merger that destroys the disk in the ART simulation.
3.1 Formation of Dense and Cold ISM
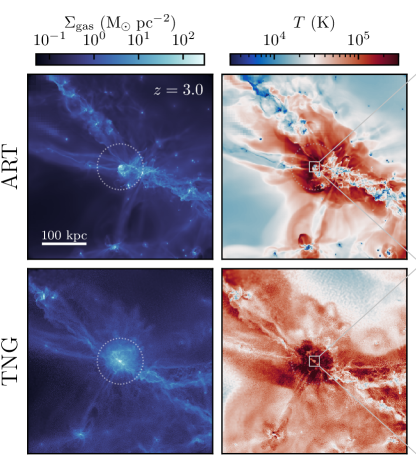
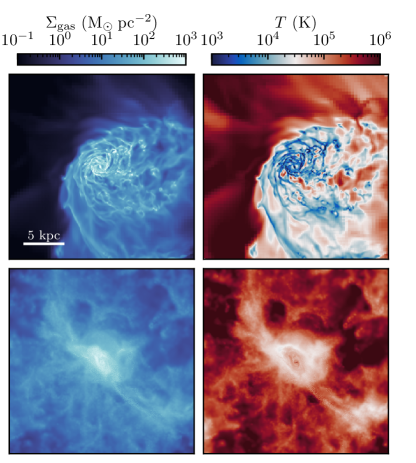
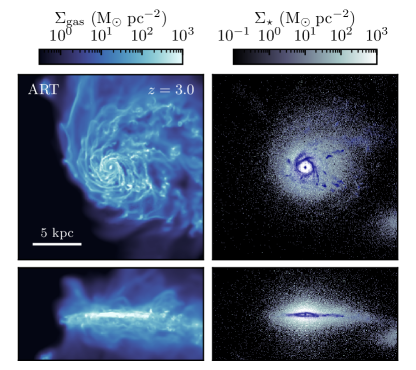
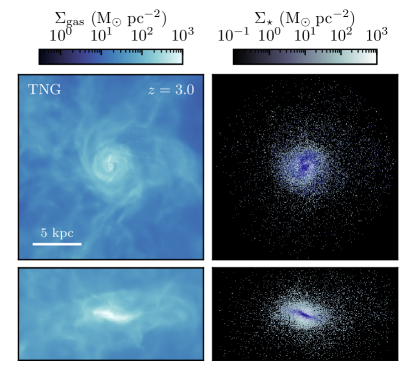
Figure 1 compares the spatial distributions of gas density and temperature at , both on large scales (the left set of panels) and zooming in at the galaxy scale (the right set of panels). The large-scale features, such as the locations of dense filaments and the presence of hot () gas, are qualitatively similar in both runs. In detail, however, the distributions differ significantly.
The most striking difference is the presence of dense and cold structures in the ART simulation, owing to explicit modeling of cooling down to low temperatures. On large scales, the ART simulation shows significantly more dense and cold “blobs,” early star-forming dwarf galaxies. On small scales, the main progenitor also appears qualitatively different: in ART, it develops a thin extended disk with a prominent spiral structure, while in TNG, the galaxy is significantly smaller, puffier, and featureless.
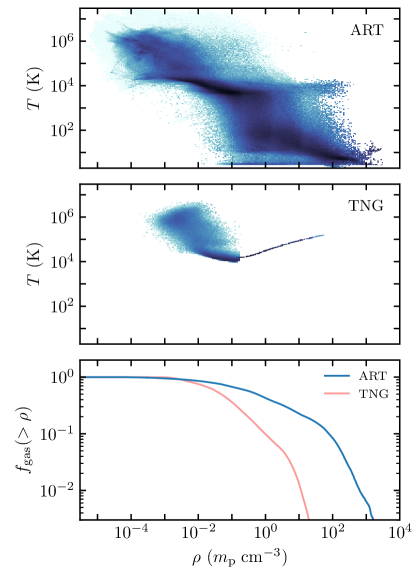
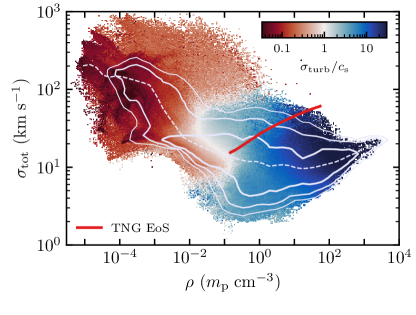
These differences stem from the treatments of gas thermodynamics at high densities as quantified in Figures 2 and 3. Figure 2 compares the density and temperature distribution of gas, while Figure 3 shows the relation between the density and total velocity dispersion, , including the contributions of thermal pressure and subgrid turbulence in ART. The latter figure is analogous to the – plot except that it quantifies the total pressure support in the dense, supersonic gas where subgrid turbulence dominates the pressure support, as indicated by the color. To compare the local pressure support of dense gas between ART and TNG, in ART can be directly compared with the sound speed corresponding to the effective equation of state imposed in TNG (shown with the solid red line). In the plots, we show the gas within 30 kpc from the galaxy center and exclude the central 0.5 kpc to avoid the high-density and high- artifact in ART caused by strong shear in the very center (see Figure 8 in semenov22).
As Figure 2 shows, owing to explicit cooling in ART, the gas at , develops a two-phase medium with (warm neutral medium, WNM; with a contribution of resolved H II regions at high densities) and (cold neutral medium; CNM). In TNG, on the other hand, the thermodynamics of gas at such densities is replaced with the sh03 effective equation of state. In this model, the effective temperature and pressure are derived as that of a mixture of hot () and “cold” (, representing a mixture of WNM and CNM) phases, and the resulting temperature is significantly higher than that in the ART simulation.
Indeed, as Figure 3 shows, in gas with , the effective sound speed in TNG is a factor of 5–6 larger than in ART, implying that the effective pressure, , is 30–40 times higher. We stress again that the pressure in ART is significantly lower despite it including the contribution from small-scale turbulence, which dominates over the thermal pressure at these densities, i.e., the dense ISM is supersonic (see the color in the figure). The significantly higher pressure in TNG prevents the formation of dense structures. For comparison, in TNG, the main progenitor hardly has any gas at , while in ART, more than 10% of the gas within is at (see the bottom panel in Figure 2).
3.2 Early, Efficient, and Bursty Star Formation
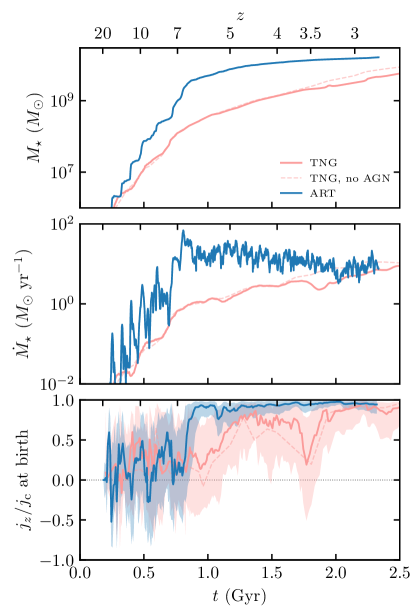
The differences in the gas density structure translate into the qualitative differences in the star formation histories. The top two panels of Figure 4 show the evolution of total stellar mass, , and SFR of the main progenitor. With detailed modeling of cold ISM, star formation becomes significantly more efficient and bursty.
Early on, the SFR in ART is a factor of 10–30 higher than in TNG, leading to a significantly faster build-up of . The shape of the early SFR history is also qualitatively different: in TNG it is rising monotonically, while in ART it rapidly rises until and then steadily declines until the SFRs in the two runs become comparable in magnitude at (although still significantly burstier in ART). As we will discuss in the next section, this transition at in ART corresponds to the formation of a galactic disk.
Apart from the average magnitude, the temporal variation of SFR is significantly higher in ART than in TNG. In TNG, the SFR evolves smoothly because local SFR depends only on the density of gas (sh03) and, given the relatively smooth gas distribution (see Section 3.1), the total SFR is primarily set by the total amount of star-forming gas (defined using a relatively low-density threshold of ) which changes smoothly. In contrast, in ART, star formation happens in relatively dense gas with low turbulence support (see Section 2.2), and both the amount of such dense gas and the level of turbulence change rapidly, leading to a significant short-term variation of global SFR.
Interestingly, just like the SFR magnitude, its variability also changes significantly before and after disk formation around . In a companion paper (semenov24b), we show that the short-term variability of the SFR is dominated by the local variations of due to the chaotic changes in the ISM turbulence, which experience a qualitative change at the moment of disk formation. Before disk formation, these variations are more violent as they are driven by large-scale accretion flows and mergers. In contrast, after the disk formation, they are mainly caused by disk instabilities and stellar feedback driving the expansion–compression gas cycle in the ISM.
One of the important factors that potentially could contribute to the SFR being lower in TNG is the modeling of AGN feedback which is lacking in ART. However, we explicitly checked that AGN feedback is not efficient enough at these early times and low galaxy masses to explain the above differences. Specifically, we reran the TNG simulation with the AGN feedback turned off, and the results remained close to the original simulation, except for the later times () or equivalently higher galaxy masses (), where the run without AGN has a factor of 2 higher SFR and mildly larger (see the dashed red lines in the figure). It is worth noting however that, although the lack of AGN feedback in ART alone cannot explain the higher SFR and , at this galaxy in ART becomes massive enough () for AGN to have a non-negligible effect.
3.3 Early Disk Formation
One of the striking results of the detailed ISM modeling is the early formation of an extended galactic disk (recall Figure 1). As the bottom panel of Figure 4 shows, this disk forms in the ART simulation extremely early, at redshift . This panel shows the orbital circularities111The orbital circularity is defined as the ratio of the -component of the particle angular momentum, , to the value at the circular orbit with the same total energy, . See Section 2.3 in semenov23a for calculation details. of stars at birth, , with values close to 0 and 1 corresponding to spherical and thin disk-like orbital configurations, respectively. In ART at , shows a large variation around 0 reflecting chaotic early evolution, while at , of most young stars becomes reflecting the rapid formation of a relatively thin star-forming disk around . In TNG, the values also become predominantly positive around , but the scatter is large, reflecting a more puffed-up gas distribution albeit with a net rotation. It is worth recalling that this galaxy is not an average MW-mass galaxy progenitor, but rather an early-forming analog extracted from TNG50. However, while with the TNG model this early disk formed at (chandra23), with a more detailed modeling of ISM physics the same initial conditions lead to a 1.5 Gyr earlier disk formation at .
Note that Figure 4 shows stellar circularities at birth, implying that it is a star-forming gas disk that forms at . By itself, this does not necessarily imply a buildup of a stable stellar disk as early gas disks can be transient or change orientation on short timescales (e.g., meng-gnedin21; kretschmer22). However, in Figures 5 and 6, we show that in our simulation the gas disk is sufficiently stable, and a stellar disk is steadily built up after the formation of the star-forming gas disk.
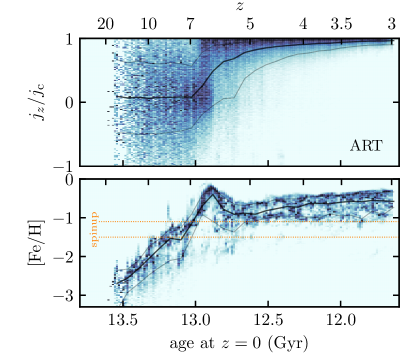
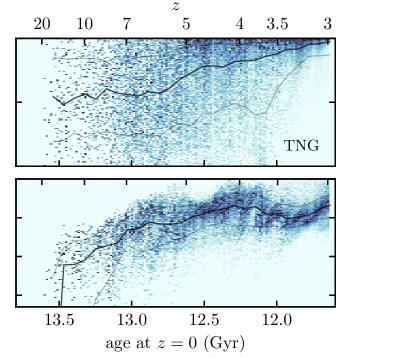
Figure 5 shows the spatial distribution of gas and stars at , viewed face-on and edge-on. Young stellar particles formed within 100 Myr are also highlighted in blue. In ART, the young stellar disk is relatively thin, reflecting the thin star-forming gas disk. The vertical extent of the entire stellar population is, however, thicker due to the contribution of stars formed before a disk was established (the population dubbed “Aurora” (bk22) or “proto-Galaxy” (conroy22)), as well as thickening of the population of stars formed shortly after gas disk formation (see below). In contrast, although in TNG a disk-like component is also clearly visible in gas and young stars, it is significantly thicker, consistent with the large scatter of in Figure 4.
The top panels of Figure 6 show the distribution of stellar as a function of age. Overall, this distribution qualitatively mirrors the distribution of at birth (the bottom panel in Figure 4), which implies that the gaseous disk in ART does remain in place and gradually builds up the stellar disk without drastic changes in orientation or encounters with destructive mergers between and 3 (see also yu22). In particular, the sharp increase of at is clearly visible, reflecting the signature of disk spinup in the stellar kinematics. Note, however, that the scatter of values of for stellar particles with ages 12.4–12.9 Gyr (i.e., shortly after disk formation) is wider than that of the values at birth. This difference reflects the thickening of the early stellar disk as a result of the aforementioned variation in the gas disk orientation and secular dynamic processes.
For the comparison with the local Galactic archaeology data (see the next section), the chemical evolution of the stellar population is crucial as ages are not observable directly. The lower panels of Figure 6 show the distribution of stellar metallicities, [Fe/H], as a function of age. In ART, [Fe/H] increases rapidly and peaks at , which happens around the end of disk formation. This peak in [Fe/H] coincides with a peak in the SFR (see Figure 4) which leads to rapid enrichment of the ISM, while the subsequent drop and steady increase of [Fe/H] reflects mixing in of the metal-poor material right after disk formation and steadily declining SFR in the disk. In TNG, the evolution of [Fe/H] is significantly smoother. Interestingly, it also exhibits a larger scatter than in ART. This is a consequence of the adopted star formation model with a relatively low density threshold, which results in a more distributed star formation (recall Figure 5) and therefore probes the available metallicity gradient of the gas disk more uniformly.
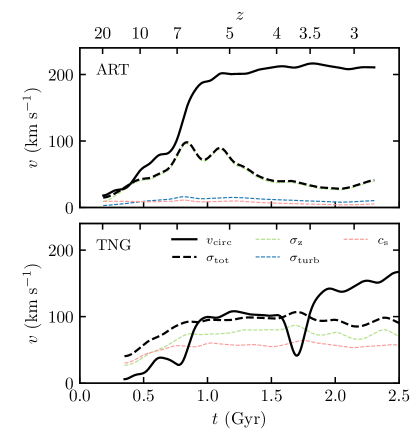
The quantitative insights into why the explicit modeling of cold ISM leads to significantly earlier disk formation are provided in Figure 7. The solid line shows the evolution of the circular velocity, , at the circularization radius of the dense gas with , i.e., the radius at which this gas would be fully rotationally supported given its total angular momentum. A thin disk can form only when this velocity becomes larger than the velocity dispersion of the gas (shown with the dashed lines) and a characteristic velocity of feedback-driven flows that remove gas from the region. The exact value of the latter depends on the details of star formation feedback modeling but for typical energetics of SNe it is of the order of (e.g., dekel86).
In ART, gradually rises prior to disk spinup at and then increases sharply as it reaches , when the disk forms. The velocity dispersion during disk formation is dominated by turbulent motions on resolved scales, , with only a small contribution of thermal and subgrid turbulent velocities, both at . The resolved turbulence decays down to over the next as the disk settles.
In TNG, in contrast, increases more gradually and rises significantly above only at . The total velocity dispersion also remains high, , due to both large resolved velocity dispersion and the thermal energy associated with the effective equation of state. This leads to a significantly thicker disk in TNG at .
Overall, the differences in the evolution of arise from the differences in how efficiently mass can be accumulated in the center of the halo. The early disk formation in the ART simulation is therefore linked to the more rapid growth of the stellar mass at early times. Previous numerical studies showed that galactic disks tend to form when galaxies become more massive than (e.g., el-badry18; dekel20; pillepich19; dillamore24; semenov23b), although the exact physical mechanism of disk spinup remains a subject of debate (e.g., stern19; dekel20; hopkins23disk; semenov23b). As Figure 4 shows, the disk forms in both ART and TNG when the galaxy reaches such a mass of . With more efficient star formation, the galaxy in the ART simulation crosses this mass threshold earlier, at , leading to earlier disk formation than in TNG.
3.4 Comparison with Milky Way Data
The direct comparison of our simulation results with the MW data is impossible because the simulation was not run to due to computational expense. However, it is still insightful to compare the properties of the high-redshift disks in our simulation with the distribution of MW’s low-metallicity stars. Most of these stars form early, and their metallicities and kinematics imprint useful information about these early stages of galaxy formation. In particular, Figure 8 compares the PDF of [Fe/H], age-metallicity relation, and the tangential velocity of stars as a function of [Fe/H] with the MW measurements. The high-metallicity region with [Fe/H] corresponding to the median gas metallicity at is grayed out because, by , it will be populated predominantly by stars formed at .
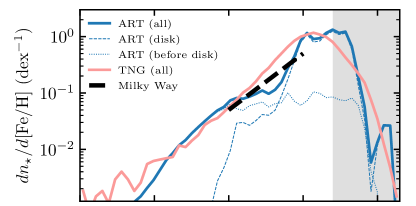
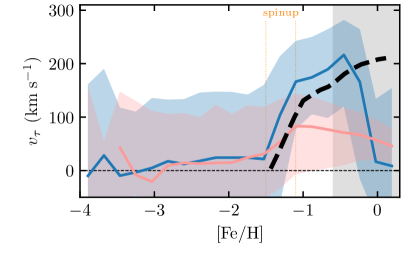
As the top panel shows, the average slope of the metallicity PDF at roughly follows the linear relation found in the MW (rix22; bk23), implying that both TNG and ART models lead to reasonably realistic early enrichment histories. Using the TNG simulation ran to , we have confirmed that the PDF slope at these low metallicities remains close to linear and only the PDF portion at grows substantially at . The PDF in ART exhibits a dip around , which, in this case, imprints the onset of disk formation, as is evident from the comparison of PDFs for stars formed before and after the disk was formed (thin dotted and dashed lines, respectively). A similar feature is reported in the MW data, albeit at somewhat higher metallicity, (see the references above).
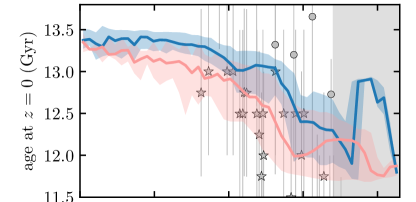
Similarly, the comparison of the age-metallicity relations in the middle panel shows that both TNG and ART simulations are consistent with the MW observations at these early times. This is mainly because the uncertainties in ages within and between the models are significant, 1 Gyr, which is comparable with the age of the universe at these early times. Interestingly, both ART and TNG runs exhibit rather smooth relations at low metallicities; in particular, the sharp increase of [Fe/H] at age 12.9 Gyr in ART (recall Figure 6) is not visible when the age distribution is binned as a function of [Fe/H]. This increase is manifested in the feature at near-solar metallicity, however, by its contribution into the total population of metal-rich stars becomes overpowered by the stars formed in the metal-rich disk at late times.
The bottom panel shows the relation between the galactocentric tangential velocity of stars, , as a function of their metallicity. The dashed line shows the first discovery of the sharp increase of spinup in the low-metallicity population of the MW stars corresponding to the spinup of the MW disk reported by bk22. As the figure shows, in ART such a spinup feature is clearly in place by , while TNG shows a significantly lower amplitude of median . If the stellar disk did not encounter destructive mergers at later times, such a feature could potentially survive, indicating that it could reflect the disk formation as early as , as the case in our simulation.
3.5 Timing of Disk Spinup
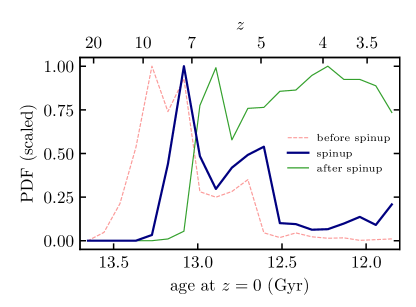
Given that the early stellar and gas disks during and shortly after the formation are rather weak in terms of the common disk definitions, such as thickness-to-radius ratio and rotational support, the timing of disk formation can also be ambiguous and is subject to the disk definition. For example, while the gas disk in ART has rather low at (Figure 7), the stellar at show a clear signature of disk spinup at (Figure 6) consistent with the formation of a star-forming gas disk at the same redshifts (Figure 4). To avoid ambiguity, we define the disk formation stage as the time over which the spinup feature in the distributions of is built up. From Figures 4 and 6, this stage spans between the stellar ages and 12.8 Gyr, implying disk formation on a 0.2 Gyr timescale.
The disk formation time implied by the observed [Fe/H]– relation (Figure 8) can differ from these values as stars with a range of ages can contribute to the same [Fe/H] bin due to the scatter in the age metallicity relation. To investigate this effect, Figure 9 shows the distributions of stellar ages before ([Fe/H] ), during ( [Fe/H] ), and after ([Fe/H] ) the spinup selected based on the metallicity cuts corresponding to the sharp increase of (see the dotted orange lines in Figure 8). The star particles with [Fe/H] and are relatively cleanly separated into the population formed at and , or ages and Gyr, respectively. The intermediate population corresponding to the spinup feature, however, shows a relatively broad distribution of ages, from 13.2 to 12.5 Gyr. Naïvely, this could be interpreted as disk formation on a timescale of 0.7 Gyr. However, this range is significantly broader than the aforementioned definition based on the stellar ages: –12.8 Gyr, implying a significantly more abrupt disk formation on 0.2 Gyr timescale.
The wider range of spinup ages in the [Fe/H]– space originates from the scatter of [Fe/H] at a fixed age, as evident from Figure 6 (see the dotted orange lines showing the same [Fe/H] cuts corresponding to the spinup feature). The bump and tail of spinup stars with ages in Figure 9 corresponds to the low-metallicity end ([Fe/H] ) of the stellar population formed in the disk at late times. Also interestingly, the narrow peak of the oldest subpopulation of these spinup stars with ages – Gyr was formed shortly before a stable disk was established, not during the disk formation. This is because the abrupt disk formation coincides with the peak of star formation and metal enrichment (recall Figure 4), so that the stars with and large formed during this peak contribute significantly at [Fe/H] , while the stars with [Fe/H] reflect the transition to the population formed before the disk.
Thus, although the spinup feature observable in the [Fe/H]-space corresponds to the sharp spinup in the age-space, the scatter and shape of the age-metallicity relation can lead to a biased estimate of disk formation in terms of both the timing and duration: 13.2–12.5 Gyr based on [Fe/H] vs. 13–12.8 Gyr based on ages. These differences, however, are comparable to the uncertainties in the age estimates at these low metallicities. It is nevertheless interesting that the timescale of disk formation implied by [Fe/H] is consistent with the observational estimates ( Gyr; e.g., bk24) while our simulation predicts that disk formation is in fact significantly more abrupt ( Gyr).
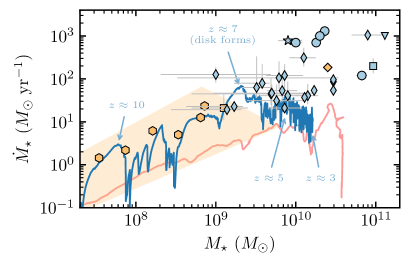
3.6 Comparison with Observed Early Disk Galaxies
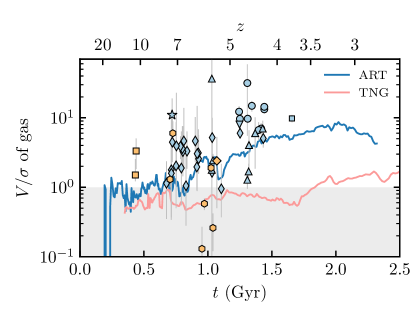
The fact that detailed turbulence-based ISM modeling leads to efficient bursty star formation and early disk formation is enticing in view of the recent JWST and ALMA discoveries of large abundances of early bright galaxies and dynamically cold gaseous disks (see the references in the Introduction). Figure 10 compares the results of our simulations with observational estimates of the gaseous disk rotational support (; left panel), and the relation between and SFR, i.e., the main sequence (right panel). In simulations, we calculate the rotational velocity of the gas disk as , where and are the tangential component of kinetic energy and the total mass of gas denser than ,222The estimate based on the circular velocity, , at the circularization radius of gas produces a similar result, albeit with a larger scatter at early times. while the total vertical velocity dispersion, , includes the contributions from the resolved and thermal motions and, in the ART case, subgrid turbulence.
As the left panel shows, the gas disk in the ART simulation has which is consistent with the rotational support of some of the early ALMA and JWST disks at . As the right panel shows, our simulation is also consistent with some of these galaxies in terms of the total stellar mass and the SFR. In particular, GN-z11 (orange square; xu24) and the disk galaxies from the JADES sample (orange hexagons; degraaff24) are consistent with our simulated MW progenitor before the formation of the thin disk at . Many of the ALMA cold disks from the parlanti23 sample at (blue diamonds) are consistent with being MW-like progenitors with early disk formation. Many of the observed high-redshift disks are, however, too massive () and/or actively star-forming (; e.g., lelli21; rizzo21; nelson23; amvrosiadis24; rowland24), implying that these galaxies are likely progenitors of more massive early-type galaxies in centers of groups and clusters.
The orange polygon in the right panel shows the range of and derived for JWST galaxies at . The SFRs of these galaxies are systematically above that in TNG.333Note, however, that the observed range corresponds to the brightest galaxies at these early times, so the actual range of SFR can extend to smaller values. The ART galaxy, on the other hand, explores almost the entire range of the observed SFRs as it evolves, implying that the early, pre-disk SFR burstiness is consistent with the observed scatter. In a companion paper (semenov24b), we show that this variation is sufficient to explain the abundance of early UV-bright galaxies observed with JWST, and most of this variation results from variations in local star formation efficiency per freefall time (; see Equation 1) caused by variations in the ISM turbulence. This can be one of the reasons why many of the existing galaxy simulations underproduce the abundance of early bright galaxies without modeling such effects.
4 Discussion
In our simulation of an MW-like progenitor with detailed ISM modeling, a stable star-forming disk forms as early as (Section 3.3). The disk at these early times differs from typical star-forming disks in the present-day universe. For example, at the contribution of the pre-disk stellar population is still significant, so that the galaxy exhibits a significant spheroid contribution (Figure 5). The rotational support of the gas disk is also rather weak: shortly after the formation, and increasing to at , reflecting high level of ISM turbulence at these early times (Figure 7). These numbers are however consistent with the observations of disk galaxies at with JWST and ALMA (Figure 10).
The ICs for this simulation were selected from the TNG50 simulation as one of the closest MW analogs in terms of the chemo-kinematic structure of the stellar disk at (subfind halo ID 519311; see Section 2.1 and chandra23). Interestingly, in our resimulation of this galaxy with detailed ISM modeling, some of the key properties of the low-metallicity disk are already in place early on. In particular, the sharp increase in the tangential velocity of stars at metallicities [Fe/H] , is consistent with the MW data that reflects the MW disk formation (Figure 8; bk22; conroy22). In our simulations, this feature is established at (Section 3.5).
One of the key reasons for the earlier disk formation in our enhanced-physics simulation is the more efficient accumulation of the baryonic mass in the galaxy early on. Both the original TNG galaxy and our re-simulation form a stable star-forming disk, when the galaxy stellar mass reaches , consistent with previous findings (see Section 3.3 and el-badry18; dekel20; pillepich19; dillamore24; semenov23a; semenov23b). With detailed ISM modeling, our simulated galaxy forms stars more efficiently and reaches this mass threshold earlier than in TNG (recall Figure 4). Given that in both simulations, the host dark matter halo mass evolves similarly, the enhanced-physics run predicts higher at high redshift than TNG. Note, however, that we focus on the evolution of an atypical (early-forming) halo, and therefore a detailed comparison with the observational constraints and empirical and semi-analytic models requires a more uniform sample of simulated galaxies, which we leave to future study.
Considered together, our results suggest that the MW disk could spin up very early, and some of the observed early disks at could be progenitors of present-day MW-like systems. If the MW’s disk has indeed formed that early, this would require that the kinematic distribution of the stars formed at these early times does not evolve substantially over the remaining history of the universe due to secular processes, like stellar migration, and catastrophic events, like galaxy mergers. While numerical simulations suggest that stellar disks might indeed be resilient to the former long-term evolution (e.g., yu22), galaxy mergers can indeed be destructive posing stringent constraints on the late mass accretion history for such early-forming disks.
As was shown by sotillo-ramos22, a significant fraction of disk galaxies in TNG can survive mergers. This is also the case for the TNG50 galaxy that we study here, which undergoes a series of significant mergers at and that shape the final structure of the stellar disk in the [Fe/H] vs. space, which resembles the MW data (chandra23). By resimulating our ART run at lower resolution past we find that, with the physics adopted in our simulation, this is no longer the case: the first merger destroys the disk formed at , shifting the spinup feature to significantly higher [Fe/H] than the MW data suggests (recall Figure 8), while the later merger quenches the galaxy completely.
This drastic difference between ART and TNG results indicates that the resilience of stellar disks to mergers is strongly sensitive to the modeling of the ISM, star formation, and feedback. There are multiple ways how such details can play a role. First, by making star formation more efficient early on, more gas is converted into stars in the ART run, making mergers more gas-poor, affecting disk survivability and reformation after the merger. Second, the development of instabilities in the gas disk and its response to mergers depends on the ISM structure and its effective EoS which are significantly different in simulations with an imposed EoS and explicit modeling of multiphase ISM structure formation (see Section 3.1 and Figures 2–3). Third, mergers drive a significant fraction of gas mass into the center, making the subsequent evolution dependent on the details of the AGN feedback modeling, which is absent in our ART runs. Finally, we find that the modeling of a cold ISM substantially changes the timing and orbital parameters of mergers (see also agora24). All these effects of ISM modeling on mergers require further detailed study which we leave to future work.
The observational estimates of the total mass of MW stars formed before its disk was in place (i.e., the “Aurora” or “proto-Galaxy” population) suggest that no such destructive mergers should have happened in the MW’s history. Indeed, this mass is rather low ( in conroy22 and in bk23), which is close to the stellar mass threshold at which galaxies tend to form disks (e.g., el-badry18; dekel20; pillepich19; dillamore24; semenov23b). If a destructive merger occurred, the total mass of non-disky low-metallicity stars in the MW would be higher as it would include both the contribution of stars that were formed before any disk was in place and the stars formed in a disk that was destroyed by the merger. The comparison of MW’s data and cosmological simulation results also suggests that the MW could indeed experience a merger after the disk formation but its disk survived through this last major merger (fattahi19; dillamore22; dillamore24).
Thus, whether the early disk survives or not, also strongly depends on the full mass assembly history and the presence of significant mergers. The fact that the disk does not survive in the ART simulation can be an artifact of the particular choice of the ICs. Indeed, halo 519311 experiences more significant late mergers compared to some other early-forming MW-like objects from TNG50 (see, e.g., Figure 8 in chandra23). This warrants a more detailed exploration of ICs for other early-forming galaxies with detailed ISM modeling, which we leave to a future study.
5 Summary and Conclusions
We have investigated the early evolution and galactic disk formation in a cosmological zoom-in simulation of a close MW-like analog, incorporating detailed modeling of cold ISM formation coupled with on-the-fly transfer of UV radiation and turbulence-regulated star formation and stellar feedback. For the initial conditions of our simulation, we have extracted one of the early-forming MW-mass disk galaxies from TNG50 that closely resembles the MW in terms of the early formation of the stellar disk and its chemo-kinematic structure at (semenov23a; chandra23). To assess the effects of detailed ISM, star formation, and feedback modeling, we compare the results of our new resimulation with the original TNG model. Our main findings are summarized as follows:
-
1.
With the explicit modeling of cooling and heating, the ISM at densities develops a two-phase structure with characteristic temperatures of (warm neutral medium and resolved H II regions) and (cold neutral medium). In contrast, for TNG, the effective equation of state imposed at these densities corresponds to significantly higher temperatures, , thereby preventing the formation of dense structures (Figures 1–3).
-
2.
As a result of the difference in gas structure and star formation and feedback modeling, the new simulation exhibits a significantly earlier and bursty star formation history. The global SFR exhibits a steep rise at and then a steady decline at . In TNG, in contrast, the early SFR is very smooth and monotonically rising (the top two panels of Figure 4).
-
3.
The transition between these two star formation regimes in our enhanced-physics simulation corresponds to the formation of a stable star-forming gas disk at . The initial conditions for this run were selected from TNG50 such that the disk also forms relatively early, but with the TNG model, this happens significantly later, at . In both cases, the gas disk forms when the galaxy stellar mass reaches , consistent with previous findings in the literature (the bottom panel of Figure 4).
-
4.
The chemo-kinematic properties of this early-formed disk are consistent with the low-metallicity ([Fe/H] ) population of the MW stars in terms of the stellar metallicity distribution, age-metallicity relation, and the sharp increase of rotational velocities at [Fe/H], indicative of the early MW’s disk spinup (Figure 8). The galaxy in TNG also develops a rotating disk-like system by , which is however significantly thicker than in the simulation with detailed ISM modeling (the bottom panel of Figure 4 and Figure 5).
-
5.
The disk in the enhanced-physics simulation forms very abruptly, within Gyr. This is significantly shorter than the estimate based on the age distribution of stars constituting the above spinup feature suggests, Gyr. The latter estimate is biased due to the scatter of stellar metallicities at a fixed age resulting in a low-metallicity tail of stars formed in the disk contributing to the spinup feature. The difference is however smaller than current uncertainties in the observational age estimates (Section 3.5).
-
6.
The rotational support of the gas disk at is consistent with the observations of early disk galaxies with JWST and ALMA in this redshift range. The location of the galaxy in the main sequence is also consistent with the low mass () and low SFR () end of this galaxy sample. This indicates that at least some of these observed early disk galaxies can be progenitors of MW-like systems (Figure 10).
-
7.
The variation of the global SFR before the disk formation is consistent with the observed scatter, while the TNG model predicts the evolution along the main sequence without significant SFR variations and with a magnitude 10 times lower than the average values derived observationally (Figure 10, right panel).
Our results demonstrate that modeling of turbulent cold ISM, and turbulence-regulated star formation and feedback can both produce highly variable early SFR—which helps to reconcile early galaxy evolution with the high abundance of UV bright galaxies observed by JWST at high redshifts—while at the same time enable early disk formation, without destroying it with excessively efficient stellar feedback.
We find that the early disk in our simulation does not survive to due to a subsequent destructive merger. This can be either an artifact of the specific choice of the ICs or a generic consequence of more efficient early star formation (see Section 4). Both these possibilities warrant future investigation in a larger sample of early-forming disk galaxies with a range of mass assembly histories.
In a companion paper (semenov24b), we use our new simulation to investigate the role of ISM turbulence in the early SFR burstiness and disk formation in more detail. Forward-modeling of the small-scale turbulence and local star formation efficiencies on tens of pc scales, make these simulations particularly useful as they allow us to investigate these properties in the early galaxies where observational estimates are sparse or lacking altogether.
Acknowledgements
We are deeply grateful to Oscar Agertz, Renyue Cen, and Andrey Kravtsov for the insightful discussions and comments. The analyses presented in this paper were performed on the FASRC Cannon cluster supported by the FAS Division of Science Research Computing Group at Harvard University. Support for V.S. was provided by Harvard University through the Institute for Theory and Computation Fellowship. Analyses presented in this paper were greatly aided by the following free software packages: yt (yt), NumPy (numpy_ndarray), SciPy (scipy), Matplotlib (matplotlib), and GitHub. We have also used the Astrophysics Data Service (ADS) and arXiv preprint repository extensively during this project and writing of the paper.
Appendix A Resolution comparison
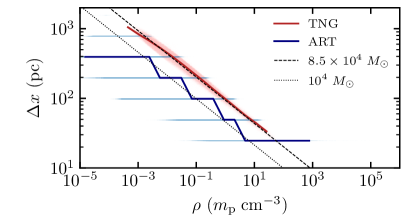
Figure 11 compares the resolution of our ART and TNG simulations using the snapshots at . The two simulations adopt different hydrodynamic frameworks—adaptive mesh refinement in ART and moving mesh in TNG (see Section 2)—making the direct comparison challenging.
The top panel in the figure shows the distribution of cell sizes as a function of gas density. In TNG, cell sizes continuously and linearly decrease with density with only a small scatter, owing to the adopted strategy of merging and splitting mesh cells to keep the gas mass within a factor of two from the target baryon resolution of . In ART, as the mesh cells are split into the octs of higher-level cells, the cell sizes change by factors of 2. The gas mass at a given level varies by orders of magnitude, with the median value roughly following a value of , i.e., 8 times higher mass resolution, or 2 times higher spatial resolution, than in TNG.
Even though the median mass and spatial resolution as a function of density is only moderately higher in ART, significantly more gas mass is resolved down to tens of pc scales. This is shown in the bottom panel of the figure, which compares cumulative gas mass fraction as a function of cell size. While in TNG, the median cell size in dense gas () is 100 pc, in ART, this value is closer to 25 pc. Note that this is mainly due to the difference in the ISM modeling: the effective EoS adopted in TNG produces a significantly higher pressure than in ART, preventing the formation of dense structures (see Section 3.1).
Appendix B Metallicity conversion
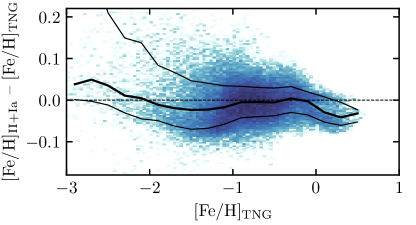
Observational measurements of stellar metallicities usually rely on iron abundances, [Fe/H] . Here we describe how we derive [Fe/H] from the metal mass fractions injected by SNe Type II and Ia for our analysis (e.g., in Figure 8). We calculate [Fe/H] from and because our ART situations do not explicitly track individual species, while both ART and TNG track the SNe Type II and Ia metal fractions.
The iron abundance is calculated as
| (B1) |
where is the total metal mass fraction injected by SNe, is iron mass fraction that depends on and , is the helium mass fraction, and are hydrogen and iron atomic weights, respectively, and the constant additive factor corresponds to the solar iron abundance, . To calculate , we use metallicity-dependent yield tables from TNG, described in pillepich18 and compute
| (B2) |
where is the iron-to-metals mass fraction injected by SNe Type Ia, and is the IMF-averaged iron-to-metals mass fraction of SNe Type II obtained by convolving mass- and metallicity-dependent iron and total metal yields with the chabrier03 IMF, :
| (B3) |
with the integrals taken between the minimal and maximal SNII progenitor masses adopted in TNG, 8–120. The resulting values of and are listed in Table 2; the dependence of on is linearly interpolated between the points sampled in the table.
The resulting derived iron abundances—labeled here as [Fe/H]II+Ia—are shown in Figure 12. The top panel compares these derived values with the explicitly tracked iron abundances in the TNG model. The values agree within 0.1 dex. The bottom panel shows the relation between [Fe/H] and the total metallicity. At these early times, , [Fe/H] are 0.4–0.6 dex below due to the low contribution of metals injected by SNe Ia, which produce most of the iron. Specifically, the median fractions of metal masses injected by SNe Ia by are in ART and in TNG. These differences reflect the differences in the star formation histories, specifically, significantly higher early SFRs in ART.
| SNe II | SNe Ia | |
|---|---|---|
| {0, 0.001, 0.004, 0.02} | — | |
| {0.0170, 0.0154, 0.0195, 0.0250} | 0.541 |