data2lang2vec: Data Driven Typological Features Completion
Abstract
Language typology databases enhance multi-lingual Natural Language Processing (NLP) by improving model adaptability to diverse linguistic structures. The widely-used lang2vec toolkit integrates several such databases, but its coverage remains limited at 28.9%. Previous work on automatically increasing coverage predicts missing values based on features from other languages or focuses on single features, we propose to use textual data for better-informed feature prediction. To this end, we introduce a multi-lingual Part-of-Speech (POS) tagger, achieving over 70% accuracy across 1,749 languages, and experiment with external statistical features and a variety of machine learning algorithms. We also introduce a more realistic evaluation setup, focusing on likely to be missing typology features, and show that our approach outperforms previous work in both setups.
data2lang2vec: Data Driven Typological Features Completion
Hamidreza Amirzadeh1,2 Sadegh Jafari1,3 Anika Harju1 Rob van der Goot1 1 IT University of Copenhagen, Denmark 2 Sharif University of Technology, Iran 3 Iran University of Science and Technology, Iran hamid.amirzadeh78@sharif.edu, sadegh_jafari@comp.iust.ac.ir {aniha, robv}@itu.dk
1 Introduction
Language typology databases contain information about specific languages, for example subject-verb order. These databases are not only used to document and study languages Yu et al. (2021), and their relations to each other Toossi et al. (2024), but have also shown to be beneficial for multi-lingual Natural Language Processing (NLP) applications. By informing the model explicitly about the differing structures to expect, the model can more easily adapt to other, even unseen languages Üstün et al. (2022).
In NLP, lang2vec Littell et al. (2017) toolkit is commonly used, probably because of its ease of use and the coverage of languages. lang2vec includes a collection of previously existing databases, namely: WALS Vastl et al. (2020) PHOIBLE Dediu and Moisik (2016) Ethnologue Eberhard et al. (2024), and Glottolog Hammarström et al. (2024), which are all converted to a uniform format, where each feature is represented as a binary feature. In total, it includes 4005 languages and 289 features, However, even after combining multiple sources, coverage is still only 28.9%.
In lang2vec, KNN is used to obtain values for all feature-language combinations, based on the hypothesis that languages that are similar to each other in many features will also be similar to each other for unknown features. They report an accuracy of 92.93 in a 10-fold setup with all included features. However, this solution leads to similar languages becoming more similar to each other and more distant languages more different. Hence, other works have made attempts to predict smaller sets of features based on texts from the target languages Barbieri et al. (2022), often combined with automated syntactic analyses He and Sagae (2019). However, a comprehensive analysis of a more complete feature set is missing. Hence, we contribute:
-
•
We propose a more realistic evaluation framework for typological feature prediction, focusing on identifying feature values that have gold-standard annotations but are likely to have been missing in lang2vec.
-
•
We evaluate text-based approaches to complete the whole inventory of lang2vec features as well as statistical features about the languages. We show that only certain features benefit from the POS tags, and statistical features are more informative.
-
•
We also provide a multi-lingual POS tagger with an estimated performance of accuracy for 1,749 languages, completed lang2vec data, and a toolkit to provide meta-data for languages. 111Our code is freely available at https://github.com/hamid-amir/data_lang2vec
2 Data and Methodolgy
2.1 Features
We use three groups of features for the prediction, each described in a paragraph below:
lang2vec features
Features directly extracted from the lang2vec database:
-
•
phylogeny: Use the fam feature from lang2vec. It has 3719 dimensions.
-
•
lang_id: ISO 639-3 code is a unique identifier for each language.
-
•
feat_id: The lang2vec identifier of the feature.
External features
We use the following continuous features:
-
•
lang_fam: The language family to which a language belongs. We use the main families of Glottolog for each language.
-
•
geo_lat: latitude location of language, taken from Glottolog 5.0.
-
•
geo_long: Longitude location of language, taken from Glottolog 5.0.
-
•
wiki_size: The Wikipedia size as reported by Wikipedia222https://en.wikipedia.org/wiki/List_of_Wikipedias.
-
•
num_speakers: Taken from the ASJP database Wichmann et al. (2022).
Furthermore, we add the following n-hot features:
-
•
aes_status: The Agglomerated Endangerment Status (AES) scale is derived from data provided by Glottolog 5.0 Hammarström et al. (2024), which, in turn, sourced its data from ELCat of Hawaii at Manoa (2024), UNESCO Atlas of the World’s Languages in Danger Moseley (2010), and Ethnologue Eberhard et al. (2024). It has 6 possible values.
-
•
lang_group: Joshi et al. (2020) propose a taxonomy based on the number of language resources for languages, they identify 6 groups.
-
•
scripts: since a language might be written in multiple scripts, we support this as an n-hot feature list. We take the information from Kargaran et al. (2024), and remove the Brai script (Braille), as it is annotated inconsistently.
-
•
feat_name: The features in lang2vec have short, sometimes overlapping names (e.g., S_ADPOSITION_BEFORE_NOUN). We split these names into word unigrams (by ‘_’) and use them as binary features.
Textual features
We choose to use the LTI LangID corpus Brown (2014) version 5 as a source for our textual data, as it has the widest language coverage to the best of our knowledge. We use the official mapping of retired ISO 639-3 codes and remove all texts that have an invalid iso639-3 language code as well as macro-languages. We end up with data for 2,134 languages (note that there is a total of 7,077 languages in ISO 639-3, of which approximately half is estimated to have a standard written form).
Text-based data is unsuitable for our classifier because of the large amount of features and lack of overlap across the languages, resulting in poor performance. Hence, we experiment with POS tags as features. We trained POS taggers using various multi-lingual models, including mBERT Devlin et al. (2019), twitter-XLM-roBERTa Barbieri et al. (2022), InfoXLM Chi et al. (2021), mDeBERTa-v3 He et al. (2020), XLM-roBERTa Conneau et al. (2020), mLUKE Yamada et al. (2020), and TwHIN-BERT El-Kishky et al. (2022). The models were trained on all UD V2.14 training splits (up to 200,000 words per treebank) using MaChAmp van der Goot et al. (2021). We jointly trained tokenization and POS tagging, evaluating on 150 languages. InfoXLM-large Chi et al. (2021) performed best on the 70 unseen languages. This model was further trained on full UD treebanks for final predictions (results in Appendix C).
2.2 Models
We train models using KNN, Logistic Regression, Gradient Boosting, Decision Trees, and Random Forests. For efficiency reasons, we first evaluated all classifiers on a small sample, and based on this focused mainly on KNN (baseline) and Random Forest (best performance).
3 Setup
We choose to use the syntax and phonology features of WALS as our main focus. In addition to performing a (random) k-fold split, a classifier is constructed to predict which features are likely to be missing, a task we refer to as “feature presence classification”. This way, we avoid overestimating our performance (e.g. predicting whether English has Subject-verb-object order is easier compared to most other features).
3.1 Feature Presence Classification
To train a predictor for identifying “likely missing values” a binary classifier is employed to predict whether a target feature for a specific language is present in lang2vec or not. We use the same features as we use for our prediction model (Section 2.1), except for the text-based features. We experimented with several common machine learning classifiers, and additionally applied hyperparameter optimization using the Optuna framework Akiba et al. (2019). After obtaining the best model, a dataset is created by ranking the present features based on the model’s confidence to estimate the final target feature predictions. We then used top 20% that was most likely to be missing for evaluation purposes (see also Appendix B for an overview of our setup).
3.2 Typological Features Classification
There are 125 features related to syntax and phonology in WALS that we aim to predict. We developed a distinct classifier for each of these 125 features. This approach was deliberately chosen because the designed and prepared features may not uniformly contribute to the prediction accuracy across different features. By employing distinct classifiers, we prevent weight sharing, which enhances the prediction performance for each specific feature.
The same feature set used in the "feature presence classifier" was employed, with the addition of POS tags. We use n-gram counts with n in the range of 3-5, resulting in approximately one million dimensions. To mitigate the impact of this high dimensionality, which could overshadow features with fewer dimensions, Principal Component Analysis (PCA) was applied for dimensionality reduction, introducing a hyperparameter to specify the number of dimensions to retain. We use Optuna Akiba et al. (2019) for hyperparameter optimization and feature selection.
| Target Feature | F1 Score (%) | Feature Selection | |||||||||||||||
| KNN | Ours |
lang_id |
feat_id |
geo_lat |
geo_long |
lang_group |
aes_status |
wiki_size |
num_speakers |
lang_fam |
scripts |
feat_name |
phylogeny |
phylo_n_comp |
LTI_LangID |
LTI_LangID_n_comp |
|
| S_VOX | 69.76 | ✓ | ✓ | ✓ | ✓ | ✓ | |||||||||||
| S_OBLIQUE_AFTER_VERB | 68.57 | ✓ | ✓ | ✓ | ✓ | ✓ | ✓ | 67 | |||||||||
| S_POSSESSIVE_DEPMARK | 69.39 | ✓ | ✓ | ✓ | ✓ | ✓ | ✓ | ✓ | ✓ | 81 | ✓ | 417 | |||||
| Average performance | 83.05 | 0.42 | 0.46 | 0.60 | 0.57 | 0.47 | 0.56 | 0.57 | 0.41 | 0.44 | 0.51 | 0.48 | 0.75 | 56 | 0.23 | 414 | |
| Target Feature | Missing Ratio | F1 Score (%) | |
| KNN | Ours | ||
| S_COM_VS_INST_MARK | 42.42 | ||
| S_SVO | 83.62 | ||
| S_VSO | 96.21 | ||
| S_OSV | 100.0 | ||
| S_SOV | 86.98 | ||
| S_OVS | 99.42 | ||
| S_ANY_REDUP | |||
| S_NUMCLASS_MARK | 73.76 | ||
| S_VOS | |||
| Avgerage performance | 76.91 | ||
4 Results and Evaluations
4.1 Feature Presence
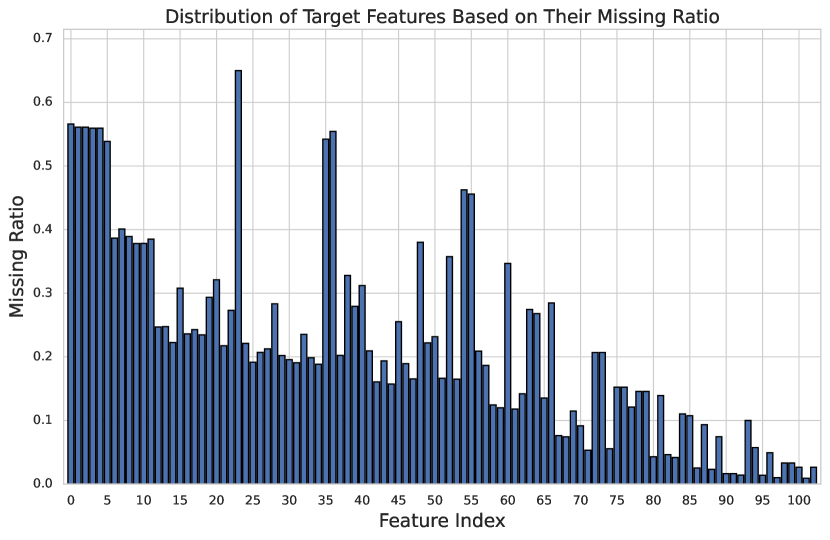
For the feature presence classifier, we initially created a sub-sample by selecting 300 random languages to extract data from. Subsequently, all classifiers (Section 2) were trained and optimized to evaluate their performance in predicting the probability of whether a feature and language combination is missing in lang2vec. Ultimately, the best-performing classifier, Gradient Boosting, was trained on all languages using the previously optimized settings, achieving the highest F1 score of 98.61. We then used this model to rank typological features based on the model’s confidence in classifying them as missing, selecting the top 20% for evaluation purposes. We introduce the “Missing Ratio”, which is calculated by dividing number of language features in a target feature determined to be missing (i.e. it is among top 20% probable missings) by the total number of languages in that target feature. Figure 1 plots the missing ratio distribution, showing a large disparity in the likelihood that certain features are missing. Additional results from other models and details on hyperparameter optimization can be found in Appendix A.
4.2 Typological Features Results
Results of k-fold
In the original lang2vec study, missing typological features were imputed using a simple KNN classifier, while the present features remained unchanged. To establish a baseline for our work, we applied the same KNN approach to predict the values of the 125 target features that were already present, enabling us to evaluate the accuracy of this method and compare it to ours. Table 1 displays several of our significant gains compared to the KNN method for predicting target features across all existing languages. Additionally, this table highlights the importance of each of our introduced features in predicting each target feature. The most effective feature is ’pylogency,’ useful for predicting 75% of target features, while POS tag features from LTI_langID are the least effective, contributing to only 23%. This aligns with the fact that language family is more informative, while POS tags feature are mainly useful for predicting word order. Since none of our curated features relate to phonetics, we cannot expect to do better in the related target features. Future work could introduce phonetic features to improve results.
Results of likely missing values
For a more realistic evaluation, we employed the same methodology but focused exclusively on the top 20% of the missing features identified in Section 3.1, rather than considering all present values. Table 2 presents the performance of both the KNN method and our approach for predicting target features with a missing ratio above 0.5 (see Figure 1). There are nine target features with a missing ratio exceeding 0.5, and for all of these critical features, our method either outperforms or performs on-par with the KNN approach.
5 Conclusion
In this paper, we focused on predicting missing values for syntax and phonology features in the lang2vec database. Besides the commonly used features from the lang2vec database itself, we experiment with statistical features of the languages and POS tags obtained from textual data. We showed that the features from lang2vec are moderately useful, but the external statistical features are most beneficial. The POS tagging features are only useful for selected features. We also provide a more realistic evaluation setting compared to previous work, which used k-fold; we propose to focus our evaluation metrics on features that are likely to be missing. Our proposed model with all features outperforms the KNN-based approach of lang2vec in both setups, especially for features with higher probabilities of missing values.
6 Limitations
We focused on WALS for predicting target features, though the same approach could be applied to other typological resources in lang2vec (SSWL and Ethnologue) or outside of lang2vec, for example, GramBank Haynie et al. (2023). Moreover, models were trained and optimized on a small subset of languages before applying the best one to the full dataset due to computational constraints. Finally, we focused on a subset of the world’s languages and used iso639-3 as the definitive label, acknowledging its limitations Morey et al. (2013).
7 Acknowledgements
We would like to thank Esther Ploeger for providing relevant references and initial ideas. Christian Hardmeier for his thoughts on POS tagging evaluation, and Lottie Rosamund Greenwood for maintaining the HPC at ITU. We also extend our gratitude to the Speech and Language Processing Lab, led by Professor Hosein Sameti at Sharif University of Technology, for providing part of the computational resources necessary for this work.
References
- Akiba et al. (2019) Takuya Akiba, Shotaro Sano, Toshihiko Yanase, Takeru Ohta, and Masanori Koyama. 2019. Optuna: A next-generation hyperparameter optimization framework. In Proceedings of the 25th ACM SIGKDD International Conference on Knowledge Discovery and Data Mining.
- Barbieri et al. (2022) Francesco Barbieri, Luis Espinosa Anke, and Jose Camacho-Collados. 2022. XLM-T: Multilingual language models in Twitter for sentiment analysis and beyond. In Proceedings of the Thirteenth Language Resources and Evaluation Conference, pages 258–266, Marseille, France. European Language Resources Association.
- Brown (2014) Ralf Brown. 2014. Non-linear mapping for improved identification of 1300+ languages. In Proceedings of the 2014 Conference on Empirical Methods in Natural Language Processing (EMNLP), pages 627–632, Doha, Qatar. Association for Computational Linguistics.
- Chi et al. (2021) Zewen Chi, Li Dong, Furu Wei, Nan Yang, Saksham Singhal, Wenhui Wang, Xia Song, Xian-Ling Mao, Heyan Huang, and Ming Zhou. 2021. InfoXLM: An information-theoretic framework for cross-lingual language model pre-training. In Proceedings of the 2021 Conference of the North American Chapter of the Association for Computational Linguistics: Human Language Technologies, pages 3576–3588, Online. Association for Computational Linguistics.
- Conneau et al. (2020) Alexis Conneau, Kartikay Khandelwal, Naman Goyal, Vishrav Chaudhary, Guillaume Wenzek, Francisco Guzmán, Edouard Grave, Myle Ott, Luke Zettlemoyer, and Veselin Stoyanov. 2020. Unsupervised cross-lingual representation learning at scale. In Proceedings of the 58th Annual Meeting of the Association for Computational Linguistics, pages 8440–8451, Online. Association for Computational Linguistics.
- Dediu and Moisik (2016) Dan Dediu and Scott Moisik. 2016. Defining and counting phonological classes in cross-linguistic segment databases. In LREC 2016: 10th International Conference on Language Resources and Evaluation, pages 1955–1962. European Language Resources Association (ELRA).
- Devlin et al. (2019) Jacob Devlin, Ming-Wei Chang, Kenton Lee, and Kristina Toutanova. 2019. BERT: Pre-training of deep bidirectional transformers for language understanding. In Proceedings of the 2019 Conference of the North American Chapter of the Association for Computational Linguistics: Human Language Technologies, Volume 1 (Long and Short Papers), pages 4171–4186, Minneapolis, Minnesota. Association for Computational Linguistics.
- Eberhard et al. (2024) David M. Eberhard, Gary F. Simons, and Charles D. Fennig. 2024. Ethnologue: Languages of the world. twenty-seventh edition.
- El-Kishky et al. (2022) Ahmed El-Kishky, Thomas Markovich, Serim Park, Chetan Verma, Baekjin Kim, Ramy Eskander, Yury Malkov, Frank Portman, Sofía Samaniego, Ying Xiao, et al. 2022. Twhin: Embedding the twitter heterogeneous information network for personalized recommendation. In Proceedings of the 28th ACM SIGKDD conference on knowledge discovery and data mining, pages 2842–2850.
- Hammarström et al. (2024) Harald Hammarström, Robert Forkel, Martin Haspelmath, and Sebastian Bank. 2024. Glottolog 5.0.
- Haynie et al. (2023) Hannah J. Haynie, Damián Blasi, Hedvig Skirgård, Simon J. Greenhill, Quentin D. Atkinson, and Russell D. Gray. 2023. Grambank’s typological advances support computational research on diverse languages. In Proceedings of the 5th Workshop on Research in Computational Linguistic Typology and Multilingual NLP, pages 147–149, Dubrovnik, Croatia. Association for Computational Linguistics.
- He et al. (2020) Pengcheng He, Xiaodong Liu, Jianfeng Gao, and Weizhu Chen. 2020. Deberta: Decoding-enhanced bert with disentangled attention. In International Conference on Learning Representations.
- He and Sagae (2019) Taiqi He and Kenji Sagae. 2019. Syntactic typology from plain text using language embeddings. In Proceedings of the First Workshop on Typology for Polyglot NLP.
- Joshi et al. (2020) Pratik Joshi, Sebastin Santy, Amar Budhiraja, Kalika Bali, and Monojit Choudhury. 2020. The state and fate of linguistic diversity and inclusion in the NLP world. In Proceedings of the 58th Annual Meeting of the Association for Computational Linguistics, pages 6282–6293, Online. Association for Computational Linguistics.
- Kamholz et al. (2014) David Kamholz, Jonathan Pool, and Susan Colowick. 2014. PanLex: Building a resource for panlingual lexical translation. In Proceedings of the Ninth International Conference on Language Resources and Evaluation (LREC’14), pages 3145–3150, Reykjavik, Iceland. European Language Resources Association (ELRA).
- Kargaran et al. (2024) Amir Hossein Kargaran, François Yvon, and Hinrich Schütze. 2024. GlotScript: A resource and tool for low resource writing system identification. In Proceedings of the 2024 Joint International Conference on Computational Linguistics, Language Resources and Evaluation (LREC-COLING 2024), pages 7774–7784, Torino, Italia. ELRA and ICCL.
- Littell et al. (2017) Patrick Littell, David R. Mortensen, Ke Lin, Katherine Kairis, Carlisle Turner, and Lori Levin. 2017. URIEL and lang2vec: Representing languages as typological, geographical, and phylogenetic vectors. In Proceedings of the 15th Conference of the European Chapter of the Association for Computational Linguistics: Volume 2, Short Papers, pages 8–14, Valencia, Spain. Association for Computational Linguistics.
- Morey et al. (2013) Stephen Morey, Mark W Post, and Victor A Friedman. 2013. The language codes of iso 639: A premature, ultimately unobtainable, and possibly damaging standardization.
- Morgado da Costa et al. (2016) Luis Morgado da Costa, Francis Bond, and František Kratochvíl. 2016. Linking and disambiguating swadesh lists: Expanding the Open Multilingual Wordnet using open language resources. In Proceedings of GLOBALEX 2016 Lexicographic Resources for Human Language Technology, 10th edition of the International Conference on Language Resources and Evaluation (LREC 2016), pages 29–36.
- Moseley (2010) Christopher Moseley. 2010. Atlas of the World’s Languages in Danger. Unesco.
- of Hawaii at Manoa (2024) University of Hawaii at Manoa. 2024. Catalogue of endangered languages.
- Swadesh (1955) Morris Swadesh. 1955. Towards greater accuracy in lexicostatistic dating. International journal of American linguistics, 21(2):121–137.
- Toossi et al. (2024) Hasti Toossi, Guo Qing Huai, Jinyu Liu, Eric Khiu, A Seza Doğruöz, and En-Shiun Annie Lee. 2024. A reproducibility study on quantifying language similarity: The impact of missing values in the uriel knowledge base. arXiv preprint arXiv:2405.11125.
- Üstün et al. (2022) Ahmet Üstün, Arianna Bisazza, Gosse Bouma, and Gertjan van Noord. 2022. UDapter: Typology-based language adapters for multilingual dependency parsing and sequence labeling. Computational Linguistics, 48(3):555–592.
- van der Goot et al. (2021) Rob van der Goot, Ahmet Üstün, Alan Ramponi, Ibrahim Sharaf, and Barbara Plank. 2021. Massive choice, ample tasks (MaChAmp): A toolkit for multi-task learning in NLP. In Proceedings of the 16th Conference of the European Chapter of the Association for Computational Linguistics: System Demonstrations, pages 176–197, Online. Association for Computational Linguistics.
- Vastl et al. (2020) Martin Vastl, Daniel Zeman, and Rudolf Rosa. 2020. Predicting typological features in WALS using language embeddings and conditional probabilities: ÚFAL submission to the SIGTYP 2020 shared task. In Proceedings of the Second Workshop on Computational Research in Linguistic Typology, pages 29–35, Online. Association for Computational Linguistics.
- Wichmann et al. (2022) Wichmann, Søren, Eric W. Holman, and Cecil H. Brown. 2022. The ASJP database (version 20).
- Yamada et al. (2020) Ikuya Yamada, Akari Asai, Hiroyuki Shindo, Hideaki Takeda, and Yuji Matsumoto. 2020. LUKE: Deep contextualized entity representations with entity-aware self-attention. In Proceedings of the 2020 Conference on Empirical Methods in Natural Language Processing (EMNLP), pages 6442–6454, Online. Association for Computational Linguistics.
- Yu et al. (2021) Dian Yu, Taiqi He, and Kenji Sagae. 2021. Language embeddings for typology and cross-lingual transfer learning. In Proceedings of the 59th Annual Meeting of the Association for Computational Linguistics and the 11th International Joint Conference on Natural Language Processing (Volume 1: Long Papers), pages 7210–7225, Online. Association for Computational Linguistics.
Appendix A Hyperameters of feature presence classifier
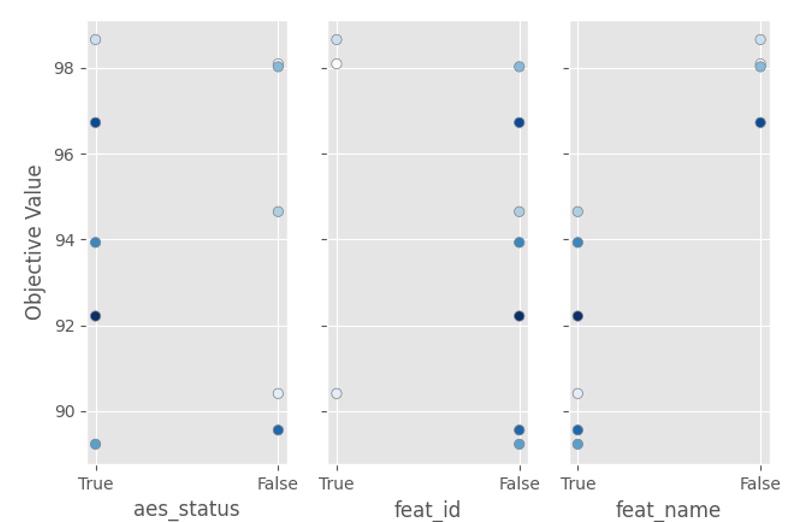
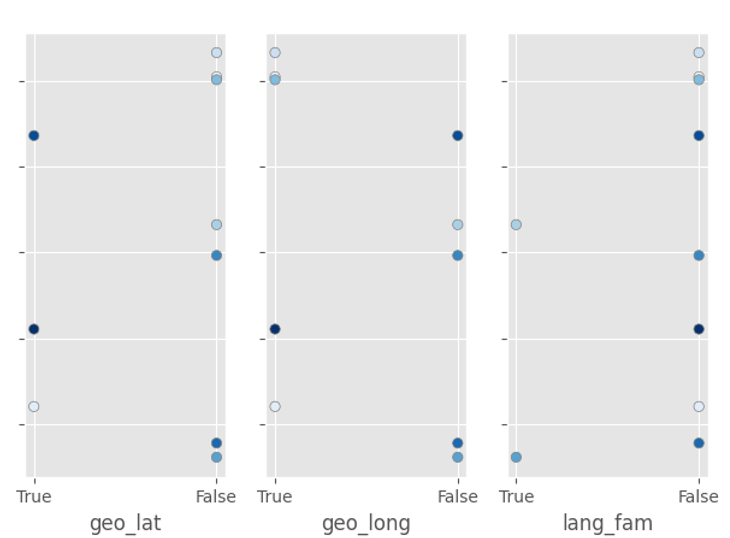
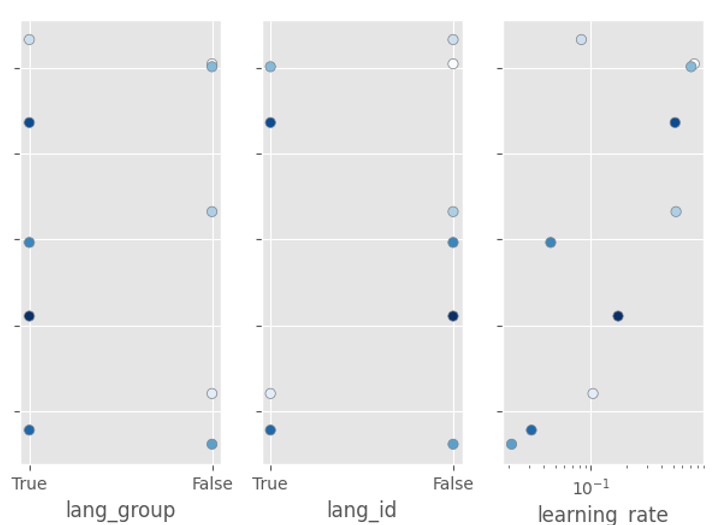
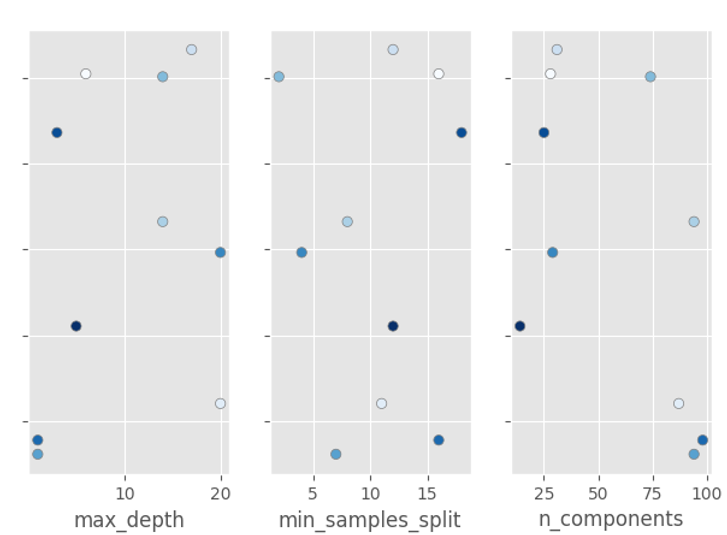
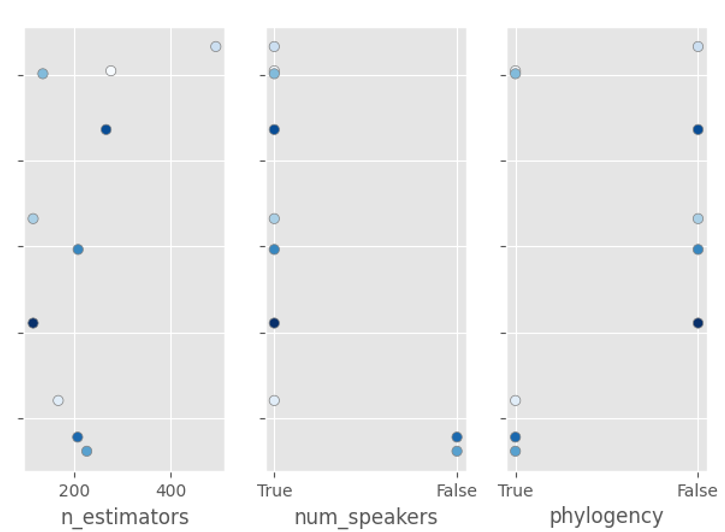
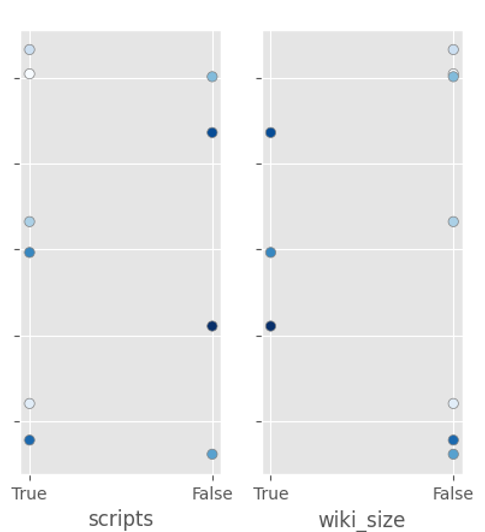
We use Optuna tools to select the suitable features and the best hyperparameters for the model for hyperparameter tuning and feature selection for missing values detection. Since hyperparameter tuning is costly, we randomly chose 300 languages from our dataset, extracting 39300 data points from these 300 languages. We use 5-fold cross-validation to validate the results. Figure 2 shows the history of features and hyperparameter tuning.
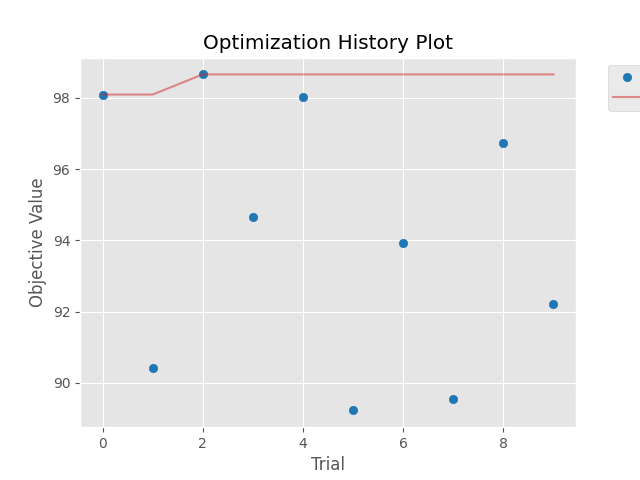
Additionally, you can see which features were selected (true means the feature is selected, and false means the feature is ignored) and the best hyperparameter values used in 10 trials.
| Classifier | # Iterations | F1 Score (%) | Feature Selection | ||||||||||||||
|
lang_id |
feat_id |
geo_lat |
geo_long |
lang_group |
aes_status |
wiki_size |
num_speakers |
lang_fam |
scripts |
feat_name |
phylogeny |
phylo_n_comp |
miltale |
miltate_n_comp |
|||
| Random Forest | ✓ | ✓ | ✓ | ✓ | 32 | ||||||||||||
| Logistic Regression | ✓ | ✓ | ✓ | ✓ | ✓ | ✓ | ✓ | 18 | |||||||||
| K-Nearest Neighbor | ✓ | ✓ | ✓ | ✓ | ✓ | ✓ | ✓ | 64 | |||||||||
| Gradient Boosting | 98.66 | ✓ | ✓ | ✓ | ✓ | ✓ | ✓ | 31 | |||||||||
| Decision Tree | ✓ | ✓ | ✓ | ✓ | ✓ | ✓ | |||||||||||
The best hyperparameters for the Gradient Boosting classifier are as follows: a maximum depth of 17, a minimum sample split of 12, a learning rate of 0.0836, 494 estimators, and 31 components for the phylogeny PCA dimensions. These settings have been found to optimize the classifier’s performance.
Appendix B Setup
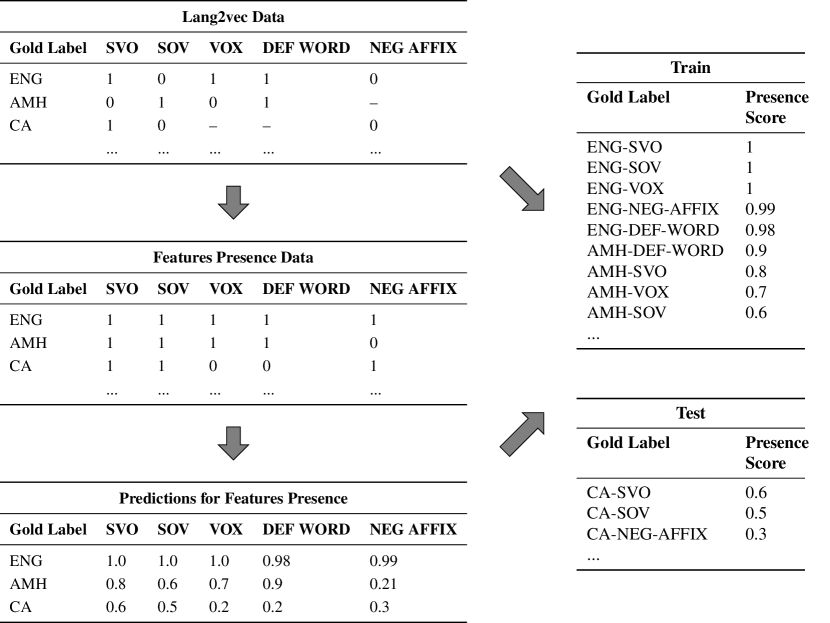
An overview of our setup is shown in Figure 9.
Appendix C Results of POS taggers
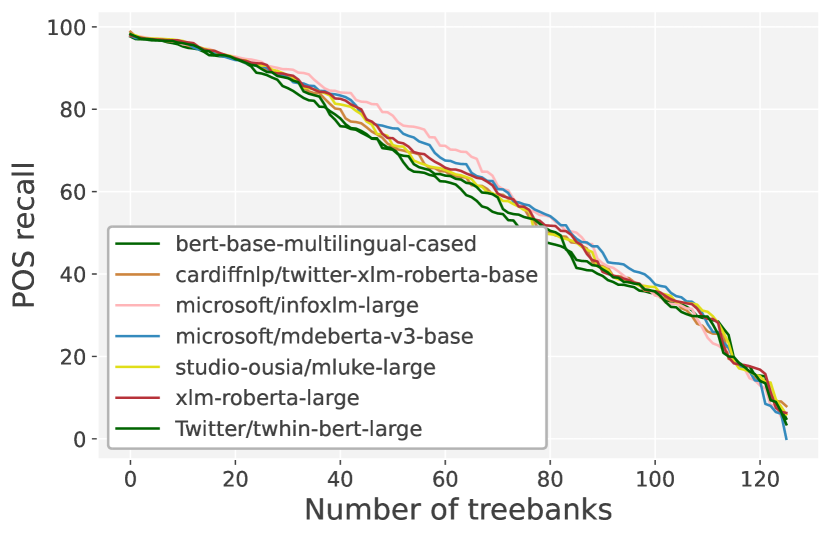
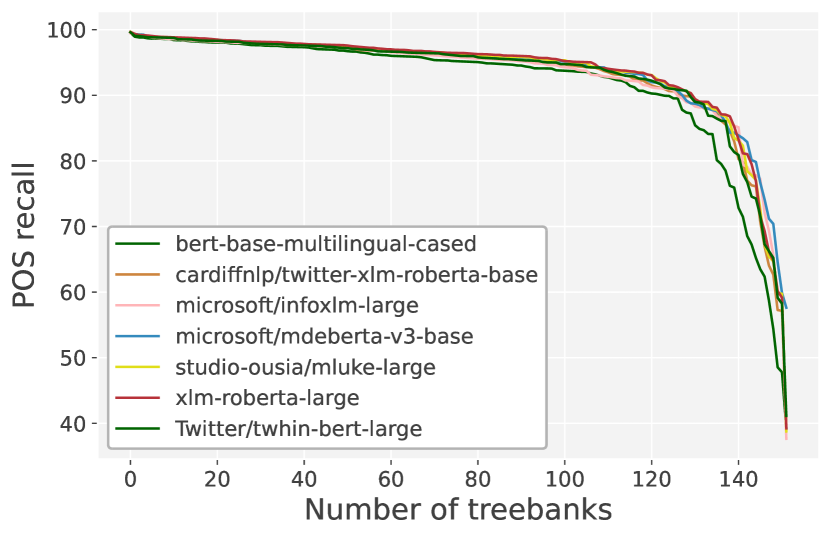
Figure 10 and Figure 11 show the performance of the POS taggers as recall. The average scores for each language model are reported in Table 4. We based our selection of the language model on the performance on the new (i.e. not included in training) treebanks, as they are most similar to the majority of the languages in our data.
To be able to do filtering based on POS tagging accuracy, we need to be able to predict the performance of the POS tagger for unlabeled instances (i.e. our plain text dataset). For this, we train machine learning classifiers with the following features:
-
•
Frequency as the probability for each POS tag
-
•
Average confidence (logit after softmax) over all data from the language
-
•
Percentage of UNK subwords
-
•
Average length of words in #subwords
-
•
Average length of words in #characters
- •
Based on these features, we evaluate a random forest classifier, an SVR classifier, a Lasso classifier, and an elastic search. We achieve the best performance with a random forest classifier with 200 estimators, with an average distance to the actual performance of 7.28. Although this might seem like a high number, we only use this to differentiate the data roughly in 2 parts: one where the POS tagger has learned some notion of the task for the target language and one where performance is so low that it is completely unusable.
Based on these scores, we have 1,749 languages with an estimated performance 70, and 559 with a score 80. For our studies, we focus on a more accurate sample of 559 languages.
| LM | avg. new | avg. seen |
|---|---|---|
| bert-base-multilingual-cased | 59.82 | 91.67 |
| cardiffnlp/twitter-xlm-roberta-base | 61.34 | 93.15 |
| microsoft/infoxlm-large | 63.35 | 93.21 |
| microsoft/mdeberta-v3-base | 62.88 | 93.91 |
| studio-ousia/mluke-large | 61.86 | 93.64 |
| xlm-roberta-large | 62.24 | 93.79 |
| Twitter/twhin-bert-large | 60.59 | 93.22 |