Evaluation of Spectrum Sharing Algorithms for Networks with Heterogeneous Wireless Devices
Abstract
As highlighted in the National Spectrum Strategy, Dynamic Spectrum Access (DSA) is key for enabling 6G networks to meet the increasing demand for spectrum from various, heterogeneous emerging applications. In this paper, we consider heterogeneous wireless networks with multiple 6G base stations (BS) and a limited number of frequency bands available for transmission. Each BS is associated with a geographical location, a coverage area, and a bandwidth requirement. We assume that clients/UEs are within the corresponding BS’s coverage area. To avoid interference, we impose that BSs with overlapping coverage areas must use different frequency bands. We address the challenging problem of efficiently allocating contiguous frequency bands to BSs while avoiding interference. Specifically, we define performance metrics that capture the feasibility of the frequency allocation task, the number of BSs that can be allocated within the limited frequency bands, and the amount of resources utilized by the network. Then, we consider five different DSA algorithms that prioritize BSs based on different features – one of these algorithms is known in the graph theory literature as Welsh-Powell graph colouring algorithm – and compare their performance using extensive simulations. Our results show that DSA algorithms that attempt to maximize the chances of obtaining a feasible frequency allocation – which have been widely studied in the literature – tend to under-perform in all other metrics.
Index Terms:
Dynamic spectrum access, 6G, Spectrum sharing, Coexistence, Wireless networksI Introduction
Emerging and future applications and wireless devices will increasingly rely on Dynamic Spectrum Access (DSA) algorithms that can manage the scarce spectrum resources efficiently. The importance of DSA for 6G networks was recently highlighted in the National Spectrum Strategy [1] and its Implementation Plan [2], as well as in reports by the Next G Alliance [3], Qualcomm [4], Ericsson [5], and many others. The development of DSA algorithms that can efficiently allocate frequency spectrum to wireless devices (e.g., 6G base stations) while avoiding harmful interference has been extensively investigated in the literature (see surveys [6, 7, 8]). Spectrum sharing is a challenging problem even in simple settings. For example, consider homogeneous networks in which every base station has the same bandwidth requirement. The problem of finding the minimum number of frequency bands that can accommodate multiple homogeneous base stations is known to be NP-hard [9]. Several heuristic DSA algorithms for homogeneous networks have been proposed in the graph theory literature [10, 11, 12, 13, 14, 15]. Heterogeneous networks, in which base stations may have diverse bandwidth requirements, are more complex and less studied. Recent focus has been on developing machine learning-based DSA algorithms for heterogeneous networks, e.g. [16, 17, 18].
In this paper, we evaluate different low-complexity DSA algorithms for heterogeneous 6G networks, and use extensive simulation results to gain insight into their performance trade-offs. We define performance metrics that capture the feasibility of the frequency allocation task, the number of base stations that can be allocated within the limited frequency bands, and the amount of resources utilized by the network. Then, we compare DSA algorithms that prioritize frequency allocation to base stations based on different features, including their number of potentially interfering neighbors, their coverage area, and their required bandwidth. Our simulation results show that DSA algorithms that prioritize frequency allocation to base stations with higher number of potentially interfering neighbors are more likely to achieve a feasible frequency allocation (for all base stations in the network) within the limited available frequency. This result agrees with the literature on homogeneous networks [10]. However, our results also show that, when the frequency allocation task is unfeasible, these DSA algorithms are more likely to leave a high number of unallocated base stations. Performance trade-offs associated with other DSA algorithms are discussed in Section IV.
II Problem Formulation
In this section, we discuss the network model, the DSA algorithm, and the performance metrics.
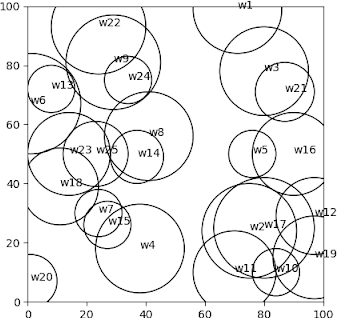
Network Model. We consider a network with multiple 6G base stations, called transmitters.111Though we refer to these as transmitters, our model can apply to either the uplink or the downlink in a Frequency Division Duplex (FDD) deployment or to a Time Division Duplex (TDD) deployment in which each base station operates as both a transmitter and receiver. Each transmitter is associated with a (potentially) different geographical location, coverage area, and frequency bandwidth. Let be the total number of (heterogeneous) transmitters in the network, and let be the total number of (contiguous) bandwidth units available for transmission. Each transmitter is associated with a location within a two-dimensional region , a bandwidth requirement of units, and a transmission coverage of meters. We assume that there is a single band manager for this region that collects transmitter requirements and runs a DSA algorithm to allocate bandwidth. We model the coverage of transmitter as a circle with radius centered at the location of the transmitter, as can be seen in Figure 1.222This models a scenario where transmitters have omni-directional antennas. Most of the following can be extended to allow for more general coverage regions. We assume that clients (also known as User Equipment) are within the corresponding transmitter’s coverage area.333Depending on the requirements of the users, the user deployment could be constrained to be sufficiently inside the coverage area to allow for ”guard regions” between different deployments to reduce interference. Hence, if two (or more) transmitters’ coverage areas overlap, they may cause harmful interference to one another. To avoid interference, we impose that transmitters with overlapping coverage areas must use different frequency bands. Naturally, non-overlapping transmitters may use the same frequency bandwidth, allowing for more efficient spectrum utilization. The effects of aggregate interference and time-varying coverage are not considered.
Dynamic Spectrum Access algorithm. The DSA algorithm has two main components: a sorting algorithm and a frequency allocation mechanism. The sorting algorithm takes the list of transmitters and re-arranges it in a particular order . Different sorting algorithms prioritize transmitters based on different performance metrics (introduced below). The frequency allocation mechanism assigns a contiguous bandwidth to each transmitter, one at a time, following the order . Specifically, for each transmitter , the frequency allocation mechanism assigns the units of available bandwidth with the lowest possible indices .444We assume that the bandwidth assigned to a transmitter must be contiguous. This can help to minimize the amount of spectrum needed for guard-bands, but does reduce flexibility in making assignments. We leave the issue of non-contiguous bandwidth for future work. Recall that transmitter may overlap with other transmitters, which may restrict its available bandwidth. Intuitively, the frequency allocation mechanism is attempting to pack transmitter bandwidths as much as possible, leaving contiguous available bandwidth for other transmitters in the network. The goal of the Dynamic Spectrum Access algorithm is to assign frequency bandwidths to all transmitters while avoiding harmful interference. The computational complexity of these DSA algorithms is dominated by the sorting algorithm which has complexity when using the Heap Sort approach. In Sec. III, we introduce different sorting algorithms and, in Sec. IV, we evaluate the impact of these different sorting algorithms.
Performance Metrics. To evaluate DSA algorithms based on different sorting algorithms, we employ the five metrics defined below. Given a DSA algorithm, a network with transmitters can be classified as feasible or unfeasible. The network is feasible if the DSA algorithm allocates frequency bands within the range for every transmitter . In this case, all transmitters are classified as admissible. The network is unfeasible if there is at least one inadmissible transmitter that is allocated frequency bands outside of the range, i.e., . Denote by the set of admissible transmitters and by the set of inadmissible transmitters. It follows that and .
-
•
Feasibility Indicator () is a binary metric that indicates whether the network is feasible () or unfeasible ().
-
•
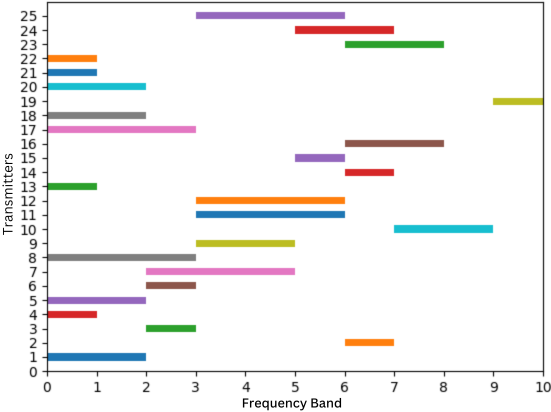
Bandwidth Usage () represents the highest bandwidth index allocated by the DSA algorithm to any of the transmitters . In Figure 2, we have . If the network is feasible (), then . If the network is unfeasible (), then . A low indicates that the DSA algorithm can effectively pack transmitters within the limited bandwidth.
-
•
Coverage Area () represents the sum of the coverage areas of every admissible transmitter
(1) where is a correction factor accounting for the fraction of the coverage area within the two-dimensional region . For instance, “w1” in Figure 1 has a .
-
•
Bandwidth-Coverage Product () is the sum of the product of the coverage radius and the bandwidth requirement of every admissible transmitter555If the coverage regions were not circles, one can define an “effective radius” for each region and still use this algorithm. Alternatively, one could also consider a related metric given by the product of the bandwidth and the coverage area.
(2) A high indicates a transmitter with stringent bandwidth requirement and large coverage radius , i.e., a transmitter that consumes a significant amount of resources. A high may also indicate an important transmitter that serves many clients and can support high quality of service.
-
•
Total Transmitters while Feasible () represents the maximum number of transmitters before the network becomes unfeasible. Recall that the sorting algorithm takes the list of transmitters and sorts it in a particular sequence . If the network is feasible, then all transmitters are admissible and Total Transmitters while Feasible is . Otherwise, let be the sorted index of the first inadmissible transmitter. It follows that transmitters in are all admissible, transmitter is inadmissible, and transmitters in may be admissible or inadmissible. In this case, .
These metrics provide a comprehensive framework for evaluating the performance of different DSA algorithms. For instance, Feasibility Indicator, , and Bandwidth Usage, , have direct connections with the system objective and resource allocation efficiency. Measuring the Total Transmitters while Feasible, , help us understand how close/far the DSA algorithm was of achieving network feasibility.
III Sorting Algorithms
In this section, we develop five sorting algorithms that prioritize transmitters according to different characteristics. The combination of each sorting algorithm with the frequency allocation mechanism described in Sec. II composes a different DSA algorithm. We will use numerical results to evaluate these different DSA algorithms in Sec. IV. The description of the sorting algorithms is below:
-
•
Most-Overlaps Sort prioritizes transmitters in descending order666Ties in every sorting algorithm are broken arbitrarily. For example, by prioritizing transmitters with lowest index of number of coverage overlaps. The number of coverage overlaps associated with transmitter represents the number of neighboring transmitters that can cause harmful interference to transmitter . The number of overlaps is equivalent to the degree of the conflict graph [19] underlying the network under consideration. In the context of graph theory, the sorting algorithm that prioritizes transmitters in descending order of degree is called the Welsh-Powell graph colouring algorithm [10] and is widely used (together with its variants, including the DSATUR algorithm [11, 12]) to find the minimum number of frequency bands needed to make a network feasible. The main idea of this algorithm is to start the frequency allocation process with the most challenging transmitters.
-
•
Bandwidth-Coverage Sort prioritizes transmitters in descending order of bandwidth-coverage product . Intuitively, this prioritizes transmitters that need the most resources. Transmitters with high may be considered more important, as they may be able to serve more clients and/or provide superior quality of service.
-
•
Least-Bandwidth Sort prioritizes transmitters in ascending order of bandwidth requirement . This algorithm contrasts with the previous algorithms in that it starts the frequency allocation process with the least challenging transmitters.
-
•
Least-Coverage Sort prioritizes transmitters in ascending order of coverage radius .
-
•
Random Sort arranges the transmitters randomly. Random sort serves as a benchmark for comparison with other sorting algorithms.
These sorting algorithms provide diverse strategies for transmitter allocation. Next, we simulate and compare these strategies, highlighting their performance tradeoffs in various heterogeneous network scenarios. Recall that the computational complexity of these algorithms is .
IV Simulation Results
In this section, we evaluate five DSA algorithms in terms of the performance metrics described in Sec. II, namely the Feasibility Indicator, , the Bandwidth Usage, , the Coverage Area, , and the Bandwidth-Coverage Product, . Each DSA algorithm is a combination of the frequency allocation mechanism described in Sec. II with one of the five sorting algorithms developed in Sec. III, namely Bandwidth-Coverage Sort, Most-Overlaps Sort, Least-Bandwidth Sort, Least-Coverage Sort, and Random Sort. The DSA algorithm is named after the sorting algorithm.
Network Simulator. To evaluate the DSA algorithms, we use an object-oriented, Python-based simulator based on Monte-Carlo methods. Specifically, given the total number of bandwidth units available for transmission and the total number of transmitters , the simulator randomly assigns a geographical location, a required bandwidth , and a coverage radius for each transmitter . The location is assigned uniformly at random within a two-dimensional region defined as a meters square. The required bandwidth and coverage radius are assigned uniformly at random from specific ranges. The ranges of and and the values of and are as specified in Table I, unless noted otherwise. After establishing the network setup, the simulator runs the five DSA algorithms and computes their associated performance metrics. To account for the effects of different network setups, for each set of network parameters, we create at least randomly generated networks setups and display in Figures 3, 4, and 5 the average of the metrics associated with these multiple simulation runs. The error bars in Figures 3, 4, and 5 represent the standard deviation.
| Parameter | Value |
|---|---|
| Geographical Area | |
| Number of Transmitters | 25 |
| Total Available Bandwidth | 10 units |
| Bandwidth of Transmitter | |
| Coverage of Transmitter | |
| Number of Simulation Runs |
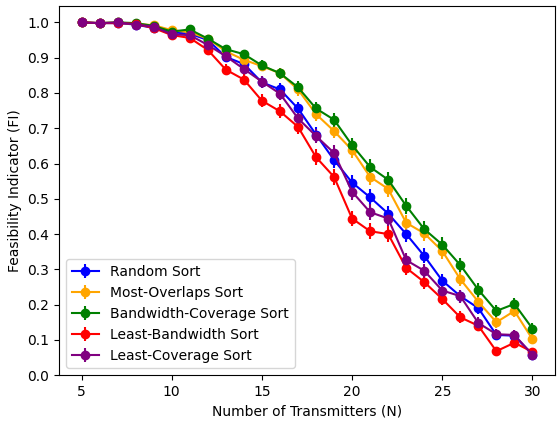
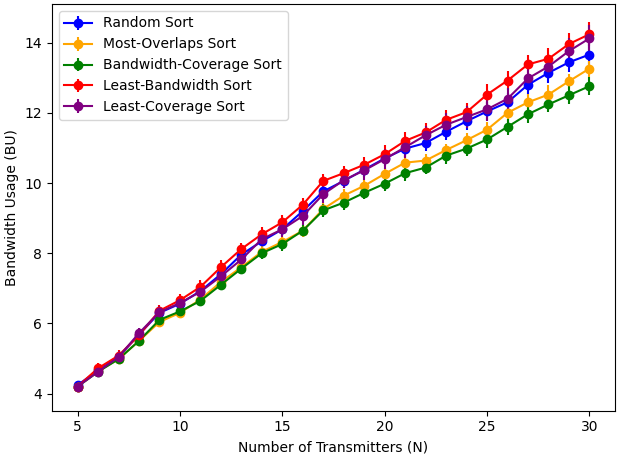
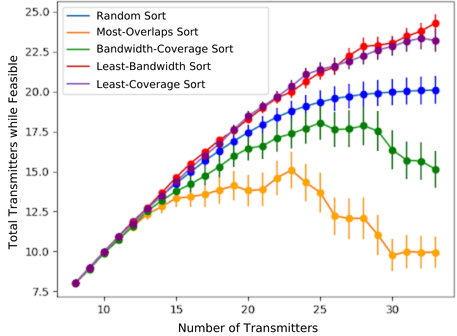
Numerical Results. In Figures 3(a)-(d), we simulate networks with increasing number of transmitters and display the performance of DSA algorithms in terms of the Feasibility Indicator, , Bandwidth Usage, , and the Total Transmitters while Feasible, . Figures 3(a), (b), and (c) show , , and , respectively, associated with networks with the exact same parameters. Interestingly, the best-performing DSA algorithms in Figures 3(a) and (b) are the worse in Figure 3(c). Figures 3(a) and (b) show that Most-Overlaps Sort and Bandwidth-Coverage Sort outperform Least-Bandwidth Sort and Least-Coverage Sort in terms of the average and in every simulation, with the performance gap becoming more pronounced for networks with large number of transmitters . This result agrees with the graph theory literature [10, 11, 12] in that starting frequency allocation with the most challenging transmitters (e.g., the transmitters with most overlaps) is a promising approach for minimizing the bandwidth usage, thus improving the chances of feasibility. In the graph theory literature, the minimum bandwidth usage is called the chromatic number of the graph/network.
In contrast, Figure 3(c) shows that Least-Coverage Sort and Least-Bandwidth Sort outperform Most-Overlaps Sort and Bandwidth-Coverage Sort in terms of the Total Transmitters while Feasible in every simulation, with the performance gain being more prominent for networks with larger . Interestingly, Most-Overlaps Sort and Bandwidth-Coverage Sort show a significant decline in their ability to allocate transmitters within the available bandwidth as the number of transmitters increases, while Least-Bandwidth Sort and Least-Coverage Sort continue to benefit from a larger number of transmitters.
Intuitively, this effect can be explained by the manner in which the different sorting algorithms prioritize the increasing number of transmitters . Least-Bandwidth Sort and Least-Coverage Sort prioritize transmitters with the lowest bandwidth requirements and with the smallest coverage radius , respectively, allowing early frequency allocations to occupy minimal resources. As a result, a large number of transmitters can be allocated while the network remains feasible, leading to a large . Latter frequency allocations have high bandwidth requirements and/or high coverage areas , increasing the chances of the network becoming unfeasible, leading to a low . Most-Overlaps Sort and Bandwidth-Coverage Sort prioritize transmitters with most coverage overlaps and highest Bandwidth-Coverage Product, respectively. By starting with the most challenging transmitters, these algorithms increase the chances of finding a feasible set of frequency allocations for all transmitters, leading to a large . On the other hand, this prioritization also increases the chances of the network becoming unfeasible with only a few allocated transmitters, leading to a low . Prioritizing the most challenging transmitters leads to “all-or-nothing” results in which the network is either feasible (with ) or unfeasible with low . While Bandwidth-Coverage Sort prioritizes transmitters that consume most resources, it doesn’t necessarily select those with the most overlaps, which have the lowest potential for spectrum sharing, explaining the relatively better performance of Bandwidth-Coverage Sort when compared to Most-Overlaps Sort.
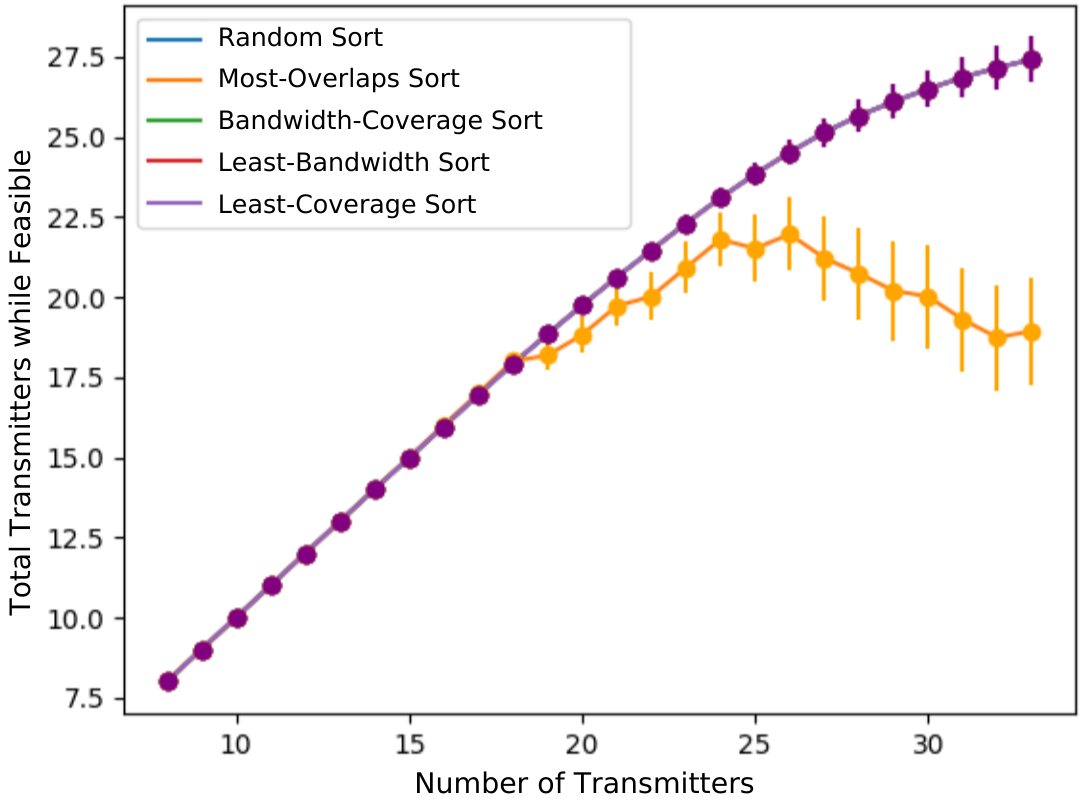
To further investigate the behavior of Most-Overlaps Sort, in Figure 3(d) we show the results of a homogeneous networks with meters and units, . In this homogeneous network, Least-Coverage Sort, Least-Bandwidth Sort, Bandwidth-Coverage Sort, and Random Sort are rendered equivalent, and they all outperform Most-Overlaps Sort in terms of the Total Transmitters while Feasible , suggesting that DSA algorithms that prioritize transmitters with most overlaps, or high-degrees, can be extremely inefficient. Notice that as increases, new transmitters with high-degree are prioritized by Most-Overlaps Sort, affecting the frequency allocation of transmitters with lower degrees, thereby (potentially) further decreasing .
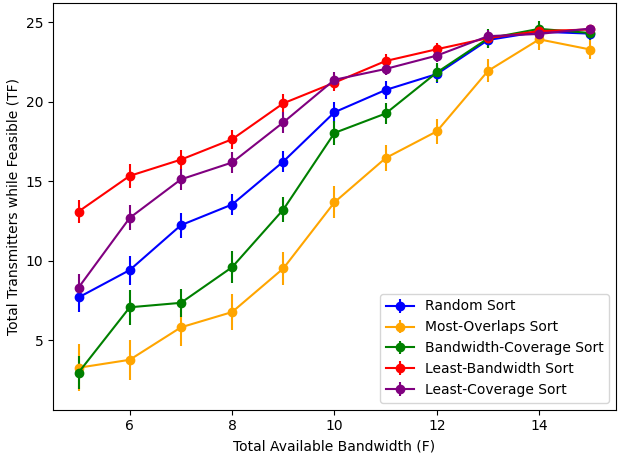
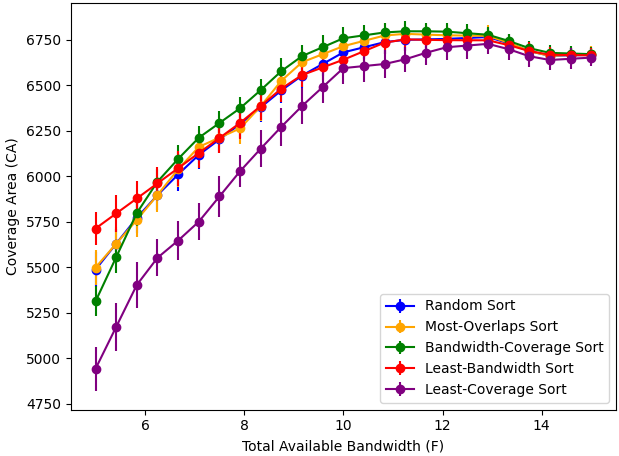
In Figures 4(a) and (b), we simulate networks with increasing total available bandwidth and show the performance of DSA algorithms with respect to Total Transmitters while Feasible, , and the Coverage Area, . In general, as the available spectrum increases, all DSA algorithms are able to allocate more admissible transmitters which, in turn, increases the coverage area. When the available spectrum is high enough , most of the transmitters become admissible, and the performance gaps between the different DSA algorithms is reduced.
The results in Figure 4(a) align with Figure 3(b), showing that Least-Bandwidth Sort and Least-Coverage Sort outperform Most Overlaps Sort and Bandwidth-Coverage Sort in terms of . As expected, the results in Figure 4(b) show that Least-Coverage Sort under-performs in terms of coverage area . Least-Bandwidth Sort achieves the highest in every simulation and the highest in bandwidth-constrained networks with since it prioritizes transmitters with the lowest bandwidth requirements , thereby maximizing the number of admissible transmitters within and the corresponding coverage area. When , the coverage area of Least-Bandwidth Sort is comparable with the benchmark algorithm, Random Sort, and Bandwidth-Coverage Sort leads by a significant margin. Bandwidth-Coverage Sort considers both and , ensuring, to some extent, that transmitters with large coverage areas are prioritized, leading to high .
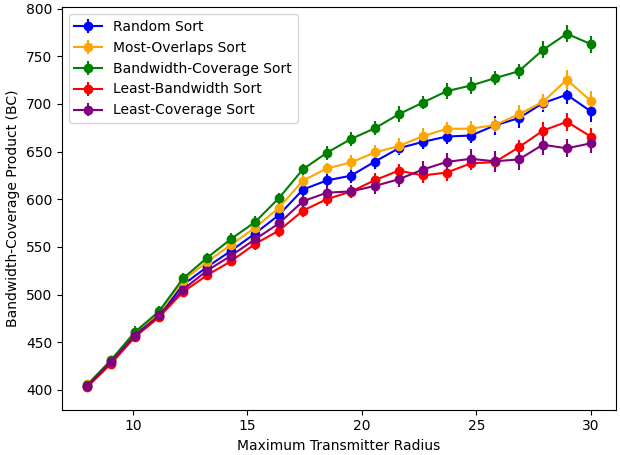
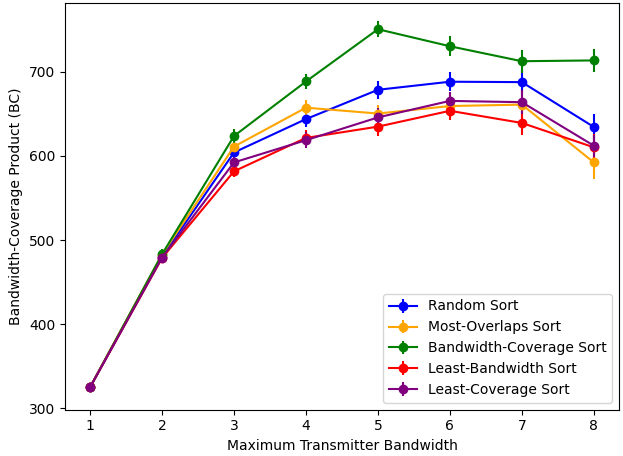
In Figures 5(a) and (b), we simulate networks with increasing heterogeneity and display the performance of the DSA algorithms in terms of their Bandwidth-Coverage Product, . Recall that a high indicates a transmitter that consumes a significant amount of resources, which may represent an important transmitter that can (potentially) serve many receivers and can support high quality of service. Hence, can serve as an indicator of whether the DSA algorithm can allocate important transmitters. Figure 5(a) and (b) considers transmitters with increasing coverage radius and bandwidth requirements , respectively. As expected, Bandwidth-Coverage Sort outperforms other DSA algorithms in every simulation, with the improvement becoming more noticeable as the networks become more heterogeneous. Least-Bandwidth Sort and Least-Coverage Sort attain the lowest , consistently performing below the benchmark algorithm. Interestingly, Most-Overlaps Sort also under-performs in terms of , with a performance that is either close to or below Random Sort, as can be seen in Figure 5(b) when . These results suggest that neither Least-Bandwidth Sort, Least-Coverage Sort, or Most-Overlaps Sort are good options for facilitating important transmitters which support a higher quality of service.
Figure 5(b) shows that the DSA algorithms exhibit a sharp decrease in when . This decline arises from the increased likelihood of encountering transmitters with demanding bandwidth requirements. These demanding transmitters limit the total number of transmitters that may be allocated feasibly , indirectly reducing the overall . Notice that Bandwidth-Coverage Sort, which prioritizes these demanding transmitters, experiences this decline earlier than other DSA algorithms.
Summary of Numerical Results. Figures 3, 4, and 5 compare different DSA algorithms in terms of feasibility, , number of transmitters allocated before the network becomes unfeasible, , and resource utilization, , , and . Least-Coverage Sort and Least-Bandwidth Sort maximize the number of transmitters allocated before the network becomes unfeasible, having a comparable performance in most simulations. As expected, Least-Bandwidth Sort outperforms Least-Coverage Sort in terms of coverage area . Most-Overlaps Sort and Bandwidth-Coverage Sort maximize the chances of feasibility. Bandwidth-Coverage Sort outperforms Most-Overlaps Sort – which is a popular algorithm in the literature – in the vast majority of the simulations.
V Final Remarks
In this paper, we considered heterogeneous 6G networks with base stations (called transmitters) and a total of frequency bands available for transmission. Each transmitter is associated with a geographical location, a coverage radius , and a bandwidth requirement . We used extensive simulation results to evaluate the performance of different DSA algorithms in various heterogeneous networks. Based on the results, we separate the DSA algorithms in two classes: (i) Most-Overlaps Sort and Bandwidth-Coverage Sort, which prioritize the most challenging (i.e., resource hungry) transmitters; and (ii) Least-Coverage Sort and Least-Bandwidth Sort, which prioritize transmitters that use minimal resources. Class (i) leads to “all-or-nothing” results. They achieve the highest values of a feasible frequency allocation () for all transmitters, which can be seen as the ultimate objective of DSA. However, when the network is unfeasible, these algorithms tend to significantly under-perform when compared with Class (ii), especially in terms of the number of transmitters, , allocated while the network was feasible. Interesting extensions include consideration of base stations with directional antennas, time-varying bandwidth requirements and that can enter/leave the network.
References
- [1] “National Spectrum Strategy,” online: https://www.ntia.gov/sites/default/files/publications/national_spectrum_strategy_final.pdf, 2023.
- [2] “National Spectrum Strategy Implementation Plan,” online: https://www. ntia.gov/sites/default/files/publications/national-spectrum-strategy-implementation-plan.pdf, 2024.
- [3] “Spectrum access mechanisms,” online: https://nextgalliance.org/white_papers/spectrum-access-mechanisms/, 2024.
- [4] “Unlocking spectrum innovations for 5G Advanced and 6G to support future wireless growth,” online: https://www.qualcomm.com/ news/onq/2023/05/unlocking-spectrum-innovations-for-5g-advanced-and-6g-to-support-future-wireless-growth, 2023.
- [5] “6G RAN: key building blocks for new 6G radio access networks,” online: https://www.ericsson.com/en/blog/2024/5/future-6g-radio-access-network-design-choices, 2023.
- [6] I. F. Akyildiz, W.-Y. Lee, M. C. Vuran, and S. Mohanty, “Next generation/dynamic spectrum access/cognitive radio wireless networks: a survey,” Computer Networks, 2006.
- [7] W. S. H. M. W. Ahmad, N. A. M. Radzi, F. Samidi, A. Ismail, F. Abdullah, M. Z. Jamaludin, and M. Zakaria, “5G technology: Towards dynamic spectrum sharing using cognitive radio networks,” IEEE Access, 2020.
- [8] A. De Domenico, E. Calvanese Strinati, and M.-G. Di Benedetto, “A survey on MAC strategies for cognitive radio networks,” IEEE Communications Surveys & Tutorials, 2012.
- [9] M. Garey, D. Johnson, and L. Stockmeyer, “Some simplified NP-complete graph problems,” Theoretical Computer Science, 1976.
- [10] D. J. A. Welsh and M. B. Powell, “An upper bound for the chromatic number of a graph and its application to timetabling problems,” The Computer Journal, vol. 10, no. 1, pp. 85–86, 1967.
- [11] D. Brélaz, “New methods to color the vertices of a graph,” Communications of the ACM, vol. 22, no. 4, p. 251–256, 1979.
- [12] N. Dupin, “Matheuristic variants of DSATUR for the vertex coloring problem,” in Proc. of Metaheuristics International Conference, 2024.
- [13] W. Wang and X. Liu, “List-coloring based channel allocation for open-spectrum wireless networks,” in Proc. of IEEE VTC, 2005.
- [14] E. Driouch, W. Ajib, and A. Ben Dhaou, “A greedy spectrum sharing algorithm for cognitive radio networks,” in Proc. of IEEE ICNC, 2012.
- [15] D. Stojadinovic, P. Netalkar, C. E. C. Bastidas, I. Kadota, G. Zussman, I. Seskar, and D. Raychaudhuri, “A spectrum consumption model-based framework for dsa experimentation on the COSMOS testbed,” in Proc. of ACM WiNTECH, 2021.
- [16] E. Atimati, D. Crawford, and R. Stewart, “Intelligent shared spectrum coordination in heterogeneous networks,” in Proc. of IEEE VCC, 2023.
- [17] N. Zhao, Y.-C. Liang, D. Niyato, Y. Pei, M. Wu, and Y. Jiang, “Deep reinforcement learning for user association and resource allocation in heterogeneous cellular networks,” IEEE Trans. Wireless Commun., 2019.
- [18] O. Naparstek and K. Cohen, “Deep multi-user reinforcement learning for dynamic spectrum access in multichannel wireless networks,” in Proc. of IEEE GLOBECOM, 2017.
- [19] X. Zhou, Z. Zhang, G. Wang, X. Yu, B. Y. Zhao, and H. Zheng, “Practical conflict graphs in the wild,” IEEE/ACM Trans. on Netw., 2015.