Untangling the Raman spectrum of cubic and tetragonal \ceBaZrO3
Abstract
Raman spectroscopy is a widely used experimental technique to study the vibrational properties of solids. Atomic scale simulations can be used to predict such spectra, but trustworthy studies at finite temperatures are challenging, mainly due to the requirement of accurate and computationally efficient models for the dielectric susceptibility. Here, we have made use of molecular dynamics (MD) simulations together with a density functional theory (DFT) based model for the dielectric susceptibility to determine the Raman spectrum of barium zirconate, \ceBaZrO3 (BZO), a well-studied oxide perovskite. At ambient conditions, where the system is cubic, we find excellent agreement with experimentally measured Raman spectra. Our study establishes that the relatively sharp spectra seen experimentally are due to second-order scattering. At higher pressures, where BZO is tetragonal, all first-order Raman active modes are identified. Additionally, slightly below the phase transition, in the cubic phase, a broad “central Raman peak” appears. The origin of this type of peak is controversial and extensively debated in connection to the dynamics of the halide perovskites. Here, we show that it is also present in a “hard” oxide perovskite, and it originates from the highly overdamped R-tilt mode in the cubic structure.
I Introduction
Raman spectroscopy is a widely used non-destructive experimental technique to study the vibrational dynamics of molecules and condensed-phase systems [1, 2, 3]. Commonly, first-principles calculations of the Raman spectrum are carried out via a first-order expansion of the dielectric susceptibility in terms of harmonic phonons [4, 5, 6]. In order for the mode to have a non-zero (first-order) contribution to the Raman spectrum, it is necessary for the dielectric susceptibility to have a non-zero first-order derivative with respect to displacements along the phonon mode. Which and how many phonon modes that have a non-zero contribution, can be deduced from the symmetry of the crystal [7].
If symmetry forbids first-order scattering, such as in cubic crystals, inclusion of higher-order terms in the susceptibility expansion becomes a necessity. Contributions from second-order terms were early on explored computationally using a shell polarizability model [8] and more recently through a direct expansion of the dielectric susceptibility fitted to DFT data [9]. In these studies the anharmonicity and temperature dependence of the phonon coordinates were included by a diagrammatic approach.
Alternatively, the MD simulation technique can be used to obtain the Raman spectrum [10, 11]. The time-correlation function of the dielectric susceptibility for the system is then evaluated and the Raman spectrum is obtained by a Fourier transform [12, 13, 14, 15, 16]. The benefit of this approach is that it captures all anharmonicity as well as higher-order scattering of the Raman spectrum. However, for the technique to be accurate and numerically efficient both the force evaluation in the MD simulation and the computation of the dielectric susceptibility tensor have to be done efficiently and accurately [17, 16].
Perovskite oxides (\ceABO3) constitute a broad and important class of multifunctional materials, known for their large variety in chemical composition and of different structural distortions. Raman scattering has been extensively used to study the structural dynamics in these materials, see, e.g., Refs. [18, 19, 20, 21, 22]. At ambient pressure and high temperatures, many perovskite oxides are cubic but upon cooling they undergo one or several phase transitions to structures with lower symmetries. A rare exception is barium zirconate, \ceBaZrO3 (BZO), which is claimed to remain cubic down to \qty0 [23, 22, 24, 25]. However, its Raman spectrum is intense and shows sharp, well-defined features reminiscent of first-order scattering [26, 27, 28, 29, 30, 31, 22, 32, 33]. This is unexpected, as first-order Raman peaks are not allowed by symmetry in a cubic system.
It has been suggested that the rich Raman spectrum of BZO is due to nanodomains [26, 27] or locally distorted regions [28, 29]. When increasing the pressure at room temperature, Chemarin et al. [26] found that the intense Raman spectrum decreased in amplitude and tended to disappear when approaching \qty9\giga. They argued that this was due to the nanodomains being forced to interact more strongly with increasing pressure, which finally led to a continuous structure with long-range order. Above \qty9\giga, a clear spectral change was observed, which they associated with a phase transition.
Another reason for the presence of sharp and well-defined features in the Raman spectrum at ambient pressure could be second-order Raman processes [30]. These processes are allowed by symmetry but they are generally weaker in intensity compared with first-order scattering. Two recent Raman studies on BZO single crystals [22, 32] concluded that the Raman spectrum of BZO at room temperature could be explained by second-order scattering. Furthermore, it was also stated that local disorder could still play a role in the general intensity of the Raman spectrum [22].
The pressure-dependent Raman scattering at room temperature was studied by Chemarin et al. [26] using a polycrystalline sample. They found two structural phase transitions, one at \qty9\giga and one at \qty23\giga. Recently, Gim et al. [32] and Toulouse et al. [33] also investigated the pressure dependence, now using single crystal samples. Gim et al. [32] found two transitions, from cubic to a rhombohedral phase at \qty8.4\giga and then from the rhombohedral to a tetragonal phase at \qty19.2\giga. On the other hand, Toulouse et al. [33] found a single phase transition, from the cubic to a tetragonal phase at \qty10\giga. They also discussed why a second phase transition is not expected for this system, at least for pressures below \qty45\giga.
Here, we compute the Raman spectrum for BZO via MD simulations. For the potential energy surface we use the neuroevolution potential (NEP) model from Ref. 34 and for the dielectric susceptibility we employ a DFT based model, recently developed using the tensorial neuroevolution potential (TNEP) framework [16].
We consider the cubic phase of BZO at ambient conditions, as well as under pressure including the transition to a tetragonal phase. After correcting for the classical statistics in our MD approach we obtain excellent agreement with recent experimental Raman studies of single crystals of BZO at ambient conditions. The results are compared with the corresponding results from an expansion of the dielectric susceptibility to second order in terms of harmonic phonons. This allows us to assign features and peaks in the Raman spectra to specific phonon modes. Above the phase transition pressure, in the tetragonal phase, all first order Raman peaks are identified. Finally, the phase transition is scrutinized, including a study of the “central peak” in the Raman response.
II Theory
II.1 Raman spectrum
We consider off-resonance Raman spectroscopy [35, 8]. The frequency of the incoming (and outgoing ) light is assumed to be much larger compared to the phonon frequencies of the crystal and it is also assumed to be smaller than any electronic excitations in the material. The dielectric susceptibility tensor can then be determined in the so-called static ion-clamped limit [36, 37]. Under these conditions the measured Raman intensity is proportional to
| (1) |
Here, is the Raman shift, and and are the polarization of the incoming and outgoing light, respectively, where , , , as well as are Cartesian indices. Furthermore, is the Raman lineshape, given by
| (2) |
where the time-dependence of the dielectric susceptibility originates from the motion of the atoms in the crystal. We note that the incoming and outgoing polarization of the light picks out the elements of the dielectric susceptibility, as indicated in Eq. 1.
The Raman scattering is usually discussed in terms of the order of the scattering. The contribution of different orders can be analyzed by Taylor expanding the dielectric susceptibility in terms of the displacements of the atoms from their equilibrium positions,
| (3) |
where , and so on denote derivatives of the dielectric susceptibility with respect to atomic displacements . The indices and enumerate the atoms, while and denote Cartesian directions. The order is then defined by how many atomic displacements that are involved in the correlation function for the Raman lineshape in Eq. 2. The first-order scattering contribution is obtained from the second term in the expansion of the dielectric susceptibility in Eq. 3, the second-order contribution from the third term and so on (see Appendix A for more details). We note that in a cubic system the first order derivative is always zero due to the symmetry of the crystal, and there is thus no first-order scattering.
Most of our results for the Raman spectrum will be based on a direct evaluation of the time-correlation function in Eq. 2, based on machine learning-accelerated MD simulations using NEP [34] and TNEP models [16]. These results are denoted as MD. We will also show some results based on the expansion of Eq. 3 to second order. We use the same TNEP model to evaluate the derivatives, and the corresponding results will be denoted as DSE, the dielectric susceptibility expansion.
III Results
III.1 Room temperature spectrum
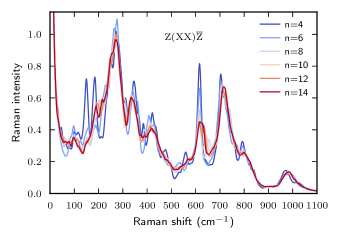
Consider first the system at room temperature (\qty300) and ambient pressure (\qty0\giga). The system is then cubic [34]. We assume that the incoming and outgoing light is polarized along the same axis and that a crystal axis is aligned with the polarization of the light. In Porto notation [38], this is denoted as Z(XX). In Fig. 1 we show the resulting Raman spectrum and its convergence as function of supercell size. It is clear that a size of at least \numproduct10x10x10 cubic primitive cells is required to obtain well converged numerical results.
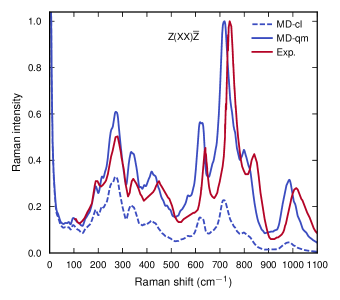
Next, we compare with the experimental data from Toulouse et al. [22]. Those data were obtained for a single crystal and the geometric setup was Z(XX). In Fig. 2 we show our MD results at \qty300 for the same geometric setup as a dashed line (denoted MD-cl). It is known that classical MD simulations underestimate the intensity of the true spectrum due to quantum effects present in the real system. Those effects can be estimated by taking quantum statistics into account [7]. (For further details, see LABEL:ssec:qunatum-correction). In the present case, first-order contributions to the intensity are absent due to the cubic symmetry of the system. Second-order contributions can either be due to overtones or the combination of two modes. It has been stated that in solids, combination modes always dominate over overtones [7]. Therefore, we restrict ourselves to combination modes and in addition we assume a combination mode that consists of the sum of two different modes but with the same frequency (i.e., with ). The correction for the classical treatment can then be written as
| (4) |
The result for is shown as a solid line (denoted MD-qm) in Fig. 2.
In the same figure we show the results from Toulouse et al. [22], also at \qty300. The absolute intensity is unknown, and we have therefore scaled the experimental data such that the height of the peak around \qty700\per\centi coincides between theory and experiments. Our simulation agree very well with the experiments. Taking the quantum statistics into account through the rescaling factor in Eq. 4 is important to obtain a qualitative agreement with experiments. A slight red shift is present in our data compared to experiments, which we attribute to the underlying exchange-correlation functional (the van-der-Waals density functional with consistent exchange [39, 40]), which is known to give slightly red-shifted vibrational frequencies for the present system (see Supp. Inf. in Ref. 34). For a similar comparison for the geometric setup Z(XY), see LABEL:sfig:classicb.
III.2 Mode decomposition at room temperature
The spectrum at \qty300 and \qty0\giga originates from higher-order Raman scattering processes and is likely dominated by second-order contributions. It is therefore tempting to try to identify the various peaks in the intensity with certain overtones and/or combination modes. This can be done by making use of the dielectric susceptibility expansion (DSE) in Eq. 3, with the atomic displacements transformed to normal mode coordinates, see App. A.
To reduce the computational effort, we restrict the computations to a \numproduct4x4x4 supercell ( atoms). The result in Fig. 1 shows that the intensity for this smaller supercell is not fully converged. Nevertheless, the result from the smaller supercell contains sharp well-defined peaks, roughly with the correct positions and intensities. Therefore, we conclude that the smaller supercell is sufficient for identifying possible overtones and/or combination modes in the spectrum.
In Fig. 3 we show the result for the Raman spectrum using the DSE to second order. The only term in the mode expansion that then contributes to the intensity in a cubic system is the one denoted by in App. A. In Fig. 3 we also show the result using the MD method for the small \numproduct4x4x4 supercell. The result is nearly identical to the result using the expansion of the dielectric susceptibility. The small difference may be due to the neglect of higher-order terms in the expansion as well as simply numerical/statistical noise. In any case, this demonstrates that the Raman spectrum is dominated by second-order scattering.
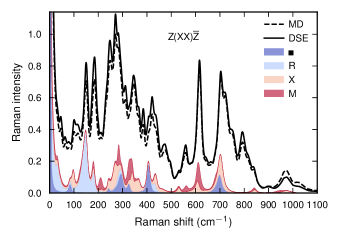
The DSE result can then be decomposed into the contribution from different -points in the Brillouin zone, in total 64 points. We set in Eq. 15 and show the results for the intensities from the four high-symmetry points , X, M, and R in Fig. 3. It is clear that the high symmetry points do not capture the full intensity of the Raman peaks. An integration over the whole Brillouin zone is necessary to obtain the features of the Raman spectrum. A similar conclusion was made in Ref. 9 for \ceNaCl.
Nevertheless, there are significant contributions to specific peaks stemming from the high symmetry points, yet not significant enough to warrant an assignment. It is clear that the R-point gives a substantial contribution to the spectrum below \qty200\per\centi. The peak at \qty620\per\centi gets contribution from both the M and X points, while the and X points contribute to the peak at \qty700\per\centi. For the frequencies between \qty200\per\centi and \qty500\per\centi the individual contribution from the high symmetry points is less clear.
III.3 Pressure dependence at room temperature
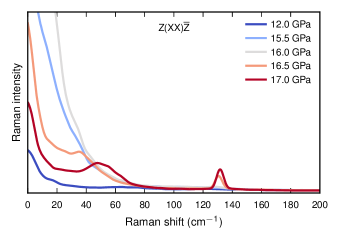
Next, we consider the pressure dependence of the Raman spectrum at room temperature (\qty300). Our system exhibits a phase transition from the cubic to the tetragonal phase at about \qty16.2\giga [34]. In our setup, the elongated axis for the tetragonal system is oriented in the z-direction.
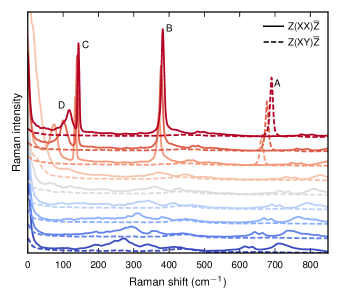
In Fig. 4 we present our result for the pressure dependence from \qtyrange024\giga. In the figure, we show the result for the setup Z(XX) and Z(XY). As we increase the pressure from \qty0\giga, the intensities of all peaks in the Raman spectrum are decreasing prior to the phase transition. Hence, our results are fully in line with the experimentally measured spectra by Chemarin et al. [26] and by Toulouse et al. [33].
As we further increase the pressure beyond the tetragonal phase transition, three distinct first order peaks appear in the spectrum. We denote these as A, B, and C (see Fig. 4 and Table 1). These modes have previously been identified experimentally by Toulouse et al. [33].
Close to, but below, the phase transition the quasi-elastic line broadens and increases substantially in intensity to a broad “central Raman peak”, which is clearly seen in Fig. 4 at \qty15\giga (see also LABEL:sfig:raman-pressurea). This behavior is reminiscent of the over-damped tilt-mode visible in the dynamical structure factor of BZO close to the phase transition [34].
| A | B1 | B2 | C1 | C2 | D | E | |
|---|---|---|---|---|---|---|---|
| Frequency (\unit\per\centi) | 677 | 378 | 369 | 139 | 136 | 103 | 64 |
| Damping (\unit\per\centi) | 9.1 | 10.2 | 12.0 | 5.4 | 5.8 | 27.8 | 20.5 |
| Slope (\unit\per\centi/GPa) | 4.7 | 1.8 | 0.8 | 1.6 | 1.2 | 7.0 | 2.8 |
| Visibility | Z(XY) | Z(XX) | Y(XZ) | Z(XX) | Y(XZ) | Z(XX) | Y(XZ) |
| Z(YY) | X(YZ) | ||||||
| Y(ZZ) | |||||||
| Raman lineshape | xyxy | xxxx | xzxz | xxxx | xzxz | xxxx,yyyy | xzxz,yzyz,zzzz |
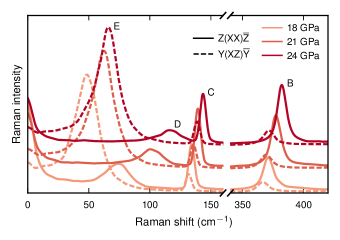
The high frequency A mode corresponds to Jahn-Teller-like distortions of oxygen octahedra [33]. Its pressure dependence is significant with a slope of about \qty4.7\per\centi\per\giga and it is only present in the polarization setup Z(XY). The intensity is initially quite small, compared with mode B and C, but its intensity increases more with increasing pressure compared with B and C. This mode, A, is clearly visible in Chemarin et al. [26] and also in Gim et al. [32], albeit less pronounced. The pressure dependence of the peak position is similar in these two experimental studies and in line with what we find here. In Ref. 33 the mode is very faint and the authors state that this is most likely a consequence of the experimental setup and related to the orientation of the single crystal.
The two other peaks, B and C, both consist of two closely overlapping bands stemming from the lifting of degenerate modes in the cubic cell (see Fig. 5). A large peak is visible in Z(XX) and a smaller peak is visible in Y(XZ), and where the smaller peak has a slightly lower frequency. The B mode is due to oxygen octahedra shearing modes and the C mode to antiparallel barium motion [33]. The splitting of the B mode is visible in spectra of Chemarin et al. [26] and Gim et al. [32], but only at considerably higher pressures than the phase transition pressure. Therefore, they both concluded that a second phase transition occurs. Here we show that the splitting is present already at the phase transition to the tetragonal phase and no further phase transition occurs. Toulouse et al. [33] could not resolve any splitting for the B mode but noted that the C mode has an asymmetric profile at higher pressure, which may indicate the presence of two closely overlapping bands.
The Raman spectrum also contains two soft modes, here denoted D and E, and visible in the setup Z(XX) and Y(XZ), respectively. They are due to the tilt mode of the octahedra and, in particular, the position of the D mode shows a strong dependence on the pressure. Both Gim et al. [32] and Toulouse et al. [33] detected these two modes. They also found that the mode with higher frequency (the D-mode) shows a stronger pressure dependence. In the study by Toulouse et al. [33] the soft mode with lower frequency (the E-mode) is lost in the quasi-elastic line at low pressures.
III.4 Phase transition
The phase transition from the cubic to the tetragonal phase is driven by tilting of the \ceZrO6 octahedra [34, 42, 43, 44, 45]. The corresponding phonon mode is located at the R-point in the phonon dispersion relation for the cubic structure. It is therefore instructive to consider the dynamical behavior of the phonon mode coordinate for the R-tilt mode. The latter can be obtained from MD simulations by projecting the atomic displacements on the supercell eigenvector, as done in Ref. [34],
| (5) |
where is the supercell eigenvector for a given mode . In the cubic phase, the mode exhibits threefold degeneracy along the Cartesian directions, while in the tetragonal phase, this degeneracy is broken, making the z-direction symmetrically distinct from the other two. We denote these directions as z and xy, respectively.
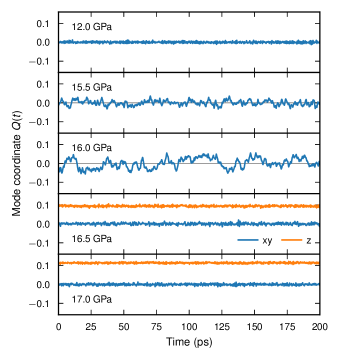
In Fig. 6 we show the time evolution of the phonon mode coordinates at five different pressures, three below the phase transition and two above. (For the time evolution at other pressures, see LABEL:sfig:modes_in_time.) At \qty12.0\giga the mode coordinate shows quite small and regular oscillations. When the pressure is increased and approaching the phase transition, the oscillations become larger, much more irregular and the timescales of the motion slow down. Above the phase transition the oscillations again become smaller, faster and more regular and the degeneracy is broken.
Consider next the spectral properties of . Its power spectrum
| (6) |
can be determined by Fourier transforming the time-dependence of the phonon mode coordinate . This is shown in Fig. 7 and for some further pressures in LABEL:sfig:mode_powerspectrum. At \qty12.0\giga the spectrum shows a broad peak located around \qty35\per\centi. When increasing the pressure the frequency softens, the motion becomes overdamped and the spectrum instead develops a central peak, which increases in height when approaching the phase transition. Above the phase transition, where the system is tetragonal, the spectra comprise two broad peaks. These correspond to the modes here denoted D and E in the Raman spectra (Fig. 5). In addition, an intensity at low frequencies for the z-component is present, decreasing slightly when increasing the pressure. The corresponding auto-correlation function in time is shown in LABEL:sfig:mode_acfs. When approaching the phase transition from below, decays exponentially, with a decay time that approaches infinity.
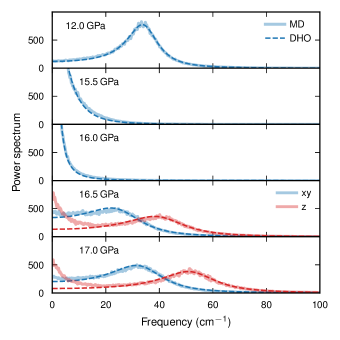
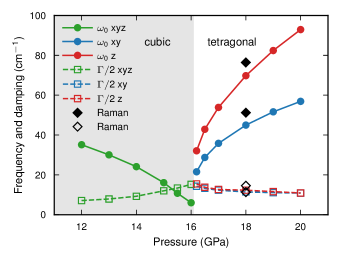
It is instructive to fit our results for the power spectrum to a damped harmonic oscillator (DHO) model (see LABEL:ssec:langevin and Refs.[46] and [41]). That model is defined by two parameters, the natural frequency and the damping . In Fig. 7 we show the fitted result as dashed lines. The obtained frequencies, , and damping , are shown in Fig. 8. The DHO model describes the spectra in Fig. 7 very well, except for the central peak observed in the tetragonal phase, mainly in the z-direction. The obtained pressure dependence on the frequency in Fig. 8 indicates a continuous phase transition. However, we note that close to a continuous phase transition, both the length and timescale of the tilt mode diverges, rendering it difficult to converge the power spectra and thus leading to larger uncertainties close to the phase transition [46].
In the tetragonal phase, the power spectrum in the z-direction shows both a broad peak at a finite frequency, an oscillatory peak, and an increased intensity at low frequencies, a central peak. A central peak appears in the spectrum when the damping is large, , while an oscillatory peak appears when the damping is small, . From symmetry, we expect the potential energy function for the phonon mode coordinate in the z-direction to be asymmetric. The damping could also vary as function of distance. In LABEL:ssec:langevin we show that a harmonic well with distance dependent damping can show a power spectrum with both an oscillatory peak and a central peak. The same qualitative behaviour can also be obtained using an asymmetric Morse potential together a constant, distance-independent damping. For further details, see LABEL:ssec:langevin.
Let us now consider the Raman spectra in Fig. 4. As already stated, close to, but below the phase transition the quasi-elastic line broadens and increases substantially in intensity to a broad “central Raman peak” (see Fig. 4 and LABEL:sfig:raman-pressurea). At \qty15\giga the intensity increases rapidly for frequencies below . This is the most apparent signature of the onset of the phase transition. The emergence of such a “central Raman peak” has been discussed for other perovskite materials [47, 48, 49, 50, 17, 51]. In the case of BZO, we find here that the emergence of the “central Raman peak” is due to the overdamped behavior of the tilt mode close to, but below, the phase transition.
In Fig. 9 we show the behavior of the Raman intensity around the phase transition temperature in more detail (see also LABEL:sfig:raman-pressureb). In the cubic phase the peak grows substantially close to the phase transition, similar to the overdamped power spectra in Fig. 7, despite that first-order scattering is forbidden in a cubic crystal. However, second order scattering can be obtained with Eq. 12 together with Wick’s theorem in Eq. 18, where the overtone of the tilt mode is given as a convolution of its own power spectral density. Notably, there is an asymmetry in the phase transition, i.e., the pronounced central peak is only present in the cubic phase. This is due to that the tilt mode quickly stiffens with pressure, and the mode becomes underdamped.
It is interesting to compare the low frequency dynamics of BZO, an oxide perovskite, with the halide perovskites, which often exhibit a low-frequency Raman response, and thus a central Raman peak. While the origin of this peak has been discussed extensively [47, 48, 49, 50, 17, 51], no consensus has yet been reached. However, also for the halide perovskites the central Raman peak can be understood from heavily overdamped tilt-modes that give rise to correlations on a very long time-scale and hence a narrow central Raman peak in the spectrum [46]. Halide perovskites are often softer compared to the oxide perovskites and the effect is therefore more pronounced in the halide perovskites, but here we show that a central Raman peak can also appear in a “hard” oxide perovskite close to a phase transition.
IV Conclusions
We have computationally determined the Raman spectrum for BZO by directly evaluating the dynamic auto-correlation function of the dielectric susceptibility tensor of the system using classical MD simulations. To this end, we have used machine-learned models from the literature for the potential energy surface [34] as well as for the dielectric susceptibility tensor [16].
It has been established that at room temperature and ambient pressure BZO is cubic, indicating that the Raman spectrum should lack sharp features. Nevertheless, sharp features reminiscent of first-order scattering have been observed experimentally. We also observe such features in our simulations and when correcting for the classical sampling in our approach, the simulated and experimental spectra are in excellent agreement. The slight redshift of our spectrum can be attributed to the exchange-correlation functional used for the construction of the potential energy model, which is known to yield a slightly to soft response. We can therefore conclude that the sharp features present in the experimental spectrum are due to higher-order scattering processes.
We have also determined the Raman spectrum by expanding the dielectric susceptibility tensor in terms of the phonon mode coordinates. As we find that an expansion to second order gives almost indistinguishable results compared to the full model, we can conclude that the scattering is dominated by second-order effects. The DSE then allows one to disentangle the contributions from different points in the Brillouin zone. There are significant contributions to specific peaks stemming from the high symmetry points, but not significant enough to warrant any assignment. Therefore, it becomes important to account for all points in the Brillouin zone to correctly capture the full Raman spectrum.
When the pressure is increased, the intensity of the peaks in the cubic structure is reduced, which is in line with experiments. In light of this finding and based on our previous study [34], we find no evidence of nanodomains as suggested by Chemarin et al. [26].
Additionally, slightly below the phase transition pressure, a broad central peak appears which is reminiscent of the behavior of the overdamped tilt-mode, which is a strong indication of the phase transition [34, 46]. Such a broad “central Raman peak” has been extensively discussed in connection to halide perovskites [51]. Here, we show that it can also be present in a “hard” oxide perovskite, and it originates from the highly overdamped R-tilt mode in the cubic structure.
Above the phase transition pressure, in the tetragonal phase, all first order Raman active peaks are identified. Furthermore, we note that the splitting of the peaks at higher pressure seen experimentally [26, 32, 33], is not due to a second phase transition. Instead, this splitting is caused by the slightly different pressure dependence of the underlying phonon modes, and thus, the difference in frequency between the two modes increases as we increase the pressure. Our simulation solidifies the analysis of Toulouse et al. [33] of the Raman spectrum in the tetragonal cell; there is only one phase transition for BZO, at least up to \qty45\giga.
The present study shows that Raman spectra computed by MD simulations with machine-learned models for potential energy and dielectric susceptibility can provide detailed and crucial information about the dynamics of the lattice vibrations and their impact on the Raman spectrum.
V Acknowledgments
Funding from the Swedish Energy Agency (grant No. 45410-1), the Swedish Research Council (Nos. 2018-06482, 2020-04935 and 2021-05072) and the Excellence Initiative Nano at Chalmers is gratefully acknowledged. The computations were enabled by resources provided by the National Academic Infrastructure for Supercomputing in Sweden (NAISS) at C3SE, NSC, and PDC partially funded by the Swedish Research Council through grant agreements no. 2022-06725 and no. 2018-05973 as well as the Berzelius resource provided by the Knut and Alice Wallenberg Foundation at NSC. Computational resources provided by Chalmers e-commons are also acknowledged.
Appendix A Mode decomposition
A.1 Dielectric susceptibility expansion (DSE)
Start by expressing the displacements in Eq. 3 in terms of phonon operators according to
| (7) |
with,
| (8) |
| (9) |
where is the mass of atom , its equilibrium position in the supercell and is the number of unit cells. Latin letters denote atoms in the supercell and Greek letters indicate a Cartesian direction. Further, is the phonon frequency, the phonon eigenvector, and and are the creation and annihilation operators. is used to denote a point in the first Brillouin zone and the corresponding branch index.
The reformulation of the atomic displacements in terms of phonon mode coordinates allows us to rewrite the Taylor expansion of the dielectric susceptibility in Eq. 3 in terms of phonon mode coordinates [7, 52, 35],
| (10) |
where is the Raman tensor for the respective order. The restriction imposed by the two -functions in Eq. 10 is a consequence of the invariance of the crystal against a rigid body translation.
The Raman tensor for the first and second order is then given by,
As we note in subsection II.1, the first order derivative with respect to atomic displacements is zero for a cubic system, therefore, the first order Raman intensities expressed in phonon coordinates will consequentially also be zero.
Inserting the expansion of the dielectric susceptibility, Eq. 10, into the quantum mechanical expression for the Raman lineshape (cf. Eq. 2),
leads to an expansion of the lineshape in terms of Fourier transformed phonon Green’s functions and Raman intensities.
| (11) |
| (12) |
| (13) |
The phonon Green’s functions in the time domain are defined as,
| (14) |
| (15) |
| (16) |
| (17) |
where and , i.e., this is the phonon displacement operator in the Heisenberg picture.
For harmonic systems, the modes don’t mix, this means that only with and with , and is non-zero. The first term would then correspond to first order Raman scattering and the second term would be second order Raman scattering. For the second order, is referred to as overtones whereas, is referred to as combination modes. For anharmonic systems, the other terms do not necessarily vanish, instead they will contribute to the one-phonon peaks but decay rapidly away from these peaks [9].
A.2 Wick’s theorem
can be decomposed using Wick’s approximation [56],
| (18) |
This allows us to express higher order scattering in terms of convolutions of second order scattering. Notably, the same theorem can be applied to all even orders.
Appendix B Modeling details
B.1 Potential energy surface
A machine-learned potential energy surface (PES) for BZO was developed in Ref [34] using the NEP approach. It was trained from DFT data using the van der Waals density functional with consistent exchange (vdW-DF-cx) [39, 40] for the exchange-correlation effects, denoted CX. This functional gives a good balance between accuracy and computational speed. However, it consistently underestimates the vibrational frequencies at the -point with about 5% [34]. For more details and comparisons with other functionals, see Refs [24, 34]. CX was used in Ref [34] to study the structure and dynamics of BZO as function of temperature and pressure. Additionally, a phase transition from the cubic to the tetragonal structure was obtained at \qty16.2\giga at ambient temperature.
B.2 Dielectric susceptibility
To obtain the Raman spectrum in Eq. 2 a model for the dielectric susceptibility is also required. That was developed in Ref [16] by generalizing the NEP scheme to enable predictions of tensorial properties, the TNEP approach. It was based on DFT data for the relative susceptibility using the CX functional. The training structures were generated by running MD with different temperatures and pressures with the same NEP model as used in Ref [34]. Various size of the supercell were used, with the total number of atoms ranging from 5 to 40 atoms. For more details, see Ref [16].
B.3 Molecular dynamics
In the present study, MD simulations are done using the gpumd package [57] together with the NEP in Ref [34] and the TNEP in Ref [16] to obtain the correlation function in Eq. 2. In all simulations, we employ a time step of \qty1\femto. The system is equilibrated during a period of \qty100\pico in the NVT ensemble. The time-correlation functions are then sampled over \qty500\pico in the NVE ensemble, and averaged over 20 identical simulations. Lattice parameters are obtained from NPT simulations, as done in Ref. [34]. For the Raman simulation at ambient pressure (Fig. 2) we have used a supercell (13 720 atoms), while for the pressure dependent calculations (Fig. 4, 5 and 9) a supercell is used (8 640 atoms). For the R-mode calculations (Fig. 6, 7 and 8) we used a supercell (69120 atoms) .
References
- Das and Agrawal [2011] R. S. Das and Y. Agrawal, Vib. Spectrosc. 57, 163 (2011).
- Loudon [1964] R. Loudon, Advances in Physics 13, 423–482 (1964).
- Cardona [1983] M. Cardona, ed., Light Scattering in Solids I, Topics in Applied Physics, Vol. 8 (Springer, 1983).
- Porezag and Pederson [1996] D. Porezag and M. R. Pederson, Physical Review B 54, 7830–7836 (1996).
- Skelton et al. [2017] J. M. Skelton, L. A. Burton, A. J. Jackson, F. Oba, S. C. Parker, and A. Walsh, Physical Chemistry Chemical Physics 19, 12452–12465 (2017).
- Bagheri and Komsa [2023] M. Bagheri and H.-P. Komsa, Scientific Data 10, 80 (2023).
- Cardona [1982] M. Cardona, Resonance phenomena, edited by M. Cardona and G. Güntherodt, in Topics in Applied Physics, Vol. 50 (Springer, 1982).
- Cowley [1964] R. A. Cowley, Proceedings of the Physical Society 84, 281–296 (1964).
- Benshalom et al. [2022] N. Benshalom, G. Reuveni, R. Korobko, O. Yaffe, and O. Hellman, Physical Review Materials 6, 033607 (2022).
- McQuarrie [1976] D. A. McQuarrie, Statistical Mechanics (Harper & Row, 1976).
- Thomas et al. [2013] M. Thomas, M. Brehm, R. Fligg, P. Vöhringer, and B. Kirchner, Physical Chemistry Chemical Physics 15, 6608–6622 (2013).
- Putrino and Parrinello [2002] A. Putrino and M. Parrinello, Physical Review Letters 88, 176401 (2002).
- Medders and Paesani [2015] G. R. Medders and F. Paesani, Journal of Chemical Theory and Computation 11, 1145–1154 (2015).
- Sommers et al. [2020] G. M. Sommers, M. F. C. Andrade, L. Zhang, H. Wang, and R. Car, Physical Chemistry Chemical Physics 22, 10592–10602 (2020).
- Berger et al. [2023] E. Berger, Z.-P. Lv, and H.-P. Komsa, Journal of Materials Chemistry C 11, 1311–1319 (2023).
- Xu et al. [2024] N. Xu, P. Rosander, C. Schäfer, E. Lindgren, N. Österbacka, M. Fang, W. Chen, Y. He, Z. Fan, and P. Erhart, Journal of Chemical Theory and Computation 10.1021/acs.jctc.3c01343 (2024).
- Berger and Komsa [2024] E. Berger and H.-P. Komsa, Physical Review Materials 8, 043802 (2024).
- Grzechnik et al. [1997] A. Grzechnik, G. H. Wolf, and P. F. McMillan, Journal of Raman Spectroscopy 28, 885–889 (1997).
- Guennou et al. [2010] M. Guennou, P. Bouvier, J. Kreisel, and D. Machon, Physical Review B 81, 054115 (2010).
- Bartasyte et al. [2011] A. Bartasyte, S. Margueron, J. Santiso, J. Hlinka, E. Simon, I. Gregora, O. Chaix-Pluchery, J. Kreisel, C. Jimenez, F. Weiss, V. Kubilius, and A. Abrutis, Phase Transitions 84, 509–520 (2011).
- Hayashi et al. [2013] H. Hayashi, T. Nakamura, and T. Ebina, Journal of Physics and Chemistry of Solids 74, 957–962 (2013).
- Toulouse et al. [2019] C. Toulouse, D. Amoroso, C. Xin, P. Veber, M. C. Hatnean, G. Balakrishnan, M. Maglione, P. Ghosez, J. Kreisel, and M. Guennou, Physical Review B 100, 134102 (2019).
- Akbarzadeh et al. [2005] A. R. Akbarzadeh, I. Kornev, C. Malibert, L. Bellaiche, and J. M. Kiat, Physical Review B 72, 205104 (2005).
- Perrichon et al. [2020] A. Perrichon, E. Jedvik Granhed, G. Romanelli, A. Piovano, A. Lindman, P. Hyldgaard, G. Wahnström, and M. Karlsson, Chemistry of Materials 32, 2824–2835 (2020).
- Rosander et al. [2023] P. Rosander, E. Fransson, C. Milesi-Brault, C. Toulouse, F. Bourdarot, A. Piovano, A. Bossak, M. Guennou, and G. Wahnström, Physical Review B 108, 014309 (2023).
- Chemarin et al. [2000] C. Chemarin, N. Rosman, T. Pagnier, and G. Lucazeau, Journal of Solid State Chemistry 149, 298–307 (2000).
- Colomban and Slodczyk [2009] P. Colomban and A. Slodczyk, Acta Physica Polonica A 116, 7–12 (2009).
- Karlsson et al. [2008] M. Karlsson, A. Matic, C. S. Knee, I. Ahmed, S. G. Eriksson, and L. Börjesson, Chemistry of Materials 20, 3480–3486 (2008).
- Giannici et al. [2011] F. Giannici, M. Shirpour, A. Longo, A. Martorana, R. Merkle, and J. Maier, Chemistry of Materials 23, 2994–3002 (2011).
- Charrier-Cougoulic et al. [1999] I. Charrier-Cougoulic, T. Pagnier, and G. Lucazeau, Journal of Solid State Chemistry 142, 220–227 (1999).
- Helal et al. [2016] M. A. Helal, T. Mori, and S. Kojima, Ferroelectrics 499, 107–114 (2016).
- Gim et al. [2022] D.-H. Gim, Y. Sur, Y. H. Lee, J. H. Lee, S. Moon, Y. S. Oh, and K. H. Kim, Materials 15, 4286 (2022).
- Toulouse et al. [2022] C. Toulouse, D. Amoroso, R. Oliva, C. Xin, P. Bouvier, P. Fertey, P. Veber, M. Maglione, P. Ghosez, J. Kreisel, and M. Guennou, Physical Review B 106, 064105 (2022).
- Fransson et al. [2024] E. Fransson, P. Rosander, P. Erhart, and G. Wahnström, Chemistry of Materials 36, 514 (2024).
- Born and Huang [1954] M. Born and K. Huang, Dynamical theory of crystal lattices, International series of monographs on physics (Clarendon Press, 1954).
- Baroni and Resta [1986] S. Baroni and R. Resta, Physical Review B 33, 7017–7021 (1986).
- Gonze and Lee [1997] X. Gonze and C. Lee, Physical Review B 55, 10355–10368 (1997).
- Por [2024] Bilbao crystallographic server, Raman scattering Porto’s notation (2024), accessed: 2024-07-05.
- Dion et al. [2004] M. Dion, H. Rydberg, E. Schröder, D. C. Langreth, and B. I. Lundqvist, Physical Review Letters 92, 246401 (2004).
- Berland and Hyldgaard [2014] K. Berland and P. Hyldgaard, Physical Review B 89, 035412 (2014).
- Fransson et al. [2021] E. Fransson, M. Slabanja, P. Erhart, and G. Wahnström, Advanced Theory and Simulations 4, 2000240 (2021).
- Samara et al. [1975] G. A. Samara, T. Sakudo, and K. Yoshimitsu, Phys. Rev. Lett. 35, 1767 (1975).
- Megaw [1971] H. D. Megaw, Materials Research Bulletin 6, 1007 (1971).
- Angel et al. [2005] R. J. Angel, J. Zhao, and N. L. Ross, Phys. Rev. Lett. 95, 025503 (2005).
- Tohei et al. [2005] T. Tohei, A. Kuwabara, T. Yamamoto, F. Oba, and I. Tanaka, Phys. Rev. Lett. 94, 035502 (2005).
- Fransson et al. [2023] E. Fransson, P. Rosander, F. Eriksson, J. M. Rahm, T. Tadano, and P. Erhart, Communications Physics 6, 1–7 (2023).
- Yaffe et al. [2017] O. Yaffe, Y. Guo, L. Z. Tan, D. A. Egger, T. Hull, C. C. Stoumpos, F. Zheng, T. F. Heinz, L. Kronik, M. G. Kanatzidis, J. S. Owen, A. M. Rappe, M. A. Pimenta, and L. E. Brus, Physical Review Letters 118, 136001 (2017).
- Seiler et al. [2019] H. Seiler, S. Palato, C. Sonnichsen, H. Baker, E. Socie, D. P. Strandell, and P. Kambhampati, Nature Communications 10, 4962 (2019).
- Gao et al. [2021] L. Gao, L. Yadgarov, R. Sharma, R. Korobko, K. M. McCall, D. H. Fabini, C. C. Stoumpos, M. G. Kanatzidis, A. M. Rappe, and O. Yaffe, Materials Advances 2, 4610–4616 (2021).
- Hehlen et al. [2022] B. Hehlen, P. Bourges, B. Rufflé, S. Clément, R. Vialla, A. C. Ferreira, C. Ecolivet, S. Paofai, S. Cordier, C. Katan, A. Létoublon, and J. Even, Physical Review B 105, 024306 (2022).
- Lim et al. [2024] V. J.-Y. Lim, M. Righetto, S. Yan, J. B. Patel, T. Siday, B. Putland, K. M. McCall, M. T. Sirtl, Y. Kominko, J. Peng, Q. Lin, T. Bein, M. Kovalenko, H. J. Snaith, M. B. Johnston, and L. M. Herz, ACS Energy Letters 9, 4127–4135 (2024).
- Weber and Merlin [2000] W. H. Weber and R. Merlin, eds., Raman Scattering in Materials Science, Springer Series in Materials Science, Vol. 42 (Springer, 2000).
- Sun et al. [2010] T. Sun, X. Shen, and P. B. Allen, Physical Review B 82, 224304 (2010).
- Carreras et al. [2017] A. Carreras, A. Togo, and I. Tanaka, Computer Physics Communications 221, 221 (2017).
- Rohskopf et al. [2022] A. Rohskopf, R. Li, T. Luo, and A. Henry, Modelling and Simulation in Materials Science and Engineering 30, 045010 (2022).
- Bloch and De Dominicis [1958] C. Bloch and C. De Dominicis, Nuclear Physics 7, 459–479 (1958).
- Fan et al. [2017] Z. Fan, W. Chen, V. Vierimaa, and A. Harju, Computer Physics Communications 218, 10–16 (2017).