VisioPhysioENet: Multimodal Engagement Detection using Visual and Physiological Signals
Abstract
This paper presents VisioPhysioENet, a novel multimodal system that leverages visual cues and physiological signals to detect learner engagement. It employs a two-level approach for visual feature extraction using the Dlib library for facial landmark extraction and the OpenCV library for further estimations. This is complemented by extracting physiological signals using the plane-orthogonal-to-skin method to assess cardiovascular activity. These features are integrated using advanced machine learning classifiers, enhancing the detection of various engagement levels. We rigorously evaluate VisioPhysioENet on the DAiSEE dataset, where it achieves an accuracy of 63.09%, demonstrating a superior ability to discern various levels of engagement compared to existing methodologies. The proposed system’s code can be accessed at github.com/MIntelligence-Group/VisioPhysioENet. ††footnotetext: ∗ denotes equal contribution, # denotes corresponding author.
Index Terms:
Student Engagement Analysis, Online Learning, Multimodal Fusion, Visual Features, rPPG Signals.I Introduction
Engagement detection in educational settings is essential for optimizing learning outcomes [1]. Traditional methods, often limited by their reliance on a single data type, may not fully capture the complexities of learner engagement [2, 3]. Recent studies advocate for multimodal engagement detection, which integrates various data types to overcome the limitations of unimodal approaches [4, 5]. Although these multimodal systems combining visual and physiological signals show improved accuracy and comprehensiveness [6, 7], they still face challenges such as data imbalance and limited generalizability across different datasets [8, 9]. Additionally, most research has predominantly focused on visual data, with less emphasis on exploiting multimodality [2].
The proposed multimodal engagement detection framework, VisioPhysioENet, addresses these challenges by leveraging advanced machine learning algorithms and multimodal data integration. This ensures a balance between accuracy and computational efficiency, avoiding the complexities of deep neural architectures [10, 9]. The system employs a two-level approach for visual feature extraction: first, using Dlib [11] to extract facial landmarks, and OpenCV [12] for eye and head metrics like Eye Aspect Ratio (EAR), Pitch, Yaw, and Roll. These are transformed into numerical features and categorized into actionable classes, including eye openness, gaze direction, and head position. In parallel, remote photoplethysmography (rPPG) signals are captured through video inputs to monitor cardiovascular activity. A key innovation of our work is using rPPG to extract physiological signals non-invasively without measurement devices, offering a convenient approach to monitoring cardiovascular activity.
Transitioning from the initial processing of time-serialized signals to handling single-value data points in the final phase, VisioPhysioENet significantly reduces computational demands and enhances system robustness. This integration of visual and physiological data through advanced machine learning models, specifically multi-output classifiers, and the application of late fusion techniques ensures improved accuracy and robustness in detecting engagement levels. When rigorously evaluated on the Dataset for Affective States in E-Environments (DAiSEE) dataset, VisioPhysioENet achieves an accuracy of 63.09%, demonstrating a superior ability to discern various levels of engagement compared to existing methodologies. The major contributions of this paper are listed as follows:
-
•
Proposal of VisioPhysioENet that combines physiological information with visual data without using additional measurement devices. It is lightweight, enabling fast processing with minimal computational load.
-
•
Implementation of multimodal fusion techniques, including early and late fusion strategies, to integrate visual and physiological data for robust engagement detection.
-
•
Rigorous validation on the DAiSEE dataset, with detailed ablation studies that highlight improvements over existing methods, contributing significantly to the field.
II Related Works
The detection of learner engagement has significantly evolved, initially focusing on single data types. Abedi et al. [6] combined ResNet with temporal convolutional networks to enhance accuracy in datasets like DAiSEE. Selim et al. [7] used EfficientNet and Long Short Term Memory (LSTM) network for video data analysis but face data imbalance issue.
Physiological signal integration has been explored by Sarkar et al. [13] who used ECG data for emotion classification, and Gupta et al. [10] focused on facial cues for engagement detection. Studies by Xie et al. [8] and Mehta et al. [9] show advancements in multimodal data analysis, stressing the need for better integration techniques in real-world settings.
Contributions from Vedernikov et al. [14] and Dubbaka et al. [15] have refined architectures for diverse settings. Work by Copur et al. [16] and Singh et al. [17] expand engagement detection into informal and digital environments, while Sherly et al. [18], Hasnine et al. [19], and Sharma et al. [20] have integrated various machine learning models to enrich the field.
Chen et al. [3] and Lee et al. [21] addressed real-time challenges in engagement systems, focusing on robustness under varied conditions. Gupta et al. [22] provided real-time deep learning solutions. Efforts by Yang et al. [23] and Liao et al. [24], along with the work by Savchenko et al. [25] and Abedi et al. [26], demonstrate the necessity for systems like VisioPhysioENet to effectively synthesize visual and physiological data for nuanced behaviour analysis.
Building on these insights, our research addresses critical gaps by implementing a novel multimodal engagement detection system, VisioPhysioENet, which is lightweight and enables faster processing with minimal computational overhead. Our approach incorporates advanced multimodal fusion techniques, including early and late fusion strategies, significantly enhancing robustness and accuracy in engagement detection across diverse educational settings.
III VisioPhysioENet
The architecture of the proposed system, VisioPhysioENet, is shown in Fig. 1 and described below.
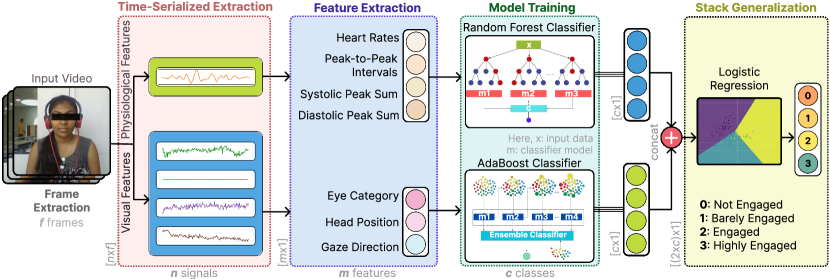
III-A Visual Feature Extraction Phase
The visual feature extraction model operates at two levels, denoted as , to extract features from videos () by processing frames () sequentially. The first level, , involves extracting direct features as facial landmarks ( to ) including eye metrics points () and head position estimation points (). These features are identified using the 68-FLM landmarks detection model provided by the Dlib library.
| (1) |
The also involves extracting numerical features from Eq (1)’s data. This includes the Eye Aspect Ratio () and parameters related to the position of the head , such as pitch , yaw , and roll . The EAR () is calculated using the facial landmark points of both the left () and right eyes (), and then their mean is taken.
| (2) |
where denotes the computation of the mean and assignment operator. For head pose () estimation, specific facial landmarks, such as nose tip, chin, corners of the eye, and mouth corners are used. The process assumes no camera distortions during focal length estimation. The rotation vector {, describing the object’s orientation relative to the camera, is computed using the solvePNP function. The OpenCV first extracts the axis ‘u’ and angle from the rotation vector {. It then constructs the skew-symmetric matrix K and calculates the R using the below formula.
| (3) |
The is converted to a rotation matrix using the Rodrigues formula.
| (4) |
The is then used to extract the euler angles, as per the standard algorithm, to obtain the values of pitch , yaw , and roll .
The next level, i.e., , involves extracting categorical variables such as eye gaze direction (), head position (), and eye openness category () from the numerical variables derived in . To calculate , the image center() and eye center () have been used, as follows:
| (5) |
The gaze direction (), computed based on the gaze vector consisting of horizontal (x) and vertical (y) components, indicates whether a person is looking left, right, up, down, or forward based on its values. , computed based on , and , has 7 classes, including neutral, tilted, or turned in various directions. Eye openness (), measured by EAR (), is categorized into three classes: fully open, partially closed, and closed. All categorical variables depend on thresholds, which were determined experimentally for each variable.
III-B Physiological Feature Extraction Phase
The second phase of feature extraction focuses on extracting the Blood Volume Pulse (BVP) signal from video frames to reflect cardiovascular activity using the Plane-Orthogonal-to-Skin (POS) method, a non-invasive technique for rPPG. This method capitalizes on subtle skin colour changes caused by blood flow to estimate the BVP signal.
The denotes the first level in extracting physiological features, which begins with extracting signals () by calculating the average RGB values from a specified region of interest (ROI) i.e. forehead for the proposed model in each video frame.
| (6) |
where and are the RGB values from the region of interest in the video frame, and N is the total number of pixels in the . Then, temporal normalization is applied to the RGB values by dividing each colour signal by its mean over a specific time window. This transformation emphasizes the pulsatile component, primarily captured in the green channel, which is most sensitive to blood flow changes.
In the next step, refinement is performed by tuning the signal components based on their standard deviation (). This step enhances the accuracy of the BVP signal by minimizing noise and artifacts, such as motion or lighting changes. The refined signals are calculated as:
| (7) |
To effectively apply the POS algorithm, we first need to identify the Region of Interest (ROI) i.e. (). Finally, to extract the BVP () signal, the POS algorithm has been applied to the extracted .
| (8) |
After obtaining the BVP signal from , further in analysis is conducted to extract more physiological features. Then the BVP signal is detrended to remove long-term trends and, a band-pass filter is applied to isolate the heart rate frequency components from the .
| (9) |
where is the original BVP signal, and is the detrended signal. denotes the band-pass filter, and is the filtered signal.
To calculate the interval, analysis has been done to identify peaks representing heartbeats . From the mean value , heart rate in beats per minute (BPM) is given by:
| (10) |
Some more features in , like average Peak-to-Peak Interval to assess heart rhythm regularity, are calculated as follows:
| (11) |
Similarly, from , the cumulative sums of systolic and diastolic peaks are extracted. The average heart rate over the entire signal duration is computed, and overall heart rate trends are summarized based on the BVP signal.
| (12) |
where is the mean RR interval over the entire recording period. is the instantaneous heart rate at time , and is the total duration of the signal.
III-C Multimodal Fusion Phase
In our proposed architecture, we implement a Late Fusion strategy to effectively integrate Visual and Physiological features for enhanced classification performance. The visual features extracted in section III-A are processed using AdaBoost Classifier, to compute the probability distribution, .
| (13) |
On the other hand, the Physiological features from computed in section III-B are used for assessing the subject’s physiological responses using a Random Forest Classifier.
| (14) |
In the final stage, a Late Fusion technique using stacked generalization combines the probabilities and using a meta-classifier (logistic regression), producing the final classification.
| (15) |
IV Experimental results
IV-A Setup
IV-A1 Dataset and Implementation
The proposed system was evaluated using the train and test subsets from the DaiSEE dataset [27], which includes 9,068 videos from 112 adults, annotated by human experts. The model training used an 80-20 split and 10-fold cross-validation, conducted on an Intel(R) Core(TM) i7-7700, 3.70 GHz and Nvidia RTX 2070 GPU.
IV-A2 Models
We developed three baseline models to determine the proposed system’s architecture, which is also guided by the ablation studies in Section IV-D. Baseline 1 utilized visual features such as eye category, head position, and eye gaze direction; Baseline 2 employed rPPG physiological signals; and Baseline 3 integrated both modalities via early fusion whereas the proposed system integrates them using late fusion.
IV-B Quantitative Results
The performance of our proposed method is detailed in Table I, where it outperforms state-of-the-art approaches, including the approach by Vedernikov et al. [28] that utilizes both visual and physiological modalities.
| Model | Modality | Acc |
| InceptionNet Video Level [27] | V | 46.40% |
| InceptionNet Frame Level [27] | V | 47.10% |
| Class-Balanced 3D CNN [29] | V | 52.35% |
| ResNet + Temporal Conv Net [6] | V | 53.70% |
| Unsupervised Behavior & rPPG [28] | V+P | 54.49% |
| Long-Term Recurrent Conv Net [27] | V | 57.90% |
| Deep Spatiotemporal Net [24] | V | 58.84% |
| 3DCNN + TCN [6] | V | 59.97% |
| ResNet + LSTM[6] | V | 61.15% |
| \hdashlineProposed | V+P | 63.09% |
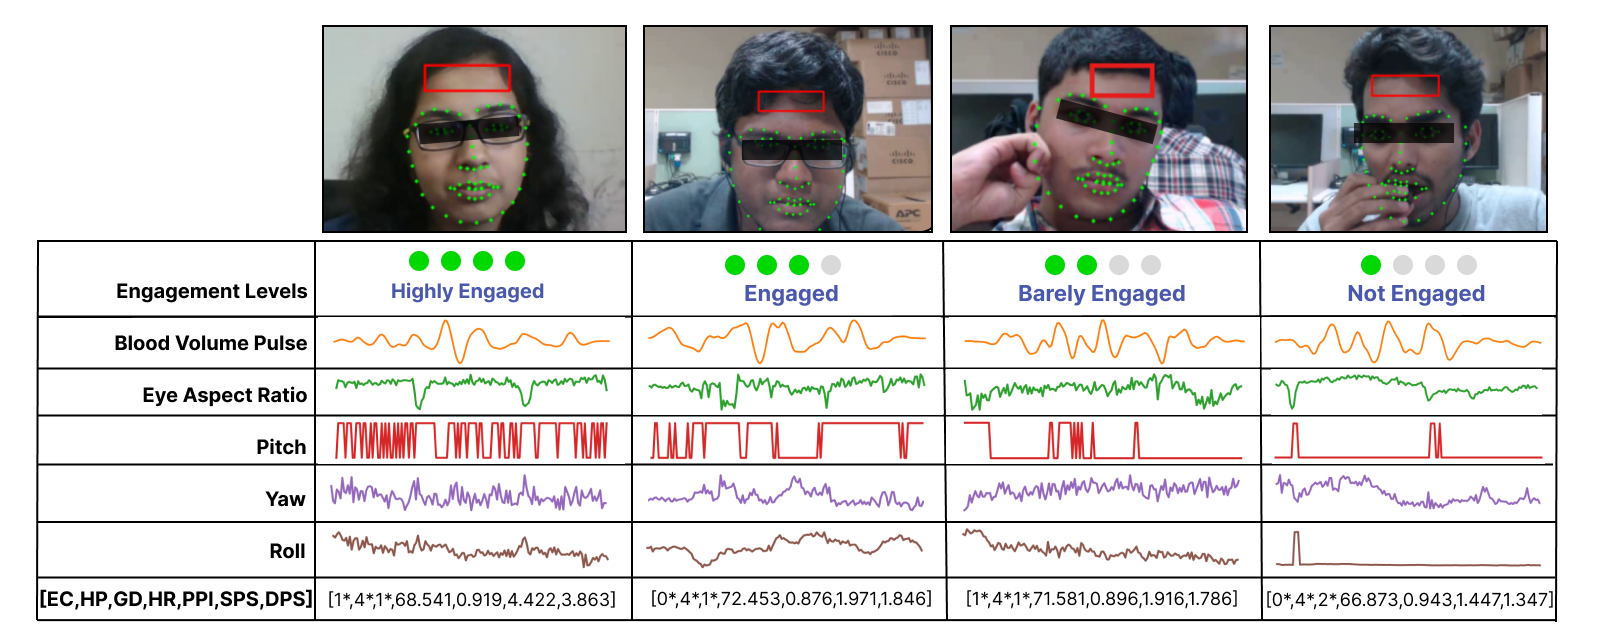
IV-C Qualitative Results
Fig. 2 shows sample results. Visual metric head position is influenced by pitch, yaw, and roll; eye gaze direction from landmarks and eye openness category from EAR. Physiological metrics, derived from the BVP signal, include HR and P2P interval, where crests and troughs indicate systolic and diastolic peaks.
IV-D Ablation Studies
IV-D1 Choice of Appropriate Fusion Approach
Table II showcases our fusion approach’s impact. Stacked generalization incorporates error correction from both AdaBoost and Random Forest while enhancing robustness through logistic regression as the meta-classifier. The late fusion improves engagement prediction accuracy to 63.09%, outperforming all baselines.
| Model | Modality | Fusion Strategy | Acc | |
| Baseline 1 | V | – | 43.03% | |
| Baseline 2 | P | – | 55.25% | |
| Baseline 3 | V+P | Early Fusion | 51.50% | |
| \hdashlineProposed | V+P | Late Fusion | 63.09% |
IV-D2 Computational requirements analysis
Sequential task execution leads to idle processor time. To improve efficiency, we used ThreadPoolExecutor, allowing tasks to run in parallel across multiple threads while optimizing CPU usage. Table III highlights the performance gains from parallel processing compared to sequential methods.
| Batch Size | 1 | 2 | 4 | 8 | 16 | 32 | 64 |
| ST | 7.4s | 14.1s | 27.2s | 55.8s | 109.7s | 255.6s | 732.6s |
| TPE Time | 7.0s | 8.8s | 12.4s | 21.9s | 44.9s | 100.0s | 293.0s |
V Conclusion
In this work, VisioPhysioENet, a multimodal system combining visual cues and physiological signals to detect learner engagement, has been introduced. With its lightweight design and real-time processing, VisioPhysioENet achieved 63.09% accuracy on the DAiSEE dataset, surpassing state-of-the-art methods. It balances accuracy with efficiency, using feature estimation methods provided by Dlib and OpenCV for visual features, and the POS method for physiological signals, making it ideal for real-time use. However, the system is sensitive to environmental changes and needs more testing in natural settings. Future work will enhance scalability, add modalities, and refine it for varied educational contexts, focusing on real-world adaptability.
References
- [1] I. Alkabbany, A. Ali, A. Farag, I. Bennett, M. Ghanoum, and A. Farag, “Measuring student engagement level using facial information,” in 2019 IEEE International Conference on Image Processing (ICIP). IEEE, 2019, pp. 3337–3341.
- [2] P. Kumar, A. Vedernikov, and X. Li, “Measuring Non-Typical Emotions for Mental Health: A Survey of Computational Approaches,” arXiv preprint arXiv:2403.08824, 2024, Accessed on 30.08.2024.
- [3] X. Chen, L. Niu, A. Veeraraghavan, and A. Sabharwal, “Faceengage: Robust estimation of gameplay engagement from user-contributed (youtube) videos,” IEEE Transactions on Affective Computing, vol. 13, no. 2, pp. 651–665, 2019.
- [4] P. Kumar, S. Malik, B. Raman, and X. Li, “VISTANet: VIsual Spoken Textual Additive Net for Interpretable Multimodal Emotion Recognition,” arXiv preprint arXiv:2208.11450, pp. arXiv–2208, 2022, accessed 05 Sep 2024.
- [5] Ö. Sümer, P. Goldberg, S. D’Mello, P. Gerjets, U. Trautwein, and E. Kasneci, “Multimodal engagement analysis from facial videos in the classroom,” IEEE Transactions on Affective Computing, vol. 14, no. 2, pp. 1012–1027, 2021.
- [6] A. Abedi and S. S. Khan, “Improving State-Of-The-Art In Detecting Student Engagement With ResNet and TCN Hybrid Network,” in 2021 18th Conference on Robots and Vision (CRV). IEEE, 2021, pp. 151–157.
- [7] T. Selim, I. Elkabani, and M. A. Abdou, “Students engagement level detection in online e-learning using hybrid efficientnetb7 together with tcn, lstm, and bi-lstm,” IEEE Access, vol. 10, pp. 99 573–99 583, 2022.
- [8] N. Xie, Z. Liu, Z. Li, W. Pang, and B. Lu, “Student engagement detection in online environment using computer vision and multi-dimensional feature fusion,” Multimedia Systems, vol. 29, no. 6, pp. 3559–3577, 2023.
- [9] N. K. Mehta, S. S. Prasad, S. Saurav, R. Saini, and S. Singh, “Three-dimensional densenet self-attention neural network for automatic detection of student’s engagement,” Applied Intelligence, vol. 52, no. 12, pp. 13 803–13 823, 2022.
- [10] S. Gupta, P. Kumar, and R. Tekchandani, “A multimodal facial cues based engagement detection system in e-learning context using deep learning approach,” Multimedia Tools and Applications, vol. 82, no. 18, pp. 28 589–28 615, 2023.
- [11] D. E. King. (2016) DLIB Models. https://github.com/davisking/dlib-models. Accessed on 30.08.2024.
- [12] G. Bradski, “Opencv (open source computer vision library),” 1999.
- [13] P. Sarkar and A. Etemad, “Self-supervised ecg representation learning for emotion recognition,” IEEE Transactions on Affective Computing, vol. 13, no. 3, pp. 1541–1554, 2020.
- [14] A. Vedernikov, P. Kumar, H. Chen, T. Seppänen, and X. Li, “Tcct-net: Two-stream network architecture for fast and efficient engagement estimation via behavioral feature signals,” in Proceedings of the IEEE/CVF Conference on Computer Vision and Pattern Recognition (CVPR), 2024, pp. 4723–4732.
- [15] A. Dubbaka and A. Gopalan, “Detecting learner engagement in moocs using automatic facial expression recognition,” in 2020 IEEE Global Engineering Education Conference (EDUCON). IEEE, 2020, pp. 447–456.
- [16] O. Copur, M. Nakıp, S. Scardapane, and J. Slowack, “Engagement detection with multi-task training in e-learning environments,” in International Conference on Image Analysis and Processing. Springer, 2022, pp. 411–422.
- [17] M. Singh, X. Hoque, D. Zeng, Y. Wang, K. Ikeda, and A. Dhall, “Do i have your attention: A large scale engagement prediction dataset and baselines,” in Proceedings of the 25th International Conference on Multimodal Interaction, 2023, pp. 174–182.
- [18] E. Sherly et al., “Fostering learning with facial insights: Geometrical approach to real-time learner engagement detection,” in 2024 IEEE 9th International Conference for Convergence in Technology (I2CT). IEEE, 2024, pp. 1–6.
- [19] M. N. Hasnine, H. T. Bui, T. T. T. Tran, H. T. Nguyen, G. Akçapınar, and H. Ueda, “Students’ emotion extraction and visualization for engagement detection in online learning,” Procedia Computer Science, vol. 192, pp. 3423–3431, 2021.
- [20] P. Sharma, S. Joshi, S. Gautam, S. Maharjan, S. R. Khanal, M. C. Reis, J. Barroso, and V. M. de Jesus Filipe, “Student engagement detection using emotion analysis, eye tracking and head movement with machine learning,” in International Conference on Technology and Innovation in Learning, Teaching and Education. Springer, 2022, pp. 52–68.
- [21] T. Lee, D. Kim, S. Park, D. Kim, and S.-J. Lee, “Predicting mind-wandering with facial videos in online lectures,” in Proceedings of the IEEE/CVF Conference on Computer Vision and Pattern Recognition, 2022, pp. 2104–2113.
- [22] S. Gupta, P. Kumar, and R. K. Tekchandani, “Facial emotion recognition based real-time learner engagement detection system in online learning context using deep learning models,” Multimedia Tools and Applications, vol. 82, no. 8, pp. 11 365–11 394, 2023.
- [23] C. Yang, K. Wang, P. Q. Chen, M. M. Cheung, Y. Zhang, E. Y. Fu, and G. Ngai, “Multimediate 2023: Engagement level detection using audio and video features,” in Proceedings of the 31st ACM International Conference on Multimedia, 2023, pp. 9601–9605.
- [24] J. Liao, Y. Liang et al., “Deep Facial Spatiotemporal Network for Engagement Prediction in Online Learning,” Applied Intelligence, vol. 51, pp. 6609–6621, 2021.
- [25] A. V. Savchenko, L. V. Savchenko, and I. Makarov, “Classifying emotions and engagement in online learning based on a single facial expression recognition neural network,” IEEE Transactions on Affective Computing, vol. 13, no. 4, pp. 2132–2143, 2022.
- [26] A. Abedi and S. S. Khan, “Engagement measurement based on facial landmarks and spatial-temporal graph convolutional networks,” arXiv preprint arXiv:2403.17175, 2024.
- [27] A. Gupta, A. D’Cunha et al., “DAiSEE: Towards User Engagement Recognition in the Wild,” arXiv preprint arXiv:1609.01885, 2016.
- [28] A. Vedernikov, Z. Sun, V.-L. Kykyri, M. Pohjola, M. Nokia, and X. Li, “Analyzing Participants’ Engagement during Online Meetings Using Unsupervised Remote Photoplethysmography with Behavioral Features,” in Proceedings of the IEEE/CVF Conference on Computer Vision and Pattern Recognition Workshops (CVPRw), 2024, pp. 389–399.
- [29] H. Zhang, X. Xiao, T. Huang et al., “An Novel End-to-End Network for Automatic Student Engagement Recognition,” 2019, Conference paper, p. 342 – 345.